 Zengzhen Qian
 Mingqiang Sheng
 Faming Huang
 Xianlong Lu
- 1School of Engineering and Technology, China University of Geosciences, Beijing, China
- 2School of Civil Engineering and Architecture, Nanchang University, Nanchang, China
- 3China Electric Power Research Institute, Beijing, China
Comparative pullout tests were carried out on model plate anchors in uncemented aeolian sand (UAS) and cement-stabilised aeolian sand (CAS) with different embedment ratios of the embedment depth (H) to the width (D) of the plate to examine the effectiveness of the insertion of cement in aeolian sand to enhance the uplift performance of plate anchors. Experimental results demonstrated that significant increases in failure resistance and uplift stiffness can be achieved, irrespective of embedment ratios of H/D, when a relatively small amount of cement (an optimal cement content of 6% by weight of dry aeolian sand determined by direct shear test in this study) was added to the aeolian sand backfill. However, distinct load–displacement responses were observed in all the tests on the model plate anchors embedded in CAS and UAS backfills: two-phase of pre-peak and post-peak behaviour in CAS and three-phase of initial linear, nonlinear transition to peak uplift resistance, and post-peak behaviour in UAS; failure of the former started at tiny displacements and that of the latter appeared at large displacements. Therefore, the significant increases in uplift failure resistance and pre-peak uplift stiffness were limited to relatively low uplift displacements because of the brittle nature of the improved CAS backfills shear strength characteristics.
1 Introduction
Aeolian sands are fine to medium, non-plastic and uniformly graded materials in many sandy sites, mainly in desert areas, such as Xinjiang, Inner Mongolia, Ningxia, and Gansu Province in Northwest China. Electric transmission systems spanning from West to East China have been planned in recent years (Qian et al., 2014; Qian et al., 2015; Yang et al., 2019; Yang et al., 2020a; Yang et al., 2020b; Huang et al., 2020, Huang et al., 2021a, Huang et al., 2021b); therefore, foundations for four-legged lattice-type transmission towers need to be built in these aeolian sand regions. These tower foundations must resist both uplift and compression loading when subjected to permanent and transient load conditions (Pacheco et al., 2008). However, the uplift is often the controlling design load for a variety of transmission tower foundations (Kulhawy et al., 1983).
Spread foundations constructed using reinforced concrete are commonly utilised to satisfy the required uplift resistance of lattice-type tower foundations in aeolian sand regions. However, aeolian sands are inherently very low in strength and very high in compressibility because they are loose, cohesionless and easily movable. As a result, transmission tower foundations constructed in aeolian sand may become relatively costly for the required uplift stiffness and capacity. Considering the soil-improvement techniques (Elipe and López-Querol 2014), an attractive and economical solution may be achieved by the addition of cementing materials to the excavated in-situ aeolian sand for subsequent use as backfill placed above the footings to improve the uplift performances of the tower foundations.
Various methods have been used to investigate different hardening additives and their potentials as stabilising agents for aeolian sands or sandy soils (Elipe and López-Querol 2014), such as cement (Aiban 1994; Al-Aghbari and Dutta 2005), cement kiln dust (Baghdadi and Rahman 1990; Freer-Hewish et al., 1999), bentonite and lime (Panwar and Ameta 2013), and polypropylene fibers (Santoni and Webster 2001; Parto and Kalantari 2011). A few studies of spread footings embedded in cement-treated sand backfills have shown a notable increase in the compressive (Stefanoff et al., 1983; Consoli et al., 2009, 2003; Shirvani et al., 2015) and tensile (Rattley et al., 2008; Consoli et al., 2013) bearing capacity of foundations. In general, soil stabilisation with cement is an attractive technique in terms of cost and environmental impact as it avoids extracting and transporting materials from elsewhere (Shirvani et al., 2015).
In this study, experimental uplift results from 9 model tests on square model plate anchors embedded in cement-stabilised aeolian sand (CAS) are compared with those obtained from 14 model tests on square plate anchors embedded in uncemented aeolian sand (UAS) to examine the effectiveness of adding cement to increase the uplift resistance of plate anchors embedded in CAS at different embedment ratios of the embedment depth H to the width of the square plate D, H/D.
2 Brief Description of Laboratory Model Tests
This work comprises the pullout tests of model plate anchors embedded in UAS and CAS backfills. Figure 1 shows the schematic diagram of the testing apparatus. A 2.02-m-thick layer of the soil was firstly removed from the testing site, which was 3.54 m × 3.54 m in plan. After removal, a square wooden tank with an inner cross section of 3.5 m by 3.5 m and a height of 2.0 m was placed into this excavated pit, as shown in Figure 1; all the tests were conducted therein. The bottom and vertical edges of the tank were stiffened with angle steels to avoid volume changes of the container under lateral pressure, and the inner sides were finished with a coat of paint to minimize side friction.
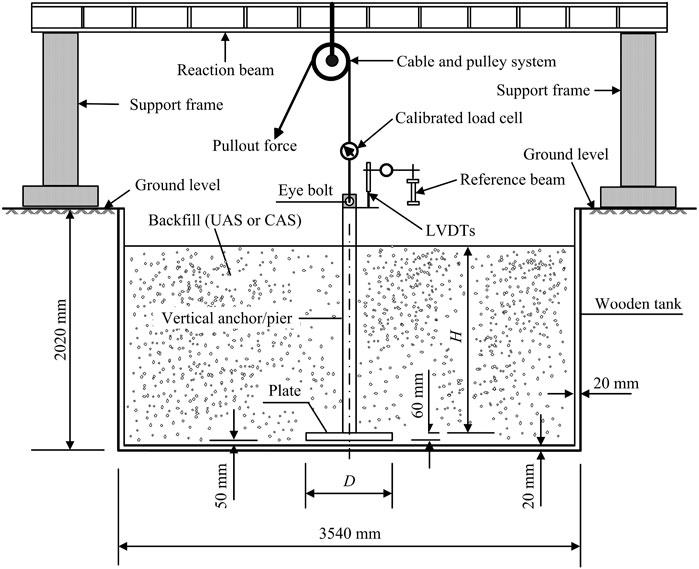
FIGURE 1. Schematic diagram of the uplift loading apparatus.
As shown in Table 1 tests were performed on model plate anchors with D = 0.1, 0.2, and 0.3 m and H/D ranging from 1.5 to 3.5 in CAS. Comparatively, 14 tests were conducted on model plate anchors with D = 0.3, 0.6, and 0.9 m and H/D ranging from 1.0 to 5.0 in UAS. All uplift model tests in this study were carried out in the same loading apparatus as shown by Figure 1. The uplift-loaded model plate anchors in cemented aeolian sand will have a larger earth cone zone or failure surface. In order to complete all the comparative pullout tests, the plan of different plate sizes and embedment depths for UAS and CAS cases has been chosen. The dimensions in Table 1 were chosen to ensure that the anticipated rupture planes around the plates would be well within the limits of the tank.
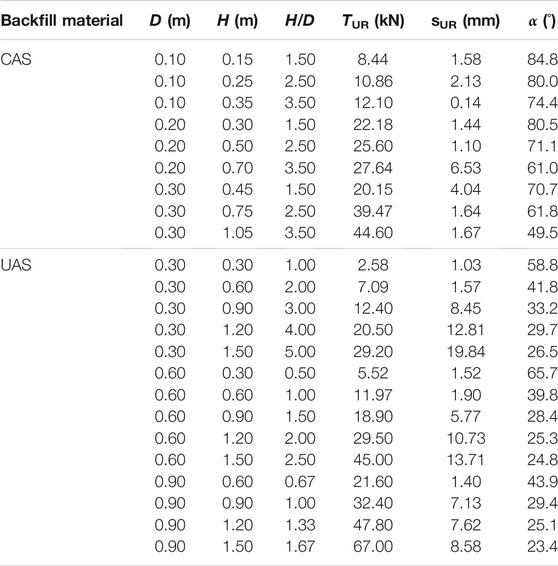
TABLE 1. Basic information and load test results for model plate anchors embedded in UAS and CAS: D = width of the square plate; H = embedment depth of the plate; H/D = embedment ratio of H to D; TUR, sUR = uplift failure resistance and the displacement at the peak point, respectively; and α = slope angle of the pyramidal failure surface to the vertical.
3 Backfills Preparation and Property
3.1 Characteristics of the Aeolian Sand in This Study
In general, researchers agree that aeolian sands consist of fine to medium grained loose sandy soil. They are poorly graded sands, with great uniformity, which can be attributed to the selective sorting of the wind (Elipe and López-Querol 2014). The aeolian sand used in this study was collected from a transmission line construction site at Dalate Banner in the Hobq Desert in the Inner Mongolia Autonomous Region, which is a typical in situ soil in Northwest China.
The particle size distribution of the aeolian sand in this study was obtained according to ASTM D422 (ASTM 2007), as shown in Figure 2. The parameters that typically describe the shape of the particle size distribution curve—D10 = 0.09 mm, D30 = 0.12 mm, D50 = 0.15 mm, and D60 = 0.17 mm—indicate that the UAS in this study can be classified as SP, i.e., poorly graded sand, according to Unified Soil Classification System ASTM D2487 (ASTM 2011a). This conclusion is consistent with that reported by Elipe and López-Querol (Elipe and López-Querol 2014).
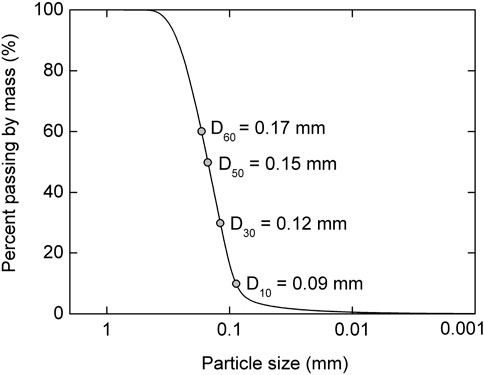
FIGURE 2. Particle size distribution of the aeolian sand.
The average specific gravity of the samples was 2.67, which is similar to the mean specific gravity values for dune sands that have been determined in many other parts of the world. For example, specific gravity values for the aeolian sand in Libya are between 2.59 and 2.70 (Khan 1982), whereas those for aeolian sand range from 2.63 to 2.67 in Qatar (Al-Ansary et al., 2012), from 2.62 to 2.75 in Kuwait (Al-Sanad et al., 1993), and from 2.67 to 2.70 in Iraq (Al-Taie et al., 2013), respectively.
3.2 Determination of the Optimal Cement Content for CAS Backfills
In most of the cases, the natural moisture content is extremely low, ranging between 0 and 4%, due to the infrequent rainfall, deep water table and high capacity of evaporation (Elipe and López-Querol 2014). As a result, in this study, the aforementioned aeolian sands were moulded to a moisture content of 3% for both UAS and CAS backfills.
The cement used in this study was ordinary Portland cement (OPC), which is widely used in China. In general, the cement requirement for low plasticity soils and sands varies from 3 to 11% by dry weight (Al-Aghbari and Dutta 2005). To determine an optimal cement content for CAS backfills, direct shear tests were carried out on specimens obtained from the CAS with cement content of 3, 6, and 9%, by dry weight of the sand. The aeolian sand with a moisture content of 3% and the required amount of OPC corresponding to different percentage of cement were mixed thoroughly to a uniform colour, respectively. The resulting mixtures were then compacted in the compaction mould and cured at room temperature. Standard loading and measuring procedures were conducted in accordance with the ASTM D3080 (ASTM 2011b) after 28 days curing time for CAS.
Each of the shearing tests was performed by preparing the specimens (20 mm in height and 61.8 mm in diameter) for the direct shear tests, applying a predetermined normal stress, pushing forward the frame of the shear box horizontally at a constant displacement rate of 0.02 mm/min, and measuring the shearing force and horizontal displacement as the specimen was sheared. Figures 3–6 show the nominal shear stress and normal displacement versus shear displacement of the specimens in direct shear tests for UAS and CAS with different cement content under different normal stresses (100 kPa, 200 kPa, 300 kPa, and 400 kPa), respectively.
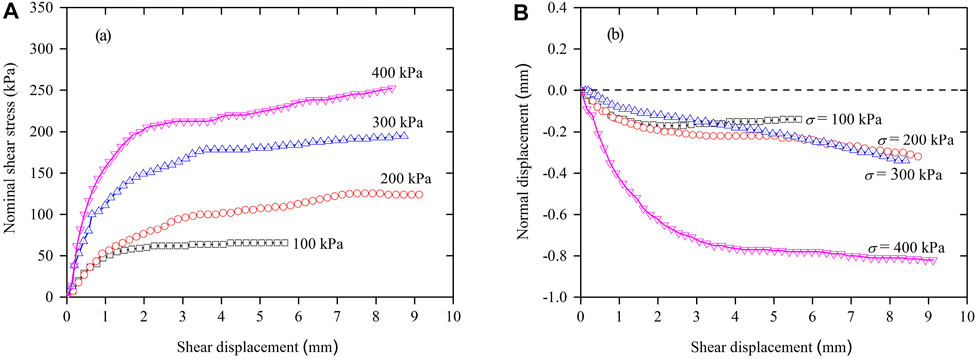
FIGURE 3. Nominal shear stress (A) and normal displacement (B) versus shear displacement of UAS with water content of 3%.
The behaviour of the UAS and CAS backfills shown in these figures can be described as follows, with attention to the influences of normal stress:
For UAS with a moisture content of 3% and a relative density Dr = 60%, all curves of the nominal shear stress versus shear displacement in Figure 3 indicate gradually hardening behaviour (showing no peak shear stress), and all normal displacements increase with shear displacement indicating shear-compression (negative normal displacement). Thus, as the normal stress increases, the shear compression will also increase. Physically, it is likely that the interaction between the sand grains is linked to the rounded surfaces, which leads to a easier slip.
For CAS with cement content of 3%, the curves of the shear stress versus shear displacement in Figure 4 show hardening-softening (showing a peak shear stress) behaviour under normal stresses of 100 and 400 kPa, but indicate gradually hardening behaviour under normal stresses of 200 kPa, 300kPa. The corresponding curves of normal displacement and shear displacement show shear-dilation (positive normal displacement) under normal stresses of 100 kPa, 200 kPa, and 300 kPa and shear-compression for higher normal stresses of 400 kPa.
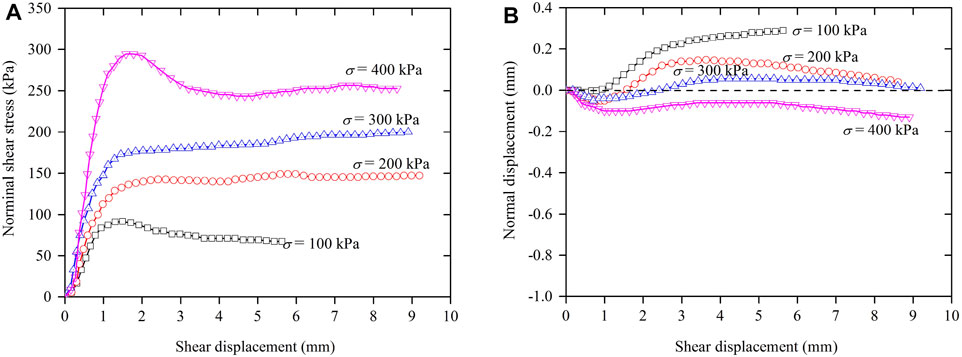
FIGURE 4. Curves of nominal shear stress (A) and normal displacement (B) versus shear displacement of CAS specimens with cement content of 3%.
For CAS with cement content of 6% as shown in Figure 5, the curves of the shear stress versus shear displacement change from hardening-softening under a normal stress of 100 kPa to gradually hardening behaviour under normal stresses of 200 kPa, 300 kPa, and 400 kPa. The corresponding curves of normal displacement and shear displacement show shear-dilation under a normal stress of 100 kPa and shear-compression for higher normal stresses of 200 kPa, 300 kPa, and 400 kPa.
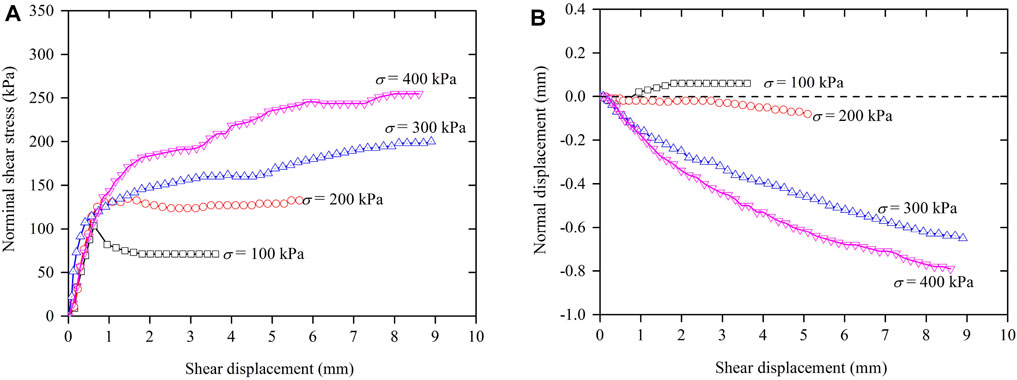
FIGURE 5. Curves of nominal shear stress (A) and normal displacement (B) versus shear displacement of CAS specimens with cement content of 6%.
For CAS with cement content of 9% as shown in Figure 6, all curves of the nominal shear stress versus shear displacement exhibit gradually hardening behaviour. All normal displacements increase with shear displacement indicating shear-compression, and as the normal stress increases, the shear dilation increases.
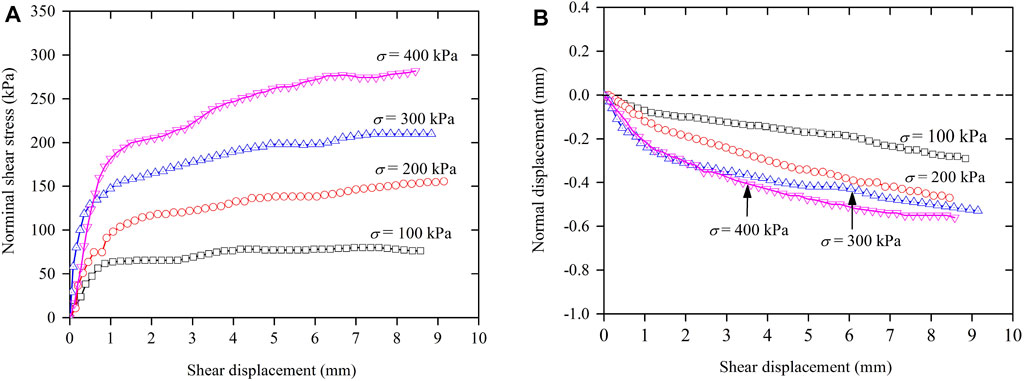
FIGURE 6. Curves of nominal shear stress (A) and normal displacement (B) versus shear displacement of CAS specimens with cement content of 9%.
In order to compare the effects of amount of cement on mechanical behaviour of CAS with cement content, shear strength parameters such as cohesion and angle of internal friction were evaluated from the tests. Using the experimental test data, the shear stress at failure was plotted against the normal stress, and a straight-line fit was used to determine the fitting parameters of angle of internal friction and cohesion. Figure 7 shows variation of shear strength parameters of angle of internal friction and cohesion with cement content, which provides a clear indication of the improved aeolian sand shear strength. However, it should be noted that the failure criterion was considered as the point at which the shear stress starts to decrease (peak shear stress) or to remain fairly constant after an amount of 4 mm in relative lateral displacement (critical shear stress), as observed in the raw test data.
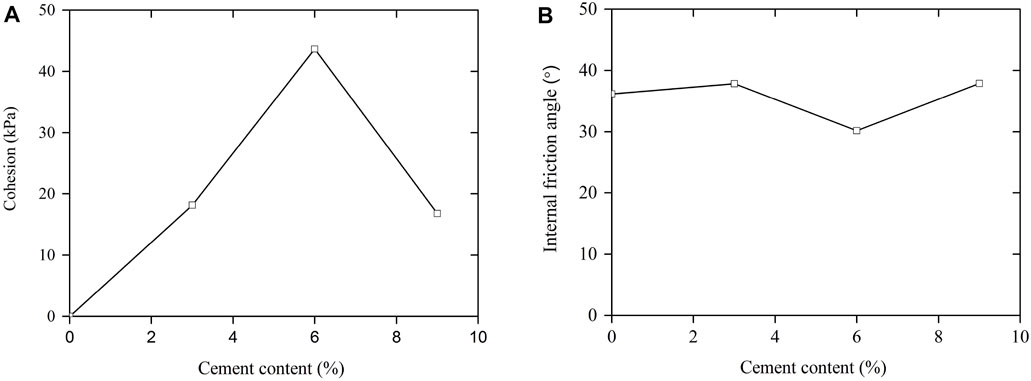
FIGURE 7. Variation of shear strength parameters with cement content: (A) Cohesion and (B) Internal friction angle.
As shown in Figure 7, the angle of internal friction for the UAS specimens was 36.1° and the cohesion was approximately zero. However, the corresponding values of the angle of internal friction and the cohesion were 37.8°, 30.2°, and 37.9°, and 18.2, 43.6, and 16.8 kPa for the CAS specimens with the cement content of 3, 6, and 9%, respectively. In general, the angles of internal friction of the UAS and CAS specimens had less dependency on the addition of cement. However, the maximum cohesion is 43.6 kPa when 6% cement was added to the aeolian sand with a moisture content of 3%. Therefore, the optimal cement content of 6% could be determined for CAS backfills in the next uplift load tests.
4 Uplift Load Testing Procedure
4.1 Backfill Controlling
All the laboratory-testing program were carried out at the apparatus in Figure 1 described previously. The UAS backfill was also moulded to a moisture content of 3% by aforementioned aeolian sand obtained in the Hobq Desert in the Inner Mongolia Autonomous Region in advance, and the CAS backfill was prepared in a rotating drum mixer by mixing the aeolian sand with a moisture content of 3% and the required amount of OPC corresponding to the optimal cement content of 6% by weight of dry aeolian sand to a uniform colour.
Appropriate trench backfill and compaction is a critical success factor for load test. Controlled pouring and tamping techniques were used in tests to obtain homogeneous UAS and CAS beds of reproducible backfill. The unit weights of the sand bed in the tests were controlled by weighing the required quantities of UAS and CAS for each layer beforehand to ensure compatibility between the backfill volume and the weight placed in the compaction pit. Bulk density tests indicated that the average unit weights were 14.5 kN/m3 and 14.7 kN/m3 for UAS and CAS backfills, respectively. Overall, the backfill control indicated a homogenous sand bed for UAS and CAS, and each of the model plate anchors was embedded in these prepared UAS and CAS backfills.
4.2 Test Method
Each of the load tests on the model plate anchors embedded in CAS was conducted after 28 days of curing time, whereas the tests on the model plate anchors in UAS did not have any curing period. All the tests were conducted with the same loading, reaction, instrumentation, and data acquisition systems.
The slowly maintained load method was adopted in all tests; that is, the uplift loading was applied in increments of 10% of the predicted ultimate load of each individual foundation, and the foundation was allowed to move under each maintained-load increment until a certain rate of displacement was achieved. Each load increment was maintained after loading until two consecutive displacements within each hour were less than 0.1 mm. Then, the next increment of load was added. This is the typical test procedure recommended by the CNS GB50007 (CNS 2011) and CLC JGJ 94 (CLC 2008). Each of the load tests was continued to the point at which failure was believed to have happened, and then, the test was halted.
5 Results and Discussion
5.1 Load–Displacement Response and Uplift Resistance Determination
In this study, the uplift load test results of all the tests in UAS and CAS backfills were discussed in terms of load–displacement curves. Figure 8 illustrates the plots that relate the applied uplift load to the pier-head vertical displacement for each of the model plate anchors.
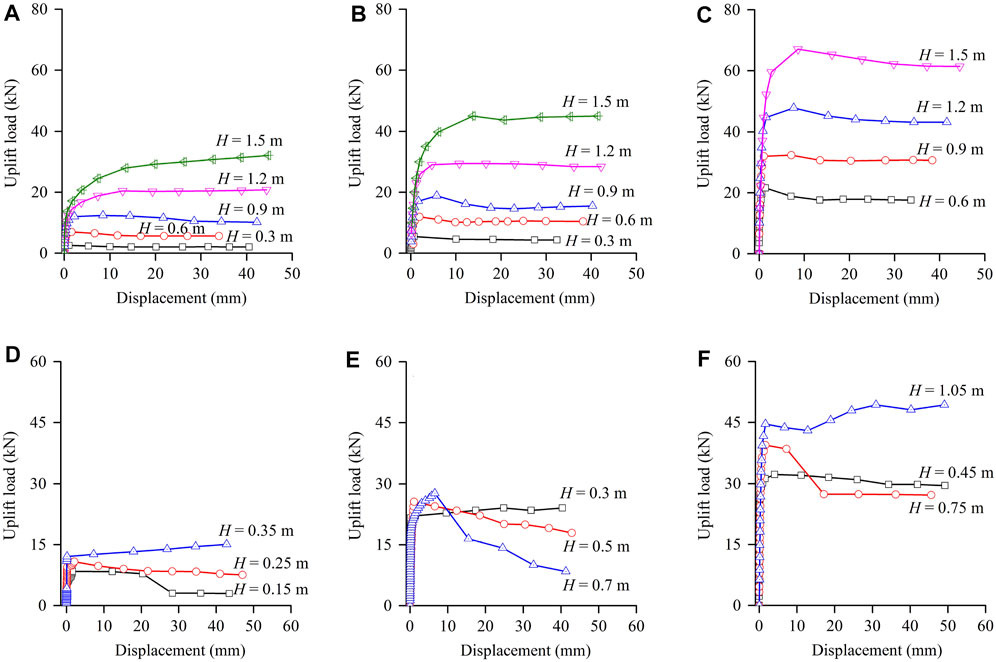
FIGURE 8. Comparison of the relationship between uplift load and displacement for model plate anchors with width of (A) D = 0.3 m; (B) D = 0.6 m; (C) D = 0.9 m in UAS and (D) D = 0.1 m; (E) D = 0.2 m; (F) D = 0.3 m in CAS.
In general, the load–displacement curves of the model plate anchors embedded in CAS differ markedly from those in UAS. As shown in Figures 8A–C, the load–displacement curves of the model plate anchors embedded in UAS generally exhibit a three-phase behaviour: 1) initial linear behaviour, which shows a gradual increase in uplift resistance; 2) nonlinear transition to peak uplift resistance behaviour; and 3) post-peak behaviour, which shows a slight, continuous decrease in resistance with larger displacement before reaching the residual phase. However, as shown in Figures 8D–F, the load–displacement curves of the model plate anchors embedded in CAS present a typical two-phase behaviour: 1) pre-peak behaviour, in which the uplift resistance increases linearly but shows only slight increases in displacement and the load-carrying capacity of the model plate anchor reaches a peak load; and 2) post-peak behaviour beyond the peak where the uplift resistance either decreases rapidly or increases slightly as the displacement increases.
It should be noted that the failure can be easily identified in all the tests on the model plate anchors embedded in UAS and CAS; the former started at large displacements and the latter appeared at tiny displacements. The uplift failure resistance at the peak point, TUR, and the corresponding displacement, sUR, for each of the load tests is summarised in Table 1.
Based on the comparisons in Figure 8, it is also clear that the initial pre-peak uplift stiffness benefits strongly from the addition of cement. This obviously highlights the effectiveness of the insertion of cement in aeolian sand for the improvement of the uplift performance of plate anchors. The addition of cement does, however, lead to a brittle load–displacement response. This phenomenon is consistent with that reported by Rattley et al. (Rattley et al., 2008). As a result, uplift resistance reduces sharply or displacement increases dramatically after the peak resistance is mobilised at an average displacement of 1.20% of the plate width, whereas the average displacement for the model plate anchors embedded in UAS is about 1.64% of the plate width. This may be related to the destruction of the cement bonds between aeolian sand grains with continued shearing (i.e., reduction in the cohesion component of shear strength). However, such brittleness may not be a significant design consideration for transmission tower foundations, which often limit uplift to 25 mm under ultimate loads; this uplift equates to a displacement of about 1% for typical foundation width of 2.5 m (Rattley et al., 2008).
Failure of the uplift-loaded plate anchors in UAS and CAS was typically associated with the appearance of cracks on the ground surface in the vicinity of the anchors when tensile strength is reached before failure (i.e., before reaching ultimate shear strength), as shown in Figure 9. Similar to the report by Consoli et al. (Consoli et al., 2013), it can be drawn that the failure surfaces were approximately straight lines that began close to the outer edge of the anchor plates and symmetrically propagated to the ground surface with a slope of the failure surface. In general, the failure of the plate anchors in CAS had a larger truncated cone shape with a slope angle with the vertical and wider brittle radial cracks than those of the plate anchors in UAS.
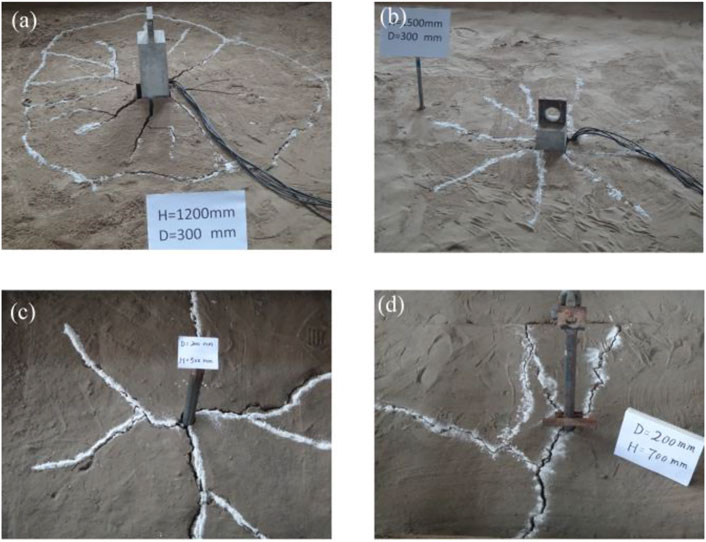
FIGURE 9. Typical photos of the bulge and sketch of cracks after pullout failure: (A) D = 0.3 m, H = 1.2 m in UAS, (B) D = 0.3 m, H = 1.5 m in UAS, (C) D = 0.2 m, H = 0.5 m in CAS, and (D) D = 0.2 m, H = 0.7 m in CAS.
5.2 Discussion of Uplift Resistance Calculation
Thefailure of vertically uplifted foundations can be classified into shallow and deep modes (Meyerhof and Adams 1968; Pacheco et al., 2008). According to the studies by Pacheco et al. (Pacheco et al., 2008), the model plate anchors embedded in UAS and CAS in this study would be in shallow failure mode. As a popular method, the earth cone or dead weight method has been widely adopted for plate anchor designs worldwide (Matsuo 1967; Meyerhof and Adams 1968; Matsuo 1968), and Figure 10 shows the assumed slip surface of this method in the shallow failure mode. In this method, the ultimate uplift resistance is assumed to be equal to the sum of the dead weight of the foundation and the soil mass contained in the truncated pyramid with the bottom of the foundation slab as a base; therefore, the theoretical equation for the uplift resistance can be determined using the following relationship:
where Gf is the dead weight of the foundation, γs is the unit weight of the earth lying above the bottom of foundation slab, V0 is the volume of the foundation below the ground surface, and Vt is the volume of the truncated pyramid, and can be expressed using the following equation:
where D is the width of the foundation, H is the embedment depth of the foundation, and α is the slope angle of the pyramidal failure surface to the vertical or to the direction of uplift load.
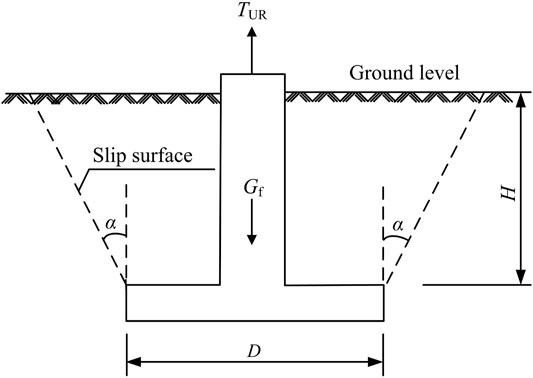
FIGURE 10. Assumed failure surface of the earth cone or dead weight method.
Based on the failure uplift resistances, TUR, and Eqs 1, 2, the values for the slope angle α of all tests can be determined and are presented in Table 1. The magnitude of the slope angle α varies with soil properties and plate dimensions, and the values of α corresponding to the failure uplift resistances are plotted against the embedment ratio, H/D, on Figure 11 for all model tests on plate anchors embedded in UAS and CAS.
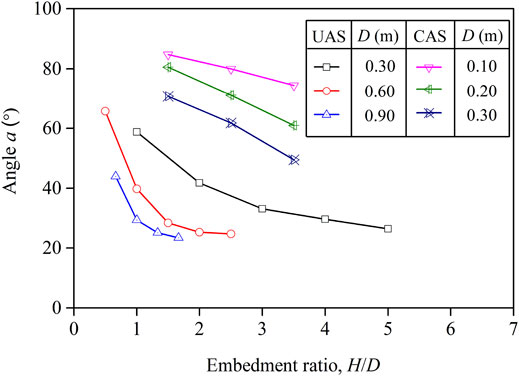
FIGURE 11. Relationship between the angle α and embedment ratio, H/D, for all model tests.
It is evident form Figure 11 that the magnitude of the slope angle α corresponding to the peak failure resistance for the foundations embedded in CAS is much larger than that for the foundations embedded in UAS. For a given mat width, D, the magnitude of the slope angle α for model plate anchors in UAS and CAS decreases with the embedment ratio, H/D. Additionally, for a given embedment ratio, H/D, the magnitude of the slope angle α for model plate anchors in UAS and CAS decreases with the plate width, D. These findings are quite important for the design of plate anchors embedded in CAS and UAS backfills subjected to uplift loads.
6 Conclusion
The following primary conclusions can be drawn from the comparative model test results on square model plate anchors embedded in UAS and CAS backfills:
1) Significant increases in initial pre-peak uplift stiffness and peak resistance can be obtained for model plate anchors subjected to uplift, irrespective of embedment ratios of H/D, when a relatively small amount of cement (an optimal cement content of 6% by weight of dry aeolian sand determined by direct shear test in this study) is added to the aeolian sand backfill, as addressed in other studies.
2) The load–displacement response of the plates embedded in CAS differ markedly from that in UAS. In general, the uplift load–displacement curves for plates embedded in CAS show both pre-peak and post-peak behaviours, whereas the curves for those in UAS exhibit an initial linear, a nonlinear transition to peak uplift resistance, and a post-peak region.
3) The addition of cement to aeolian sand backfill leads to a brittle uplift load–displacement response and a large reduction in available resistance after an average displacement of 1.20% of the plate width. This may be related to the brittle nature of the CAS backfill shear strength characteristics.
4) The magnitudes of the slope angle α of the earth cone or dead weight method used to calculate the uplift capacity of shallow spread corresponding to the peak failure resistances are much larger for plate anchors embedded in CAS than for those in UAS and decrease as the mat width, D, and embedment ratio, H/D, decrease.
Data Availability Statement
The raw data supporting the conclusion of this article will be made available by the authors, without undue reservation.
Author Contributions
ZQ and MS contributed to conception and design of this study. XL organized the database. FH performed the statistical analysis. ZQ and XL wrote the first draft of the manuscript. MS, ZQ and XL wrote sections of the manuscript. All authors contributed to manuscript revision, read, and approved the submitted version.
Conflict of Interest
The authors declare that the research was conducted in the absence of any commercial or financial relationships that could be construed as a potential conflict of interest.
Publisher’s Note
All claims expressed in this article are solely those of the authors and do not necessarily represent those of their affiliated organizations, or those of the publisher, the editors and the reviewers. Any product that may be evaluated in this article, or claim that may be made by its manufacturer, is not guaranteed or endorsed by the publisher.
Acknowledgments
The authors gratefully acknowledge the financial support of the National Natural Science Foundation of China (52069013).
References
Aiban, S. A. (1994). A Study of Sand Stabilization in Eastern Saudi Arabia. Eng. Geology. 38 (1-2), 65–79. doi:10.1016/0013-7952(94)90025-6
Al-Aghbari, M. Y., and Dutta, R. K. (2005). Suitability of Desert Sand Cement Mixes for Base Courses in Highway Pavements. Electron. J. Geotechnical Eng. 10 (D), 558–573.
Al-Ansary, M., Pöppelreiter, M. C., Al-Jabry, A., and Iyengar, S. R. (2012). Geological and Physiochemical Characterisation of Construction Sands in Qatar. Int. J. Sustain. Built Environ. 1, 64–84. doi:10.1016/j.ijsbe.2012.07.001
Al-Sanad, H. A., Ismael, N. F., and Nayfeh, A. J. (1993). Geotechnical Properties of Dune Sands in Kuwait. Eng. Geology. 34 (1-2), 45–52. doi:10.1016/0013-7952(93)90042-b
Al-Taie, A. J., Al-Shakarchi, Y. J., and Mohammed, A. A. (2013). Investigation of Geotechnical Specifications of Sand Dune: a Case Study Around Baiji in Iraq. Int. J. Sustain. Built Environ. 1 (6), 208–215. doi:10.31436/iiumej.v14i2.408
ASTM D 2487 (2011a). Standard Classification of Soils for Engineering Purposes, West Conshohocken, PA, USA: Annual Book of ASTM Standards, American Society for Testing and Materials, 1–12.
ASTM D 422 (2007). Standard Test Method for Particle-Size Analysis of Soils, West Conshohocken, PA, USA: Annual Book of ASTM Standards, American Society for Testing and Materials, 1–8.
ASTM D3080/D3080M (2011b). Standard Test Method for Direct Shear Test of Soils under Consolidated Drained Conditions, West Conshohocken, PA, USA: Annual Book of ASTM Standards, American Society for Testing and Materials, 1–7.
Baghdadi, Z. A., and Rahman, M. A. (1990). The Potential of Cement kiln Dust for the Stabilization of Dune Sand in Highway Construction. Building Environ. 25 (4), 285–289. doi:10.1016/0360-1323(90)90001-8
CNS GB50007 (2011). Code for Design of Building Foundations. Beijing, China: Chinese National Code, China Architecture and Building Press. (in Chinese).
Consoli, N. C., Rosa, F. D., and Fonini, A. (2009). Plate Load Tests on Cemented Soil Layers Overlaying Weaker Soil. J. Geotech. Geoenviron. Eng. 135 (12), 1846–1856. doi:10.1061/(asce)gt.1943-5606.0000158
Consoli, N. C., Ruver, C. A., and Schnaid, F. (2013). Uplift Performance of Anchor Plates Embedded in Cement-Stabilized Backfill. J. Geotech. Geoenviron. Eng. 139 (3), 511–517. doi:10.1061/(asce)gt.1943-5606.0000785
Consoli, N. C., Vendruscolo, M. A., and Prietto, P. D. M. (2003). Behavior of Plate Load Tests on Soil Layers Improved with Cement and Fiber. J. Geotech. Geoenviron. Eng. 129 (1), 96–101. doi:10.1061/(asce)1090-0241(2003)129:1(96)
Elipe, M. G. M., and López-Querol, S. (2014). Aeolian Sands: Characterization, Options of Improvement and Possible Employment in Construction - the State-Of-The-Art. Construction Building Mater. 73, 728–739. doi:10.1016/j.conbuildmat.2014.10.008
Freer Hewish, R. J., Hewish, R. J. F., Ghataora, G. S., and Niazi, Y. (1999). Stabilization of Desert Sand with Cement kiln Dust Plus Chemical Additives in Desert Road Construction. Proc. Inst. Civil Eng. - Transport 135 (1), 29–36. doi:10.1680/itran.1999.31285
Huang, F. M., Tao, S. Y., Chang, Z. L., Huang, J., Fan, X., Jiang, S-H., et al. (2021a). Efficient and Automatic Extraction of Slope Units Based on Multi-Scale Segmentation Method for Landslide Susceptibility Prediction. Landslides 18, 3715–3731. doi:10.1007/s10346-021-01756-9
Huang, F., Zhou, Y., and Huang, J. (2021b). Uncertainty Study of Landslide Susceptibility Prediction Considering Different Attribute Interval Numbers of Environmental Factors and Different Data-Based Models. CATENA 202, 105250. doi:10.1016/j.catena.2021b.105250
Huang, F., Cao, Z., Jiang, S.-H., Zhou, C., Huang, J., and Guo, Z. (2020). Landslide Susceptibility Prediction Based on a Semi-supervised Multiple-Layer Perceptron Model. Landslides 17, 2919–2930. doi:10.1007/s10346-020-01473-9
Jgj94, C. L. C. (2008). Technical Code for Building Pile Foundations, Chinese Local Code. Beijing, China: China Architecture and Building Press. (in Chinese).
Khan, I. H. (1982). Soil Studies for Highway Construction in Arid Zones. Eng. Geology. 19 (1), 47–62. doi:10.1016/0013-7952(82)90005-9
Kulhawy, F. H., Trautmann, C. H., Beech, J. F., O’Rourke., T. D., and McGuire, W. (1983). Transmission line structure foundation for uplift-compression loading. Electric Power Research Institute, Palo Alto, CA, USA, Report No. EPRI-EL-2870, 30.
Matsuo, M. (1967). Study on the Uplift Resistance of Footing (I). Soils and Foundations 7 (4), 1–37. doi:10.3208/sandf1960.7.4_1
Matsuo, M. (1968). Study on the Uplift Resistance of Footing (II). Soil Found. 8 (1), 8–48. doi:10.3208/sandf1960.8.18
Meyerhof, G. G., and Adams, J. I. (1968). The Ultimate Uplift Capacity of Foundations. Can. Geotech. J. 5 (4), 225–244. doi:10.1139/t68-024
PachecoM, P., Danziger, F. A. B., and Pinto, C. P. (2008). Design of Shallow Foundations under Tensile Loading for Transmission Line Towers: an Overview. Eng. Geology. 101 (3-4), 226–235. doi:10.1016/j.enggeo.2008.06.002
Panwar, P., and Ameta, N. K. (2013). Stabilization of Dune Sand with Bentonite and Lime. Electron. J. Geotechnical Eng. 18 (E), 2667–2674.
Parto, P., and Kalantari, B. (2011). Laboratory Investigation on the Effect of Polypropylene Fibers on the California Bearing Ratio of Stabilized Wind-Blown Sand. Electron. J. Geotechnical Eng. 16 (R), 1369–1380.
Qian, Z.-z., Lu, X.-l., Han, X., and Tong, R.-m. (2015). Interpretation of Uplift Load Tests on Belled Piers in Gobi Gravel. Can. Geotech. J. 52 (7), 992–998. doi:10.1139/cgj-2014-0075
Qian, Z.-z., Lu, X.-l., and Tong, R.-m. (2014). Uplift Load-Movement Response of bell Pier Foundations in Gobi Gravel. Proc. Inst. Civil Eng. - Geotechnical Eng. 167 (4), 380–389. doi:10.1680/geng.12.00072
Rattley, M. J., Lehane, B. M., Consoli, N., and Richards, D. J.x (2008). Uplift of Shallow Foundations with Cement-Stabilised Backfill. Proc. Inst. Civil Eng. - Ground Improvement 161 (2), 103–110. doi:10.1680/grim.2008.161.2.103
Santoni, R. L., and Webster, S. L. (2001). Airfields and Roads Construction Using Fiber Stabilization of Sands. J. Transp. Eng. 127 (2), 96–104. doi:10.1061/(asce)0733-947x(2001)127:2(96)
Shirvani, R. A., and Shooshpasha, I. (2015). Experimental Study on Load-Settlement Behaviour of Cement Stabilised Footing with Different Dimensions on sandy Soil. Arab J. Sci. Eng. 40, 397–406. doi:10.1007/s13369-014-1444-5
Stefanoff, G., Jellev, J., Tsankova, N., Arachorov, P., and Slavov, P. (1983). “Transmission line structure foundation for uplift-compression loading. Electric Power Research Institute, Palo Alto, CA, USA, Report No. EPRI-EL-2870, 30, Rotterdam.
Yang, Y., Sun, G., Zheng, H., and Yan, C. (2020b). An Improved Numerical Manifold Method with Multiple Layers of Mathematical Cover Systems for the Stability Analysis of Soil-Rock-Mixture Slopes. Eng. Geology. 264, 105373. doi:10.1016/j.enggeo.2019.105373
Yang, Y., Sun, Y., Sun, G., and Zheng, H. (2019). Sequential Excavation Analysis of Soil-Rock-Mixture Slopes Using an Improved Numerical Manifold Method with Multiple Layers of Mathematical Cover Systems. Eng. Geology. 261, 105278. doi:10.1016/j.enggeo.2019.105278
Keywords: aeolian sand, cement-treated soil, stabilisation, backfills, pullout, ultimate bearing capacity
Citation: Qian Z, Sheng M, Huang F and Lu X (2021) Uplift Performance of Plate Anchors in Cement-Stabilised Aeolian Sand. Front. Earth Sci. 9:783148. doi: 10.3389/feart.2021.783148
Received: 25 September 2021; Accepted: 29 October 2021;
Published: 18 November 2021.
Edited by:
Xiaodong Fu, Institute of Rock and Soil Mechanics (CAS), ChinaReviewed by:
Yankun Wang, Yangtze University, ChinaTing Xiao, Beijing Institute of Technology, China
Copyright © 2021 Qian, Sheng, Huang and Lu. This is an open-access article distributed under the terms of the Creative Commons Attribution License (CC BY). The use, distribution or reproduction in other forums is permitted, provided the original author(s) and the copyright owner(s) are credited and that the original publication in this journal is cited, in accordance with accepted academic practice. No use, distribution or reproduction is permitted which does not comply with these terms.
*Correspondence: Mingqiang Sheng, bXFzaGVuZ0BuY3UuZWR1LmNu