 Mengqi Zhang1
 Jianqi Sun1,2,3*
- 1Nansen-Zhu International Research Center, Institute of Atmospheric Physics, Chinese Academy of Sciences, Beijing, China
- 2Collaborative Innovation Center on Forecast and Evaluation of Meteorological Disasters, Nanjing University of Information Science and Technology, Nanjing, China
- 3University of Chinese Academy of Sciences, Beijing, China
Spring extreme precipitation poses great challenges to agricultural production and economic development in southern China. From the perspective of prediction, the relationship between spring extreme precipitation frequency (SEPF) in southern China and preceding autumn snow cover over Eurasia is investigated. The results indicate that the southern China SEPF is significantly correlated with October snow cover in central Siberia. Corresponding to reduced October snow cover, the vertical propagation of planetary waves is suppressed, which leads to a strengthened stratospheric polar vortex from October to following December. The signal of the anomalous stratospheric polar vortex propagates downward to the surface, contributing to a positive North Atlantic Oscillation (NAO)-like pattern in December. The southwesterlies in the northern Eurasia-eastern Arctic associated with the positive NAO induce sea ice loss in the Barents–Kara seas in January–February, which then tends to enhance the vertical propagation of planetary waves by constructively interfering with the climatological wavenumber-1 component. Therefore, the stratosphere polar vortex is significantly weakened in spring, which further contributes to a negative Arctic Oscillation (AO)-like pattern in the troposphere. The negative spring AO is related to an anomalous cyclone in East Asia, which induces upward motion and moisture convergence in southern China, consequently providing favorable dynamic and moisture conditions for extreme precipitation in the region. The snow cover signal in central Siberia in the preceding October provides a potential source for the prediction of spring extreme precipitation variability in southern China with two seasons in advance.
Introduction
Southern China is a major rice-producing region in East Asia and has a dense population and developed industry, making it vulnerable to extreme precipitation events. Spring is the rice-seeding season in southern China. Floods and droughts associated with anomalous precipitation and extreme precipitation events in spring can influence agricultural activity and rice production in the region. Therefore, it is of great importance to better understand and predict the variabilities of spring precipitation and extreme precipitation events in southern China.
Although the precipitation amount in spring in southern China is less than that in summer, it can still contribute to more than 30% of the annual total precipitation and has strong variability (Feng and Li, 2011). Efforts have been made to explore possible mechanisms for spring precipitation variability in southern China, revealing several influencing factors, including the East Asian jet stream (Wen et al., 2007; Wang et al., 2011), western Pacific subtropical high (Wang et al., 2000; Zhang et al., 2009), polar vortex (Wang et al., 2002), North Atlantic Oscillation (NAO; Xin et al., 2006; Sun and Yang, 2012), sea surface temperature (SST) anomalies in the North Atlantic (You and Jia, 2018; Jia et al., 2019) and tropical Indian-Pacific Oceans (Wu et al., 2003; Xie et al., 2009; Feng and Li, 2011; Sun and Yang, 2012; Chen et al., 2014), etc.
Compared with spring mean precipitation, extreme precipitation tends to be more destructive to the ecosystem, social economy, and agricultural activity and production. Recent studies have begun to focus on the variability and influencing factors of spring precipitation extremes in southern China from a climatic perspective. For example, Huang et al. (2015) indicated that the southern China spring persistent rainfall frequency is positively related to the strong East Asian subtropical jet–weak East Asian polar front jet configuration. Li et al. (2018) suggested that there are two branches of water vapor transport in association with spring persistent rainfall in southern China: One is westerlies over the southern Tibetan Plateau, and the other is southwesterlies over the western North Pacific. Shen and Chen (2018) pointed out that the out-of-phase change in surface sensible heat between mid-latitude Eurasia and Southeast Asia is significantly correlated with the out-of-phase change in spring extreme precipitation frequency between northern China and southern China. A recent study by Gu et al. (2021) suggested that spring consecutive cloudy-rainy events in southern China exhibit considerable interdecadal variation, which is related to the Pacific Decadal Oscillation (PDO). Zhang et al. (2021) revealed that anomalous sea ice in the Davis Strait–Baffin Bay region in the preceding winter has a delayed impact on spring extreme precipitation events in southern China.
Eurasian snow cover is an important influencing factor and prediction source for the Northern Hemisphere climate (Saito et al., 2001; Cohen et al., 2007; Cohen and Fletcher, 2007; Cohen and Jones, 2011; Cohen et al., 2014; Orsolini et al., 2016). Anomalous Eurasian snow cover affects the local energy budget by changing surface albedo and snowmelt-related soil moisture anomalies, which further influence the climate remotely by exciting Rossby wave anomalies (Barnett et al., 1989; Yim et al., 2010; Zhang et al., 2019). Stratosphere-troposphere interaction is an important pathway whereby autumn Eurasian snow impact on subsequent winter atmospheric circulations (Cohen et al., 2007; Cohen et al., 2014; Ao and Sun, 2015; Han and Sun, 2018; Xu et al., 2018). Specifically, increased (decreased) October Eurasian snow cover enhances (suppresses) the upward propagation of planetary waves, which further weakens (strengthens) the stratospheric polar vortex and induces a negative (positive) Arctic Oscillation (AO)/NAO in the following winter (Gong et al., 2003; Cohen et al., 2007; Fletcher et al., 2009; Garfinkel et al., 2010; Smith et al., 2011; Cohen et al., 2014). Some studies have suggested a linkage between spring Eurasian snow cover and southern China spring precipitation variability (Wu and Kirtman, 2007; Zuo et al., 2012; Jia et al., 2018). Then, it is natural to ask whether the preceding Eurasian snow cover influences the southern China spring extreme precipitation frequency (SEPF). If so, the snow cover information could provide sources for the seasonal prediction of SEPF variability in southern China. Therefore, from the perspective of prediction, this study investigates the relationship between the southern China SEPF and Eurasian snow cover in the preceding autumn and the related physical processes.
Data and Methods
In this study, we use daily precipitation observations from 839 meteorological stations in China provided by the National Meteorological Information Center of the China Meteorological Administration. There are 569 stations in East China (east of 105°E) after eliminating the stations with missing values of more than 5 days during spring (March–May) in any year from 1979 to 2017. Following previous studies (e.g., Zhai et al., 2005), an extreme precipitation day is identified at a station when the station’s daily precipitation amount is larger than the 90th percentile of precipitation on all rainy days (daily precipitation≥0.1 mm) in spring during 1979–2017. The extreme precipitation frequency indicates the number of extreme precipitation days.
The Northern Hemisphere weekly snow cover dataset is provided by the Rutgers University Global Snow Lab (GSL, Robinson et al., 2012), which has been available since 1967 on an 88 × 88 grid. The weekly data are converted to monthly data for analysis. The monthly atmospheric circulation datasets are obtained from the National Centers for Environmental Prediction and National Center for Atmospheric Research (NCEP–NCAR) from 1948 to the present with a 2.5 ° × 2.5 ° horizontal resolution (Kalnay et al., 1996). The monthly Arctic sea ice concentration dataset is obtained from the Hadley Centre Sea Ice and SST dataset version 1 (HadISST1), from 1870 to the present with a resolution of 1 ° × 1 ° (Rayner et al., 2003). The monthly mean AO and NAO indices are extracted from the Climate Prediction Center (https://www.cpc.ncep.noaa.gov/products/precip/CWlink/daily_ao_index/ao.shtml and https://www.cpc.ncep.noaa.gov/products/precip/CWlink/pna/nao.shtml), which spans the period from 1950 to the present.
The research period of this study is 1979–2017, and all variables are available during the period. To obtain the interannual component, a 9-years high pass filter is applied to all variables using the Flourier transform. The statistical significance is estimated according to the two-tailed Student’s t test. The zonal wavenumber-1 disturbance is obtained by zonal Fourier harmonics.
Results
Relationship Between Southern China Spring Extreme Precipitation Frequency and Eurasian Snow Cover in the Preceding Autumn
Recently, Zhang et al. (2021) performed an empirical orthogonal function (EOF) analysis on the interannual SEPF variability in East China (east of 105°E) during 1979–2017. The EOF1 mode accounts for 16.2% of the total variance and generally shows consistent variability of SEPF in East China, with a large-value center in southern China (20°–30°N, 110°–125°E). The EOF2 mode accounts for 10.8% of the total variance and shows a south-north dipole structure of SEPF variability between central East China (29°–38°N, 105°–125°E) and southeastern coast of China (20°–27°N, 110°–120°E; figure not shown). The EOF1 and EOF2 can be well separated from each other and from the remaining modes, based on North et al. (1982). This study focuses on the first mode of interannual SEPF variability in East China. Based on the study by Zhang et al. (2021), a southern China spring extreme precipitation frequency index (SC_SEPI) is defined as area-average SEPF anomalies over 20°–30°N, 110°–125°E. The correlation coefficient between PC1 and SC_SEPI is 0.94 during 1979–2017, which indicates that the SEPF variability in southern China is the major feature of that in East China.
To investigate the connection between the interannual variabilities in the southern China SEPF and Eurasian snow cover in the preceding autumn, Figure 1 examines the correlations of Eurasian snow cover in the preceding September to November with SC_SEPI. Significantly large-scale negative correlations are observed in October in central Siberia. However, correlations are negligible in the region in September and November. This is reasonable since large snow cover variabilities appear in mid- to high-latitude Eurasia in October, whereas the variabilities are weak in the region in September and November (Han and Sun, 2018). Furthermore, a snow cover index (SNOWI) is defined as snow cover anomalies averaged over 50°–68°N, 92°–116°E (Figure 1B). The SC_SEPI is closely related to the October SNOWI, with a correlation coefficient of -0.65 during 1979–2017, which is significant at the 99% confidence level. Besides the snow cover signals over central Siberia, significant decrease in snow cover can also be seen over north Europe and a marked dipole snow cover anomaly pattern can be detected in East Asia. This result indicates that the November snow cover anomalies over the aforementioned two regions might also have lagged influence in the SEPF variability in southern China, which will be explored in details in our future studies. The role of the largest-scale signal of snow cover over central Siberia is focused in this study.

FIGURE 1. Correlation coefficients of snow cover in (A) September, (B) October and (C) November with SC_SEPI during 1979–2017. Stippled regions indicate that the anomalies are significant at the 90% confidence level. The box in (B) indicates the region used to define the SNOWI.
We further analyze the spring atmospheric circulation anomalies associated with the SC_SEPI and negative October SNOWI. As shown in Figure 2, the spring large-scale atmospheric circulation anomalies associated with the two indices share similar features, with significant positive sea level pressure (SLP) and geopotential height anomalies in the polar region, as well as negative anomalies in mid-latitude Eurasia, resembling the negative phase of AO. The correlation coefficients of the spring AO index with the SC_SEPI and October SNOWI are −0.42 and 0.52 during 1979–2017, respectively, and both are significant at the 99% confidence level. These results suggest that the spring AO may play an important role in linking the preceding October snow cover in central Siberia and SEPF in southern China.
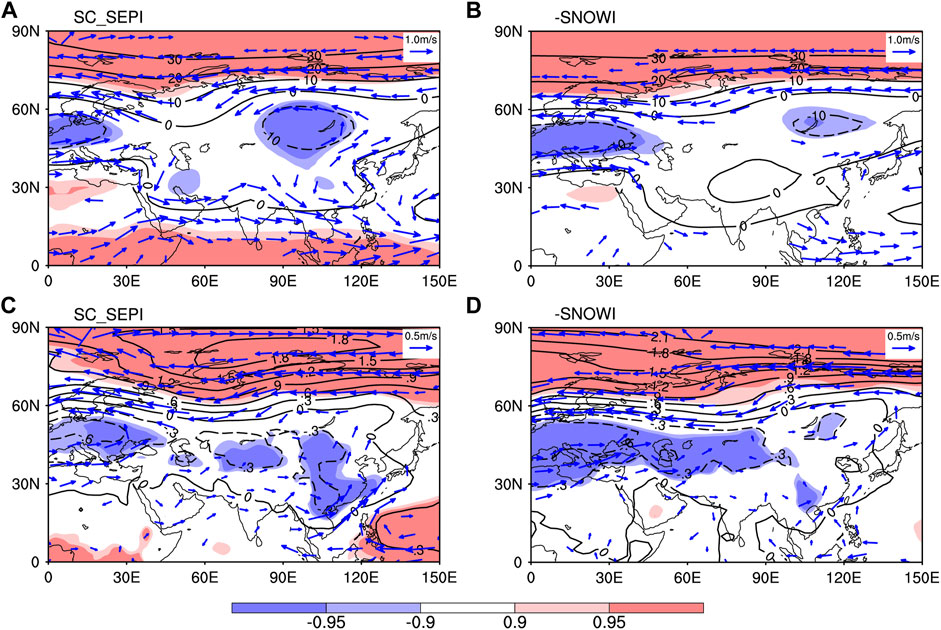
FIGURE 2. Regressions of spring (A) 200 hPa geopotential height (m) and wind (ms−1) and (C) sea level pressure (SLP; hPa) and 850 hPa wind (ms−1) against the SC_SEPI during 1979–2017. (B) and (D) are the same as (A) and (C) but for negative October SNOWI. Light and dark shaded regions indicate that the anomalies are significant at the 90 and 95% confidence levels, respectively. Wind vectors that are significant at the 90% confidence level are shown.
Corresponding to more southern China SEPF, there is a quasi-barotropic anomalous cyclone in East Asia, with southerlies prevailing in southern China (Figures 2A,C). Such atmospheric circulation anomalies favor more water vapor transport from low latitudes to southern China and lead to moisture convergence in the region (Figure 3A). Meanwhile, significant upward motion anomalies dominate southern China (Figure 3C). The anomalous moisture and vertical motion conditions associated with the negative October SNOWI bear a resemblance to those associated with SC_SEPI (Figures 3B,D). The similarity between atmospheric circulation anomalies associated with the reduced October snow cover in central Siberia and SEPF in southern China further confirms the close relationship between the two.
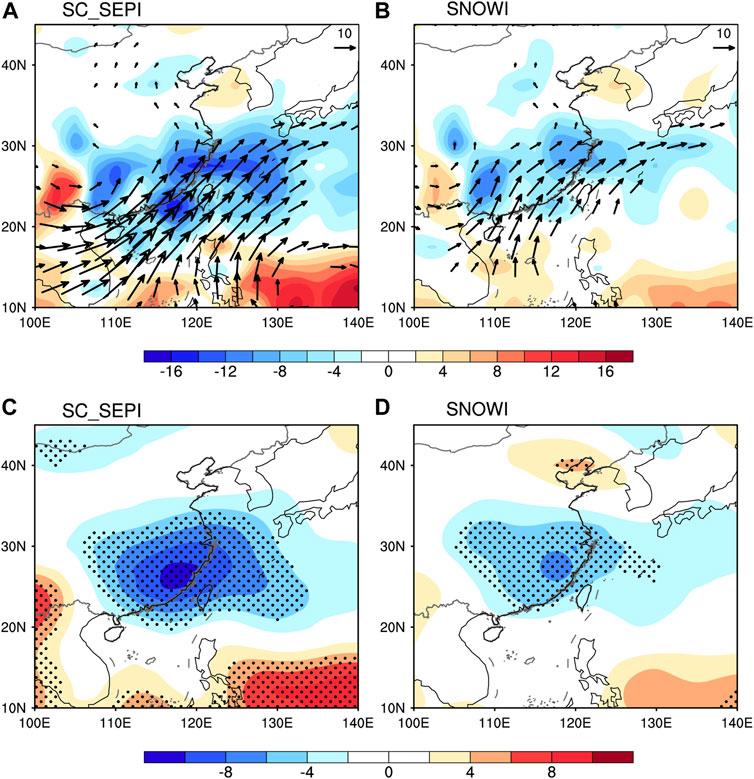
FIGURE 3. Regressions of spring (A) vertically integrated water vapor flux (vectors; kgm−1 s−1) and its divergence (shading; 10−6 kgm−2s−1) and (C) 500 hPa vertical velocity (10−3 Pas−1) against the SC_SEPI during 1979–2017. (B) and (D) are the same as (A) and (C) but for negative October SNOWI. Stippled regions indicate that the anomalies are significant at the 95% confidence level. Vectors that are significant at the 90% confidence level are shown.
Physical Processes Connecting October Snow Cover in Central Siberia and Spring Extreme Precipitation Frequency in Southern China
To investigate the possible physical processes that link the preceding October snow cover in central Siberian and SEPF in southern China, the temporal evolution of anomalous atmospheric circulations associated with the October SNOWI are examined in this section. Previous observational and modeling studies connected October Eurasian snow cover with the following winter climate through troposphere–stratosphere interactions (Gong et al., 2003; Cohen et al., 2007; Peings et al., 2012; Cohen et al., 2014; Han and Sun, 2018; Xu et al., 2018). Therefore, we hypothesize that October central Siberian snow cover could also affect atmospheric circulation in the following seasons by modulating the vertical component of wave activity fluxes (WAFs) from the troposphere to the stratosphere. To test this hypothesis, Figure 4 shows the 50 hPa vertical stationary wave activity flux (Plumb, 1985) anomalies regressed against the negative October SNOWI and its long-term climatology in October. Climatologically, there is strong upward propagation of WAFs located in the mid- to high-latitude Eurasia-North Pacific. Corresponding to the negative October SNOWI, significantly anomalous downward WAFs occur in a large-scale area of mid-to high latitude Eurasia, with a center in the area with reduced snow cover. The negative October SNOWI-related downward WAF anomalies weaken the upward WAFs of the climatological mean, which tends to suppress the vertical propagation of planetary waves.
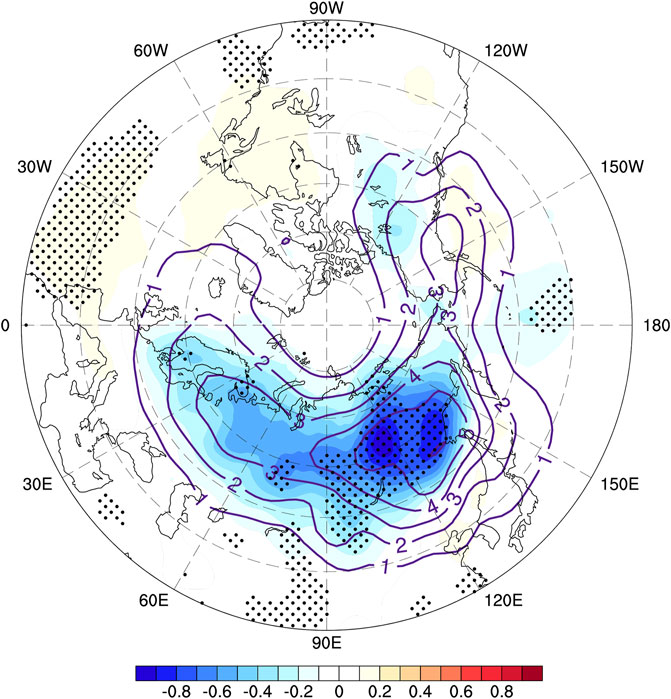
FIGURE 4. Regression of October vertical wave activity flux (WAF) anomalies (shading; 10−3 m2s−2) at 50 hPa against the negative October SNOWI during 1979–2017. Contours denote the climatological mean of 50 hPa vertical WAFs in October. Stippled regions indicate that the anomalies are significant at the 90% confidence level.
The enhanced/suppressed vertical propagation of planetary waves favors weakened/strengthened stratospheric polar vortex anomalies (e.g., Gong et al., 2003; Cohen et al., 2007; Fletcher et al., 2009; Kim et al., 2014). Therefore, along with the suppressed vertical propagation of planetary waves, the polar vortex becomes stronger from October to December, as shown in Figure 5. Previous studies suggested that the anomalous stratospheric polar vortex could persist and further propagate downward, forming an anomalous AO (NAO)-like pattern in weeks to months (Baldwin and Dunkerton, 2001). As a result, a positive NAO-like pattern occurs in December following the reduced October snow cover in central Siberia. The correlation coefficient between the October SNOWI and the following December NAO index is −0.46 during 1979–2017, which is significant at the 99% confidence level. The above results indicate that anomalous preceding October snow cover in central Siberia can lead to an anomalous December NAO through troposphere–stratosphere interactions.
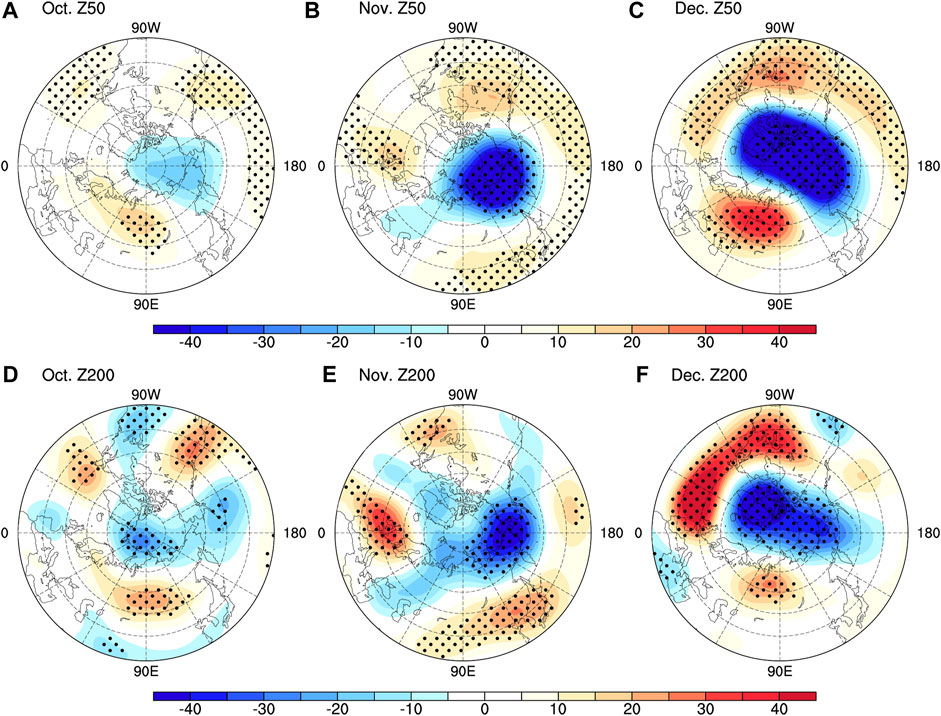
FIGURE 5. Regressions of (A–C) 50 hPa geopotential height (m) and (D–F) 200 hPa geopotential height (m) in October, November and December against the negative October SNOWI during 1979–2017. Stippled regions indicate that the anomalies are significant at the 90% confidence level.
Figures 6A,C exhibits the anomalous Arctic sea ice concentration (SIC), surface air temperature (SAT) and surface winds in December regressed against the negative October SNOWI. Corresponding to NAO-like atmospheric circulation anomalies associated with reduced October snow cover in central Siberia, significant southwesterlies prevail the region from the North Atlantic to northern Eurasia-eastern Arctic in December, which transports warm air masses to the northern Eurasia-eastern Arctic and leads to significantly increased SAT in the region. Consequently, sea ice is reduced in the Barents–Kara seas. The SIC and SAT anomalies could persist and strengthen in the following January–February (Figures 6B,D). Therefore, the January–February SIC index (SICI; SIC anomalies averaged over 69°–75°N, 20°–58°E) is significantly correlated with the October SNOWI, with a correlation of 0.46, exceeding the 99% confidence level.
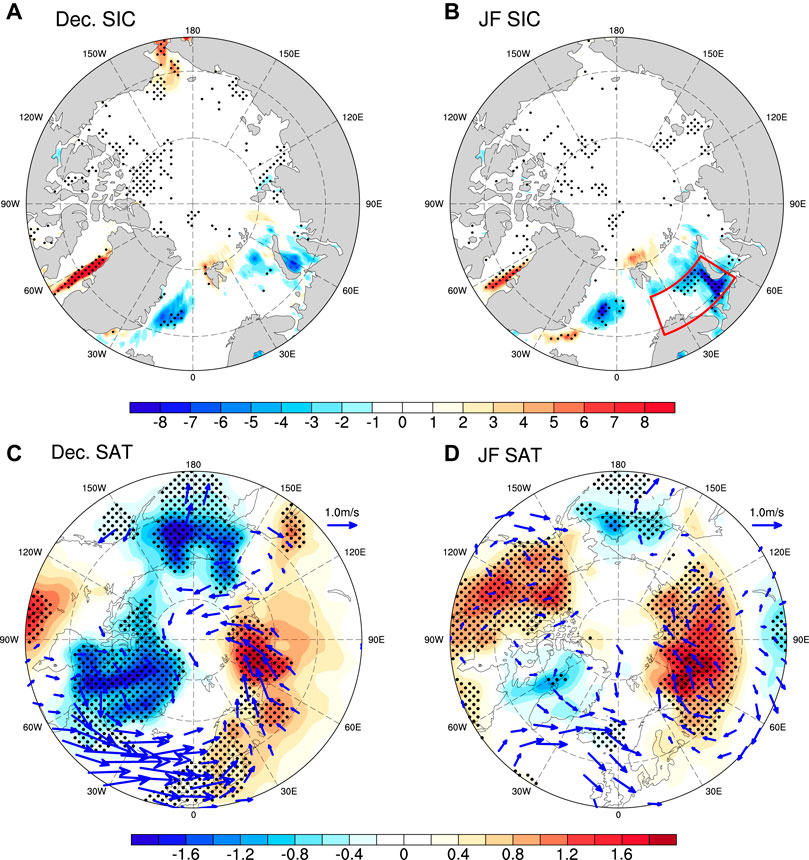
FIGURE 6. Regressions of December (A) Arctic sea ice concentration (SIC; %) and (C) surface air temperature (SAT; °C) and surface winds (m s−1) against the negative October SNOWI during 1979–2017. (B) and (D) are the same as (A) and (C), but for January–February. Stippled regions indicate that the anomalies are significant at the 90% confidence level. Wind vectors that are significant at the 90% confidence level are shown. The box in (B) indicates the region used to define the SICI.
Figures 7A,B examines the regressed January–February 500 hPa geopotential heights against the negative October SNOWI and negative January–February SICI. The atmospheric circulation anomalies in association with changes in snow cover and SIC show similar features, indicating that the SIC anomalies in the Barents–Kara seas could play an important role in the influence of October snow cover in central Siberia in the following January–February atmospheric circulations. The atmospheric circulations associated with the SNOWI and SICI show a zonal wavenumber-1 structure, from the perspective of hemispheric atmospheric variability. Figures 7C,D further exhibits the zonal wavenumber-1 components of geopotential height at 500 hPa regressed upon the negative October SNOWI and negative January–February SICI. The atmospheric circulation anomalies in Figures 7C,D are very similar to those in Figures 7A,B, with a pattern correlation coefficient of 0.61/0.69, which is significant at the 99% confidence level. These results imply that the October snow cover in central Siberia and January–February Barents–Kara seas SIC mainly influence the zonal wavenumber-1 atmospheric circulation.
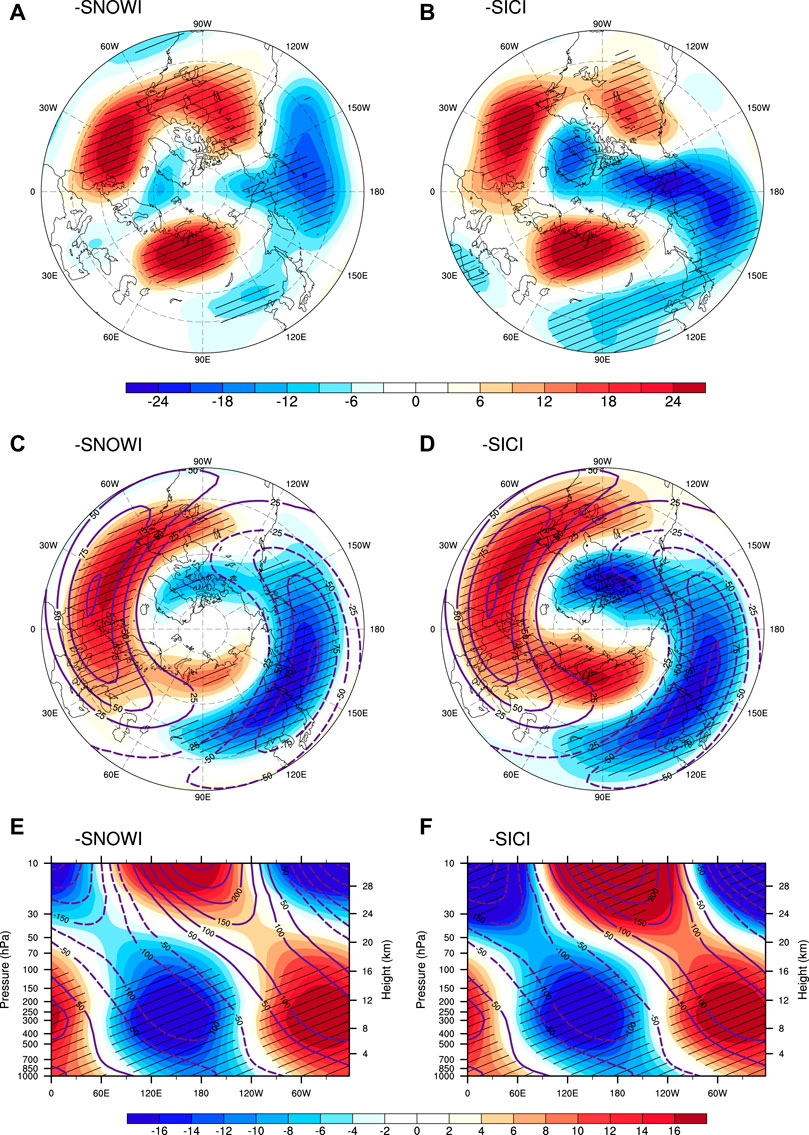
FIGURE 7. Regressions of 500 hPa geopotential height (m) in January–February against the (A) negative October SNOWI and (B) negative January–February SICI during 1979–2017. (C,D) and (E,F) are the same as (A,B) but for the zonal wavenumber-1 component of geopotential height at 500 hPa (shading; m) and longitude-pressure sections of the zonal wavenumber-1 component of geopotential height along 50°N (shading; m). Contours in (C–F) denote the climatological zonal wavenumber-1 component of geopotential height (m). Regions with hatched patterns indicate that the anomalies are significant at the 90% confidence level.
The anomalous wavenumber-1 components associated with the SNOWI and SICI are approximately in phase with the climatology of zonal wavenumber-1 atmospheric circulation, as shown in Figures 7C–F. The constructive interference of wavenumber-1 disturbance with the background state tends to enhance the upward wave activity propagation and further weakens the polar vortex (Garfinkel and Hartmann, 2008; Smith et al., 2010; Han and Sun, 2019). The above results indicate that anomalous October snow cover in central Siberia could induce a zonal wavenumber-1 disturbance during the following January–February by changing the SIC in the Barents–Kara seas, which could further enhance vertically propagating planetary waves by constructively interfering with the climatological wavenumber-1 component. These results are consistent with previous studies that suggested that decreased sea ice cover in the Barents–Kara seas could weaken the stratospheric polar vortex by modulating vertically propagating planetary waves (Kim et al., 2014; Nakamura et al., 2015; Nath et al., 2016).
To further confirm the January–February anomalous vertically propagating planetary waves in response to reduced October snow cover in central Siberia, Figure 8 depicts the January–February 50 hPa vertical WAFs regressed against the negative October SNOWI. Large-scale upward WAFs are found in mid- to high-latitude Eurasia and the North Pacific, coinciding with the large value of the climatological mean, which likely strengthens the upward propagation of planetary waves. Therefore, the stratosphere polar vortex is significantly weakened in spring, which can propagate downward and form a negative AO-like pattern in the troposphere (Figure 9). These results indicate that the October central Siberian snow cover is linked to the following spring AO-like circulation anomalies through stratosphere-troposphere interaction processes.
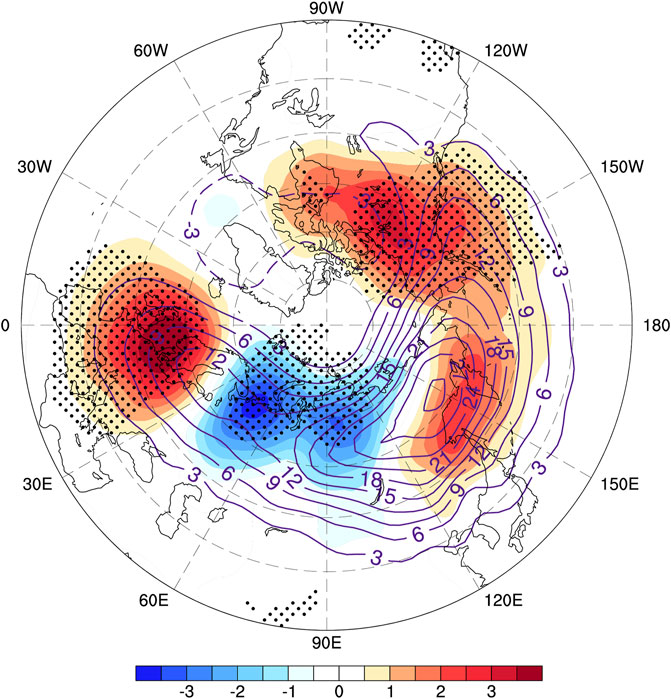
FIGURE 8. Regression of January–February vertical WAF anomalies (shading; 10−3 m2s−2) at 50 hPa against the negative October SNOWI during 1979–2017. Contours denote the climatological mean of 50 hPa vertical WAFs. Stippled regions indicate that the anomalies are significant at the 90% confidence level.
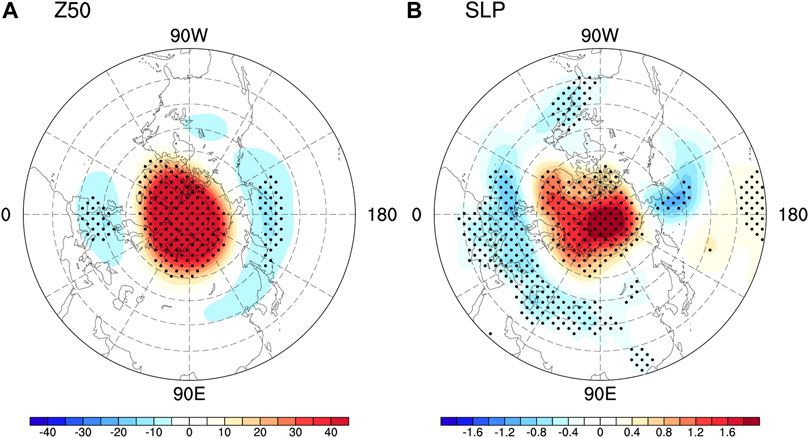
FIGURE 9. Regressions of spring (A) 50 hPa geopotential height (m) and (B) SLP (hPa) against the negative October SNOWI during 1979–2017. Stippled regions indicate that the anomalies are significant at the 90% confidence level.
The above results suggest a close relationship between the preceding October snow cover in central Siberia and SEPF in southern China. The snow cover signals with a two-season lead could provide useful information for the prediction of the southern China SEPF. Figure 10A calculates the correlations between observed and hindcasted SEPF in East China. The hindcast of SEPF is based on the following fomula:
where EOF1 is the observed leading mode of SEPF in East China (east of 105°E) during 1979–2017, and PC1 is the hindcasted time series based on the October SNOWI using leave-one-out cross-validation method. There are generally positive correlations in East China, with large-scale significant signals in southern China. Figure 10B further estimates the prediction value of October SNOWI for the SC_SEPI through the leave-one-out cross-validation method. The result indicates that the hindcasted SC_SEPI based on the October SNOWI could generally capture the variability in observation, with a correlation coefficient of 0.61 between the two, which is significant at the 99% confidence level. This suggests that the preceding October central Siberian snow cover could serve as a predictor for the southern China SEPF.
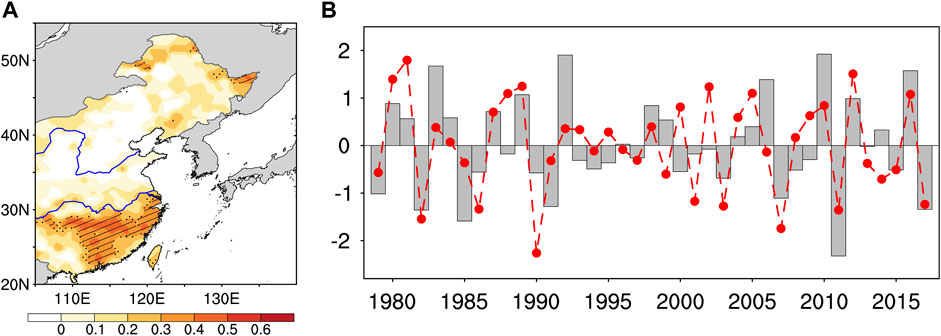
FIGURE 10. (A) Distribution of temporal correlation coefficient of SEPF in East China between the observation and hindcast. Regions with stippled and hatched patterns indicate that the correlations are significant at the 90 and 95% confidence levels, respectively. (B) Time series of the normalized SC_SEPI (bars) and the hindcasted SC_SEPI calculated using the leave-one-out cross-validation method based on the preceding October SNOWI (red line).
Conclusion and Discussion
Spring extreme precipitation in southern China significantly disrupts spring sowing and could cause heavy economic losses. The results of this study indicate that the southern China SEPF is negatively correlated with the central Siberian snow cover in the preceding October. This cross-seasonal relationship provides a possibility for predicting southern China spring extreme precipitation variability with two seasons in advance.
The October snow cover in central Siberia is linked to the southern China SEPF through stratosphere-troposphere interactions. Specifically, reduced October snow cover suppresses vertically propagating planetary waves from the troposphere to the stratosphere and further strengthens the stratospheric polar vortex from October to December. The strengthened stratospheric polar vortex signals propagate downward to the surface, forming a positive NAO-like structure in December. Corresponding to the NAO-like circulation anomalies, southwesterlies prevail in the North Atlantic and northern Eurasia-eastern Arctic, which bring warm air masses to the northern Eurasia-eastern Arctic and lead to local SAT warming. As a result, sea ice cover is reduced in the Barents–Kara seas, which further persists into the following January–February. The reduced SIC in the Barents–Kara seas further strengthens the upward propagation of Rossby waves by constructively interfering with the climatological wavenumber-1 component. Consequently, the stratospheric polar vortex is significantly weakened in spring and further contributes to a negative AO-like structure at the surface. The spring AO-like circulation anomalies are related to an anomalous cyclone in East Asia, which induces upward motion and moisture convergence in southern China, providing favorable conditions for extreme precipitation in the region. Through the above processes, decreased (increased) October central Siberian snow cover can lead to increased (decreased) spring extreme precipitation frequency in southern China.
Previous studies indicated that the troposphere–stratosphere interaction is important in the seasonal-delayed relationship between climate systems over the Northern Hemispheric mid-to high-latitude, in particular in the delayed impact of Eurasian snow cover and sea ice (e.g., Gong et al., 2003; Cohen et al., 2007; Peings et al., 2012; Cohen et al., 2014; Kim et al., 2014; Nakamura et al., 2015; Han and Sun, 2018; Xu et al., 2018; Ding and Wu, 2021). In this study, we find that the stratosphere-troposphere interaction also play important role in the influence of preceding October central Siberian snow cover on spring extreme precipitation frequency southern China, which is a possible physical way. In addition, previous studies also suggested that the air-sea interaction over the North Atlantic region plays an important role in prolonging impact of the NAO on the following circulation anomalies (e.g., Chen et al., 2020a; Chen et al., 2020b; Wu and Chen, 2020). In particular, Wu and Chen (2020) indicated that both the North Atlantic SST anomalies and Arctic sea ice anomalies are important in linking preceding winter and following spring SAT anomalies over Eurasia. Therefore, the North Atlantic SST might also play a role in linking the October snow cover and following spring extreme precipitation frequency in southern China through the tropospheric processes, which needs to be investigated in our future study.
This study revealed a cross-seasonal relationship between preceding October snow cover in central Siberia and spring extreme precipitation frequency in southern China. The October SNOWI shows significant skill in predicting the SC_SEPI, with a correlation coefficient of 0.61, explaining 37% of the total variance. However, there are still 63% of the variance missed. In addition, from Figure 10, we can also see that the October SNOWI cannot well predict SEPF in some extreme years (e.g., 1983, 1992, and 2006), which indicates that the SEPF in these years could be controlled by other factors. Thus, other influencing factors need to be investigated in the future to further improve the prediction skill of southern China SEPF.
Data Availability Statement
The original contributions presented in the study are included in the article/Supplementary Material, further inquiries can be directed to the corresponding author.
Author Contributions
JS and MZ designed this manuscript; MZ wrote the first draft of the manuscript; JS performed manuscript review and editing. Both authors discussed the results together and provided critical feedback to the manuscript.
Funding
This research was supported by the National Natural Science Foundation of China (41825010 and 42105018 ) and Dragon 5 Cooperation 2020-2024 (59376).
Conflict of Interest
The authors declare that the research was conducted in the absence of any commercial or financial relationships that could be construed as a potential conflict of interest.
The reviewer (SC) declared a shared affiliation, with several of the authors (MZ, JS) to the handling editor at the time of the review
Publisher’s Note
All claims expressed in this article are solely those of the authors and do not necessarily represent those of their affiliated organizations, or those of the publisher, the editors and the reviewers. Any product that may be evaluated in this article, or claim that may be made by its manufacturer, is not guaranteed or endorsed by the publisher.
References
Ao, J., and Sun, J. (2015). Connection between November Snow Cover over Eastern Europe and winter Precipitation over East Asia. Int. J. Climatol. 36, 2396–2404. doi:10.1002/joc.4484
Baldwin, M. P., and Dunkerton, T. J. (2001). Stratospheric Harbingers of Anomalous Weather Regimes. Science 294, 581–584. doi:10.1126/science.1063315
Barnett, T. P., Dümenil, L., Schlese, U., Roeckner, E., and Latif, M. (1989). The Effect of Eurasian Snow Cover on Regional and Global Climate Variations. J. Atmos. Sci. 46, 661–686. doi:10.1175/1520-0469(1989)046<0661:teoesc>2.0.co;2
Chen, J., Wen, Z., Wu, R., Chen, Z., and Zhao, P. (2014). Interdecadal Changes in the Relationship between Southern China winter-spring Precipitation and ENSO. Clim. Dyn. 43, 1327–1338. doi:10.1007/s00382-013-1947-x
Chen, S., Wu, R., Chen, W., and Li, K. (2020b). Why Does a Colder (Warmer) winter Tend to Be Followed by a Warmer (Cooler) Summer over Northeast Eurasia? J. Clim. 33, 7255–7274. doi:10.1175/jcli-d-20-0036.1
Chen, S., Wu, R., and Chen, W. (2020a). Strengthened Connection between Springtime North Atlantic Oscillation and North Atlantic Tripole SST Pattern since the Late 1980s. J. Clim. 33, 2007–2022. doi:10.1175/jcli-d-19-0628.1
Cohen, J., Barlow, M., Kushner, P. J., and Saito, K. (2007). Stratosphere-Troposphere Coupling and Links with Eurasian Land Surface Variability. J. Clim. 20, 5335–5343. doi:10.1175/2007jcli1725.1
Cohen, J., and Fletcher, C. (2007). Improved Skill of Northern Hemisphere winter Surface Temperature Predictions Based on Land-Atmosphere Fall Anomalies. J. Clim. 20, 4118–4132. doi:10.1175/jcli4241.1
Cohen, J., and Jones, J. (2011). A New index for More Accurate winter Predictions. Geophys. Res. Lett. 38, L21701. doi:10.1029/2011GL049626
Cohen, J., Screen, J. A., Furtado, J. C., Barlow, M., Whittleston, D., Coumou, D., et al. (2014). Recent Arctic Amplification and Extreme Mid-latitude Weather. Nat. Geosci 7, 627–637. doi:10.1038/ngeo2234
Ding, S., and Wu, B. (2021). Linkage between Autumn Sea Ice Loss and Ensuing spring Eurasian Temperature. Clim. Dyn. 57, 2793–2810. doi:10.1007/s00382-021-05839-0
Feng, J., and Li, J. (2011). Influence of El Niño Modoki on spring Rainfall over south China. J. Geophys. Res. 116, D13102. doi:10.1029/2010JD015160
Fletcher, C. G., Hardiman, S. C., Kushner, P. J., and Cohen, J. (2009). The Dynamical Response to Snow Cover Perturbations in a Large Ensemble of Atmospheric GCM Integrations. J. Clim. 22, 1208–1222. doi:10.1175/2008jcli2505.1
Garfinkel, C. I., and Hartmann, D. L. (2008). Different ENSO Teleconnections and Their Effects on the Stratospheric Polar Vortex. J. Geophys. Res. 113, D18114. doi:10.1029/2008jd009920
Garfinkel, C. I., Hartmann, D. L., and Sassi, F. (2010). Tropospheric Precursors of Anomalous Northern Hemisphere Stratospheric Polar Vortices. J. Clim. 23, 3282–3299. doi:10.1175/2010jcli3010.1
Gong, G., Entekhabi, D., and Cohen, J. (2003). Modeled Northern Hemisphere winter Climate Response to Realistic Siberian Snow Anomalies. J. Clim. 16, 3917–3931. doi:10.1175/1520-0442(2003)016<3917:mnhwcr>2.0.co;2
Gu, L., Sun, J., Yu, S., and Zhang, M. (2021). Footprints of Pacific Decadal Oscillation in the Interdecadal Variation of Consecutive Cloudy-Rainy Events in Southern China. Atmos. Res. 257, 105609. doi:10.1016/j.atmosres.2021.105609
Han, S., and Sun, J. (2018). Impacts of Autumnal Eurasian Snow Cover on Predominant Modes of Boreal winter Surface Air Temperature over Eurasia. J. Geophys. Res. 123, 10057–10072. doi:10.1029/2018jd028443
Han, S., and Sun, J. (2019). Potential Contribution of winter Dominant Atmospheric Mode over the Mid‐latitude Eurasia to the Prediction of Subsequent spring Arctic Oscillation. Int. J. Climatol. 40, 2953–2963. doi:10.1002/joc.6376
Huang, D.-Q., Zhu, J., Zhang, Y.-C., Wang, J., and Kuang, X.-Y. (2015). The Impact of the East Asian Subtropical Jet and Polar Front Jet on the Frequency of spring Persistent Rainfall over Southern China in 1997-2011. J. Clim. 28, 6054–6066. doi:10.1175/jcli-d-14-00641.1
Jia, X., Cao, D., Ge, J., and Wang, M. (2018). Interdecadal Change of the Impact of Eurasian Snow on spring Precipitation over Southern China. J. Geophys. Res. 123, 10073–10089. doi:10.1029/2018jd028612
Jia, X., You, Y., Wu, R., and Yang, Y. (2019). Interdecadal Changes in the Dominant Modes of the Interannual Variation of Spring Precipitation over China in the Mid‐1980s. J. Geophys. Res. Atmos. 124, 10676–10695. doi:10.1029/2019jd030901
Kalnay, E., Kanamitsu, M., Kistler, R., Collins, W., Deaven, D., Gandin, L., et al. (1996). The NCEP/NCAR 40-year Reanalysis Project. Bull. Amer. Meteorol. Soc. 77, 437–471. doi:10.1175/1520-0477(1996)077<0437:tnyrp>2.0.co;2
Kim, B.-M., Son, S.-W., Min, S.-K., Jeong, J.-H., Kim, S.-J., Zhang, X., et al. (2014). Weakening of the Stratospheric Polar Vortex by Arctic Sea-Ice Loss. Nat. Commun. 5, 4646. doi:10.1038/ncomms5646
Li, P., Zhou, T., and Chen, X. (2018). Water Vapor Transport for spring Persistent rains over southeastern China Based on Five Reanalysis Datasets. Clim. Dyn. 51, 4243–4257. doi:10.1007/s00382-017-3680-3
Nakamura, T., Yamazaki, K., Iwamoto, K., Honda, M., Miyoshi, Y., Ogawa, Y., et al. (2015). A Negative Phase Shift of the winter AO/NAO Due to the Recent Arctic Sea‐ice Reduction in Late Autumn. J. Geophys. Res. Atmos. 120, 3209–3227. doi:10.1002/2014jd022848
Nath, D., Chen, W., Zelin, C., Pogoreltsev, A. I., and Wei, K. (2016). Dynamics of 2013 Sudden Stratospheric Warming Event and its Impact on Cold Weather over Eurasia: Role of Planetary Wave Reflection. Sci. Rep. 6, 24174. doi:10.1038/srep24174
North, G. R., Bell, T. L., Cahalan, R. F., and Moeng, F. J. (1982). Sampling Errors in the Estimation of Empirical Orthogonal Functions. Mon. Wea. Rev. 110, 699–706. doi:10.1175/1520-0493(1982)110<0699:seiteo>2.0.co;2
Orsolini, Y. J., Senan, R., Vitart, F., Balsamo, G., Weisheimer, A., and Doblas-Reyes, F. J. (2016). Influence of the Eurasian Snow on the Negative North Atlantic Oscillation in Subseasonal Forecasts of the Cold winter 2009/2010. Clim. Dyn. 47, 1325–1334. doi:10.1007/s00382-015-2903-8
Plumb, R. A. (1985). On the Three-Dimensional Propagation of Stationary Waves. J. Atmos. Sci. 42, 217–229. doi:10.1175/1520-0469(1985)042<0217:ottdpo>2.0.co;2
Rayner, N. A., Parker, D. E., Horton, E. B., Folland, C. K., Alexander, L. V., Rowell, D. P., et al. (2003). Global Analyses of Sea Surface Temperature, Sea Ice, and Night marine Air Temperature since the Late Nineteenth century. J. Geophys. Res. 108, 4407. doi:10.1029/2002JD002670
Robinson, D., Estilow, T., and Cdr Program, N. O. A. A. (2012). NOAA Climate Data Record (CDR) of Northern Hemisphere (NH) Snow Cover Extent (SCE), Version 1. [indicate Subset Used]. Washington, D.C., United States: NOAA National Centers for Environmental Information. doi:10.7289/V5N014G9
Saito, K., Cohen, J., and Entekhabi, D. (2001). Evolution of Atmospheric Response to Early-Season Eurasian Snow Cover Anomalies. Mon. Wea. Rev. 129, 2746–2760. doi:10.1175/1520-0493(2001)129<2746:eoarte>2.0.co;2
Shen, D., and Chen, H. (2018). Possible Linkage between spring Extreme Precipitation over east China and Surface Sensible Heat Flux over the Eurasian Continent (In Chinese). Clim. Environ. Res. 23, 103–112. doi:10.3878/j.issn.1006-9585.2017.16226
Smith, K. L., Fletcher, C. G., and Kushner, P. J. (2010). The Role of Linear Interference in the Annular Mode Response to Extratropical Surface Forcing. J. Clim. 23, 6036–6050. doi:10.1175/2010jcli3606.1
Smith, K. L., Kushner, P. J., and Cohen, J. (2011). The Role of Linear Interference in Northern Annular Mode Variability Associated with Eurasian Snow Cover Extent. J. Clim. 24, 6185–6202. doi:10.1175/jcli-d-11-00055.1
Sun, C., and Yang, S. (2012). Persistent Severe Drought in Southern China during winter-spring 2011: Large-Scale Circulation Patterns and Possible Impacting Factors. J. Geophys. Res. 117, D10112. doi:10.1029/2012JD017500
Wang, B., Wu, R., and Fu, X. (2000). Pacific-east Asian Teleconnection: How Does ENSO Affect East Asian Climate? J. Clim. 13, 1517–1536. doi:10.1175/1520-0442(2000)013<1517:peathd>2.0.co;2
Wang, H., Xue, F., and Zhou, G. (2002). The spring Monsoon in south China and its Relationship to Large-Scale Circulation Features. Adv. Atmos. Sci. 19, 651–664. doi:10.1007/s00376-002-0005-0
Wang, L., Chen, W., Feng, R., and Liang, J. (2011). The Seasonal March of the North Pacific Oscillation and its Association with the Interannual Variations of China’s Climate in Boreal winter and spring (In Chinese). Chin. J. Atmos. Sci. 35, 393–402. doi:10.3878/j.issn.1006-9895.2011.03.01
Wen, Z., Wu, N., Feng, Y., Lin, L., Yuan, Z., and Chen, B. (2007). A Quantitative Diagnosis for the Mechanisms of spring Droughts in South China (In Chinese). Chin. J. Atmos. Sci. 31, 1223–1236.
Wu, R., and Chen, S. (2020). What Leads to Persisting Surface Air Temperature Anomalies from Winter to Following Spring over Mid- to High-Latitude Eurasia? J. Clim. 33, 5861–5883. doi:10.1175/jcli-d-19-0819.1
Wu, R., Hu, Z.-Z., and Kirtman, B. P. (2003). Evolution of ENSO-Related Rainfall Anomalies in East Asia. J. Clim. 16, 3742–3758. doi:10.1175/1520-0442(2003)016<3742:eoerai>2.0.co;2
Wu, R., and Kirtman, B. P. (2007). Observed Relationship of Spring and Summer East Asian Rainfall with Winter and Spring Eurasian Snow. J. Clim. 20, 1285–1304. doi:10.1175/jcli4068.1
Xie, S.-P., Hu, K., Hafner, J., Tokinaga, H., Du, Y., Huang, G., et al. (2009). Indian Ocean Capacitor Effect on Indo-Western Pacific Climate during the Summer Following El Niño. J. Clim. 22, 730–747. doi:10.1175/2008jcli2544.1
Xin, X., Yu, R., Zhou, T., and Wang, B. (2006). Drought in Late spring of South China in Recent Decades. J. Clim. 19, 3197–3206. doi:10.1175/jcli3794.1
Xu, X., He, S., Li, F., and Wang, H. (2018). Impact of Northern Eurasian Snow Cover in Autumn on the Warm Arctic-Cold Eurasia Pattern during the Following January and its Linkage to Stationary Planetary Waves. Clim. Dyn. 50, 1993–2006. doi:10.1007/s00382-017-3732-8
Yim, S.-Y., Jhun, J.-G., Lu, R., and Wang, B. (2010). Two Distinct Patterns of spring Eurasian Snow Cover Anomaly and Their Impacts on the East Asian Summer Monsoon. J. Geophys. Res. 115, D22113. doi:10.1029/2010JD013996
You, Y., and Jia, X. (2018). Interannual Variations and Prediction of spring Precipitation over China. J. Clim. 31, 655–670. doi:10.1175/jcli-d-17-0233.1
Zhai, P., Zhang, X., Wan, H., and Pan, X. (2005). Trends in Total Precipitation and Frequency of Daily Precipitation Extremes over China. J. Clim. 18, 1096–1108. doi:10.1175/jcli-3318.1
Zhang, J., Zhou, T., Yu, R., and Xin, X. (2009). Atmospheric Water Vapor Transport and Corresponding Typical Anomalous spring Rainfall Patterns in China (In Chinese). Chin. J. Atmos. Sci. 33, 121–134. doi:10.3878/j.issn.1006-9895.2009.01.11
Zhang, M., Sun, J., and Gao, Y. (2021). Possible Influence and Prediction Value of Preceding winter Sea Ice Variability over the Davis Strait–Baffin Bay for Changes in spring Extreme Precipitation Frequency over East China (In Chinese). Earth Sci. Front.. doi:10.13745/j.esf.sf.2021.9.60
Zhang, R., Sun, C., Zhang, R., Li, W., and Zuo, J. (2019). Role of Eurasian Snow Cover in Linking Winter‐Spring Eurasian Coldness to the Autumn Arctic Sea Ice Retreat. J. Geophys. Res. Atmos. 124, 9205–9221. doi:10.1029/2019jd030339
Keywords: snow cover, spring extreme precipitation, southern China, prediction, sea ice
Citation: Zhang M and Sun J (2021) Impact of October Snow Cover in Central Siberia on the Following Spring Extreme Precipitation Frequency in Southern China. Front. Earth Sci. 9:785601. doi: 10.3389/feart.2021.785601
Received: 29 September 2021; Accepted: 28 October 2021;
Published: 12 November 2021.
Edited by:
Renguang Wu, Zhejiang University, ChinaReviewed by:
Shangfeng Chen, Institute of Atmospheric Physics (CAS), ChinaBingyi Wu, Fudan University, China
Copyright © 2021 Zhang and Sun. This is an open-access article distributed under the terms of the Creative Commons Attribution License (CC BY). The use, distribution or reproduction in other forums is permitted, provided the original author(s) and the copyright owner(s) are credited and that the original publication in this journal is cited, in accordance with accepted academic practice. No use, distribution or reproduction is permitted which does not comply with these terms.
*Correspondence: Jianqi Sun, c3VuanFAbWFpbC5pYXAuYWMuY24=