 Yifei Xing
 Haowen Yu4*
- 1Chinese Academy of Geological Sciences, Beijing, China
- 2MNR Laboratory of Deep Geosciences and Exploration Technology, Ministry of Natural Resources of the People’s Republic of China, Beijing, China
- 3Geothermal and Hot Dry Rock Exploration and Development Technology Innovation Center, Ministry of Natural Resources of the People’s Republic of China, Beijing, China
- 4School of Water Resources and Environment, Hebei GEO University, Shijiazhuang, China
- 5Engineering Research Center of Groundwater Pollution Control and Remediation, Ministry of Education, College of Water Sciences, Beijing Normal University, Beijing, China
Geothermal resources are clean energy with a great potential for development and utilization. Gaoyang geothermal field, located in the middle of the raised area in Hebei province, China, is one of the three major geothermal fields in the Xiong’an New Area. With the development of the Xiong’an New Area, this geothermal field has become a research hotspot. According to the latest survey, the bottom-hole temperature of the D34 and D35 areas in the north of Gaoyang geothermal field is 149°C and 116°C, respectively, which indicates favorable target areas for geothermal exploitation The circulation mechanism and chemical origins of geothermal fluid are unclear in the Gaoyang geothermal field, which hinders the evaluation of geothermal resources in this region. Therefore, water chemistry and isotopic studies were performed on the Gaoyang geothermal fluid to understand the genesis of the Gaoyang geothermal field. Piper trigram and Na-K-Mg software were also used to explore the genesis of the underground hot water. Combined with stratigraphy and geothermal geology, it can be concluded that the primary hydrochemical type of the Gaoyang geothermal field is Na-HCO3·Cl. In the process of upward migration of geothermal water, leaching and cation alternating adsorption took place, and finally, high TDS geothermal water was formed. Our results are helpful for geothermal resource evaluation and utilization and provide scientific guidance for the sustainable development of geothermal resources.
Introduction
Geothermal resources are clean and efficient green energy. Studying and exploring the development and utilization of geothermal resources, which is conducive to the establishment and improvement of the energy structure of this region, can promote the development of the region’s economic level. The construction of Xiong’an New Area, a millennium plan and a national event, is a significant decision made by the CPC Central Committee for the current development of the nation according to the development needs of the new era. Since North China has been plagued by fog and haze pollution for a long time, the effective utilization of geothermal resources in clean heating is one of the effective means to control fog, and haze (Pang et al., 2017; Liu et al., 2020; Wang et al., 2021a). Therefore, the investigation of geothermal resources in Xiong’an New Area and the further development and utilization are decisive measures to solve the heating problem in winter, improve the energy structure, reduce the air pollution level, and build an environment-friendly city with green integration which can coexist harmoniously.
It is important to perfect geothermal resource exploration and evaluation in the Xiong’an New Area to investigate and study the typical geothermal resources in the Gaoyang geothermal field. In recent years, several experts and scholars have conducted extensive geothermal resources research around Xiong’an New Area. Pang et al. evaluated the geothermal resources in Xiong’an New Area, and recommended a focus on the exploration of ultra-deep carbonate thermal reservoirs (Pang et al., 2017); Wang et al. studied the characteristics and genetic mechanism of the present geothermal field in Xiong’an New Area, it was considered that the higher geothermal field characteristics was caused by the combination of stratigraphic assemblage, convection of geothermal water, and the development of faults (Wang et al., 2019); Hu et al. made a dynamic prediction of geothermal recoverable resources in the Rongcheng uplift area of Xiong’an New Area (Hu et al., 2020); Ma et al. studied the spatial structure of geothermal field in the Rongcheng area, Xiong’an New Area, constructed a 3D geological model and estimated geothermal resources (Ma et al., 2020); Wang et al. discussed and summarized the thermal reservoir characteristics and high-yield geothermal well parameters of Wumishan Formation in Gaoyang Low Uplift Area, Xiong’an New Area, and considered that the deep geothermal reservoir of Gaoyang geothermal field had good resource endowment (Wang et al., 2020); Wang et al. discussed the heat accumulation mechanism of the deep buried hill in the northeast of Gaoyang geothermal field in Xiong’an New Area, verified that the deep carbonate geothermal water in Gaoyang Geothermal Field had high temperature, large flow, and huge development potential (Wang et al., 2021b).
At present, researchers have achieved rich results around the Niutuo and Rongcheng geothermal fields. However, there are few studies on Gaoyang geothermal field, and some of those studies are limited to small areas. There is no overall understanding of the geothermal resources of this geothermal field. In particular, there is no scientific explanation for the geothermal fluid circulation mechanism and chemical genesis. It is difficult to fully guide the development of the Gaoyang geothermal field. This study aims to use hydrogeochemistry to conduct in-depth analysis and discussion on the chemical origin of Geothermal fluid in the Gaoyang geothermal field, make a preliminary evaluation of the overall situation of this geothermal field. The results will yield theoretical support for the efficient use and development of deep geothermal resources in the Xiong’an New Area, and also provide a scientific basis for relevant urban construction policies.
Study Area
General Situation of Physical Geography
Gaoyang geothermal field is located in the south of Anxin County, Gaoyang County, Lixian County, Anguo City, Shenzhen City, and the west of Anping County, covering an area of about 3,000 square kilometers. The study area is located in the middle of Jizhong Plain and the triangle of Beijing, Tianjin, and Baoding and belongs to the transitional zone from Taihang piedmont plain to the alluvial plain. The terrain has a gentle slope from northwest to southeast, which is relatively flat at an altitude of 7.9–19.5 m. The water system is well developed, with Juma River in the south, Daqing River and Baiyangdian Lake in the north, east, and south, and Pinghe River in the southwest. This area belongs to the warm temperate semi-arid monsoon climate with outstanding continental climate characteristics. The annual average temperature is 12.6°C, and the annual extreme maximum temperature is 42°C while the minimum is −24.5°C. The annual average precipitation and evaporation are 464 and 1696.8 mm, respectively. The annual average relative humidity is 65%, and the frost-free period is 192 days. The Jinbao Highway, Jinbao Expressway, and Baojin Intercity Railway under construction run through the whole territory, with 16 km west of Beijing-Guangzhou Railway, 8 km west of Beijing-Hong Kong-Macao Expressway, and 30 km east of Beijing-Kowloon Railway. The geographical position is very advantageous and transportation is convenient. Detailed information is shown in Figure 1.
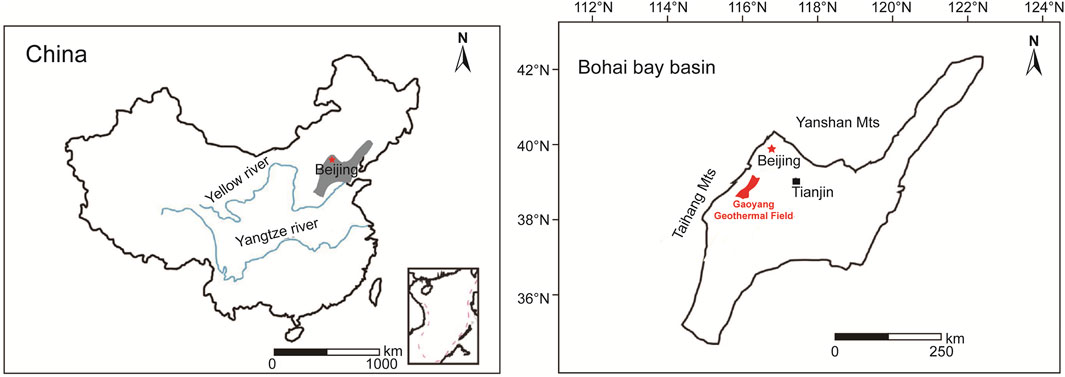
FIGURE 1. Traffic location map of the study area [revised from (Kong et al., 2020)].
Geology
The study area is located in the Bohai Bay Basin, which is a large Mesozoic-Cenozoic intracratonic sedimentary basin filled with Paleocene, Neogene, and Quaternary continental sediments. Among them, the Cenozoic strata including Quaternary, Upper Tertiary, and Lower Tertiary were exposed at the surface. The quaternary system was composed of silt, silty clay, clay, and sand layers. Mountainous areas are mainly distributed in intermountain basins, foothills, and river valleys, with the lithology of sand, gravel, and silt. The plain area is widely distributed, and its lithology is composed of various sand layers, silt, silty clay, and clay. The tertiary system is composed of light mudstone interbedded with sandstone and gravelly sandstone with unequal thickness. The lithology of Eogene is interbedded with sandstone and mudstone of unequal thickness, which is widely distributed in the plain area.
The study area has experienced the Luliang, Caledonian, Haixi, and Indo-China tectonic movements, in which in the main the whole crust rises and falls, while folds, faults, and magmatic activities are weak. After that, the strong Yanshan movement in the Paleocene from the Mesozoic Jurassic to the Cenozoic Eogene and Himalayan movement in Late Tertiary have transformed the North China Basin from a divided uneven fault depression to a nearly unified subsidence-oriented period in the whole region, which lasted until Quaternary. The basin generally accepts Neogene and Quaternary sediments, and unconformity covers its front strata, forming a unified large-scale sedimentary basin, forming the present tectonic pattern of uneven bedrock structure and flat landform landscape under the cover of Cenozoic. The geological structure of the study area is located in the northeast of China-Korea quasi-platform (Grade I), North China fault depression (Grade II), and Jizhong platform depression (Grade III). The main faults in this area are Gaoyang fault and Xushui fault. The Gaoyang fault is located in the normal fault to the west of Gaoyang and Lixian County, striking NE and dipping NW. The throw (vertical displacement) of the fault is approximately 100–550 m, whereas the heave (horizontal displacement) is approximately 43 km. It is a fault that controls the thickness and structure of the Tertiary. The Xushui fault, located in the line from Xu Shui and Anxin to Zhaobeikou, is a boundary between Rongcheng uplift and Baoding fault depression, with a length of about 35 km. It is a positive fault, strikes near the east-west, dips to the south, with an angle of about 45°, a vertical fault distance of 1,200–3,200 m, and a horizontal fault distance of 1,000–2,500 m. This fracture cuts through the crystalline basement and is a long-term active deep fracture.
Geothermal Geological Conditions
According to the sedimentary rhythm cycle of stratigraphic age, development degree of the thermal reservoir, distribution of stable water-resisting layer, and its hydrogeological characteristics, the thermal reservoir in this area is divided into Neogene pore thermal reservoir, and bedrock fissure karst thermal reservoir from top to bottom.
Neogene pore thermal reservoirs are widely distributed in the area, with a buried depth of 500–600 m at the top boundary and 600–950 m at the bottom, shallow in the west and deep in the east. The stratum thickness is 200–700 m, which is generally thin in the north and thick in the south. The lithology of the thermal reservoir is mainly sandstone and gravelly sandstone, mixed with siltstone, with poor diagenesis. The thickness ratio of the hot sand reservoir is in the range of 12.03 and 25.04%, and the thickness of the single sand layer is generally 3–5 m, the maximum thickness is 14 m, and the porosity is 30–33%.
The buried depth of the bedrock thermal reservoir is 3,000 m, including the Jixian, Cambrian, and Ordovician thermal reservoirs. The top buried depth is 3,000–4,500 m. The Ordovician thermal reservoir is composed of carbonate strata of Fengfeng Formation, Cixian Formation, and Majiagou Formation in the Middle Ordovician and Liangjiashan Formation and Yeli Formation in the Lower Ordovician, with a thickness of about 600–800 m, which is missing in the high part of the structure due to denudation. The karst development degree of the thermal reservoir is quite different due to the difference of its top cover, and the fracture karst rate in the area directly covered by Eogene is higher than that in the area covered by Carboniferous-Permian. The average effective porosity of Ordovician thermal reservoir is 3–4%, the ratio of reservoir thickness to reservoir thickness is about 20%, the water inflow of a single well is 150–1,500 m3/d, and the water temperature can reach 34–73°C. The Cambrian thermal reservoir is composed of carbonate strata of Fengshan Formation in the Upper Cambrian and Fujunshan Formation in the Lower Cambrian. The thickness revealed by drilling is 30–70 m, and the lithology is brownish-gray fine-grained dolomite and calcareous dolomite. It is mainly distributed in Baxian County of Jizhong platform depression, Ningjin of Linqing platform depression, and Matouying platform depression of Huanghua platform depression. It belongs to a karst fissure type thermal reservoir, with reservoir thickness accounting for about 10% of the reservoir thickness, average effective porosity of 3–6% and wellhead water temperature of 70–78°C. The thermal reservoir of the Wumishan Formation in the Jixian System is a set of shallow sea facies deposits, with lithology of dolomite and argillaceous dolomite in the middle, and with a total thickness of over 300–1,000 m, developed karst fissures, and good connectivity. The thickness of the thermal reservoir occupies 25–64.2% of the formation thickness, and the average effective porosity is 3–6%. The water inflow of a single well is 400–1,500 m3/d, and the wellhead water temperature reaches 60–80°C, up to 104°C. This thermal reservoir is the best bedrock thermal reservoir in this area.
Data Acquisition
A total of 13 hydrochemical samples were collected on thisoccasion, including 3 geothermal wells in Anxin, 1 geothermal well in Lixian, 3 geothermal wells in Anguo, and 6 geothermal wells in Gaoyang, all of which were carried out in strict accordance with the Code for Geological Exploration of Geothermal Resources (GB/T11615-2010) (Sun et al., 2015a). The distribution of sampling points is shown in Figure 2. The pH value was measured by field sampling hand-held tester, and wellhead temperature was also measured on-site. The remaining data was sent to the laboratory of Beijing Institute of Nuclear Industry Geology for water quality analysis and testing. Samples were tested according to DZ/T0064-93 underground water quality inspection method and GB/T 5750 standard test method for drinking water. Testing instruments include 883 Basic IC plus ion chromatograph, ICS-1100 ion chromatograph, AT-510 automatic titration analyzer, UV-POWER ultraviolet-visible spectrophotometer, B644237471 conductivity meter, and 785 DMP automatic potentiometric titrator, etc. Cations in water samples are mainly determined by atomic absorption spectrometry, while anions are mainly determined by turbidimetry. The balance error of anion and cation is controlled within 5%, which is in line with the error regulation (Yu et al., 2021), and is sufficient to meet the requirements of this study. Test results are shown in Tables 1, 2 below.
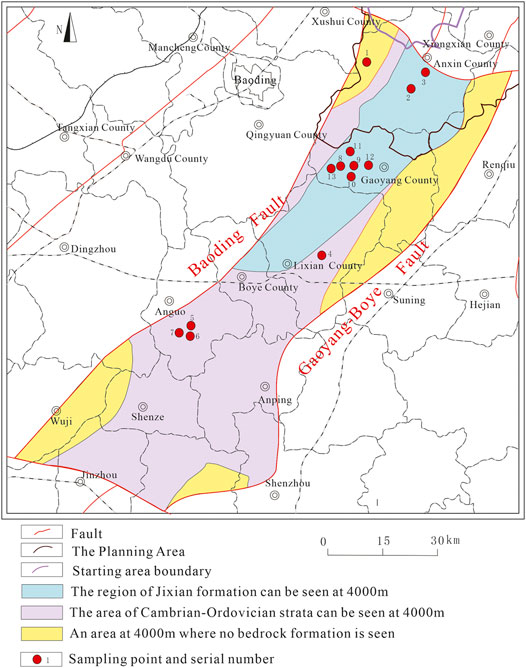
FIGURE 2. Geological sketch of the study area and location map of sampling points.
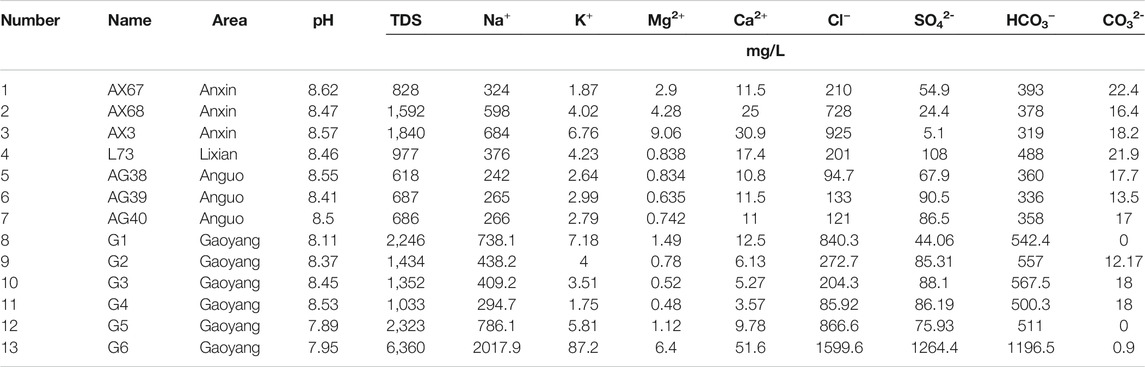
TABLE 1. Main components of water samples in the study area.
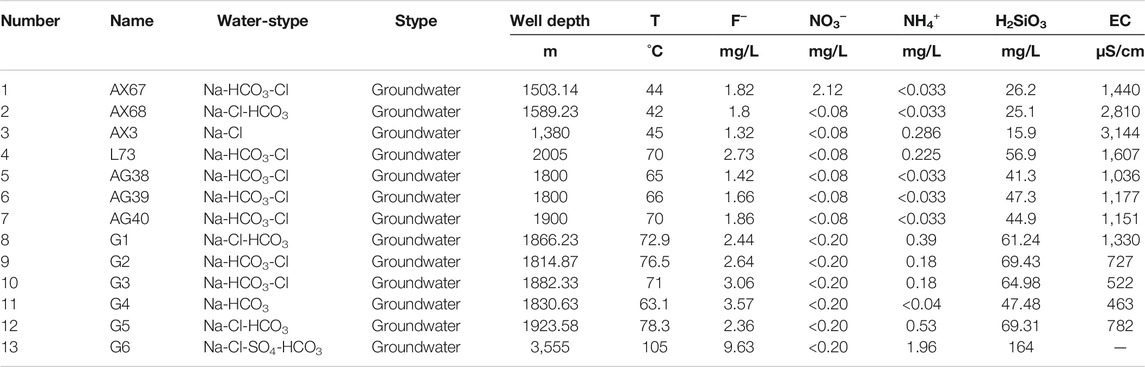
TABLE 2. Secondary component content of water samples in the study area.
Hydrochemical Characteristics of Geothermal Fluids
Hydrochemical Characteristics
As shown in Table 1, the pH value of geothermal fluid in the study area is generally higher than 7, ranging from 7.9 to 8.6, with an average value of 8.4, which is characterized by weak alkalinity. TDS, i.e., total dissolved solids, refers to the total amount of all solutes in water, including the contents of inorganic substances, and organic substances. All these factors determine the conductivity of the aqueous solution. It can be seen from the table that the TDS value of geothermal water is on the high side as a whole, ranging from 618 mg/L to 6,360 mg/L, among which the TDS value of geothermal water in Gaoyang County is the highest, and the TDS of geothermal wells in other counties and areas is positively correlated with the conductivity value of water samples.
The pH value of Gaoyang geothermal well sample points is between 7.9 and 8.4, the wellhead temperature ranges from 63.1° to 105°C, and the TDS ranges from 1,033 mg/L to 6,360 mg/L, with an average value of 2,458 mg/L. The highest point of TDS is G6. The pH value of Anxin geothermal well samples is between 8.47 and 8.62, which is weakly alkaline. The wellhead temperature ranges from 42° to 45°C, and the TDS value ranges from 828 to 1840 mg/L. The wellhead temperature of the L73 water sample point of the Lixian geothermal well is 70°C, the pH value is 8.46, which is weakly alkaline water, and the TDS value is 977 mg/L. The pH value of Anguo city geothermal well sample points is 8.4–8.5, which is weakly alkaline. The wellhead temperature ranges from 65° to 70°C, and TDS ranges from 618 mg/L to 687 mg/L. According to the national standard GB5749-2006 “Sanitary Standard for Drinking Water”, the limit requirement of total dissolved solids (TDS) for drinking tap water is total dissolved solids ≤1,000 mg/L. Therefore, some water samples in the study area do not meet the standard of domestic water.
Piper’s three-line diagram and Durov’s diagram of hydrochemistry are often used to analyze the distribution characteristics of hydrochemistry ions, which directly reflect hydrochemistry types. The triangles at the lower left and right of the Piper three-line diagram are cation and anion regions, respectively. According to the hydrochemical data in this study area, the corresponding Piper three-line diagram and Durov diagram of hydrochemical are drawn, as shown in Figures 3, 4.
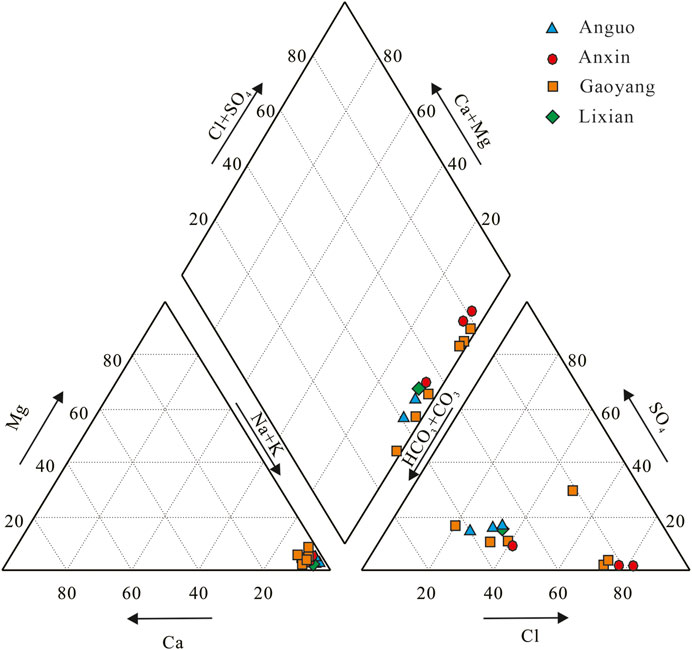
FIGURE 3. Piper three-line diagram of water sample points in the study area.
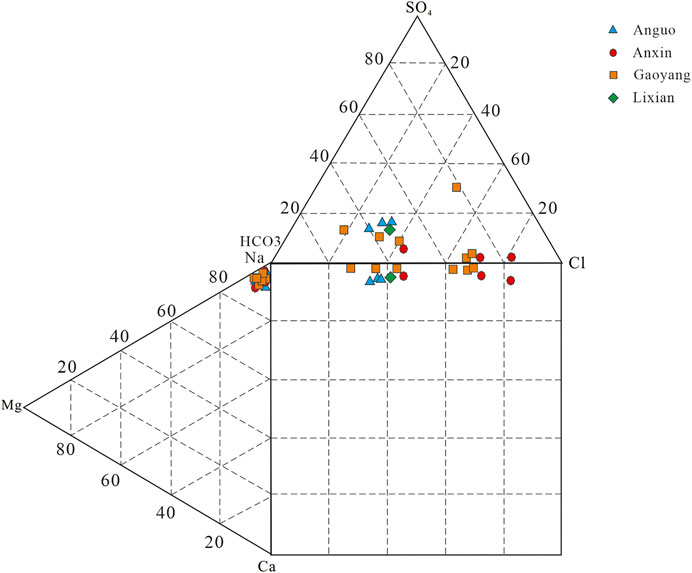
FIGURE 4. Durov diagram of water sample points in the study area.
It can be seen from Figures 3, 4 that the main hydrochemical type of geothermal well sample points in Gaoyang county is Na-HCO3· Cl type. Cations in geothermal water are mainly Na+, while anions are mainly HCO3− and Cl−. The mole percentage of Na+ is over 90%, while HCO3− is mostly between 20 and 60%, and Cl− is between 40 and 80%. The chemical type of a few points such as G6 water is Na-Cl SO4 HCO3. The chemical types of water samples from the Anxin geothermal well are mainly Na-HCO3·Cl and Na-Cl·HCO3. Cations in geothermal water are mainly Na+, while anions are mainly Cl− and HCO3−. The mole percentage of Na+ is over 90%, while Cl− is about 80%, and HCO3− is about 20–50%. The hydrochemical type of Lixian geothermal water sample point is Na-HCO3·Cl type, the main cation is Na+, and the main anions are Cl− and HCO3−. The hydrochemical type of geothermal well samples in Anguo City is Na-HCO3· Cl, with Na+ as the main cation and Cl− and HCO3− as the anions, which is similar to that in Lixian County.
Generally speaking, the thermal water sampling points in the study area are in the range where alkali metal ions are larger than alkaline earth metal ions. The chemical types of water are relatively stable because the sources of Cl− mainly include human activities, deep magma, rock leaching, etc (Brown, 2002; Sun et al., 2015b; Liu, 2018; Zhang et al., 2019; Yu et al., 2021). Combined with the actual situation of the local thermal display area, it is speculated that the groundwater may have undergone sufficient leaching, cation alternating adsorption, and concentration precipitation in the deep thermal reservoir environment at high temperature and high pressure, which finally leads to the water chemistry characteristics as analyzed above.
Hydrochemical Analysis
Generally speaking, by analyzing the ion proportional coefficient and Gibbs diagram of some components in groundwater, the source of hydrochemical components in groundwater and the mechanism of hydrochemical genesis can be studied. The Gibbs diagram often divides the genetic types of hydrochemical components into atmospheric precipitation, water-rock interaction, and evaporation precipitation, with TDS as the ordinate and Na+/(Na+ + Ca2+) and Cl−/(Cl− + HCO3−) as the abscissa on the semi-logarithmic coordinate axis (Gibbs, 1970). Since γNa/γCl coefficient is the basis for analyzing the genesis of groundwater, the author has drawn the ion correlation diagram of γNa/γCl coefficient and Gibbs model diagram of water samples in the study area according to the actual situation of the study area. The detailed information is shown in Figures 5, 6.
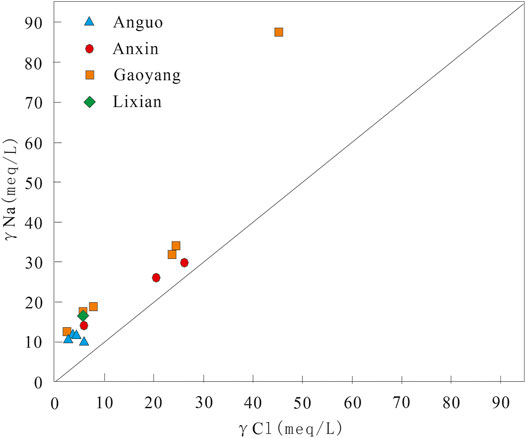
FIGURE 5. Ion correlation diagram of water samples in the study area.
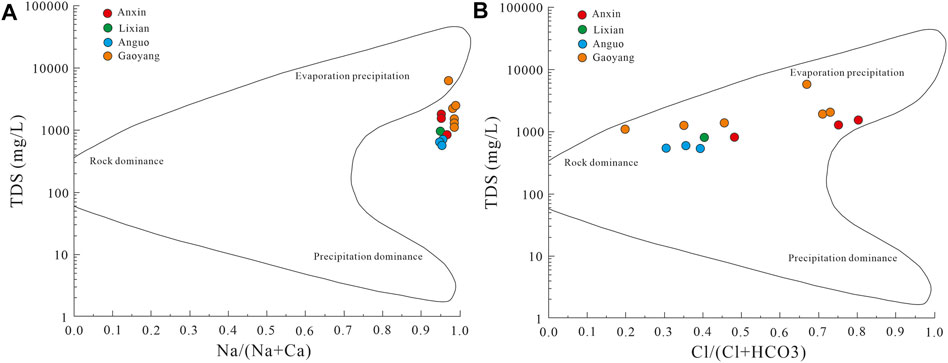
FIGURE 6. Gibbs pattern distribution of water samples in the study area.
The γNa/γCl coefficient is the basis for analyzing the genesis of groundwater. The straight line marked with 1:1 in the Figure is a curve with γNa/γCl value of 1, which indicates that the water source is the dissolved water of salt rock formation. If the γNa/γCl coefficient of the water sample is greater than 1, it means that the source of Na+ in the water is the dissolution of silicate rocks (Sun et al., 2021). It can be seen from Figure 5 that the water sample points in the study area are above the 1:1 curve of γNa/γCl, and the water sample points of some geothermal wells in Gaoyang county are on the upper side, which indicates that the geothermal fluid in the study area belongs to continental sedimentary water. These water sample points are also close to this line, which indicates that the geothermal water is mainly the leaching water of salt rock formation, and there is also silicate dissolution.
According to the Gibbs model diagram in Figure 6, for cations, most of the water samples in the study area fall on the upper right of the diagram, and the range of Na+/(Na+ + Ca2+) value is about 0.9, which indicates that underground hot water is mainly affected by evaporation and precipitation. As for anions, some water samples fall in the upper right of the figure, while the other water samples fall in the middle, and the value of Cl−/(Cl− + HCO3−) ranges from 0.25 to 0.9, which indicates that the geothermal water is affected by evaporation precipitation and water-rock interaction. The reason may be that, when water samples from various areas in the study area flow upward from deep high temperature and high-pressure environment, with the decrease of pressure, deep hot water is mixed with it, and leaching and water-rock interaction occur one after another, which makes the final water hydrochemical composition of the water body form a situation in which Na-HCO3·Cl type is the main body.
Thermal Reservoir Temperature Estimation
In order to evaluate the development potential of the thermal reservoir in the geothermal area, it is necessary to calculate the thermal reservoir temperature of water samples in the geothermal area. The geochemical thermometer method is the most widely used method to estimate the temperature of an underground thermal reservoir. The principle of this method is that at a specific temperature, the chemical reaction between the geothermal water, and the surrounding rock minerals generally reaches equilibrium in a certain period. In the process of reaching the surface, this equilibrium state can be maintained, so that the equilibrium state of the underground thermal reservoir can be calculated. Based on this principle, this study mainly used cation thermometer and silica thermometer for heat storage temperature calculations to estimate the temperature of an underground thermal reservoir (Xu and Guo, 2009).
Cationic Geothermal Thermometer
Nieva et al. put forward a cationic combination thermometer that uses K, Na, Ca, and Mg ions to calculate the temperature of the thermal reservoir (Nieva and Nieva, 1987). Na-K thermometer, Na-K-Ca thermometer, and K-Mg thermometer, etc. are involved with different suitable terms. The K-Na geothermal temperature is often used to estimate the temperature of the deep thermal reservoir with an applicable range of 25–350°C based on the equilibrium between geothermal water and albite/potash feldspar. It should be noted that the mixing of shallow groundwater can induce a bias to the result. Na-K-Ca thermometer is mainly aimed at the medium and low-temperature thermal water and shallow geothermal water with high calcium. The ion variable factors are increased to three types, and correction coefficients are in addition. However, the calculation results have serious deviations when the external environment changes. The K-Mg thermometer is controlled by the exchange reaction among muscovite, potash feldspar, and chlorite, and is suitable for medium and low-temperature geothermal fields distributed in shallow layers with a temperature of 0–250°C. The accuracy of the result is affected by the primary thermodynamic balance due to the change in the concentration of Mg2+ when shallow groundwater is mixed in (Zhao et al., 2020). Based on the cation temperature scale, The established Na-K-Mg triangle diagram can be used to determine the collected water sample type from mature water, mixed water, and immature water. Different geothermal temperature scales are selected to calculate the thermal reservoir temperature based on the water types (Giggenbach Werner, 1988; Wang et al., 2018).
The water samples in the study area all fall in the partial equilibrium region in the Na-K-Mg triangle diagram (Figure 7), which indicates indicate that these geothermal waters have not reached equilibrium due to the water-rock interaction or the mixing processes during up-flowing of thermal water. The Na-K thermometer is suitable to calculate the temperature of a deep high-temperature thermal reservoir but not for that of a shallow thermal reservoir. The Na-K-Ca thermometer is used to calculate medium and low-temperature thermal water and shallow geothermal water with high calcium, but the calculated value will have a large deviation when the mixing phenomenon occurs. The K-Mg thermometer is suitable for shallow geothermal fields with medium and low temperatures, but its calculated value may be affected due to the mixing effect. Therefore, the Na-K and K-Mg thermometers are mainly used within the scope of this study area, as shown in the following formula. The calculated value of the thermal reservoir temperature of the obtained water sample is shown in Table 3.
where t is the value of thermal reservoir temperature to be calculated in °C, and Na, K, and Mg are the concentration of Na+, K+, and Mg2+ in the geothermal fluid in mg/L respectively.
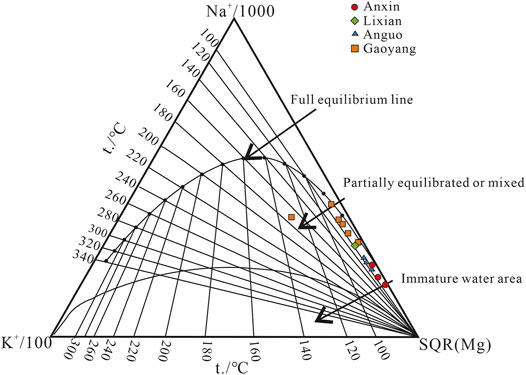
FIGURE 7. The Na-K-Mg triangle diagram of water samples in the study area.
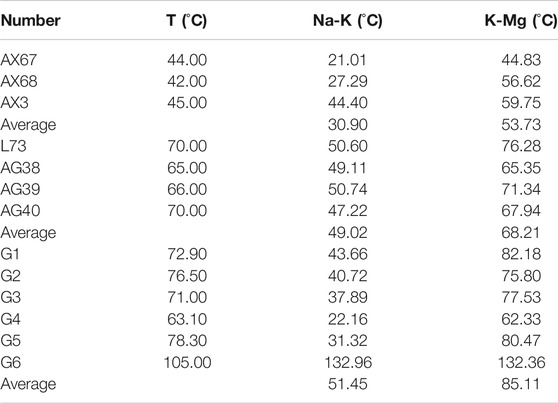
TABLE 3. Estimation results of underground hot water temperature in study area by cationic thermometer.
Silicon Dioxide Geothermal Thermometer
Silica thermometers are the first and most widely used geochemical thermometers in geothermal research; types mainly include quartz thermometers (non-vapor loss), quartz thermometers (maximum loss), chalcedony thermometers (non-vapor loss), and chalcedony thermometers (maximum loss). Silica is generally not easily affected by other ions and volatile components, and its content can remain relatively stable during the thermal fluid cooling process and is suitable for non-acidic, non-diluted geothermal fluid conditions at 20–250°C (Xu and Guo, 2009; Yu et al., 2021). The geothermal water samples in the study area are in partial equilibrium water or mixed water, which is affected by the intrusion of surface cold water.
The temperature of the other water sample points is lower than the local boiling point temperature according to the temperature measured at the sampling point of each water sample except for G6. Therefore, silica non-vapor loss thermometers including quartz non-vapor loss thermometers and chalcedony non-vapor loss thermometers are considered for use. The on-site test temperature of the water sample at G6 is higher than 100°C, so the quartz maximum loss thermometer and the chalcedony maximum loss type thermometer are selected. The calculation formula is shown below, and the calculation results are shown in Table 4 below.
(1) quartz thermometer (non-vapor loss)
(2) quartz thermometer (maximum loss)
(3) chalcedony thermometer (non-vapor loss)
(4) chalcedony thermometer (maximum loss)
where t is the value of thermal reservoir temperature to be calculated in °C, SiO2 is the concentration of SiO2 in mg/L.
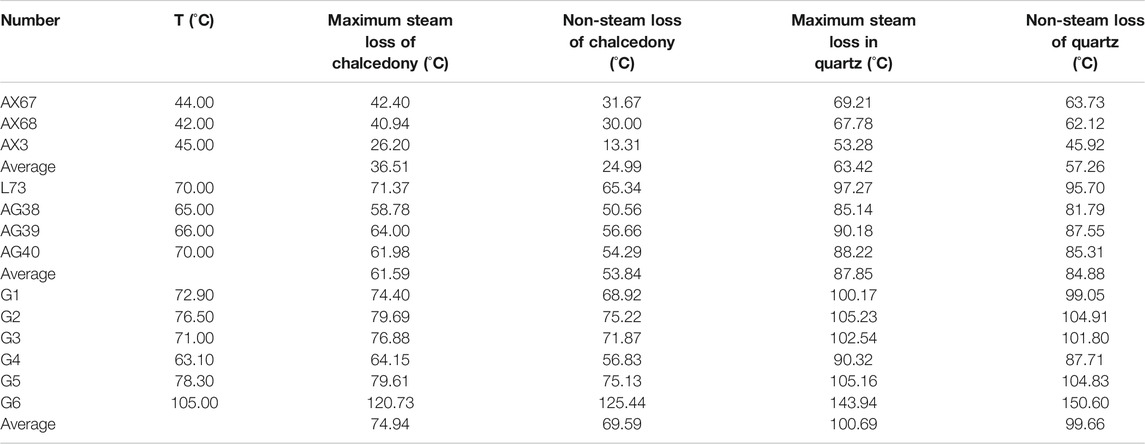
TABLE 4. Estimation results of underground hot water temperature in study area by silica thermometer.
The curve of SiO2 solubility and temperature (Figure 8) can be used to determine the mineral dissolution state and the type of minerals that control the content of SiO2 due to the functional relationship (Lu et al., 2010; Sun et al., 2021). Most of the thermal water samples in the study area are close to the melting curve of quartz and chalcedony, that is, the geothermal water samples in Anxin, Anguo, Lixian, and Gaoyang are between the solubility curves of quartz and chalcedony. Therefore, both quartz and chalcedony thermometers are suitable.
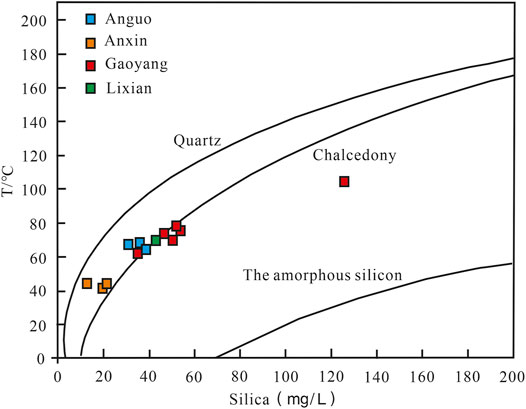
FIGURE 8. Relationship between solubility and temperature of SiO2 in the study area.
Combined with Table 3, through the Na-K thermometer and K-Mg thermometer in the cation thermometer, it can be concluded that the average temperature in the Anxin area is 30.9°C and 53.73°C respectively, in the Lixian area is 50.6°C and 76.28°C respectively, the Anguo area 49.02°C and 68.21°C respectively, and the Gaoyang area is 51.45°C and 85.11°C respectively. Obviously, the temperature of the geothermal field in the Gaoyang area is relatively the highest. However, due to the large deviation of the calculation results due to the presence of the mixing of thermal and cold water, the calculated results of the K-Mg thermometer are higher for each region. The Na-K thermometer is suitable for estimating the temperature of deep thermal reservoirs, but not suitable for estimating that of a shallow one.
In combination with Table 4, it shows that the temperature of some water sample points obtained by using a chalcedony thermometer is lower than the temperature measured at the time of collection, which is inconsistent with the facts. Therefore, for the point where the sampling temperature is lower than 100°C, the result of the quartz non-vapor loss type thermometer is adopted; for G6, where the sampling temperature is higher than 100°C, the result of the quartz maximum loss type thermometer is adopted. Combined with the previous analysis of applicable conditions and scope, the value of the quartz thermometer is used for the shallow thermal reservoir temperature of various thermal fields, and the values of the Na-K thermometer and quartz thermometer are used for the deep thermal reservoir temperature of various thermal fields. Therefore, it can be seen that the shallow thermal reservoir temperature range is about 45–63°C in Anxin, 76–95°C in Lixian, 81–87°C in Anguo, and 87–104°C in Gaoyang. The temperature range of the deep thermal reservoir in the entire study area is about 104–150°C.
Conclusion
(1) The study area is located in the northeast of the China-Korea quasi-platform (Grade I), North China fault depression (Grade II), and Jizhong platform depression (Grade III). The main faults in this area are the Gaoyang fault and the Xushui fault, which provide a good migration channel for geothermal water. Neogene pore thermal reservoirs and bedrock fissure karst thermal reservoirs are widely distributed in this region, in addition, the karst fissures are well developed and have good connectivity, which is a thermal reservoir with good conditions.
(2) The main hydrochemical type of the Gaoyang geothermal field is Na-HCO3·Cl, with high TDS contents. The Gibbs diagram and ion ratio analysis proves that when the geothermal water flows upward from the deep high temperature and high-pressure environment, as the pressure of the surrounding environment decreases and the mixing with the deep thermal water occurs, leaching and alternating cation adsorption occur. And the intense water-rock reaction leads to the high TDS values of geothermal water.
(3) The mixing of shallow cold recharge with the ascending thermal fluids through faults is confirmed by the presence of water partially in equilibrium from the Na-K-Mg triangle diagram. The shallow thermal reservoir temperature is about 45–63°C in Anxin, 76–95°C in Lixian, 81–87°C in Anguo, and 87–104°C in Gaoyang, respectively. The temperature range of the deep thermal reservoir in the entire study area is about 104–150°C.
Data Availability Statement
The original contributions presented in the study are included in the article/Supplementary Material, further inquiries can be directed to the corresponding authors.
Author Contributions
All authors listed have made a substantial, direct, and intellectual contribution to the work and approved it for publication.
Funding
This study was financially supported by the National Key R&D Program of China (2018YFC0604302 and 2019YFB1504102) and China Geological Survey (DD20189114).
Conflict of Interest
The authors declare that the research was conducted in the absence of any commercial or financial relationships that could be construed as a potential conflict of interest.
Publisher’s Note
All claims expressed in this article are solely those of the authors and do not necessarily represent those of their affiliated organizations, or those of the publisher, the editors and the reviewers. Any product that may be evaluated in this article, or claim that may be made by its manufacturer, is not guaranteed or endorsed by the publisher.
Acknowledgments
We appreciate the kind help of the editor and anonymous reviewers.
References
Brown, G. H. (2002). Glacier Meltwater Hydrochemistry. Appl. Geochem. 17 (7), 855–883. doi:10.1016/s0883-2927(01)00123-8
Gibbs, R. J. (1970). Mechanisms Controlling World Water Chemistry. Science 170 (3962), 1088–1090. doi:10.1126/science.170.3962.1088
Giggenbach Werner, F. (1988). Geothermal Solute Equilibria. Derivation of Na-K-Mg-Ca Geoindicators[J]. Pergamon 52 (12), 2749–2765. doi:10.1016/0016-7037(88)90143-3
Hu, Q., Gao, J., Ma, F., Zhao, Z., Liu, G., Wang, G., et al. (2020). Dynamic Prediction of Geothermal Recoverable Resources in the Rongcheng Uplift Area of the Xiong’an New Area[J]. Acta Geol. Sin. 94 (7), 2013–2025. doi:10.19762/j.cnki.dizhixuebao.2020230
Kong, Y., Pang, Z., Pang, J., Li, J., Lyu, M., and Pan, S. (2020). Fault-Affected Fluid Circulation Revealed by Hydrochemistry and Isotopes in a Large-Scale Utilized Geothermal Reservoir. Geofluids 2020, 1–13. doi:10.1155/2020/2604025
Liu, M., He, T., Wu, Q., and Guo, Q. (2020). Hydrogeochemistry of Geothermal Waters from Xiongan New Area and its Indicating Significance[J]. Earth Sci. 45 (6), 2221–2233. (in Chinese).
Liu, X. (2018). Study on Groundwater and Soil Environmental Response in Opencast Coal Mine Area [D]. Inner Mongolia: Inner Mongolia University.
Lu, Z., Wu, L., and Luo, X. (2010). Application of Geothermometers to Calculate the Temperature of Geothermal Reservoirs in Wudang Area of Guiyang [J]. Geotechn. Invest. Surv. 45 (6), 832–836.
Ma, F., Wang, G., Zhang, W., Zhu, X., Zhang, H., and Yue, G. (2020). Structure of Geothermal Reservoirs and Resource Potential in the Rongcheng Geothermal Filed in Xiong’an New Area. Acta Geologica Sinica 94 (7), 1981–1990. doi:10.19762/j.cnki.dizhixuebao.2020217
Nieva, D., and Nieva, R. (1987). Developments in Geothermal Energy in Mexicoâ Part Twelve. A Cationic Geothermometer for Prospecting of Geothermal Resources[J]. Heat Recovery Syst. CHP 7 (3), 243–256. doi:10.1016/0890-4332(87)90138-4
Pang, Z., Kong, Y., Pang, J., Hu, S., and Wang, J. (2017). Geothermal Resources and Development in Xiongan New Area[J]. Bull. Chin. Acad. Sci. 32 (11), 1224–1230. doi:10.16418/j.issn.1000-3045.2017.11.007
Sun, H., Ma, F., Zhao, L., Liu, Z. M., Wang, G. L., and Nan, D. W. (2015). The Distribution and Enrichment Characteristics of Fluoride in Geothermal Active Area in Tibet[J]. China Environ. Sci. 35 (1), 251–259. (in Chinese).
Sun, H., Ma, F., Lin, W., Liu, Z., Wang, G., and Nan, D. (2015). Geochemical Characteristics and Geothermometer Application in High Temperature Geothermal Field in Tibet[J]. Geol. Sci. Techn. Inf. 34 (3), 171–177.
Sun, H., Lang, X., Nan, D., Liu, Z., Guo, N., Li, H., et al. (2021). Geothermal Water Genesis and Engineering Effect in Saga Chongqu Basin Tibet[J]. Safety and Environmental Engineering 28 (3), 147–155. doi:10.13578/j.cnki.issn.1671-1556.20210021
Wang, X., Wang, G., Lu, C., Gan, H., and Zhao, L. (2018). Evolution of Deep Parent Fluids of Geothermal fields in the Nimu–Nagchu Geothermal belt, Tibet, China[J]. Geothermics 71, 118. doi:10.1016/j.geothermics.2017.07.010
Wang, Z., Zhang, C., Jiang, G., Hu, J., Tang, X., and Hu, S. (2019). Present-day Geothermal Field of Xiongan New Area and its Heat Source Mechanism[J]. Chin. J. Geophys. 62 (11), 4313–4322. (in Chinese). doi:10.6038/cjg2019M0326
Wang, G., Gao, J., Zhang, B., Xing, Y., Zhang, W., and Ma, F. (2020). Study on the thermal Reservoir Characteristics of the Wumishan Formation and Huge Capacity Geothermal Well Parameters in the Gaoyang Low Uplift Area of Xiong’an New Area. Acta Geol. Sin. 94 (7), 1970–1980. doi:10.19762/j.cnki.dizhixuebao.2020235
Wang, G., Zhang, H., Zhang, W., and Ma, F. (2021). Development and Utilization of Geothermal Resources in Xiongan New Area [J]. China High-Tech 1, 46–47.
Wang, S., Zhang, B., Li, Y., Xing, Y., Yuan, W., Li, J., et al. (2021). Heat Accumulation Mechanism of Deep Ancient Buried hill in the Northeast of Gaoyang Geothermal Filed, Xiong’an New Area[J]. Bull. Geol. Sci. Techn. 40 (3), 12–21. (in Chinese). doi:10.19509/j.cnki.dzkq.2021.0319
Yu, H., Liu, Z., Rong, F., Chen, K., Nan, D., Liu, S., et al. (2021). Characteristics and Source Mechanism of Geothermal Field in Cuona, Tibet[J]. Bull. Geol. Sci. Techn. 40 (3), 34–44. doi:10.19509/j.cnki.dzkq.2021.0318
Zhang, X., Hao, H., Liu, K., Mao, W., Xiao, Y., et al. (2019). Hydrogeochemical Characteristics and Formation of the Ivory Spring in Jiacha County of Tibet[J]. Hydrogeol. Eng. Geol. 46 (4), 1–9. doi:10.16030/j.cnki.issn.1000-3665.2019.04.01
Keywords: genesis mechanism, deep geothermal fluid, gaoyang, water chemical characteristics, thermal reservoir temperature
Citation: Xing Y, Yu H, Liu Z, Li J, Liu S, Han S and Wang G (2022) Study on Chemical Genesis of Deep Geothermal Fluid in Gaoyang Geothermal Field. Front. Earth Sci. 9:787222. doi: 10.3389/feart.2021.787222
Received: 30 September 2021; Accepted: 08 December 2021;
Published: 02 February 2022.
Edited by:
Yinhui Zuo, Chengdu University of Technology, ChinaReviewed by:
Wei Xu, Xi’an Jiaotong University, ChinaYing Li, China Earthquake Administration, China
Copyright © 2022 Xing, Yu, Liu, Li, Liu, Han and Wang. This is an open-access article distributed under the terms of the Creative Commons Attribution License (CC BY). The use, distribution or reproduction in other forums is permitted, provided the original author(s) and the copyright owner(s) are credited and that the original publication in this journal is cited, in accordance with accepted academic practice. No use, distribution or reproduction is permitted which does not comply with these terms.
*Correspondence: Haowen Yu, eXVoYW93ZW4wNjg4QDE2My5jb20=; Jie Li, bGlqaWVAYm51LmVkdS5jbg==; Guiling Wang, Z3VpbGluZ3dAMTYzLmNvbQ==