 Yuan Yuan1,2
 Jijin Yang1,2,3*
- 1Key Laboratory of Shale Gas and Geoengineering, Institute of Geology and Geophysics, Chinese Academy of Sciences, Beijing, China
- 2Innovation Academy of Earth Science, Chinese Academy of Sciences, Beijing, China
- 3College of Earth and Planetary Sciences, University of Chinese Academy of Sciences, Beijing, China
Mud shale can serve as source or cap rock but also as a reservoir rock, and so the development of pores or cracks in shale has become of great interest in recent years. However, prior work using non-identical samples, varying fields of view and non-continuous heating processes has produced varying data. The unique hydrocarbon generation and expulsion characteristics of shale as a source rock and the relationship with the evolution of pores or cracks in the reservoir are thus not well understood. The present work attempted to monitor detailed structural changes during the continuous heating of shale and to establish possible relationships with hydrocarbon generation and expulsion by heating immature shale samples while performing in situ scanning electron microscopy (SEM) imaging and monitoring the chamber vacuum. Samples were heated at 20°C/min from ambient to 700°C with 30 min holds at 100°C intervals during which SEM images were acquired. The SEM chamber vacuum was found to change during sample heating as a consequence of hydrocarbon generation and expulsion. Two episodic hydrocarbon expulsion stages were observed, at 300 and 500°C. As the temperature was increased from ambient to 700°C, samples exhibited consecutive shrinkage, expansion and shrinkage, and the amount of structural change in the vertical bedding direction was greater than that in the bedding direction. At the same time, the opening, closing and subsequent reopening of microcracks was observed. Hydrocarbon generation and expulsion led to the expansion of existing fractures and the opening of new cracks to produce an effective fracture network allowing fluid migration. The combination of high-resolution SEM and a high-temperature heating stage allowed correlation between the evolution of pores or cracks and hydrocarbon generation and expulsion to be examined.
1 Introduction
The use of shale has expanded from traditional applications as source rock and cap rock to that of reservoir, and the hydrocarbon-bearing capacity of this rock is closely related to the characteristics of the pore systems within the shale (Ross and Bustin, 2007; Ross and Bustin, 2008; Ross and Marc Bustin, 2009). Many studies have examined the storage space available in shale in terms of pore characteristics, including the size, shape, spatial distribution and connectivity of pores and fractures as evaluated from two-dimensional and three-dimensional perspectives (Loucks et al., 2012; Clarkson et al., 2013; Sun et al., 2015; Yang et al., 2017; Goral et al., 2019; Maojin et al., 2019; Zhao et al., 2019). In contrast to standard hydrocarbon reservoirs, shale is rich in organic matter and so contains pores and fractures in this organic component in addition to pores in inorganic minerals. These organic pores and fractures play an essential role in the accumulation and development of oil and gas in shale (Curtis et al., 2012). The characteristics and formation mechanisms of organic pores and fractures are fundamentally different from those of pores in inorganic phases, and have both primary and secondary origins. Secondary organic matter pores and fractures are those that are newly generated in the organic matter during the thermal maturation process and represent the primary storage spaces in shale (Zhang et al., 2016; Mastalerz et al., 2018; Misch et al., 2019). The hydraulic fracturing technologies become a necessity to exploit the unconventional shale resources. The swelling of some clay minerals in shale account for large amount of fracturing liquid retention (Meng et al., 2020), which hinders gas flow. Structural transformation of the reservoir caused by thermal treatment after hydraulic fracturing that could allow the secondary exploitation of shale gas and enhance the recovery of shale gas reservoirs (Wang et al., 2019; Yuan et al., 2019; Liu et al., 2020). Shale is also one of the main rocks for underground high-temperature operations. Therefore, the design of formation stability should consider the impact of structural changes resulting from heating (Tsang et al., 2005; Nasir et al., 2014; Zheng et al., 2017).
Structural changes in rocks such as shale, sandstone and coal resulting from thermal effects have been investigated (Castagna et al., 2014; Giliazetdinova et al., 2017; Kim et al., 2019; Saif et al., 2016; Saif et al., 2017a; Panahi et al., 2019; Saif et al., 2017b; Figueroa Pilz et al., 2017; Panahi et al., 2018; Panahi et al., 2013; Saif et al., 2019; Kobchenko et al., 2011; Shu et al., 2020; Gautam et al., 2019; Gan et al., 2021; Nieto-Delgado et al., 2021; Hajpál and Török, 2004; Tian et al., 2012; Mahanta et al., 2020; Sun et al., 2016) through the analysis of samples cooled after heating (Saif et al., 2017a; Panahi et al., 2019; Saif et al., 2017b) or via real-time monitoring and analysis during heating (Figueroa Pilz et al., 2017; Panahi et al., 2018; Panahi et al., 2013; Saif et al., 2019; Kobchenko et al., 2011). The first approach may be affected by modification to the sample structure during cooling. At present, the real-time analysis of structural changes in shale as a consequence of heating/cooling often uses X-ray microscopy four-dimensional analysis (that is, time plus three-dimensional imaging) (Figueroa Pilz et al., 2017; Panahi et al., 2018; Panahi et al., 2013; Saif et al., 2019; Kobchenko et al., 2011). In this manner, real-time changes in structure can be monitored on the millimeter to micrometer size scale, depending on the resolution of the instrumentation[(Saif et al., 2017a; Panahi et al., 2019), (Saif et al., 2017a; Panahi et al., 2019)][ (Panahi et al., 2013; Panahi et al., 2018)]. Therefore, understanding structural changes on the sub-micrometer scale will require more advanced tools with better resolution.
Environmental scanning electron microscopy (SEM) in conjunction with a heating stage has been used to obtain images of polished shale samples during the heating process to evaluate structural changes (Dahl et al., 2015; Camp et al., 2017). Because this technique provides better spatial resolution compared with X-ray microscopy, it has provided additional details concerning structural variations, although the data are not completely satisfactory. When examining structural changes in shale, it is important to note that shale is a source rock. This is important because the generation and discharge of hydrocarbons from source rocks will form new pores and micro-cracks that increase the storage space and migration channels available for hydrocarbons. The evolution of fracture networks in elastic media as a result of the internal generation and expulsion of CO2 has been examined[(Kobchenko et al., 2014)], and the resulting data can be used to understand the formation of pores or micro-cracks in shale. Fluid pressure is also a very important parameter related to the discharge of hydrocarbons from shale during heating (Panahi et al., 2019). Again, environmental SEM with a heating stage is a very helpful means of understanding hydrocarbon generation and expulsion based on observing the movement of shale particles during heating (Yan et al., 2003). However, the generation and discharge of hydrocarbons and the structural evolution of shale have generally been investigated separately, such that the manner in which these processes interact with one another is still unknown.
This paper proposes a new experimental method that elucidates the relationship between hydrocarbon generation and expulsion and structural changes in shale. In this work, immature shale samples were polished using an Ar ion beam and then set on a heating stage inside a high-resolution field emission scanning electron microscope. Samples were subsequently heated from room temperature to 700°C with continuous evaluation of the vacuum level while acquiring images of the sample surface at specific temperatures. Variations in the vacuum level were used to assess the hydrocarbon generation and expulsion process while the high-resolution images were employed to characterize the structural evolution of the sample during the heating process. These data were used to examine the correlation between structural evolution and the hydrocarbon generation and expulsion process.
2 Materials and Methods
2.1 Sample Material
The shale sample used in this study was obtained from the Xiamaling Formation in the Xiahuayuan area of Hebei Province, China (Figure 1). The Xiamaling Formation, which is primarily located in the northern Taihangshan and Yanshan regions and is in unconformable contact with the underlying Tieling Formation, is rich in organic matter resulting from marine deposits during the Proterozoic to Lower Paleozoic eras in northern China. A portion of a fresh outcrop with a black coloration was collected using a portable drilling machine to obtain the experimental specimen. The bedding layer associated with this sample was readily identified (Figure 2) and had a TOC value of 6 0.15 wt%. Parts of the outcrop shale sample were ground into powder using a sample crusher and a pyrolysis analysis of the powder sample was performed using a Rock Eval six device. This analysis showed a Tmax value of 429°C, indicating that the sample was at an immature stage of development and thus is suitable for thermal simulation experiments.
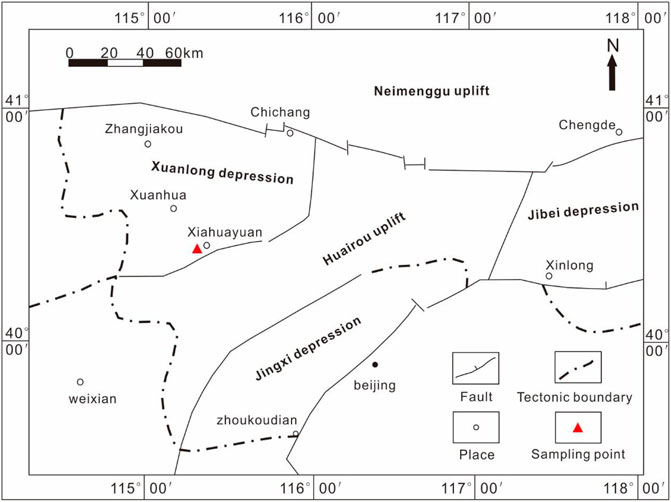
FIGURE 1. The location at which outcrop samples were drilled from the Middle Proterozoic Xiamaling Formation (Shi et al., 2018).
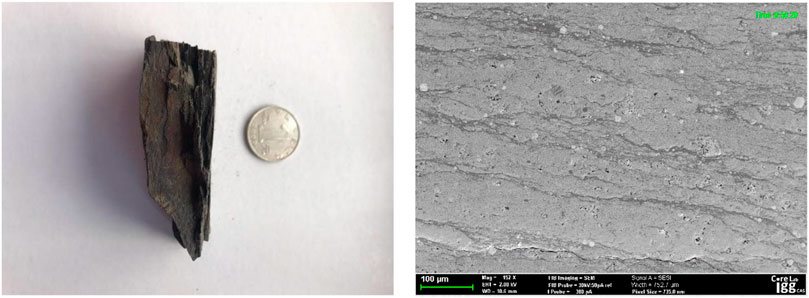
FIGURE 2. A photographic image and scanning electron microscopy image of the Xiamaling shale specimen.
2.2 Experimental Method
Sample preparation and in situ heating inside the scanning electron microscope were performed at the Core Laboratory of the Institute of Geology and Geophysics, Chinese Academy of Sciences.
2.2.1 Sample Preparation
The shale was processed to fabricate specimens with sizes of approximately 3 × 3 × 0.5 mm, big enough to include all the interested features for this study, such as organic matter and minerals. This size was selected to control gas generation from the samples during the heating process to avoid contaminating the scanning electron microscope. The top surface of each sample was mechanically polished and then further polished using an Ar ion beam polisher (Baygon ArBIB 100). Because shale is normally found in water-based underground environments, each sample was immersed in water for 24 h before being heated.
2.2.2 In-situ Heating SEM Observation
As noted, a field emission scanning electron microscope (Zeiss Crossbeam 540) was used to acquire images, employing a chamber vacuum pressure of 10–7mbar, accelerating voltage of 0.02–30 kV and spatial resolution of 0.9 nm at 15 kV. The instrument was equipped with a heating device (Kammrath & Weiss; Figure 3) that included a water-cooling system, heating stage up to 1,050°C, controller and control software. This combination of a heating device and scanning electron microscope allowed in situ SEM observations while heating the shale samples.
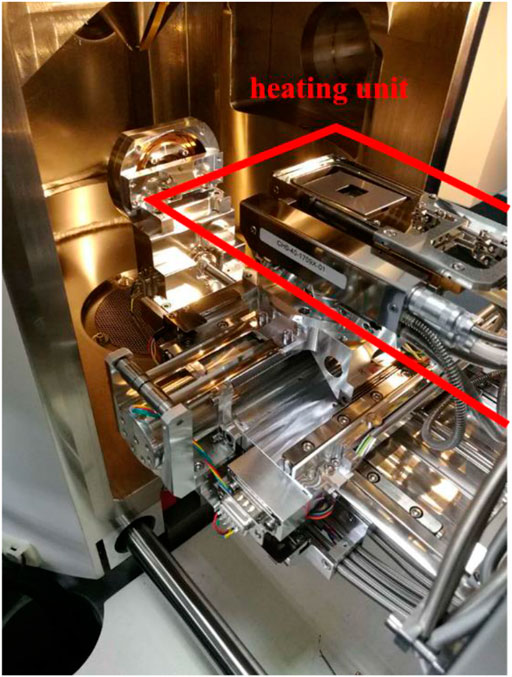
FIGURE 3. The heating device in the scanning electron microscope.
Before each sample was transferred into the SEM, a heating lamp was used to heat the material for approximately 20 s to evaporate residual moisture from the surface. The sample was then quickly transferred into the groove of the heating stage and moved into the SEM imaging position. The heating rate was set to 20°C/min and the sample was heated to 100, 200, 300, 400, 500, 600 and 700°C and held at each of these temperatures for 30 min, during which time SEM images were acquired over the same field of view. The SEM chamber vacuum level was also continuously recorded during the whole process.
3 Results
3.1 Temperature Control and Chamber Vacuum
3.1.1 Temperature Control Process
The temperature of the heating stage as a function of heating time is shown in Figure 4. The detailed process has already been provided in 2.2 Experimental method.
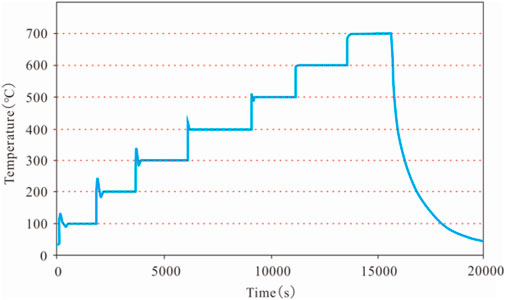
FIGURE 4. Heating stage temperature as a function of time.
3.1.2 SEM Vacuum During the Temperature Control Process
The initial SEM chamber vacuum was approximately 5 × 10⁻⁶ mbar. The vacuum level was monitored and recorded continuously during the entire heating process from room temperature to 700°C, as shown in Figure 5. It can be seen that the chamber vacuum changed simultaneously with the sample temperature. Specifically, each heating stage caused the system vacuum to drop rapidly (absolute pressure goes up) while the vacuum remained basically unchanged during each constant temperature stage. The extent of the vacuum drop was also different depending on the heating stage, with the greatest vacuum change over the 300 and 500°C heating stages. These changes in the vacuum level are attributed to gases entering the vacuum chamber.
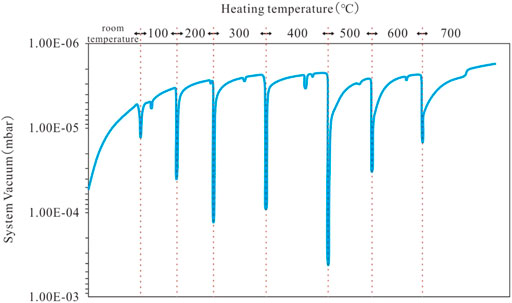
FIGURE 5. The SEM chamber vacuum level as a function of temperature.
3.2 Structural Changes Caused by Heating
3.2.1 Structural Changes Observed in SEM Images During Heating
During the heating experiments, some fields of view were randomly selected, and images of these fields of view were collected with the same magnification after each temperature was stabilized. For each field of view, eight images were collected at each different temperature from ambient to 700°C. Figure 6 presents an example of the SEM images acquired from one field of view using the same magnification as the temperature was increased.
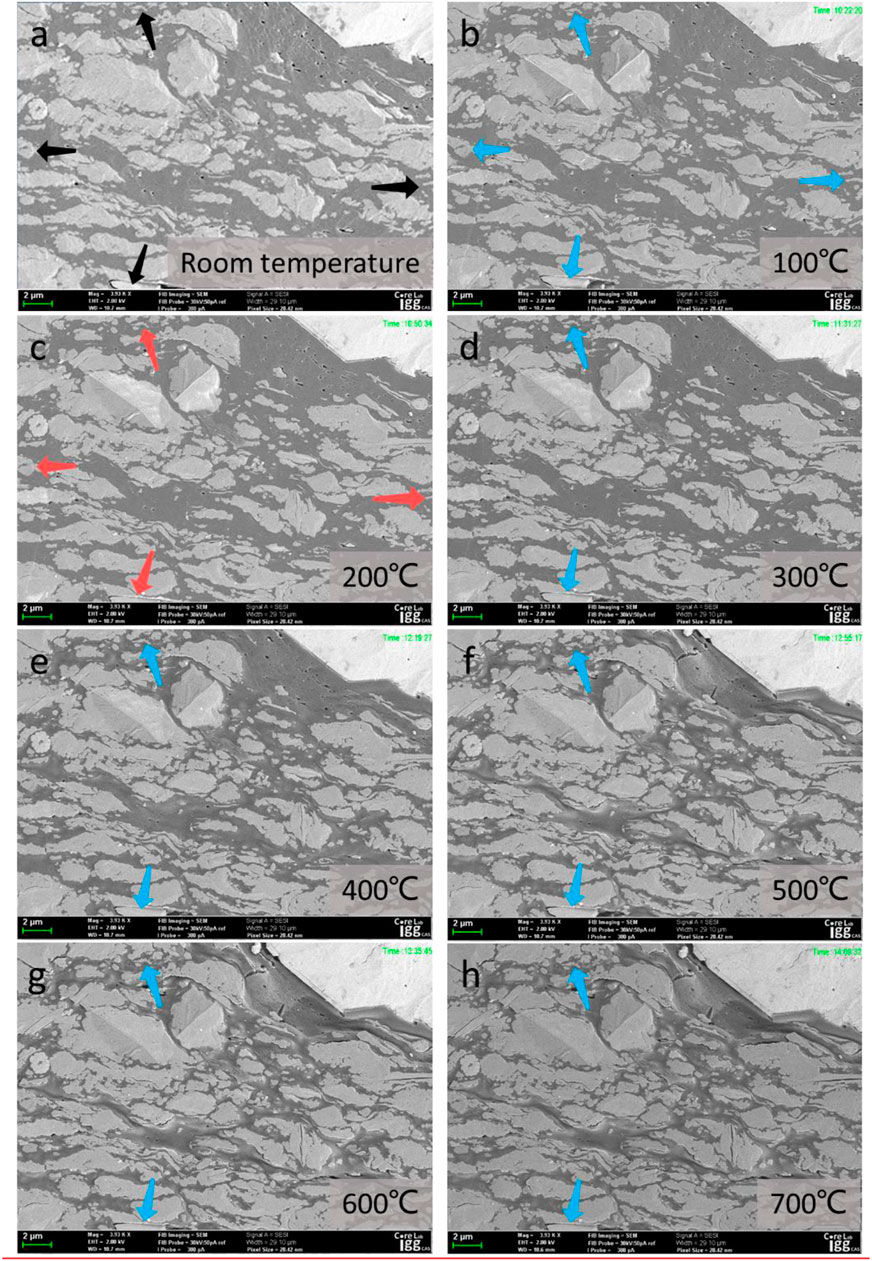
FIGURE 6. SEM images of one field of view using the same magnification at eight different temperatures. (A) Black arrows squares indicate characteristic particles used for comparison. (B–H) Blue arrows show the inward movement of characteristic particles, indicating sample shrinkage. Red arrows show the outward movement of characteristic particles, indicating sample expansion.
From these images, it is evident that increasing the temperature caused particles at the edges of the SEM images or within the internal structure of the field of view to migrate. As an example, comparing the image edges at room temperature and 100°C, the particles at the edges at 100°C moved inwards (see Figures 6A,B), indicating that the sample shrunk. When the temperature was increased from 100 to 200°C, some of the characteristic particles at the image edges moved outward (Figures 6B,C), indicating that the sample expanded. Starting from 300°C, the images show that the sample structure changed differently in different directions (Figures 6D–H). Along the direction perpendicular to the bedding plane, the characteristic particles continued to move inward, confirming continuous shrinkage with temperature, while the characteristic particles in the direction parallel to the bedding plane exhibited no obvious changes. After the sample temperature stabilized at each stage, no further significant changes were observed.
Considering the microscale images in Figure 7, more detailed information can be obtained, such as the evident expansion and closure of micro-cracks in the early and middle stages of heating (below 400°C), which was also observed in some earlier work[ (Figueroa Pilz et al., 2017), (Panahi et al., 2018), (Saif et al., 2019), (Kobchenko et al., 2014)]. New, large cracks appeared in most of the field of view between 400 and 500°C and previously existing cracks expanded (Figure 8). The structures in the sample having previously existing fractures transformed earlier than the areas without these previously existing fractures. It is also apparent that, once a large crack was formed, it was not closed again (Figure 8). These large cracks would be expected to grow smaller or even disappear under geological conditions in response to overlying pressure.
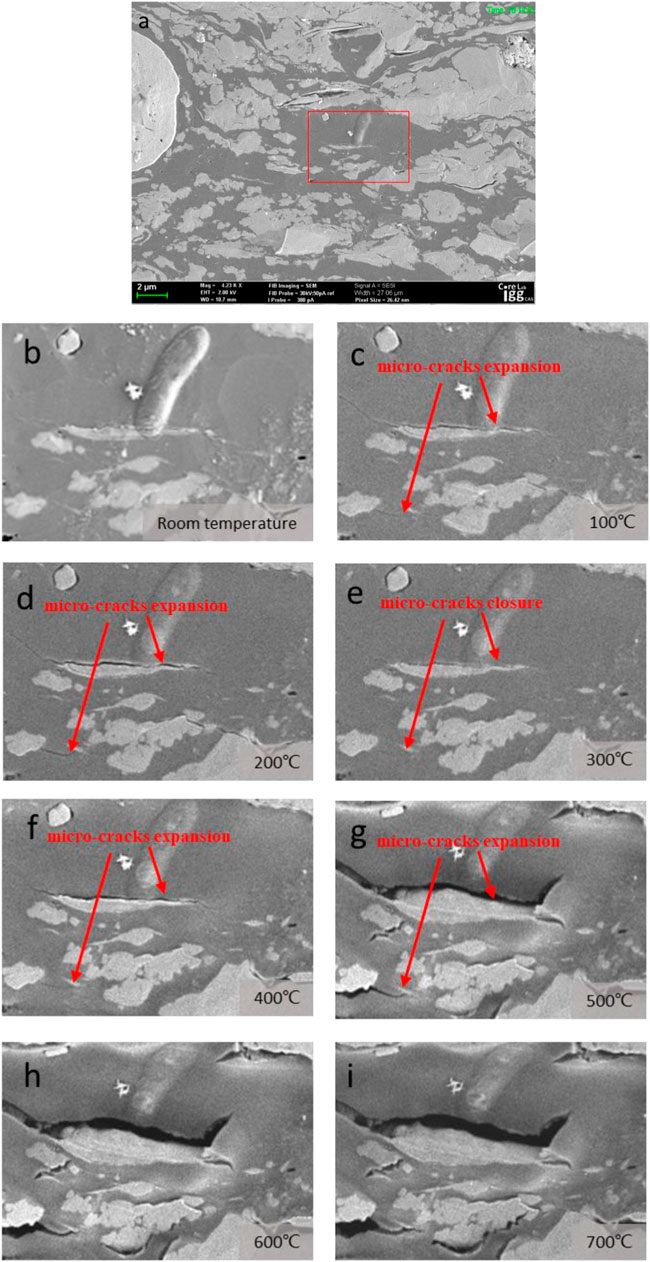
FIGURE 7. The expansion - closure-expansion phenomenon exhibited by micro-cracks in the sample with temperature changes. Images show regions in which micro-cracks (A) occurred, (B-D) expanded continuously, (D,E) closed, and (E-I) continuously expanded again.
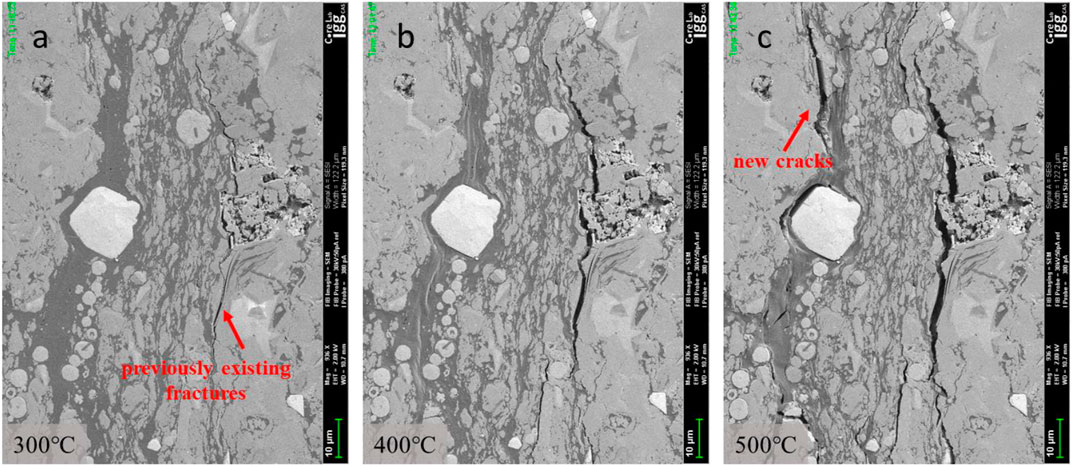
FIGURE 8. The expansion and generation of micro-cracks in the sample with temperature change. (A) A previously existing micro-crack, (B) the expansion of a previously existing micro-crack, (C) the formation of a new micro-crack and expansion of a previously existing micro-crack.
3.2.2 Structural Changes in Different Directions During Heating
It can be seen from the hand specimen that the bedding of the shale sample was well-developed. In addition, striped organic matter can be observed in the SEM images, indicating that the bedding direction was nearly horizontal (Figure 2), and the development of the bedding had a significant effect on the heat transfer within the material. Specifically, the thermal conductivity of the shale was different in different directions, such that the thermal conductivity of the parallel bedding was higher than that of the vertical bedding (Gabova et al., 2020). As inorganic minerals in the sample shrank due to the loss of water, they contracted in both the horizontal and vertical directions during the initial stage of heating and then expanded with temperature, although the magnitude of change was different in both directions (Figure 6). In the later stage of heating, cracks were formed mostly in the parallel bedding direction (Figures 8, 9), with some in the vertical bedding direction (Figure 9), similar to behavior observed in earlier work[ (Panahi et al., 2019)][ (Kobchenko et al., 2011; Panahi et al., 2013; Figueroa Pilz et al., 2017; Panahi et al., 2018; Saif et al., 2019)].
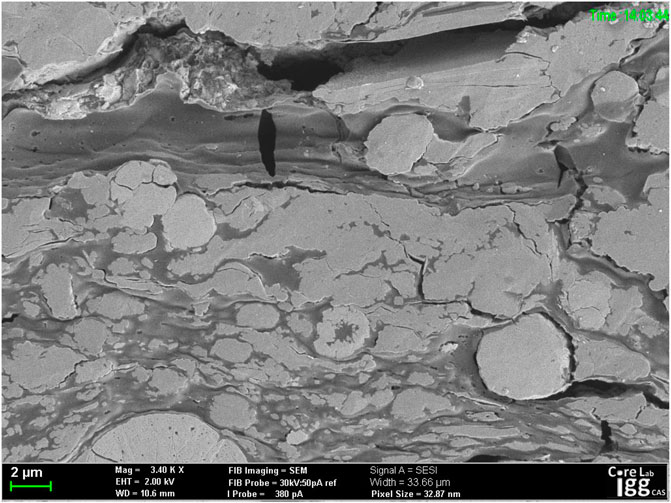
FIGURE 9. Crack distribution in a sample at 700°C in the parallel and vertical bedding directions.
Characteristic particles were selected in SEM images and the positions of these particles were determined at different temperatures. The majority of these measurement points were concave or protruding regions on the edges of the characteristic particles. Migration distances were measured only perpendicular (about 80–90) and parallel (about 0–10) to the bedding plane, using the entire field of view. A total of 16 measurements were taken at each temperature with 128 measurements over regions with areas from 402 to 9,679 μm2 at eight different temperatures. The linear expansion coefficient (α) for a specific temperature range in a given direction could be calculated as
where ΔL is the difference between the distance measured at temperature Tf and that at a previous temperature Ti, and ΔT is the temperature difference (Tf-Ti). A value of α > 0 indicates that the sample expanded while a result of less than 0 indicates shrinkage. It should also be pointed out that these measurements deliberately avoided newly generated large fractures or cracks, because such fractures tend to be reduced or disappear as a result of the pressure of the overlying formation under actual geological conditions.
The data show that the structural changes in the two directions are different (Table 1; Figure 10). During the initial heating stage from ambient to 200°C, contraction followed by expansion occurred in both directions. With increases in temperature, the dimension along the bedding direction changed minimally while maintaining a slight state of expansion. Along the direction perpendicular to the bedding plane, the sample continued to shrink with increases in temperature and the maximum shrinkage occurred at 500 °C. The minimum shrinkage occurred at 700°C. Overall, the structural change in the direction parallel to the bedding was smaller than that in the vertical direction as the temperature increased from ambient to 700°C, very similar to previous work[ (Figueroa Pilz et al., 2017), (Panahi et al., 2013), (Kobchenko et al., 2011)].
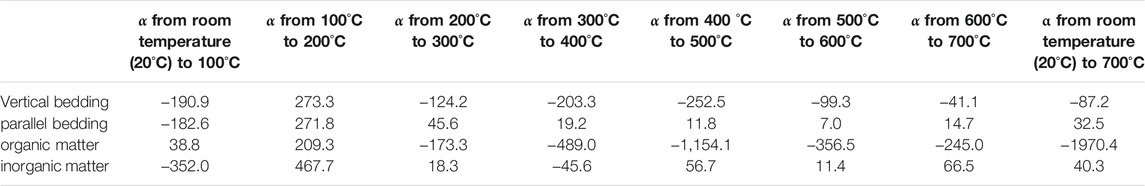
TABLE 1. The coefficient of linear thermal expansion values (α) at various temperatures (×10–6C).
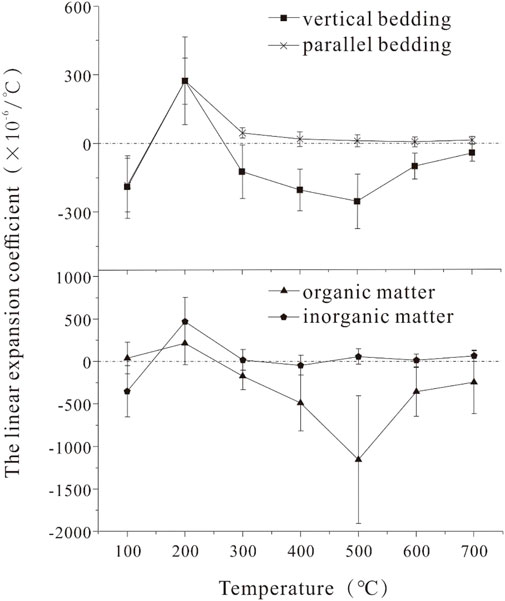
FIGURE 10. The linear thermal expansion coefficient of shale as a function of temperature.
3.2.3 Changes in Organic and Inorganic Components During Heating
As noted, shale contains both organic and inorganic materials and the thermal properties of these components are quite different (Hajpál and Török, 2004), such that the structural changes caused by heating will also vary. To better understand the separate contributions of the organic and inorganic materials during heating, we selected specific organic and inorganic particles to separately assess the structural modifications of these components at different temperatures. Again, the migrations of these particles were measured mainly along the direction perpendicular (about 80–90) to the bedding plane. During these trials, we made certain that the proportion of the corresponding organic matter or inorganic mineral along the measurement direction was more than 90%. At each temperature, seven measurements were performed in the case of the organic particles and seven for the inorganic particles, with a total of 112 measurements covering an area of 402–9,679 μm2 at the eight different temperatures. The linear expansion coefficients for specific temperature ranges in the different directions were calculated as described above, and the results are summarized in Table 1 and Figure 10B.
As the temperature was increased from room temperature to 700°C, the organic matter experienced expansion, shrinkage and collapse sequentially, accompanied by variations in the gray scale within the SEM images. The measurement data demonstrate that the organic matter first expanded and then shrank with increasing temperature, with the transition from expansion to shrinkage at 300°C (Table 1). It can be seen that the maximum shrinkage in the case of the organic matter occurred at 500°C. In addition, the organic matter exhibited shrinkage primarily parallel to the bedding direction.
The majority of the structural change shown by the inorganic materials took place during the early stage of heating, from room temperature to 100°C (Table 1). The shrinkage could have been related to the loss of water from the sample while being held under vacuum in the SEM chamber. The linear expansion coefficient of the inorganic materials was larger than that of the organic matter between 100 and 200°C. Above 300°C, inorganic materials exhibited minimal expansion.
In summary, the SEM observations indicated that the shale sample underwent structural changes during heating. Shale contains organic matter and inorganic minerals and the physical and chemical properties of these components are different, such that their structural changes during heating were also different (Hajpál and Török, 2004). The shale bedding assessed in this work was relatively well developed and showed variations in thermal conductivity depending on direction (Gabova et al., 2020), meaning that changes in the shale structure in different directions were also varied.
4 Discussion
4.1 Variations in the SEM Chamber Vacuum
As noted, during each heating process) followed by a rapid increase (solute pressure goes down) and then a slow rise (see Figure 5). The decrease in the vacuum was caused by the release of gases from the sample, including residual pre-existing hydrocarbons, new hydrocarbons generated by pyrolysis or cracking, water vapor, products from the thermal decomposition of inorganic compounds (Kobchenko et al., 2011), non-hydrocarbon gases such as CO2 (Behar et al., 1995; Zhan et al., 2020; Zhang et al., 2020). The data show that the vacuum dropped rapidly and then increased rapidly as the temperature was increased, although there was only a slow rise in vacuum during each stage at which the temperature was constant. During the temperature increase stages, the fluid in the sample to be discharged rapidly mainly in the form of transient flow (Hao et al., 2003). Once the temperature stabilized, the fluid was primarily discharged via percolation to produce a steady state (Hao et al., 2003).
4.2 Relationship Between Microstructural Changes and Hydrocarbon Generation/Expulsion
Both the rate and extent of variation in the SEM vacuum partly reflected the generation and expulsion of hydrocarbons from the sample. Combining the vacuum data with the SEM images and the measurement data allowed the correlation between microstructural changes in the shale with hydrocarbon generation/expulsion during heating to be evaluated. This analysis identified three stages of the heating process.
Stage 1 spanned the range from room temperature to 300°C. As shown in Figure 5, this temperature increase rapidly decreased the system vacuum, suggesting that more gases entered the vacuum chamber. This stage was associated with the evaporation of water inside the pores and with water in inorganic clay minerals in the sample[ (Saif et al., 2016), (Panahi et al., 2019), (Zhan et al., 2020)] (for which α was-352 × 10–6C), causing the shale to shrink. In addition, residual gaseous and liquid hydrocarbons in the sample expanded to generate pressure (Panahi et al., 2018). Furthermore, part of the kerogen in the shale would have been transformed into hydrocarbons to increase the volume of the specimen, further increasing the internal pressure of the sample (Panahi et al., 2018; Panahi et al., 2013; Saif et al., 2019). Finally, heating the shale would simply have caused the solid material to expand (Hajpál and Török, 2004). All the aforementioned factors would be expected to lead to an initial contraction of the sample followed by expansion. Some microcracks in the sample showed a small degree of expansion (Figure 7D), which would have created transport channels for the rapid discharge of any fluids that were subsequently generated. As the temperature continued to rise, the internal pressure of the sample exceeded the breakup threshold and part of the fluid in the shale was instantly discharged, resulting in a rapid and substantial drop in the SEM chamber vacuum. After the internal pressure of the sample was released and some of the microcracks in the expanded state closed[ (Figueroa Pilz et al., 2017), (Panahi et al., 2018), (Saif et al., 2019), (Kobchenko et al., 2014)] (Figure 7E), the sample transitioned from expansion to contraction. Stage 1 therefore comprised a complete episodic hydrocarbon expulsion process. In stage 2, going from 300 to 500°C, as the temperature was further increased some of the kerogen was converted to low molecular weight hydrocarbons (Zhan et al., 2020)[ (Tiwari and Deo, 2012)] such that the volume of the organic matter was reduced and shrinkage lines were created parallel to the bedding direction. When the temperature was elevated from 300 to 400°C, the internal pressure of the shale was increased as more hydrocarbons were generated and thermal expansion of the fluid in the material continued to play a role. Consequently, some microcracks underwent minimal expansion (Figure 7F). At 500°C, the internal pressure of the sample again exceeded the breakup pressure, meaning that a large amount of fluid was instantly discharged, the internal pressure of the sample was released, and the chamber vacuum dropped sharply and rapidly. In contrast to stage 1, the microcracks did not reclose during stage 2 after the internal pressure of the sample was released. In fact, the existing cracks greatly expanded and new cracks were also generated (Figures 7G, Figure 8) because the elasticity of the organic matter was reduced and there was a lack of external pressure.
Stages 1 and 2 therefore reflect the twice repeated processes of hydrocarbons generation, increases in internal pressure and hydrocarbon expulsion, in conjunction with the opening, closing and reopening of fractures in the sample (Figures 7C–G), reflecting episodic hydrocarbon expulsion. It should be noted that the test conditions did not reflect real-world geological conditions, because the trials were performed under a vacuum and without external pressure. If external pressure had been applied to the sample, the initial expulsion of hydrocarbons may have been delayed and, after the second expulsion of hydrocarbons, there is possibility of less extent of fracture expansion, even reclosing, or multiple expulsions.
Stage 3 was associated with heating from 500 to 700°C, during which the generation of hydrocarbons from the kerogen was gradually weakened[ (Zhan et al., 2020), (Tiwari and Deo, 2012)] and inorganic minerals were decomposed [25、48]. The majority of the hydrocarbons in the shale had been discharged by this point, resulting in fewer cracks appearing and a lower decrease in the chamber vacuum. However, the sample continued to shrink and the cracks in the material continued to expand (Figures 7H,I) as a result of the lack of external pressure.
4.3 Microcrack Changes Based on the Generation and Expulsion of Hydrocarbons
Microcracks provide important seepage channels for shale and can be changed by hydrocarbon generation and expulsion[ (Saif et al., 2016), (Panahi et al., 2013)]、[ (Fan et al., 2012)]. In the original sample, the crack direction was the same as or similar to the bedding direction and there were essentially no cracks in the vertical bedding direction. For these reasons, the cracks were relatively short, the available openings were small and there were no cracks spanning the organic matter and inorganic minerals (Figure 11A). Therefore, an effective crack network system was not present and the rock had limited seepage capacity.
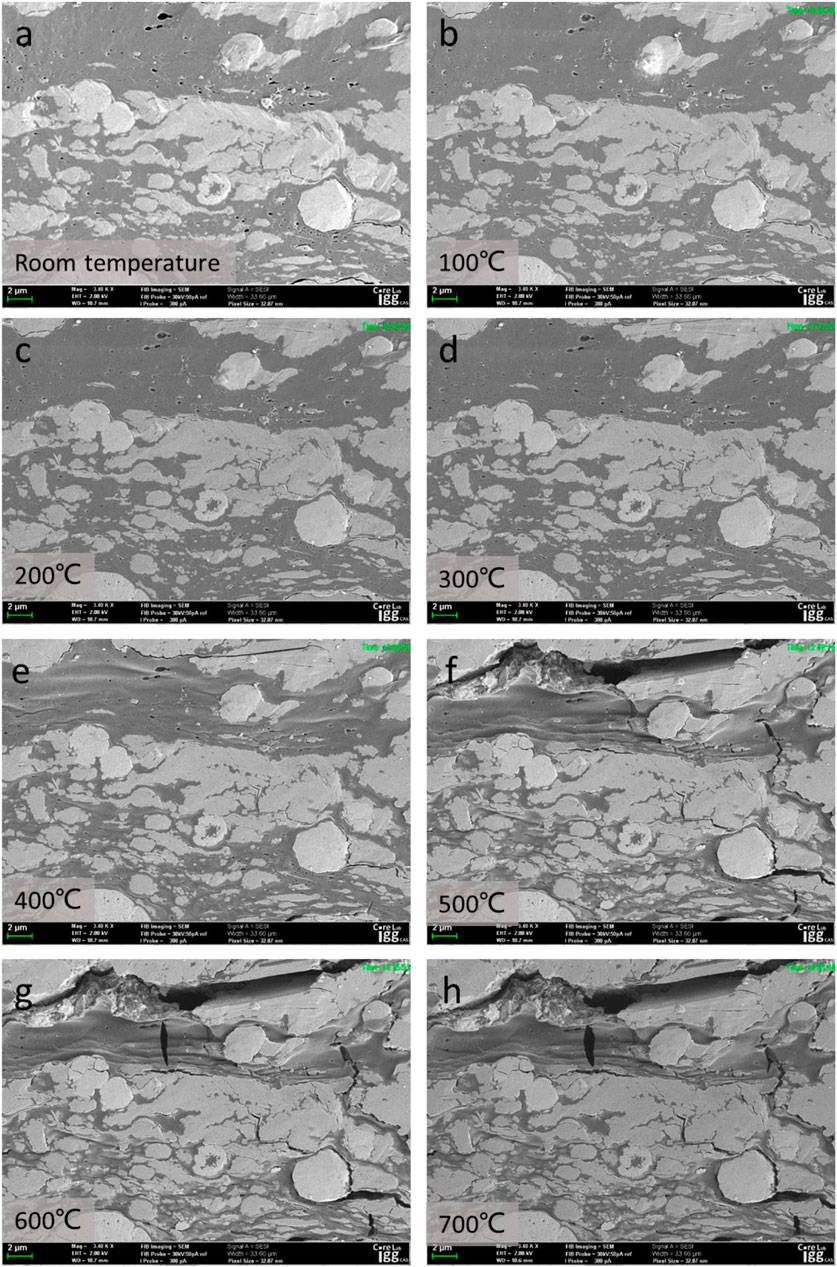
FIGURE 11. Expansion and opening of cracks during temperature increases.
Increasing the temperature modified existing cracks and also formed new cracks. The existing cracks were able to expand while retaining their original directions, while the newly generated cracks (Figures 8C, Figures 11E–H) formed inside the organic matter or at organic-inorganic boundaries. Both kerogen volume shrinkage based on significant conversion of this component and pressure increases resulting from fluid thermal expansion and hydrocarbon generation caused expansion of the original cracks and the opening of new cracks (Figures 8B,C, Figures 11E–H).
During and after heating, the majority of cracks were parallel to the bedding direction and the lengths and connectivity of these cracks provided good channels for fluid migration along the bedding direction. Cracks in the vertical bedding direction were also developed and allowed the migration of fluid between the bedding regions (Figures 11E–H). In this manner, an effective network of cracks was produced and the seepage capacity of the sample was greatly increased.
4.4 Effect of Temperature on Organic-Rich Shale
Unlike conventional gas reservoirs, shale gas reservoirs have very low permeability. Thus fracturing is required to connect natural micro-cracks with the goal of forming a complex network of fractures to achieve effective shale gas production. The fractures obtained from hydraulic fracturing are relatively large (on the scale of several microns) (He et al., 2017; Lin et al., 2018; Hu et al., 2020a; Diaz et al., 2020; Wang et al., 2021a; Wang et al., 2021b) and typically develop along the boundaries between mineral particles and organic matter (He et al., 2020). The gases in the nano-scale pores within the matrix do not readily enter the cracks and for this reason do not easily migrate to the well. In addition, a large amount of fracturing fluid remains in the reservoir after hydraulic fracturing, which hinders gas flow.
The thermal treatment of shale reservoirs after hydraulic fracturing is a potential stimulation technology that could allow the secondary exploitation of shale gas and enhance the recovery of shale gas reservoirs. Numerical models of shale gas thermal treatments have shown that shale gas production can be increased by heating hydraulic fractures (Wang et al., 2019; Yuan et al., 2019; Liu et al., 2020). Specifically, the evaporation of water at high temperature or clay dehydration can minimize or even reverse the damage caused by water trapping and clay swelling near the well. Combining thermal reformation and hydraulic fracturing, we can take advantage of the different thermal properties of the shale components, the thermal expansion of fluids (such as fracturing fluids and gases in isolated pores) and the generation of hydrocarbons from organic matter via pyrolysis. On this basis, micro-fractures can be generated near the surfaces of existing fractures to form a new fracture network and improve the permeability of the reservoir. At the same time, the organic matter produces micro-cracks (Hu et al., 2020b) through which the organic pores can be connected (Figure 9), allowing the migration of gases. Increasing the shale temperature will also enhance the desorption of adsorbed gases and further increase shale gas recovery.
Shale is also one of the main host rocks for underground high-temperature operations such as nuclear waste storage. The decay of radioactive elements in nuclear waste and subsequent heat release can increase the shale temperature in a relatively short period of time and induce significant structural changes that create additional fluid flow paths. These paths, in turn, will affect the overall performance of the radioactive waste storage system (Tsang et al., 2005; Nasir et al., 2014; Zheng et al., 2017). Therefore, the design of nuclear waste storage should consider the impact of structural changes resulting from radiation-based heating. Based on the present work, the fractures produced by the thermal reformation of shale would be expected to develop primarily along the bedding plane direction (Figure 8). Therefore, when designing nuclear waste storage systems, more safety measures should be implemented along the bedding plane to increase the stability of the formation and prevent the migration of radionuclides.
5 Conclusion
This work investigated structural changes and hydrocarbon generation during in situ heating of immature shale samples from room temperature to 700°C in a high-resolution field emission scanning electron microscope. The structural changes were monitored by in situ SEM imaging within the same field of view at different stages under continuous heating conditions. The changes in the vacuum within the SEM chamber were used to characterize hydrocarbon generation and expulsion by the shale. Analyzing both these SEM images and the vacuum data provided correlations between structural variations and hydrocarbon generation and expulsion. The following conclusions can be made.
1) Hydrocarbon generation and expulsion by the shale had a significant effect on the SEM chamber vacuum, and the vacuum within the chamber changed during the various heating stages. The rapid decrease observed in the SEM chamber vacuum during rapid heating suggested that fluid was discharged via a transient flow process. Slower decreases in the vacuum during the constant temperature stages indicated that fluid was released in the form of seepage.
2) Typical particles in the SEM field of view were used to characterize structural changes associated with the different heating stages. These structural modifications were found to depend on both the direction within the sample and type of material being assessed. On heating from room temperature to 700°C, contraction occurred largely along the vertical bedding direction with only limited expansion parallel to the bedding direction. Organic matter in the shale shrank significantly throughout the entire heating process, while inorganic minerals first exhibited shrinkage and then expanded during the initial heating stage, after which these components showed minimal change.
3) A definite correlation was observed between sample structural changes and hydrocarbon generation and expulsion. Throughout the entire heating process, two episodic hydrocarbon expulsion stages were observed, occurring at 300 and 500°C. The opening, closing and reopening of micro-cracks took place during these cycles of hydrocarbon generation and expulsion. In the later heating period, the cracks did not close again after opening, indicating the deterioration of the elasticity of the organic matter and the lack of external pressure intervention.
4) Hydrocarbon generation and expulsion caused the expansion of old fractures and the formation of new ones to generate a large number of micro-cracks along either the bedding plane or vertical bedding directions. Thus, an effective network system could be formed to provide channels for fluid migration.
5) Structural changes in organic-rich shale as a consequence of heating may have negative effects on certain geological projects, such as nuclear waste storage, and should receive special attention in advance.
Data Availability Statement
The original contributions presented in the study are included in the article/supplementary material further inquiries can be directed to the corresponding author.
Author Contributions
YY: Writing—original draft, Methodology, Formal analysis, Investigation, Data curation. JY: Supervision, Funding acquisition, Writing—review and editing, Conceptualization.
Funding
This research was funded by National Science and Technology Major Project (Grant Nos. 2017ZX05035-002, 2016ZX05034-003), Strategic Priority Research Program of the Chinese Academy of Sciences (Grant No. XDB10050100), National Natural Science Foundation of China (Grant No. U1562215).
Conflict of Interest
The authors declare that the research was conducted in the absence of any commercial or financial relationships that could be construed as a potential conflict of interest.
Publisher’s Note
All claims expressed in this article are solely those of the authors and do not necessarily represent those of their affiliated organizations, or those of the publisher, the editors and the reviewers. Any product that may be evaluated in this article, or claim that may be made by its manufacturer, is not guaranteed or endorsed by the publisher.
Acknowledgments
Special thanks to Dr Zhongming Du of Institute of Geology and Geophysics, Chinese Academy Sciences, for providing sample preparation.
References
Behar, F., Vandenbroucke, M., Teermann, S. C., Hatcher, P. G., Leblond, C., and Lerat, O. (1995). Experimental Simulation of Gas Generation from Coals and a marine Kerogen. Chem. Geology. 126 (3-4), 247–260. doi:10.1016/0009-2541(95)00121-2
Camp, W. K., Knowles, W., Hooghan, K., and Ruble, T. E. (2017). Microstructural Analysis of the Transformation of Organic Matter during Artificial thermal Maturation of the Upper Cretaceous Boquillas (Eagle Ford) Formation, Texas, USA. Microsc. Microanal. 23 (S1), 2128–2129. doi:10.1017/s1431927617011308
Castagna, M., Goergen, E., Skinner, K., and Dahl, J. E. (2014). Utilization of an ESEM with an Embedded Heating Stage to Investigate Pyrolosis in Immature Oil Shale. Microsc. Microanal. 20 (S3), 1642–1643. doi:10.1017/s1431927614009945
Clarkson, C. R., Solano, N., Bustin, R. M., Bustin, A. M. M., Chalmers, G. R. L., He, L., et al. (2013). Pore Structure Characterization of North American Shale Gas Reservoirs Using USANS/SANS, Gas Adsorption, and Mercury Intrusion. Fuel 103, 606–616. doi:10.1016/j.fuel.2012.06.119
Curtis, M. E., Cardott, B. J., Sondergeld, C. H., and Rai, C. S. (2012). Development of Organic Porosity in the Woodford Shale with Increasing thermal Maturity. Int. J. Coal Geology. 103 (103), 26–31. doi:10.1016/j.coal.2012.08.004
Dahl, J., Castagna, M., Skinner, K., Goergen, E., and Lemmens, H. (2015). “Making Movies of Oil Generation,” in SPE/AAPG/SEG unconventional resources technology conference, San Antonio, Texas, USA, 20-22 July 2015, OnePetro. doi:10.2118/178523-ms
Diaz, M. B., Kim, K. Y., and Jung, S. G. (2020). Effect of Frequency during Cyclic Hydraulic Fracturing and the Process of Fracture Development in Laboratory Experiments. Int. J. Rock Mech. Mining Sci. 134, 104474. doi:10.1016/j.ijrmms.2020.104474
Fan, Z. Q., Jin, Z.-H., and Johnson, S. E. (2012). Gas-driven Subcritical Crack Propagation during the Conversion of Oil to Gas. Pet. Geosci. 18 (2), 191–199. doi:10.1144/1354-079311-030
Figueroa Pilz, F., Dowey, P. J., Fauchille, A.-L., Courtois, L., Bay, B., Ma, L., et al. (2017). Synchrotron Tomographic Quantification of Strain and Fracture during Simulated thermal Maturation of an Organic-Rich Shale, UK Kimmeridge Clay. J. Geophys. Res. Solid Earth. 122 (4), 2553–2564. doi:10.1002/2016jb013874
Gabova, A., Chekhonin, E., Popov, Y., Savelev, E., Romushkevich, R., Popov, E., et al. (2020). Experimental Investigation of thermal Expansion of Organic-Rich Shales. Int. J. Rock Mech. Mining Sci. 132, 104398. doi:10.1016/j.ijrmms.2020.104398
Gan, Q., Xu, J., Peng, S., Yan, F., Wang, R., and Cai, G. (2021). Effects of Heating Temperature on Pore Structure Evolution of Briquette Coals. Fuel 296, 120651. doi:10.1016/j.fuel.2021.120651
Gautam, P. K., Verma, A. K., Singh, T. N., Hu, W., and Singh, K. H. (2019). Experimental Investigations on the thermal Properties of Jalore Granitic Rocks for Nuclear Waste Repository. Thermochim. Acta. 681, 178381. doi:10.1016/j.tca.2019.178381
Giliazetdinova, D., Korost, D., and Gerke, K. M. (2017). “Studying of Shale Organic Matter Structure and Pore Space Transformations during Hydrocarbon Generation,” in Advances in Laboratory Testing and Modelling of Soils and Shales (ATMSS). Swiss Alps: Springer, 382–387. doi:10.1007/978-3-319-52773-4_45
Goral, J., Walton, I., Andrew, M., and Deo, M. (2019). Pore System Characterization of Organic-Rich Shales Using Nanoscale-Resolution 3D Imaging. Fuel 258, 116049. doi:10.1016/j.fuel.2019.116049
Hajpál, M., and Török, Á. (2004). Mineralogical and Colour Changes of Quartz Sandstones by Heat. Environ. Geology. 46 (3-4), 311–322. doi:10.3321/j.issn:0563-5020.2003.03.015
Hao, F., Zou, H., Yang, X., and Wang, M. (2003). Episodic Petroleum Accumulation, its Driving Mechanisms and Distinguishing Markers. Chin. J. Geology. 38 (3), 403–412. doi:10.3321/j.issn:0563-5020.2003.03.015
He, J., Li, X., Yin, C., Zhang, Y., and Lin, C. (2020). Propagation and Characterization of the Micro Cracks Induced by Hydraulic Fracturing in Shale. Energy 191, 116449. doi:10.1016/j.energy.2019.116449
He, J., Lin, C., Li, X., Zhang, Y., and Chen, Y. (2017). Initiation, Propagation, Closure and Morphology of Hydraulic Fractures in sandstone Cores. Fuel 208, 65–70. doi:10.1016/j.fuel.2017.06.080
Hu, L., Ghassemi, A., Pritchett, J., and Garg, S. (2020). Characterization of Laboratory-Scale Hydraulic Fracturing for EGS. Geothermics 83, 101706. doi:10.1016/j.geothermics.2019.07.004
Hu, L., Li, H., Babadagli, T., Xie, X., and Deng, H. (2020). Thermal Stimulation of Shale Formations by Electromagnetic Heating: A Clean Technique for Enhancing Oil and Gas Recovery. J. Clean. Prod. 277, 123197. doi:10.1016/j.jclepro.2020.123197
Kim, T. W., Ross, C. M., Guan, K., Burnham, A. K., and Kovscek, A. R. (2019). “Permeability and Porosity Evolution of Organic Rich Shales as a Result of Heating,” in SPE Western Regional Meeting (San Jose, California, USA: Society of Petroleum Engineers). doi:10.2118/195366-MS
Kobchenko, M., Hafver, A., Jettestuen, E., Renard, F., Galland, O., Jamtveit, B., et al. (2014). Evolution of a Fracture Network in an Elastic Medium with Internal Fluid Generation and Expulsion. Phys. Rev. E Stat. Nonlin Soft Matter Phys. 90 (5), 052801. doi:10.1103/PhysRevE.90.052801
Kobchenko, M., Panahi, H., Renard, F., Dysthe, D. K., Malthe‐Sørenssen, A., Mazzini, A., et al. (2011). 4D Imaging of Fracturing in Organic‐rich Shales during Heating. J. Geophys. Res. Solid Earth 116 (B12). doi:10.1029/2011jb008565
Lin, C., He, J., and Li, X. (2018). Width Evolution of the Hydraulic Fractures in Different Reservoir Rocks. Rock Mech. Rock Eng. 51 (5), 1621–1627. doi:10.1007/s00603-017-1391-z
Liu, J., Liang, X., Xue, Y., Yao, K., and Fu, Y. (2020). Numerical Evaluation on Multiphase Flow and Heat Transfer during thermal Stimulation Enhanced Shale Gas Recovery. Appl. Therm. Eng. 178, 115554. doi:10.1016/j.applthermaleng.2020.115554
Loucks, R. G., Reed, R. M., Ruppel, S. C., and Hammes, U. (2012). Spectrum of Pore Types and Networks in Mudrocks and a Descriptive Classification for Matrix-Related Mudrock Pores. Bulletin 96 (6), 1071–1098. doi:10.1306/08171111061
Mahanta, B., Ranjith, P. G., Vishal, V., and Singh, T. N. (2020). Temperature-induced Deformational Responses and Microstructural Alteration of sandstone. J. Pet. Sci. Eng. 192, 107239. doi:10.1016/j.petrol.2020.107239
Maojin, T., Kun, W., Youlong, Z., Siyu, W., Yuyang, F., and Xiangzhi, C. (2019). Nuclear Magnetic Resonance Simulations of Nano-Scale Cores and Microscopic Mechanisms of Oil Shale. Fuel 256, 115843. doi:10.1016/j.fuel.2019.115843
Mastalerz, M., Drobniak, A., and Stankiewicz, A. B. (2018). Origin, Properties, and Implications of Solid Bitumen in Source-Rock Reservoirs: A Review. Int. J. Coal Geology. 195, 14–36. doi:10.1016/j.coal.2018.05.013
Meng, M., Ge, H., Shen, Y., Hu, Q., Li, L., Gao, Z., et al. (2020). The Effect of clay-swelling Induced Cracks on Imbibition Behavior of marine Shale Reservoirs. J. Nat. Gas Sci. Eng. 83, 103525. doi:10.1016/j.jngse.2020.103525
Misch, D., Gross, D., Hawranek, G., Horsfield, B., Klaver, J., Mendez-Martin, F., et al. (2019). Solid Bitumen in Shales: Petrographic Characteristics and Implications for Reservoir Characterization. Int. J. Coal Geology. 205, 14–31. doi:10.1016/j.coal.2019.02.012
Nasir, O., Fall, M., and Evgin, E. (2014). A Simulator for Modeling of Porosity and Permeability Changes in Near Field Sedimentary Host Rocks for Nuclear Waste under Climate Change Influences. Tunnelling Underground Space Tech. 42, 122–135. doi:10.1016/j.tust.2014.02.010
Nieto-Delgado, C., Cannon, F. S., Zhao, Z., and Nieto-Delgado, P. G. (2021). Evolution of Raman Signal during Lignin Pyrolysis and its Correlation with the Binding Mechanism in Anthracite Briquettes. Fuel 298, 120816. doi:10.1016/j.fuel.2021.120816
Panahi, H., Kobchenko, M., Meakin, P., Dysthe, D. K., and Renard, F. (2019). Fluid Expulsion and Microfracturing during the Pyrolysis of an Organic Rich Shale. Fuel 235, 1–16. doi:10.1016/j.fuel.2018.07.069
Panahi, H., Kobchenko, M., Meakin, P., Dysthe, D. K., and Renard, F. (2018). In-situ Imaging of Fracture Development during Maturation of an Organic-Rich Shale: Effects of Heating Rate and Confinement. Mar. Pet. Geology. 95, 314–327. doi:10.1016/j.marpetgeo.2018.05.002
Panahi, H., Kobchenko, M., Renard, F., Mazzini, A., Scheibert, J., Dysthe, D., et al. (2013). A 4D Synchrotron X-Ray-Tomography Study of the Formation of Hydrocarbon- Migration Pathways in Heated Organic-Rich Shale. SPE J. 18 (02), 366–377. doi:10.2118/162939-pa
Ross, D. J., and Bustin, R. M. (2007). Impact of Mass Balance Calculations on Adsorption Capacities in Microporous Shale Gas Reservoirs. Fuel 86 (17), 2696–2706. doi:10.1016/j.fuel.2007.02.036
Ross, D. J. K., and Bustin, R. M. (2008). Characterizing the Shale Gas Resource Potential of Devonian-Mississippian Strata in the Western Canada Sedimentary basin: Application of an Integrated Formation Evaluation. Bulletin 92 (1), 87–125. doi:10.1306/09040707048
Ross, D. J. K., and Marc Bustin, R. (2009). The Importance of Shale Composition and Pore Structure upon Gas Storage Potential of Shale Gas Reservoirs. Mar. Pet. Geology. 26 (6), 916–927. doi:10.1016/j.marpetgeo.2008.06.004
Saif, T., Lin, Q., Bijeljic, B., and Blunt, M. J. (2017). Microstructural Imaging and Characterization of Oil Shale before and after Pyrolysis. Fuel 197, 562–574. doi:10.1016/j.fuel.2017.02.030
Saif, T., Lin, Q., Butcher, A. R., Bijeljic, B., and Blunt, M. J. (2017). Multi-scale Multi-Dimensional Microstructure Imaging of Oil Shale Pyrolysis Using X-ray Micro-tomography, Automated Ultra-high Resolution SEM, MAPS Mineralogy and FIB-SEM. Appl. Energ. 202, 628–647. doi:10.1016/j.apenergy.2017.05.039
Saif, T., Lin, Q., Gao, Y., Al-Khulaifi, Y., Marone, F., Hollis, D., et al. (2019). 4D In Situ Synchrotron X-ray Tomographic Microscopy and Laser-Based Heating Study of Oil Shale Pyrolysis. Appl. Energ. 235, 1468–1475. doi:10.1016/j.apenergy.2018.11.044
Saif, T., Lin, Q., Singh, K., Bijeljic, B., and Blunt, M. J. (2016). Dynamic Imaging of Oil Shale Pyrolysis Using Synchrotron X-ray Microtomography. Geophys. Res. Lett. 43 (13), 6799–6807. doi:10.1002/2016gl069279
Shi, M., Yu, B., Zhang, J., Huang, H., Yuan, Y., and Li, B. (2018). Evolution of Organic Pores in marine Shales Undergoing Thermocompression: A Simulation experiment Using Hydrocarbon Generation and Expulsion. J. Nat. Gas Sci. Eng. 59, 406–413. doi:10.1016/j.jngse.2018.09.008
Shu, B., Zhu, R., Elsworth, D., Dick, J., Liu, S., Tan, J., et al. (2020). Effect of Temperature and Confining Pressure on the Evolution of Hydraulic and Heat Transfer Properties of Geothermal Fracture in Granite. Appl. Energ. 272, 115290. doi:10.1016/j.apenergy.2020.115290
Sun, L., Tuo, J., Zhang, M., Wu, C., Wang, Z., and Zheng, Y. (2015). Formation and Development of the Pore Structure in Chang 7 Member Oil-Shale from Ordos Basin during Organic Matter Evolution Induced by Hydrous Pyrolysis. Fuel 158 (oct.15), 549–557. doi:10.1016/j.fuel.2015.05.061
Sun, Q., Lü, C., Cao, L., Li, W., Geng, J., and Zhang, W. (2016). Thermal Properties of sandstone after Treatment at High Temperature. Int. J. Rock Mech. Mining Sci. 85, 60–66. doi:10.1016/j.ijrmms.2016.03.006
Tian, H., Kempka, T., Xu, N.-X., and Ziegler, M. (2012). Physical Properties of Sandstones after High Temperature Treatment. Rock Mech. Rock Eng. 45 (6), 1113–1117. doi:10.1007/s00603-012-0228-z
Tiwari, P., and Deo, M. (2012). Compositional and Kinetic Analysis of Oil Shale Pyrolysis Using TGA-MS. Fuel 94, 333–341. doi:10.1016/j.fuel.2011.09.018
Tsang, C.-F., Bernier, F., and Davies, C. (2005). Geohydromechanical Processes in the Excavation Damaged Zone in Crystalline Rock, Rock Salt, and Indurated and Plastic Clays-In the Context of Radioactive Waste Disposal. Int. J. Rock Mech. Mining Sci. 42, 109–125. doi:10.1016/j.ijrmms.2004.08.003
Wang, J., Xie, H., and Li, C. (2021). Anisotropic Failure Behaviour and Breakdown Pressure Interpretation of Hydraulic Fracturing Experiments on Shale. Int. J. Rock Mech. Mining Sci. 142, 104748. doi:10.1016/j.ijrmms.2021.104748
Wang, Y., Liao, B., Qiu, L., Wang, D., and Xue, Q. (2019). Numerical Simulation of Enhancing Shale Gas Recovery Using Electrical Resistance Heating Method. Int. J. Heat Mass Transfer 128, 1218–1228. doi:10.1016/j.ijheatmasstransfer.2018.09.075
Wang, Y., Liu, K., and Gao, D. (2021). Investigation of the Interface Cracks on the Cement Sheath Stress in Shale Gas wells during Hydraulic Fracturing. J. Pet. Sci. Eng. 205, 108981. doi:10.1016/j.petrol.2021.108981
Yan, Q., Xie, Z., and Li, J. (2003). Visualization Technique of Source Rocks Producing Hydrocarbon Process at High Temperature by Means of Environmental Scanning Electron Microscope. Pet. Geology. Exp. 25 (02), 202–205. doi:10.3969/j.issn.1001-6112.2003.02.018
Yang, R., He, S., Hu, Q., Sun, M., Hu, D., and Yi, J. (2017). Applying SANS Technique to Characterize Nano-Scale Pore Structure of Longmaxi Shale, Sichuan Basin (China). Fuel 197, 91–99. doi:10.1016/j.fuel.2017.02.005
Yuan, J., Jiang, R., Cui, Y., Xu, J., Wang, Q., and Zhang, W. (2019). The Numerical Simulation of thermal Recovery Considering Rock Deformation in Shale Gas Reservoir. Int. J. Heat Mass Transfer 138, 719–728. doi:10.1016/j.ijheatmasstransfer.2019.04.098
Zhan, H., Wang, Y., Chen, M., Chen, R., Zhao, K., and Yue, W. (2020). An Optical Mechanism for Detecting the Whole Pyrolysis Process of Oil Shale. Energy 190, 116343. doi:10.1016/j.energy.2019.116343
Zhang, D., Wang, L., Su, L., Wu, Y., Sun, R., Wu, C., et al. (2020). The Chemical Kinetics of the Semi-open Hydrous Pyrolysis System: Time Series Analysis of Lithostatic Pressure and Fluid Pressure. Int. J. Coal Geology. 220, 103418. doi:10.1016/j.coal.2020.103418
Zhang, H., Zhu, Y., Wang, Y., Kang, W., and Chen, S. (2016). Comparison of Organic Matter Occurrence and Organic Nanopore Structure within marine and Terrestrial Shale. J. Nat. Gas Sci. Eng. 32, 356–363. doi:10.1016/j.jngse.2016.04.040
Zhao, S., Li, Y., Wang, Y., Ma, Z., and Huang, X. (2019). Quantitative Study on Coal and Shale Pore Structure and Surface Roughness Based on Atomic Force Microscopy and Image Processing. Fuel 244, 78–90. doi:10.1016/j.fuel.2019.02.001
Keywords: immature shale, in situ heating scanning electron microscopy, hydrocarbon generation and expulsion, microfracture formation, xiamaling formation
Citation: Yuan Y and Yang J (2021) Temperature-Driven Hydrocarbon Generation-Expulsion and Structural Transformation of Organic-Rich Shale Assessed by in situ Heating SEM. Front. Earth Sci. 9:797760. doi: 10.3389/feart.2021.797760
Received: 19 October 2021; Accepted: 15 November 2021;
Published: 03 December 2021.
Edited by:
Kun Zhang, Southwest Petroleum University, ChinaReviewed by:
Mianmo Meng, China University of Petroleum (Huadong), ChinaZhuo Li, China University of Petroleum, China
Chenlu Xu, Guangzhou Marine Geological Survey, China
Copyright © 2021 Yuan and Yang. This is an open-access article distributed under the terms of the Creative Commons Attribution License (CC BY). The use, distribution or reproduction in other forums is permitted, provided the original author(s) and the copyright owner(s) are credited and that the original publication in this journal is cited, in accordance with accepted academic practice. No use, distribution or reproduction is permitted which does not comply with these terms.
*Correspondence: Jijin Yang, eWFuZ0BtYWlsLmlnZ2Nhcy5hYy5jbg==