Abstract
In recent years, low-cost unmanned aerial vehicles (UAVs) photogrammetry and terrestrial laser scanner (TLS) techniques have become very important non-contact measurement methods for obtaining topographic data about landslides. However, owing to the differences in the types of UAVs and whether the ground control points (GCPs) are set in the measurement, the obtained topographic data for landslides often have large precision differences. In this study, two types of UAVs (DJI Mavic Pro and DJI Phantom 4 RTK) with and without GCPs were used to survey a loess landslide. UAVs point clouds and digital surface model (DSM) data for the landslide were obtained. Based on this, we used the Geomorphic Change Detection software (GCD 7.0) and the Multiscale Model-To-Model Cloud Comparison (M3C2) algorithm in the Cloud Compare software for comparative analysis and accuracy evaluation of the different point clouds and DSM data obtained using the same and different UAVs. The experimental results show that the DJI Phantom 4 RTK obtained the highest accuracy landslide terrain data when the GCPs were set. In addition, we also used the Maptek I-Site 8,820 terrestrial laser scanner to obtain higher precision topographic point cloud data for the Beiguo landslide. However, owing to the terrain limitations, some of the point cloud data were missing in the blind area of the TLS measurement. To make up for the scanning defect of the TLS, we used the iterative closest point (ICP) algorithm in the Cloud Compare software to conduct data fusion between the point clouds obtained using the DJI Phantom 4 RTK with GCPs and the point clouds obtained using TLS. The results demonstrate that after the data fusion, the point clouds not only retained the high-precision characteristics of the original point clouds of the TLS, but also filled in the blind area of the TLS data. This study introduces a novel perspective and technical scheme for the precision evaluation of UAVs surveys and the fusion of point clouds data based on different sensors in geological hazard surveys.
1 Introduction
Landslides are an extensively studied natural phenomenon, and they can sometimes cause serious economic losses and casualties (Lindner et al., 2015; Peppa et al., 2017; Hu et al., 2018; Godone et al., 2020; Zhang et al., 2021). With the rapid development of measurement techniques, the use of non-contact measurement methods (e.g., unmanned aerial vehicles (UAVs), interferometric synthetic aperture radar (InSAR), and terrestrial laser scanner (TLS) to obtain high spatial resolution landslide terrain data has become a common task in many research and engineering applications (Kowalski, 2018; Carey et al., 2019; Ji and Luo, 2019; Li et al., 2019). In practical applications, the data are often required to have a spatial density and measurement accuracy of millimeters or centimeters (Zang et al., 2019; Samodra et al., 2020; Yan et al., 2021). The two most commonly used remote sensing methods used for this fine three-dimensional (3D) mapping are the TLS and UAVs methods (Mancini et al., 2013; Neugirg et al., 2016; Chatzistamatis et al., 2018; Guisado-Pintado et al., 2019). The former uses active laser emission to record the 3D coordinates and reflectivity of the scanned object, with a sub-centimeter level accuracy (Neugirg et al., 2016; Brede et al., 2019; Sasak et al., 2019; Wijesingha et al., 2019). The latter is a digital photogrammetry technique based on the Structure-to-Motion (SfM) algorithm; a UAVs is usually used as the sensor platform, and it has a centimeter level accuracy (Yu et al., 2017; Galvan Rangel et al., 2018; Lee and Min, 2018; Jaud et al., 2020; Yang et al., 2021). The TLS and UAVs methods are widely used in landslide monitoring and disaster assessment and play an important role in natural disaster research (Ma et al., 2018; Hu et al., 2019; Hu et al., 2020; Stringer et al., 2021). For example, Carey et al. (2019) used a global positioning system (GPS)-supported drone to obtain aerial images of the upper Scenic Drive landslide over 2 days and used the images to generate a digital elevation model (DEM) with a high spatial resolution (3–10 cm/pixel). Godone et al. (2020) resumed monitoring of farmland, houses, and infrastructure through UAVs flights and assessed the remaining risks caused by large-scale landslides. Hendrickx et al. (2020) used the UAVs and TLS methods to survey a talus slope on the Col du Sanetsch (Swiss Alps) for three consecutive summers and successfully detected debris flows, snow push, and rill erosion.
Although multisource surveying and mapping techniques provide a wealth of surveying and mapping data, there may also be problems such as missing data and a low spatial resolution (Martinez-Carricondo et al., 2018; Medjkane et al., 2018; Bakirman et al., 2020). For example, the quality of the images produced by different types of UAVs will vary greatly due to differences in their performances, their flight modes, the weather conditions, and the layout of their ground control points (GCPs) (Zhang et al., 2018; Lee et al., 2019; Aguera-Vega et al., 2020). The TLS has a fixed scanning angle, and there may be mutual occlusion phenomena in the research area, so the finally obtained point clouds data contain data shadows (Pellicani et al., 2019; Kamnik et al., 2020; Tsunetaka et al., 2020). Owing to the different types of data, data obtained using multiple measurement techniques results in data fusion problems (Saponaro et al., 2019; Feng et al., 2020; Rechberger et al., 2021). Several studies have used separate UAVs and TLS methods for topographic mapping (Rossi et al., 2018; Ouyang et al., 2019; Carrera-Hernandez et al., 2020; Ferrer-Gonzalez et al., 2020; Qu et al., 2021), to evaluate the accuracy of the point clouds generated by TLS and UAVs (Zhou et al., 2020; Senkal et al., 2021), and to evaluate the accuracy of digital surface models (DSMs) and digital elevation models (DEMs) generated using point clouds (Rogers et al., 2020; Xu et al., 2020; Liu et al., 2021). In terms of landslide terrain, few researchers have considered the integration of UAVs-SfM and TLS point clouds, and the accuracy of the fusion of the point clouds has not been evaluated.
In this study, the Beiguo landslide in Heyang County, Loess Plateau, China was taken as an example, and the UVA and TLS methods were used to map the landslide topography. The landslide topography data were obtained by designing different UAVs mapping schemes, i.e., using different UAVs models in the photogrammetry operations using or not using GCPs during modeling. Geomorphic Change Detection Software (GCD 7.0) and Cloud Compare Software were used to evaluate the point clouds and the DSM accuracy of the different schemes. Finally, we used the iterative closest point (ICP) algorithm to fuse the TLS point clouds with the UAVs point clouds. The goals of this research are as follows: 1) We quantify the differences in the DSMs produced using different UAVs with or without GCPs, and evaluate the accuracy of the point clouds and the DSM data acquired using different sensor and mapping schemes 2) Owing to the influence of the elevation differences, shadow, and other factors, the point clouds obtained using UAVs photogrammetry sometimes have a large error. The point clouds obtained using TLS have a very high accuracy, but there are blind areas in the field of vision. We fuse their point clouds data to overcome their shortcomings and to improve the accuracy of the point clouds. 3) We hope the results of this study can provide a reference for other researchers conducting UAVs and TLS surveys and data processing.
2 Study Area
China has the most extensive loess distribution in the world. A continuous loess layer covers the middle reaches of the Yellow River, forming the ravine Loess Plateau (Hu et al., 2018; Hu et al., 2020; Li et al., 2021). The landslide investigated in this study is located on the west bank of the Yellow River in Beiguo Village, Heyang County, Shaanxi Province, China, on the southeastern part of the tableland (Figure 1). The study area has an arid and semiarid continental monsoon climate and is located in the warm temperate zone, with an average annual precipitation of 556.7 mm, which is concentrated between July and September. According to field surveys, the Beiguo landslide is a resurrected loess landslide caused by continuous rainfall. It has a continuous sedimentary loess layer and has been affected by the Quaternary Neotectonic Movement. The vertical uplift and subsidence are very obvious. According to historical satellite images, before 2017, several small-scale landslides and collapse events occurred in and around the landslide of interest, and the landslide was in an unstable state. The largest landslide occurred in the winter of 2017. This new landslide had a maximum width of 365 m and a maximum length of 267 m, covering an area of 72,000 m2, with a total accumulation of 326,923 (±9,862) m3. Readers can scan the QR code in Figure 1B or click on the link below (https://720yun.com/t/03vkObqh72q#scene_id=58455158) to view a 3D panorama of the Beiguo landslide.
FIGURE 1
3 Data Sources and Methodology
3.1 Measurement Equipment
In this study, two consumer-grade UAVs (Table 1), a DJI Mavic Pro and a DJI Phantom 4 RTK, were used for low-altitude observations to obtain multitemporal images and terrain data after the landslides occurred (http://developer.dji.com/products/). The detailed specifications of the UAVs are described in Table 1. This type of drone was chosen because of its flexibility, real-time monitoring, and low cost. First, the two drones were equipped with small digital cameras to obtain images of the landslide and surface information. Then, based on the principles of computer vision and low-altitude auxiliary flight control data, three-dimensional modeling of the landslide terrain was conducted using the image topology relationship (Hu et al., 2018; Ma et al., 2018; Lamsters et al., 2020; Ma et al., 2021). By generating three-dimensional point clouds data containing color information, the spatial distribution characteristics and local detailed structure of the landslide were visually expressed, and a landslide DSM was established (Lindner et al., 2015; Kowalski, 2018; Cheng et al., 2021).
TABLE 1
| Parameters | Mavic pro UAVs | Phantom 4 RTK UAVs |
|---|---|---|
| Overview | 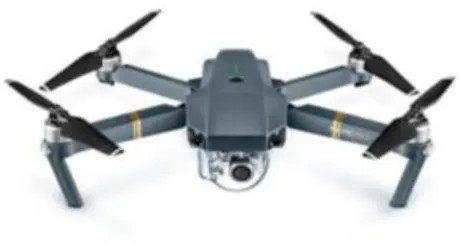 | 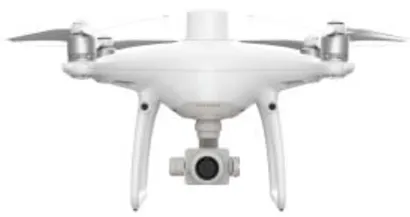 |
| Dimension (cm) | 19.8 × 8.3 × 8.3 | 25.0 × 25.0 × 24.0 |
| Weight (g) | 734 | 1,391 |
| Max flight time (min) | 27 | 30 |
| Sensor (CMOS) | 1/2.3″ | 1″ |
| Effective pixels (MP) | 12.35 | 20 |
| Equivalent focus | 23 | 35 |
| (mm) | ||
| GNSS | GPS + GLONASS | GPS + GLONASS + Galileo |
| GNSS vertical accuracy (m) | ±0.5 | ±0.1 |
| GNSS horizontal accuracy (m) | ±1.5 | ±0.1 |
| Cost ($) | ∼1,200 | ∼4,000 |
UAVs specification.
A Maptek I-Site 8820 TLS (Table 2) was used to scan the ground point clouds. This instrument is a rear-view oriented remote laser scanner, with a maximum measurement distance of 2000 m and a measurement accuracy of 6 mm. This type of 3D laser scanner was chosen because it has the advantages of fast data collection, non-contact, high precision, and direct collection of 3D landslide surface data (Medjkane et al., 2018; Brede et al., 2019; Zang et al., 2019; Senkal et al., 2021). The system mainly uses a grid method to scan the data, which is characterized by a high precision, high density, high speed, and no prism (Zang et al., 2019; Kamnik et al., 2020; Rechberger et al., 2021).
TABLE 2
| Parameters | Maptek I-Site 8,820 |
|---|---|
| Overview | 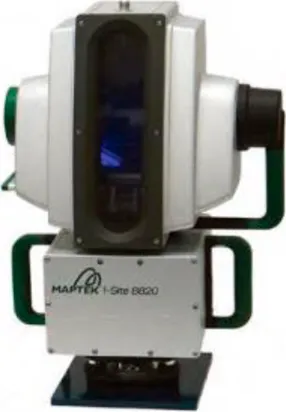 |
| Dimension (cm) | 44.5 × 24.6 × 37.8 |
| Weight (kg) | 12 |
| Max measuring range (m) | >2000 |
| Min measuring range (m) | 2.5 |
| Range accuracy (mm) | 6 mm at 100 m |
| Laser divergence angle (m rad) | 0.25 |
| Acquisition frequency (kHz) | 80, 40 |
| Angle measurement range (°) | 360° horizontal, 80° vertical |
| Wavelength | Near infrared |
TLS specification.
3.2 Workflow
Owing to the important role of GCPs in UAVs surveys and TLS surveys (Mancini et al., 2013; Galvan Rangel et al., 2018; Lee and Min, 2018; Zang et al., 2019), first we conducted field surveys around the study area and evenly arranged 24 control points (CPs). Subsequently, the two DJI consumer drones were used to conduct flight operations in the research area, and the accuracy was evaluated with and without GCPs. In terms of the TLS, a series of preprocessing steps, including filtering and splicing of the obtained point clouds data, were conducted, and the processed point clouds were fused with the DJI Phantom 4 RTK (with GCPs) point clouds data. Finally, the accuracies of the point clouds before and after the fusion were evaluated using the Cloud Compare software. The complete workflow is shown in Figure 2.
FIGURE 2
3.3 Field Work
3.3.1 UAVs Survey
GCPs and verification points (VPs) are necessary for high-precision topographic mapping because GCPs play a fundamental role in the workflow (Martinez-Carricondo et al., 2018; Aguera-Vega et al., 2020; Carrera-Hernandez et al., 2020). Therefore, we used real-time kinematic (RTK) positioning technology to accurately measure the coordinates of the 24 deployed CPs when operating the drone in the research area. According to the actual terrain, first we sat up a total of 10 GCPs (GCP 01–GCP 10) and 14 VPs (VP 01–VP 14) on the landslide and its surrounding areas. We created a Qianxun positioning service account, set the base station parameters, and finally measured the coordinates (Figure 3D). It should be noted that the horizontal error of the Qianxun’s position is 2 cm, and the vertical error is 5 cm.
FIGURE 3
The UAVs was flown at 15:00 (Beijing time) on October 24, 2020, when the weather conditions were good and were suitable for UAVs operations. The DJI GS Pro professional software was used to create flight missions for the UAVs, and a total of 12 routes were designed. In all of the automated grid tasks, the drone’s flight routes were straight lines. The course overlap rate was set to 90%, and the side overlap rate was set to 70%. The camera shooting mode selected was time-lapse shooting, the flying altitude was set to 150 m, the fixed altitude flight mode was selected for the DJI Mavic Pro UAVs, and the ground-like flight mode was selected for the DJI Phantom 4 RTK. The flight routes of the DJI Mavic Pro UAVs and DJI Phantom 4 RTK UAVs are shown in Figure 3G. It should be noted that the ground-like flight mode can maintain a constant distance between the UAVs and the target object, adapt to different terrain, automatically generate a higher route according to the terrain of the survey area, and keep the ground resolution consistent to obtain better data effects.
3.3.2 TLS Survey
In TLS measurements, it is important to establish an optimal scanner position distribution to completely cover the three-dimensional space or object to be scanned (Neugirg et al., 2016; Kowalski, 2018; Medjkane et al., 2018; Rechberger et al., 2021). The ruggedness and accessibility of the terrain were considered when selecting the continuous position of the scanner to eliminate possible data shadows and ensure that the point clouds of two adjacent positions had enough space to overlap. The scanning position was set on the lower part of the landslide, close to the flat area of the road, to ensure that some of the GCPs could be seen by the TLS at each scanning position (Figure 3A). We installed a Maptek I-Site 8820 TLS on a tripod and then placed the leveled instruments at TLS01, TLS02, and TLS03 to collect the point clouds data. The scanning time for each measuring station was about 7–8 min. The entire survey took about 40 min.
3.4 Data Processing and Accuracy Assessment
3.4.1 UAVs Data Preprocessing
The DJI Mavic Pro UAVs and DJI Phantom 4 RTK UAVs were used to obtain 735 and 813 images of the study area, respectively. We processed the images using the Pix4D mapper professional software, and used the SfM to complete the construction of the three-dimensional landslide model with and without GCPs. The main processing step of the Pix4D mapper includes preliminary processing, air triple encryption, and the generation of a DSM and digital orthophoto map (DOM). The specific process is as follows: 1) add photos; 2) determine the internal orientation elements and calibrate the camera; 3) search and match points with the same name using the scale-invariant feature transform (SIFT) algorithm; 4) use the same name points and the location information of the image for regional network leveling and calculate the difference to restore the position and posture of the image; 5) use the CPs or matching points for the air triple encryption to generate image point clouds; and 6) generate a DSM and DOM from the image point clouds. Figure 4 shows the DOM and DSM generated using the two UAVs when the GCPs were added. The left side of Figure 4 is the product generated using the DJI Mavic Pro UAVs, and the right side is the product generated using the DJI Phantom 4 RTK UAVs.
FIGURE 4
3.4.2 TLS Point Clouds Data Preprocessing
The raw laser point clouds data were processed using the Maptek I-Site Studio 7.0 software. First, the single point clouds obtained at each scanning position were assigned red-green-blue (RGB) values that represent natural colors. Then, we performed the preprocessing operations on the laser point clouds, including adding geo-references, registering the individual point clouds at different scanning positions; filtering the vegetation, terrain, and isolated points; and diluting the point clouds. Finally, we exported the processed point clouds data for use in the next step of the point clouds data fusion.
3.4.3 UAVs and TLS Point Cloud Data Fusion Method
The point clouds registration step mainly included two steps: rough registration and precise registration. Since different point clouds are relative to their respective coordinate systems, spatial offsets may occur. Therefore, integrating the point clouds into the correct position in the required coordinate system is referred to as rough registration. This step is also convenient for rough registration. The same point of spatial overlap in subsequent operations is quickly identified. The precise registration involves using the ICP algorithm to minimize the 3D distance between the polydata points by translating and/or rotating the entire point clouds along the X, Y, and Z axes until it reaches as far as possible between the polydata points (Xu et al., 2014; Du et al., 2015; Sasak et al., 2019). Finally, fusion of the point clouds data is achieved by setting the number of iterations, root mean square error, and overlap of the ICP algorithm.
The ICP algorithm checks the distance between all of the points in the point clouds and aligns the clouds with each other by extracting the features in the overlapping area of each cloud to obtain the smallest error (Sasak et al., 2019; Tsunetaka et al., 2020). It should be noted that owing to the heterogeneity of the UAVs and TLS point clouds data, the point clouds data need to be standardized before fusion, that is, the format is synonymously converted to the. las format.
3.4.4 Accuracy Assessment Method
ArcGIS 10.5, GCD 7.0, and Cloud Compare v2.11.2 were used to evaluate the accuracy of the mapping of the landslide topography. It should be noted that since the acquired data came from different data sources, spatial calibration, projection transformation, and elevation datum registration needed to be performed on the data. To accurately quantify the erosion phenomenon, we used the most popular GCD 7.0 to distinguish the noise information in the DSM, and we performed DSM uncertainty analysis on the real geomorphological changes. Therefore, the detection results are reliable.
In addition, to calculate the difference between the reference point clouds and the comparison point clouds relative to the local surface normal direction, we used the multiscale model-to-model clouds comparison (M3C2) algorithm in the Cloud Compare v2.11.2 software. This algorithm uses a set of core points to calculate the distance between and confidence interval of the points (Martinez-Carricondo et al., 2018; Ferrer-Gonzalez et al., 2020). The software operation steps are as follows. First, evaluate the density of each point clouds using the density tool in the “Calculate Geometric Features” drop-down menu to verify whether the two clouds can guarantee a uniform and similar distribution of the information. Then, set an appropriate clouds search radius and search height to ensure that the distance between the two point clouds is correctly evaluated. Finally, use different colors to express the positive and negative differences. In this process, the M3C2 algorithm provides a scalar field in which the distribution of these distances is expressed, which is the index of the M3C2 algorithm. It is an effective method for calculating the distance of a 3D point clouds. Currently, this algorithm is rarely used (Martinez-Carricondo et al., 2018; Ferrer-Gonzalez et al., 2020).
The GCD 7.0 software can be downloaded at http://gcd.riverscapes.xyz/. Cloud Compare v2.11.2 is a free open source software, which can be downloaded at http://cloudcompare.org/.
4 Results
4.1 Accuracy Assessment of UAVs Terrain Data
To evaluate the impact of the GCPs on the different types of UAVs, we sat up three testing schemes—Project 1: Mavic Pro UAVs (with GCPs)-Mavic Pro UAVs (without GCPs) (Figure 5); Project 2: Phantom 4 RTK UAVs (with GCPs)- Phantom 4 RTK UAVs (without GCPs) (Figure 6); and Project 3: Phantom 4 RTK UAVs (with GCPs)- Mavic Pro UAVs (with GCPs) (Figure 7)—and used GCD 7.0 and Cloud Compare v2.11.2 to evaluate the accuracy of the landslide terrain data. The results of the topography detection changes and the spatial distribution of the M3C2 of the first two schemes were obtained with and without GCPs. The results of the third scheme were obtained using the DJI Phantom 4 RTK UAVs minus the DJI Mavic Pro UAVs. It should be noted that the M3C2 distance calculated using the three schemes is the three-dimensional straight-line distance between two points, while the DSM of the difference (DOD) results show the elevation changes during the two periods of the DEM, which may cause differences between the M3C2 distance statistics table and the landform detection change results. In addition, owing to the existence of steep ridges and sinkholes in the study area, there were anomalous elevation change values in the DOD results, which were manually eliminated. The accuracy evaluation results of each program are described below.
FIGURE 5
FIGURE 6
FIGURE 7
4.1.1 Project 1 Accuracy Assessment
Figure 5A shows the results of the landform detection changes for Project 1, and Figure 5B shows the spatial distribution of the reference and comparison clouds calculated using M3C2. Figure 5C presents a statistical table of the landslide volume changes, and Figure 5D presents a statistical table of the M3C2 distances. We assimilated the M3C2 distance statistics table into a Gauss distribution, with a mean value of −0.8264 m and a standard deviation of 1.6282 m. Figure 5A illustrates the overestimation of the elevation of the landslide without GCPs using the DJI Mavic Pro UAVs (the resulting image is generally red), and the surface elevation deviation is within the range of −8 to 5 m. Most of the M3C2 distances are within a range of −2 to 1 m. According to the analysis of the above results, the accuracies of the terrain data acquired using the DJI Mavic Pro UAVs with and without GCPs are quite different. Although the DJI Mavic Pro UAVs can perform terrain mapping without GCPs, if GCPs are used, its accuracy will be greatly improved.
4.1.2 Project 2 Accuracy Assessment
Figure 6A shows the results of the landform detection change in Project 2, and Figure 6B shows the spatial distribution of the reference point clouds and comparison point clouds calculated using M3C2. Figure 6C presents a statistical table of the landslide volume change, and Figure 6D presents a statistical table of the M3C2 distances. The M3C2 distances were assimilated into a Gauss distribution, with a mean value of 0.2274 m and a standard deviation of 0.3833 m. By comparing Project 2 with Project 1, it was found that DJI Phantom 4 RTK UAVs has a higher average and standard deviation in terms of the accuracy and precision, and its overall accuracy is much higher than that of the DJI Mavic Pro UAVs. Although the surface elevation deviation is −0.2 to 1 m, which may be caused by the rapid undulation of the surface in a short distance, the overall analysis result is light blue (Figure 6A), and the M3C2 distance is mostly between −0.4 and 0.8 m. This shows that this UAVs can control the error within a very small range without GCPs.
4.1.3 Project 3 Accuracy Assessment
Figure 7A shows the results of the landform detection changes in Project 3, and Figure 7B shows the spatial distribution of the reference point clouds and comparison point clouds calculated using M3C2. Figure 7C presents the statistical table of the landslide volume changes, and Figure 7D presents the statistical table of the M3C2 distances. The M3C2 distances were assimilated into a Gauss distribution, with a mean value of −0.4857 m and a standard deviation of 0.7026 m. Under the same conditions and with GCPs, the terrain data obtained using DJI Mavic Pro UAVs are generally too large, and most of the difference results are negative. The DJI Phantom 4 RTK UAVs has a higher surveying accuracy, which is higher than that of the RTK positioning system. This is related to the resolution of the sensor.
Through analysis of the three sets of projects, it was concluded that the setting of GCPs is very important for the DJI Mavic Pro UAVs, and whether they are set or not significantly affects the obtained terrain data. Therefore, when conducting landslide terrain mapping, a UAVs with an RTK function should be selected, and a certain number of GCPs should also be set to ensure the accuracy of the terrain data.
4.2 UAVs and TLS Point Clouds Data Fusion Results
First, rough registration was performed based on the feature points recognized by four people so that the UAVs-SfM and TLS point clouds were closer in 3D space. Subsequently, owing to the large range of the UAVs data acquisition, the point clouds obtained using the UAVs were cropped according to the TLS area. Finally, the two point clouds were merged together using the ICP point clouds registration algorithm. In this process, the registration error was reduced by changing the number of iterations and removing the elevation anomaly point clouds. Finally, the TLS point clouds (Figure 8A) were used as the reference benchmark, and the UAVs point clouds (Figure 8B) were used to supplement the fusion point clouds of the shadow (hole) area in the TLS data (Figure 8C). The final fusion root mean square error (RMSE) of the two point clouds was 0.2 m, and the theoretical overlap was 100%. The fused point clouds were imported into ArcGIS 10.5 to generate the DSM of the Beiguo landslide (Figure 9B). Compared with the DSM generated using the TLS point clouds (Figure 9A), the accuracy of the DSM generated using the fused point clouds is significantly improved, and it can be seen from the DSM that the fusion result is more detailed and has more prominent texture.
FIGURE 8
FIGURE 9
4.3 VPs Accuracy Analysis
Before the flying missions, the UAVs used the RTK positioning technology to obtain the precise coordinates of the VPs, which were used to evaluate the accuracy of the UAVs and TLS in terms of mapping the landslide topography. Table 3 lists the three-dimensional coordinates of the VPs and the elevation values output by multiple DSMs (DSM resampled to 0.5 m resolution). Based on these results, it was found that the accuracy of the VP coordinates obtained using the DJI Phantom 4 RTK UAVs is much higher than that obtained using the DJI Mavic Pro UAVs. In addition, after fusing the UAVs point clouds data with the TLS point clouds data, the accuracy of the obtained coordinates was also significantly improved. It should be noted that because the TLS scanning area was smaller than the drone flight area, the coordinates of some of the VPs were missing.
TABLE 3
| Points | Measured value by RTK | Extracted Z value from DSMs | |||||||||
|---|---|---|---|---|---|---|---|---|---|---|---|
| X | Y | Z | Z1 (Mavic pro) | △Z1 | Z2 (phantom 4 RTK) | △Z2 | Z3 (TLS) | △Z3 | Z4 (UAVs-TLS) | △Z4 | |
| VP01 | 431,720.426 | 3877426.748 | 442.467 | 442.905 | 0.438 | 442.467 | 0.000 | — | — | — | — |
| VP02 | 431,753.452 | 3877464.442 | 440.858 | 441.207 | 0.349 | 440.861 | 0.003 | — | — | 439.887 | −0.971 |
| VP03 | 431,685.098 | 3877540.511 | 430.508 | 430.722 | 0.214 | 430.489 | −0.019 | — | — | — | — |
| VP04 | 431,798.044 | 3877576.670 | 439.289 | 439.329 | 0.040 | 439.273 | −0.016 | — | — | 439.281 | −0.008 |
| VP05 | 431,756.819 | 3877615.454 | 445.473 | 445.464 | −0.009 | 445.476 | 0.003 | — | — | — | — |
| VP06 | 431,638.531 | 3877587.314 | 445.142 | 445.000 | −0.142 | 445.043 | −0.099 | — | — | — | — |
| VP07 | 431,616.566 | 3877517.533 | 443.438 | 443.500 | 0.062 | 443.390 | −0.048 | — | — | — | — |
| VP08 | 432,115.914 | 3877430.911 | 318.714 | 319.876 | 1.162 | 318.729 | 0.015 | 319.040 | 0.326 | 318.725 | 0.011 |
| VP09 | 432,102.152 | 3877436.401 | 315.078 | 315.938 | 0.860 | 315.080 | 0.002 | 315.871 | 0.793 | 315.110 | 0.032 |
| VP10 | 432,035.867 | 3877337.063 | 318.670 | 319.994 | 1.324 | 318.622 | −0.048 | 319.694 | 1.024 | 318.614 | −0.056 |
| VP11 | 431,967.678 | 3877257.137 | 318.755 | 319.995 | 1.240 | 318.714 | −0.041 | 317.052 | −1.703 | 318.784 | 0.029 |
| VP12 | 431,927.400 | 3877246.039 | 317.124 | 318.131 | 1.007 | 317.114 | −0.010 | 317.683 | 0.559 | 317.135 | 0.011 |
| VP13 | 431,888.090 | 3877214.075 | 316.470 | 317.626 | 1.156 | 316.483 | 0.013 | 316.952 | 0.482 | 316.481 | 0.011 |
| VP14 | 431,880.584 | 3877166.044 | 317.308 | 318.708 | 1.400 | 317.321 | 0.013 | 317.341 | 0.033 | 317.962 | 0.654 |
| ME (m) | — | — | — | — | 0.650 | — | −0.017 | — | 0.216 | — | −0.032 |
| MAE (m) | — | — | — | — | 0.672 | — | 0.024 | — | 0.703 | — | 0.182 |
| RMSE (m) | — | — | — | — | 0.848 | — | 0.035 | — | 0.864 | — | 0.391 |
Elevation accuracy test of terrain data obtained by different equipment with GCPs.
For better precision exploration, we selected three indicators for verification: mean error (ME), mean absolute error (MAE), and RMSE. The equations used to calculate these values are as follows:
In Eqs 1–3, n is the number of measurements, Xi is the measured value, and Yi is the true value.
The calculation shows that the overall performance of the DJI Phantom 4 RTK UAVs was better than that of the DJI Mavic Pro UAVs for the landslide terrain, with ME values of 0.650 and −0.017 m, MAE values of 0.672 and 0.024 m, and RMSE values of 0.848 and 0.035 m, respectively. These results are because the DJI Phantom 4 RTK UAVs is a professional drone developed for surveying and mapping. It contains a brand-new RTK module and has stronger anti-magnetic interference and precise positioning capabilities. In addition, it provides real-time centimeter-level positioning data, which significantly improves the absolute accuracy of the image metadata. However, it is much expensive than the DJI Mavic Pro UAVs. Based on the above calculations, we found that the DJI Phantom 4 RTK UAVs can still guarantee quite high data accuracy without GCPs, which is also beneficial for engineering surveys conducted in high-risk areas. Of course, it is recommended that GCPs be arranged evenly throughout the study area to meet higher surveying and mapping requirements.
The difference between the accuracies before and after the TLS-UAVs fusion is large, with ME values of 0.216 and −0.032 m, MAE values of 0.703 and 0.182 m, and RMSE values of 0.864 and 0.391 m, respectively. The above results verify the feasibility of using the point clouds fusion method in mapping landslide topography. We know that UAVs surveying and mapping can achieve data collection over a large area in a short time of time. However, in some low visibility and/or rugged and steep mountain areas, the number of GCPs that can be deployed is small and/or the weather affects the results, resulting in UAVs tilt photogrammetry. The accuracy is reduced, and the data fusion between the UAVs and TLS will improve the overall accuracy to a certain extent.
5 Discussion
At present, the most commonly used remote sensing methods for fine 3D mapping are the TLS and UAVs-SfM methods (Saponaro et al., 2019; Sasak et al., 2019; Kamnik et al., 2020; Tsunetaka et al., 2020; Rechberger et al., 2021). Among them, the UAVs method is more widely used because of its portability, mobility, and low cost (Mancini et al., 2013; Lindner et al., 2015; Ma et al., 2018; Guisado-Pintado et al., 2019; Lu et al., 2020). In landslide terrain, a large part of the area is not reachable by land methods. Using UAVs photogrammetry in this type of terrain is advantageous in terms of time and cost (Lindner et al., 2015; Peppa et al., 2017; Pellicani et al., 2019). However, this method is strongly affected by weather conditions. For example, in strong winds, heavy rains, and areas with low visibility, the accuracy of UAVs products cannot be guaranteed (Ji and Luo, 2019; Aguera-Vega et al., 2020). In addition, in rugged and steep mountain areas, it is impossible to evenly deploy GCPs to improve the overall accuracy of the results. When the GCPs are unevenly distributed or the number of deployments is small, the UAVs image data are prone to distortion (Lee et al., 2019; Rogers et al., 2020). Under these conditions, the TLS method can still obtain high-precision point clouds data, and it uses less GCPs for geo-referencing (Chatzistamatis et al., 2018; Guisado-Pintado et al., 2019; Ji and Luo, 2019). However, owing to factors such as the terrain, slope, and scanner location, the point clouds products finally obtained using the TLS may contain data holes (Sasak et al., 2019; Tsunetaka et al., 2020). Preliminary studies have shown that for areas with low undulations, low texture, or high vegetation coverage, the accuracy of topographic mapping using TLS is lower (Ji and Luo, 2019; Hendrickx et al., 2020). The data fusion of TLS and UAVs photogrammetry combines the advantages of the two techniques to obtain detailed models of complex objects and produces better results (Chatzistamatis et al., 2018; Tsunetaka et al., 2020). The ICP algorithm has become a popular method for the mutual positioning of two spatially overlapping point clouds (point clouds registration) (Balsa-Barreiro and Fritsch, 2017). Combining the 3D point clouds of the UAVs-SfM and TLS with the ICP can greatly reduce data shadows (voids) and obtain realistic images.
We used two consumer UAVs, the DJI Mavic Pro UAVs and DJI Phantom 4 RTK UAVs, to photograph the study area, and we explored the impact of using GCPs on the different types of UAVs produced by DJI. We also used a Maptek I-Site 8820 TLS to scan the Beiguo landslide, and then we merged the resulting point clouds with the UAVs point clouds using the ICP algorithm. To verify the feasibility of fusing these point clouds, we used the M3C2 distance indicator in the Cloud Compare software to compare the distance between the clouds. In summary, when compared with using only a UAVs or TLS, the method of fusing the point clouds of both effectively solves the problem of missing data caused by special terrain, and it also improves the accuracy of the landslide terrain data.
It should be noted that in the accuracy verification process, because the horizontal accuracy error of the CPs measured by the RTK in this study is 2 cm and the vertical accuracy error is 5 cm, the CP coordinates measured in the field may appear within the accuracy range. The internal error will affect the data accuracy evaluation of the above described two UAVs and TLS methods to a certain extent. In the future, when measuring CPs, we will choose a static global navigation satellite system (GNSS) measurement method to reduce this error. Since our study area is mostly bare loess, tall vegetation is rare and the vegetation cover is largely sparse grassland. Therefore, we did not consider the problem of filtering vegetation in the point clouds data processing and fusion. The influences of the GCP distribution, local topography, and surface vegetation clearance on the DSM data will be the focus of our future research.
In addition, the two UAVs used in this study were equipped with optical lenses that cannot penetrate vegetation, and the TLS used had a fixed angular measurement range (360° horizontally, 80° vertical) and needed to be placed in a relatively stable area. Thus, the area blocked by the hillside cannot be well scanned by the laser. In the future, we will also try to choose a UAVs equipped with Lidar so that the point clouds data obtained will have a higher accuracy and precision. The fusion of airborne Lidar and TLS point clouds data will greatly reduce the impact of the vegetation and other features on the acquisition of the terrain information. The fusion effect that can be achieved needs to be explored further.
6 Conclusion
In the elevation accuracy evaluation of the terrain data obtained using the DJI Phantom 4 RTK UAVs and DJI Mavic Pro UAVs, we found that the DJI Phantom 4 RTK UAVs has a high mapping accuracy with and without GCPs. Although the DJI Mavic Pro UAVs is capable of topographic surveying and mapping without GCPs, its accuracy is greatly improved if GCPs are used. The expensive DJI Phantom 4 RTK UAVs is equipped with an RTK module and can receive network RTK signals (one prerequisite is in an area with a mobile network signal), so it is very suitable for high-precision terrain mapping. When limited by the terrain and other factors, the accuracy of the DJI Phantom 4 RTK UAVs in the No GCP operation mode is also acceptable. The DJI Phantom 4 RTK UAVs is better than the DJI Mavic Pro UAVs in terms of performance due to its integrated RTK module, but it is also more expensive. Owing to the constraints of scientific research costs and the fact that different projects have different mapping accuracy requirements, researchers can choose appropriate UAVs models and mapping schemes according to the actual situation.
Owing to the influence of elevation differences, weather, hill shade, and other factors, the accuracy of UAVs photogrammetry has a great uncertainty. In particular, when the underlying surface is very similar or the ground feature points are not easy to identify, the terrain point clouds or DSM generated by the UAVs will have even larger errors in some places. Because the UAVs takes orthophotos, there are basically no blind spots in the field of vision. Compared with UAVs, the TLS can actively transmit and receive laser signals, so it can obtain more 3D, more real, and more accurate topographic point clouds data. However, because the TLS is operated by setting up scanning stations, it is inevitable that there will be blind areas in TLS scanning due to the constraints of the terrain conditions. To integrate the advantages of the two sets of point clouds data, the TLS point clouds data were used as the reference data. Based on the ICP algorithm, the point clouds obtained using the DJI Phantom 4 RTK UAVs was integrated with the TLS point clouds data, which successfully solved the problem of missing data in the TLS blind areas. The ICP algorithm evaluation report shows that the RMSE of the final fusion of the two point clouds is 0.2 m and the theoretical overlap is 100%, indicating that the point clouds after fusion have a very high degree of matching and precision, and the new fusion point clouds have the advantages of the UAVs photogrammetry and TLS scanning methods. This study provides a solution for data fusion of point clouds obtained using optical lens UAVs and point clouds obtained using a TLS.
Statements
Data availability statement
The raw data supporting the conclusion of this article will be made available by the authors, without undue reservation.
Ethics statement
Written informed consent was obtained from the relevant individual(s) for the publication of any potentially identifiable images or data included in this article.
Author contributions
This paper represents a result of collaborative teamwork. ZM: Field investigation, data management, article writing. SH: Theoretical guidance, supervision, article revision, funding. NW: Resources, supervision. YL: Field projects design, measurement.
Funding
This research was funded by the National Natural Science Foundation of China (Grant No. 42001006), and the China Postdoctoral Science Foundation (Grant No. 2019M663792).
Conflict of interest
The authors declare that the research was conducted in the absence of any commercial or financial relationships that could be construed as a potential conflict of interest.
Publisher’s note
All claims expressed in this article are solely those of the authors and do not necessarily represent those of their affiliated organizations, or those of the publisher, the editors, and the reviewers. Any product that may be evaluated in this article, or claim that may be made by its manufacturer, is not guaranteed or endorsed by the publisher.
References
1
Agüera-VegaF.Agüera-PuntasM.Martínez-CarricondoP.ManciniF.CarvajalF. (2020). Effects of point Cloud Density, Interpolation Method and Grid Size on Derived Digital Terrain Model Accuracy at Micro Topography Level. Int. J. Remote Sensing41, 8281–8299. 10.1080/01431161.2020.1771788
2
BakirmanT.BayramB.AkpinarB.KarabulutM. F.BayrakO. C.YigitogluA.et al (2020). Implementation of Ultra-light UAV Systems for Cultural Heritage Documentation. J. Cult. Heritage44, 174–184. 10.1016/j.culher.2020.01.006
3
Balsa-BarreiroJ.FritschD. (2018). Generation of Visually Aesthetic and Detailed 3D Models of Historical Cities by Using Laser Scanning and Digital Photogrammetry. digital Appl. archaeology Cult. heritage8, 57–64. 10.1016/J.DAACH.2017.12.001
4
BredeB.CaldersK.LauA.RaumonenP.BartholomeusH. M.HeroldM.et al (2019). Non-destructive Tree Volume Estimation through Quantitative Structure Modelling: Comparing UAV Laser Scanning with Terrestrial LIDAR. Remote Sensing Environ.233, 111355. 10.1016/j.rse.2019.111355
5
CareyJ. A.PinterN.PickeringA. J.PrenticeC. S.DeLongS. B. (2019). Analysis of Landslide Kinematics Using Multi-Temporal Unmanned Aerial Vehicle Imagery, La Honda, California. Environ. Eng. Geosci.25, 301–317. 10.2113/eeg-2228
6
Carrera-HernándezJ. J.LevresseG.LacanP. (2020). Is UAV-SfM Surveying Ready to Replace Traditional Surveying Techniques?Int. J. Remote Sensing41, 4820–4837. 10.1080/01431161.2020.1727049
7
ChatzistamatisS.KalaitzisP.ChaidasK.ChatzitheodorouC.SoulakellisN. (2018). Fusion of Tls and Uav Photogrammetry Data for post-earthquake 3d Modeling of a Cultural Heritage Church. Geoinformation Disaster Manage.XLII-3/W4, 143–150. 10.5194/isprs-archives-xlii-3-w4-143-2018
8
ChengZ.GongW.TangH.JuangC. H.DengQ.ChenJ.et al (2021). UAV Photogrammetry-Based Remote Sensing and Preliminary Assessment of the Behavior of a Landslide in Guizhou, China. Eng. Geology.289, 106172. 10.1016/j.enggeo.2021.106172
9
DuS.LiuJ.ZhangC.ZhuJ.LiK. (2015). Probability Iterative Closest point Algorithm for M-D point Set Registration with Noise. Neurocomputing157, 187–198. 10.1016/j.neucom.2015.01.019
10
FengM.YangM.XiaY.BaiH. (2020). 3D Laser Scanning and Oblique Photogrammetry for 3D Modeling of High Scarps. Sci. Surv. Mapp.45, 99–122. 10.16251/j.cnki.1009-2307.2020.01.015
11
Ferrer-GonzálezE.Agüera-VegaF.Carvajal-RamírezF.Martínez-CarricondoP. (2020). UAV Photogrammetry Accuracy Assessment for Corridor Mapping Based on the Number and Distribution of Ground Control Points. Remote Sensing12, 2447. 10.3390/rs12152447
12
GodoneD.AllasiaP.BorrelliL.GullàG. (2020). UAV and Structure from Motion Approach to Monitor the Maierato Landslide Evolution. Remote Sensing12, 1039. 10.3390/rs12061039
13
Guisado-PintadoE.JacksonD. W. T.RogersD. (2019). 3D Mapping Efficacy of a Drone and Terrestrial Laser Scanner over a Temperate beach-dune Zone. Geomorphology328, 157–172. 10.1016/j.geomorph.2018.12.013
14
HendrickxH.De SlooverL.StalC.DelaloyeR.NyssenJ.FranklA. (2020). Talus Slope Geomorphology Investigated at Multiple Time Scales from High‐resolution Topographic Surveys and Historical Aerial Photographs (Sanetsch Pass, Switzerland). Earth Surf. Process. Landforms45, 3653–3669. 10.1002/esp.4989
15
HuS.QiuH.PeiY.CuiY.XieW.WangX.et al (2019). Digital Terrain Analysis of a Landslide on the Loess Tableland Using High-Resolution Topography Data. Landslides16, 617–632. 10.1007/s10346-018-1103-0
16
HuS.QiuH.WangN.CuiY.WangJ.WangX.et al (2020). The Influence of Loess Cave Development upon Landslides and Geomorphologic Evolution: A Case Study from the Northwest Loess Plateau, China. Geomorphology359, 107167. 10.1016/j.geomorph.2020.107167
17
HuS.QiuH.WangX.GaoY.WangN.WuJ.et al (2018). Acquiring High-Resolution Topography and Performing Spatial Analysis of Loess Landslides by Using Low-Cost UAVs. Landslides15, 593–612. 10.1007/s10346-017-0922-8
18
JaudM.BertinS.BeauvergerM.AugereauE.DelacourtC. (2020). RTK GNSS-Assisted Terrestrial SfM Photogrammetry without GCP: Application to Coastal Morphodynamics Monitoring. Remote Sensing12, 1889. 10.3390/rs12111889
19
JiH.LuoX. (2019). 3D Scene Reconstruction of Landslide Topography Based on Data Fusion between Laser point Cloud and UAV Image. Environ. Earth Sci.78, 534. 10.1007/s12665-019-8516-5
20
KamnikR.Nekrep PercM.TopolšekD. (2020). Using the Scanners and Drone for Comparison of point Cloud Accuracy at Traffic Accident Analysis. Accid. Anal. Prev.135, 105391. 10.1016/j.aap.2019.105391
21
KowalskiA. (2018). Monitoring of Anthropogenic Landslide Activity with Combined UAV and Lidar-Derived DEMS a Case Study of the Czerwony Wawoz Landslide (SW Poland. Western Sudetes). Acta Geodynamica et Geomaterialia15, 117–129. 10.13168/agg.2018.0008
22
LamstersK.KarušsJ.KrievānsM.JeškinsJ. (2020). High-resolution Orthophoto Map and Digital Surface Models of the Largest Argentine Islands (The Antarctic) from Unmanned Aerial Vehicle Photogrammetry. J. Maps16, 335–347. 10.1080/17445647.2020.1748130
23
LeeJ.KangJ.LeeS. (2019). A Study on the Improvement of UAV Based 3D Point Cloud Spatial Object Location Accuracy Using Road Information. Korean J. Remote Sensing35, 705–714. 10.7780/kjrs.2019.35.5.1.7
24
LeeJ.MinS. S. (2018). Assessment of Positioning Accuracy of UAV Photogrammetry Based on RTK-GPS. J. Korea Academia-Industrial cooperation Soc.19, 63–68. 10.5762/kais.2018.19.4.63
25
LiH.-b.YangX.-g.SunH.-l.QiS.-c.ZhouJ.-w. (2019). Monitoring of Displacement Evolution during the Pre-failure Stage of a Rock Block Using Ground-Based Radar Interferometry. Landslides16, 1721–1730. 10.1007/s10346-019-01228-1
26
LiZ.WangJ.ZhangD. (2021). Creep Behavior of Intact Loess Followed Unloading Paths. Front. Earth Sci.9, 744864. 10.3389/feart.2021.744864
27
LindnerG.SchramlK.MansbergerR.HüblJ. (2015). UAV Monitoring and Documentation of a Large Landslide. Appl. Geomat8, 1–11. 10.1007/s12518-015-0165-0
28
LiuZ.QiuH.MaS.YangD.PeiY.DuC.et al (2021). Surface Displacement and Topographic Change Analysis of the Changhe Landslide on September 14, 2019, China. Landslides18, 1471–1483. 10.1007/s10346-021-01626-4
29
LuH.MaL.FuX.LiuC.WangZ.TangM.et al (2020). Landslides Information Extraction Using Object-Oriented Image Analysis Paradigm Based on Deep Learning and Transfer Learning. Remote Sensing12, 752. 10.3390/rs12050752
30
MaS.QiuH.HuS.YangD.LiuZ. (2021). Characteristics and Geomorphology Change Detection Analysis of the Jiangdingya Landslide on July 12, 2018, China. Landslides18, 383–396. 10.1007/s10346-020-01530-3
31
MaS.XuC.ShaoX.ZhangP.LiangX.TianY. (2018). Geometric and Kinematic Features of a Landslide in Mabian Sichuan, China, Derived from UAV Photography. Landslides16, 373–381. 10.1007/s10346-018-1104-z
32
ManciniF.DubbiniM.GattelliM.StecchiF.FabbriS.GabbianelliG. (2013). Using Unmanned Aerial Vehicles (UAV) for High-Resolution Reconstruction of Topography: The Structure from Motion Approach on Coastal Environments. Remote Sensing5, 6880–6898. 10.3390/rs5126880
33
Martínez-CarricondoP.Agüera-VegaF.Carvajal-RamírezF.Mesas-CarrascosaF.-J.García-FerrerA.Pérez-PorrasF.-J. (2018). Assessment of UAV-Photogrammetric Mapping Accuracy Based on Variation of Ground Control Points. Int. J. Appl. Earth Observation Geoinformation72, 1–10. 10.1016/j.jag.2018.05.015
34
MedjkaneM.MaquaireO.CostaS.RoullandT.LetortuP.FauchardC.et al (2018). High-resolution Monitoring of Complex Coastal Morphology Changes: Cross-Efficiency of SfM and TLS-Based Survey (Vaches-Noires Cliffs, Normandy, France). Landslides15, 1097–1108. 10.1007/s10346-017-0942-4
35
NeugirgF.StarkM.KaiserA.VlacilovaM.Della SetaM.VergariF.et al (2016). Erosion Processes in Calanchi in the Upper Orcia Valley, Southern Tuscany, Italy Based on Multitemporal High-Resolution Terrestrial LiDAR and UAV Surveys. Geomorphology269, 8–22. 10.1016/j.geomorph.2016.06.027
36
OuyangC.AnH.ZhouS.WangZ.SuP.WangD.et al (2019). Insights from the Failure and Dynamic Characteristics of Two Sequential Landslides at Baige Village along the Jinsha River, China. Landslides16, 1397–1414. 10.1007/s10346-019-01177-9
37
PellicaniR.ArgentieroI.ManzariP.SpilotroG.MarzoC.ErminiR.et al (2019). UAV and Airborne LiDAR Data for Interpreting Kinematic Evolution of Landslide Movements: The Case Study of the Montescaglioso Landslide (Southern Italy). Geosciences9, 248. 10.3390/geosciences9060248
38
PeppaM. V.MillsJ. P.MooreP.MillerP. E.ChambersJ. E. (2017). Brief Communication: Landslide Motion from Cross Correlation of UAV-Derived Morphological Attributes. Nat. Hazards Earth Syst. Sci.17, 2143–2150. 10.5194/nhess-17-2143-2017
39
QuF.QiuH.SunH.TangM. (2021). Post-failure Landslide Change Detection and Analysis Using Optical Satellite Sentinel-2 Images. Landslides18, 447–455. 10.1007/s10346-020-01498-0
40
RangelJ. M. G.GonçalvesG. R.PérezJ. A. (2018). The Impact of Number and Spatial Distribution of GCPs on the Positional Accuracy of Geospatial Products Derived from Low-Cost UASs. Int. J. Remote Sensing39, 7154–7171. 10.1080/01431161.2018.1515508
41
RechbergerC.FeyC.ZangerlC. (2021). Structural Characterisation, Internal Deformation, and Kinematics of an Active Deep-Seated Rock Slide in a valley Glacier Retreat Area. Eng. Geology.286, 106048. 10.1016/j.enggeo.2021.106048
42
RogersS. R.ManningI.LivingstoneW. (2020). Comparing the Spatial Accuracy of Digital Surface Models from Four Unoccupied Aerial Systems: Photogrammetry versus LiDAR. Remote Sensing12, 2806. 10.3390/rs12172806
43
RossiG.TanteriL.TofaniV.VannocciP.MorettiS.CasagliN. (2018). Multitemporal UAV Surveys for Landslide Mapping and Characterization. Landslides15, 1045–1052. 10.1007/s10346-018-0978-0
44
SamodraG.RamadhanM. F.SartohadiJ.SetiawanM. A.ChristantoN.SukmawijayaA. (2020). Characterization of Displacement and Internal Structure of Landslides from Multitemporal UAV and ERT Imaging. Landslides17, 2455–2468. 10.1007/s10346-020-01428-0
45
SaponaroM.PratolaL.SaponieriA.TarantinoE.FratinoU. (2019). “Cloud-To-Cloud Comparison and Integration of Tls and Uav Surveys for the Maintenance of Coastal protection Systems,” in Paper presented at the International Short Course/Conference on Applied Coastal Research Engineering, Geology, Ecology & Management (SCACR2019), Bari, Italy, September 11, 2019.
46
ŠašakJ.GallayM.KaňukJ.HofierkaJ.MinárJ. (2019). Combined Use of Terrestrial Laser Scanner and UAV Photogrammetry in Mapping Alpine Terrain. Remote Sensing11, 2154. 10.3390/rs11182154
47
SenkalE.KaplanG.AvdanU. (2021). Accuracy Assessment of Digital Surface Models from Unmanned Aerial Vehicles' Imagery on Archaeological Sites. Int. J. Eng. Geosciences6, 81–89. 10.26833/ijeg.696001
48
StringerJ.BrookM. S.JusticeR. (2021). Post-earthquake Monitoring of Landslides along the Southern Kaikōura Transport Corridor, New Zealand. Landslides18, 409–423. 10.1007/s10346-020-01543-y
49
TsunetakaH.HottaN.HayakawaY. S.ImaizumiF. (2020). Spatial Accuracy Assessment of Unmanned Aerial Vehicle-Based Structures from Motion Multi-View Stereo Photogrammetry for Geomorphic Observations in Initiation Zones of Debris Flows, Ohya Landslide, Japan. Prog. Earth Planet. Sci.7, 24. 10.1186/s40645-020-00336-0
50
WijesinghaJ.MoeckelT.HensgenF.WachendorfM. (2019). Evaluation of 3D point Cloud-Based Models for the Prediction of Grassland Biomass. Int. J. Appl. Earth Observation Geoinformation78, 352–359. 10.1016/j.jag.2018.10.006
51
XuQ.LiW.-l.JuY.-z.DongX.-j.PengD.-l. (2020). Multitemporal UAV-Based Photogrammetry for Landslide Detection and Monitoring in a Large Area: a Case Study in the Heifangtai Terrace in the Loess Plateau of China. J. Mt. Sci.17, 1826–1839. 10.1007/s11629-020-6064-9
52
XuZ.WuL.ShenY.LiF.WangQ.WangR. (2014). Tridimensional Reconstruction Applied to Cultural Heritage with the Use of Camera-Equipped UAV and Terrestrial Laser Scanner. Remote Sensing6, 10413–10434. 10.3390/rs61110413
53
YanY.MaS.YinS.HuS.LongY.XieC.et al (2021). Detection and Numerical Simulation of Potential Hazard in Oil Pipeline Areas Based on UAV Surveys. Front. Earth Sci.9, 665478. 10.3389/feart.2021.665478
54
YangD.QiuH.HuS.PeiY.WangX.DuC.et al (2021). Influence of Successive Landslides on Topographic Changes Revealed by Multitemporal High-Resolution UAS-Based DEM. Catena202, 105229. 10.1016/j.catena.2021.105229
55
YuM.HuangY.ZhouJ.MaoL. (2017). Modeling of Landslide Topography Based on Micro-unmanned Aerial Vehicle Photography and Structure-From-Motion. Environ. Earth Sci.76, 520. 10.1007/s12665-017-6860-x
56
ZangY.YangB.LiJ.GuanH. (2019). An Accurate TLS and UAV Image Point Clouds Registration Method for Deformation Detection of Chaotic Hillside Areas. Remote Sensing11, 647. 10.3390/rs11060647
57
ZhangC.YangS.ZhaoC.LouH.ZhangY.Baij.et al (2018). Topographic Data Accuracy Verification of Small Consumer UAV. J. Remote Sensing22, 185–195. 10.11834/jrs.20186483
58
ZhangF.PengJ.WuX.PanF.JiangY.KangC.et al (2021). A Catastrophic Flowslide that Overrides a Liquefied Substrate: the 1983 Saleshan Landslide in China. Earth Surf. Process. Landforms46, 2060–2078. 10.1002/esp.5144
59
ZhouT.HasheminasabS. M.RaviR.HabibA. (2020). LiDAR-Aided Interior Orientation Parameters Refinement Strategy for Consumer-Grade Cameras Onboard UAV Remote Sensing Systems. Remote Sensing12, 2268. 10.3390/rs12142268
Summary
Keywords
UAVs photogrammetry, TLS survey, precision evaluation, point clouds fusion, loess landslide
Citation
Mao Z, Hu S, Wang N and Long Y (2021) Precision Evaluation and Fusion of Topographic Data Based on UAVs and TLS Surveys of a Loess Landslide. Front. Earth Sci. 9:801293. doi: 10.3389/feart.2021.801293
Received
25 October 2021
Accepted
30 November 2021
Published
24 December 2021
Volume
9 - 2021
Edited by
Fanyu Zhang, Lanzhou University, China
Reviewed by
Weile Li, Chengdu University of Technology, China
Qingkai Meng, Qinghai University, China
Updates
Copyright
© 2021 Mao, Hu, Wang and Long.
This is an open-access article distributed under the terms of the Creative Commons Attribution License (CC BY). The use, distribution or reproduction in other forums is permitted, provided the original author(s) and the copyright owner(s) are credited and that the original publication in this journal is cited, in accordance with accepted academic practice. No use, distribution or reproduction is permitted which does not comply with these terms.
*Correspondence: Sheng Hu, shenghu@nwu.edu.cn; Ninglian Wang, nlwang@nwu.edu.cn
This article was submitted to Geohazards and Georisks, a section of the journal Frontiers in Earth Science
Disclaimer
All claims expressed in this article are solely those of the authors and do not necessarily represent those of their affiliated organizations, or those of the publisher, the editors and the reviewers. Any product that may be evaluated in this article or claim that may be made by its manufacturer is not guaranteed or endorsed by the publisher.