 Lu Zheng
 Zhiyuan Zhu
 Qi Wei
 Kaihui Ren
 Yihan Wu
 Wei Wu
 Hong Zhang
- 1College of Civil Engineering, Fuzhou University, Fuzhou, China
- 2Sichuan University-The Hong Kong Polytechnic University institute for Disaster Management and Reconstruction, Sichuan University, Chengdu, China
- 3College of Civil Engineering, Tongji University, Shanghai, China
The use of feasible 3-D numerical methods has become essential for addressing problems related to rockfall hazard. Although several models with various degrees of complexity are available, certain trajectories and impact dynamics related to some model inputs could fall in the rockfall observations area but are rarely calibrated against reflecting its range, especially the lateral deviations. A major difficulty exists in the lack of simulating the apparent randomness during the impact-rebound process leading to both ground roughness and block irregularities. The model presented here is based on three-dimensional discontinuous deformation analysis (3-D DDA). Despite similarities to previous simulations using 3-D DDA, the model presented here incorporates several novel concepts: (1) ground roughness is represented as a random change of slope angle by height perturbation at a grid point in DEM terrain; (2) block irregularities are modelled directly using polyhedron data; (3) a scaled velocity restitution relationship is introduced to consider incident velocity and its angle. Lateral deviations of rebound velocity, both direction and value, at impact are similarly accounted for by perturbing the ground orientation laterally, thus inducing scatter of run-out directions. With these features, the model is capable to describe the stochastic rockfall dynamics. In this study, 3-D DDA was then conducted to investigate the dynamic behavior of the rockfall and examine the role of sphericity of the rock block travelling on bench slopes with different ground roughness levels. Parametric analyses were carried out in terms of cumulative distribution function (CDF) to investigate for spatial distribution (both runout distance and lateral displacement), velocity and jumping height. The effects of block shape and ground roughness revealed by these factors were discussed. It suggests that ground roughness amplifies the randomness and plays important roles on the dynamic behavior of the system; irregularity from block sphericity will further amplify the randomness especially when the size of the rock is relatively small compared to the roughness level. Both irregularities should be taken into consideration in simulating rockfall problems. Further calibration of the new model against a range of field datasets is essential.
1 Introduction
Rockfall refers to a dynamic process that unstable rock mass is detached from the cliff or individual boulder from the surface of slope, moves quickly downward through one or several combinations of movement modes such as toppling, falling, rebounding, rolling or sliding, finally comes to rest near obstacles or on a relatively flat field (Volkwein et al., 2011; Hungr et al., 2014). Small as the scale of rockfall is, it is difficult to predict in most cases due to its suddenness, uncertainty, and high recurrence frequency (Guzzetti et al., 2002; Cheng and Su, 2014; Wei et al., 2020). Meanwhile, it has the characteristics of high velocity and energy, greatly threatens the construction and operation of hydropower projects, mines, highways, railways, pipelines, etc. As the demand for the development and utilization of mountainous areas grows, it becomes one of the major geological disasters in these areas: the rockfall cases are more frequent, while reports about heavy casualties and economic losses caused by rockfalls are more common (Stacey and Gumede, 2007; Pappalardo et al., 2014; Singh et al., 2021).
Nowadays there are many technologies for preventing or reducing rockfall disasters, but they are technically difficult to implement and cannot be applied anywhere, because rockfalls are difficult to predict and not easily accessible as mentioned above (Gischig et al., 2015). To avoid rockfall disasters, one way is to identify hazardous areas that may be affected and to avoid human activities there. Another way is to eliminate or reduce the danger zones by using earthwork, rigid or flexible barriers to intercept potentially dangerous rockfall.
The design for rockfall countermeasures depends on the accurate analysis of the rockfall dynamics, including velocity, jumping height, spatial distribution, etc. Due to lack of detail data for quantitative observations on-site, rockfall dynamics based on different trajectory modeling algorithms are adopted to evaluate those characteristic parameters. For example, Chen (2013) discussed many parameters that affect the trajectory and energy conversion of rockfall. Corresponding numerical simulation analysis was carried out to summarize the movement mode of rockfall under different coupling action of external factors and internal factors using the fast lumped-mass method.
Furthermore, Crosta et al. (2015) introduced the key issues in the rockfall model, pointed out that rock shape, three-dimensional characteristics of slope geometry, and ground roughness are the main factors that control the randomness of rockfall trajectory, and came to a conclusion that rough slope causes rockfall trajectory to deviate from its steepest gradient. Thus, it was first discussed based on lumped-mass methods by introducing coefficients to characterize the rock shape and slope roughness. Ge et al. (2021) used ROCFALL 8.0, through 2500 sets of orthogonal experiments, the influence of rock shape, volume, angular velocity and slope angle, surface hardness, ground roughness, and other factors on the runout distance and potential energy loss rate of rockfall were discussed, and then came to a conclusion about the key factors affecting the movement of rockfalls; Gischig et al. (2015) adopted the lumped-mass method, using both ground and particle roughnesses to describe the random characteristics of rockfall dynamics, successfully simulated the velocity, trajectory, and jump height of rockfall. Then, actual rock shapes were taken into more complex algorithms, especially numerical methods. Vijayakumar et al. (2012) used the shape, size, and contact point of rockfall to calculate the translation and rotation components of kinetic energy of the rocks based on theoretical analysis and illustrated the influence of rocks’ shapes on the normal restoration coefficient of rockfall. Glover (2015) used a three-dimensional rigid rockfall model considering rock shapes to perform numerical simulations on rockfall. Their results proved the importance of rock shape in rockfall dynamics.
Discontinuous deformation analysis (DDA) (Shi and Goodman, 1985; Shi, 2001), as a calculation method that can analyze large deformations and large displacements of jointed rock masses in arbitrary shapes, has outstanding advantages and wide application prospects in disaster prediction and protection, extremely for accurate reproduction of rockfall characteristics (Ma et al., 2011). Notably 3-D DDA can veritably simulate 3D terrain features of slope and shapes of rockfalls (Wang et al., 2017; Liu et al., 2021; Ma and Liu, 2021), to investigate lateral displacement of rockfall, which is important for countermeasures design (Liu et al., 2020). Chen et al. (2013) compared the differences on prediction of rockfall dynamics between 2-D and 3-D DDA simulations. The results show that 3-D simulations are more suitable for providing inclined slope with rough surface or trees distributed, while 2-D ones have better efficiency for the slopes dominated by valleys and ravines, which helps to choose the appropriate DDA simulation for rockfall analysis. At present, the application of programs designed based on 3-D DDA theory is more and more widespread.
It is to be noted that, through numerical analysis, literature has proved that rock shape and ground roughness have a significant impact on the characteristics of rockfall. However, there are still the following obvious shortcomings: (1) Currently commonly used algorithms (2-D ones, such as ROCKFALL, SASS-MASSI, Salto Massi; 3-D ones, such as Eboul, STONE, RAMMS) usually fast simulate rockfall through the lumped-mass or rigid body method (Huang et al., 2010), are difficult to access the influence over the rockfall dynamics from different rock shapes and ground roughness levels; (2) using DDA or DEM numerical methods, the problem on probabilistic randomness is considered less, trajectories of rockfall through multiple calculation cycles are pretty much the same.
However, the movement of rockfall on the slope is affected by many complicated factors. Each impact between rock and slope is a random process with great randomness (Wang et al., 2015; Sun and Duan, 2020). The first source of randomness is the irregularity of the ground surface, the presence of obstacles such as boulders or trees, and the variability of surface strength and stiffness. The second source is the irregularity of rock shapes. As to non-spherical rock, every small movement at the contact point in the rockfall direction will cause an apparent change in the impact conditions. Irregular rocks encounter similar random collision conditions when interacting with non-featured surfaces, just like spheres encounter on rough surfaces. Generally speaking, the two random effects occur at the same time, and cause randomness to be one of the major features of rock-slope impact. Therefore, the new model proposed in this article introduced several new concepts, which are important for accurate simulation of rockfall dynamics.
(1) The first concept involves the definition of roughness. The hypothesis is that the random disturbance of slope surface micro-topography, that is, the degree of unevenness of the surface, is expressed by the product of the micro-topography parameter and the fluctuating frequency, which is specified by the mathematical expression of roughness proposed by Romkens and Wang (1986).
(2) The second concept concerns the presentation of block irregularity. In actual rockfalls, the rock shapes are relatively irregular, and will lead to corresponding unique movement modes (Crosta et al., 2015). Therefore, the half-edge data structure is employed in this article to approximately represent the rock shape to different levels of detail.
(3) The third concept introduces the scaled velocity restitution relationship (Pfeiffer and Bowen, 1989) to consider both the modulus and incident angle of incident velocity. Coupling with the disturbance of the ground direction, it leads to the dispersion of rebounding, not only the direction, but also the value.
Although the concepts discussed earlier in this paper rely on many assumptions, they could draw out a successful calibration of the resulting model. Due to the stochastic nature implemented in 3-D DDA to express these concepts, this model is flexible for probabilistic rockfall hazard investigations. The model was then used to describe the rockfall dynamics of four platonic-shaped rocks moving on bench slopes with different roughness levels. Stochastic results were evaluated in terms of cumulative distribution function (CDF) of spatial distribution (both runout distance and lateral displacement), velocity, and jumping height. The effects of block shape and ground roughness revealed by these factors were discussed.
2 Methods
2.1 Applying Stochastic Roughness
Roughness is the degree of unevenness in the surface, also called micro-relief. Romkens and Wang (1986) divided it into four categories, each representing a different order of magnitude: (1) micro-relief variations due to individual particles, micro- or macro-aggregates, uniform in all directions, with an order of magnitude of 1 mm, varying from 0 to 2 mm; (2) surface variations caused by cloddiness, non-directional, often referred to as random roughness, with an order of magnitude of 100 mm, ranging up to 200 mm; (3) the ground caused by tillage tools having systematic differences, directional with an order of magnitude of 100∼200 mm, also related to oriented roughness; (4) higher order roughness, indicating variations in the level of field, watershed, or landscape. Such variations are generally very substantial with non-direction.
Romkens and Wang (1986) defined a dimensionless roughness parameter R arbitrarily formulated as the product of the micro-relief index A and the peak frequency F:
where A refers to the area per unit length between the measured surface profile and the least square regression line through all measured elevations on a transect; F is the number of elevation maxima per unit transect length. A 2-D scheme and computed values of R, A, F are depicted in Figure 1.
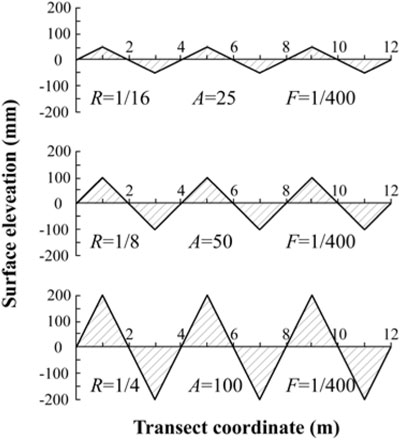
FIGURE 1. Schematic representations of ground roughness (modified from Romkens and Wang (1986).
Furthermore, roughness index R could be approximately considered as elevation variations at grid-point when F is the reciprocal value of 2 times fixed cell size. Herein ground roughness could be portrayed randomly by adopting elevation variations at all grid-points under a statistical distribution, while remaining the slope geometry unchanged, as indicated in Figure 2A. Examples with different R values (1/8, 1/4, 1/2) based on a 3-D topography of cell size of 2 m are demonstrated in Figures 2B,D. Their grid-point elevation variations obey normal distributions with expectation μ = 0, standard deviation σ = 100, 200, 400 mm, respectively (Table 1).
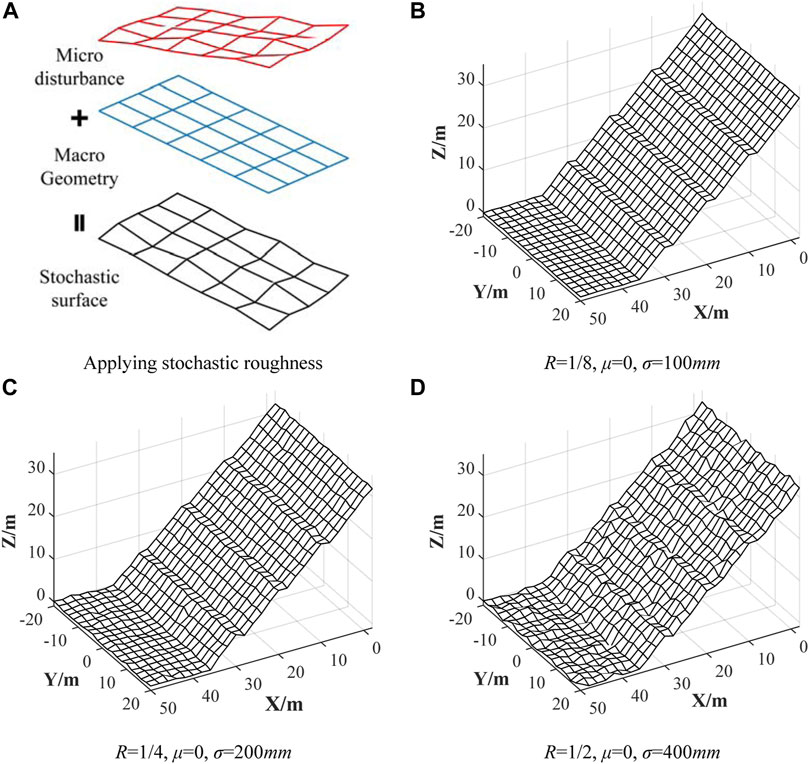
FIGURE 2. Slope surfaces with different roughness levels. (A) Applying stochastic roughness. (B) R = 1/8, μ = 0, σ = 100 mm. (C) R = 1/4, μ = 0, σ = 200 mm. (D) R = 1/2, μ = 0, σ = 400 mm.
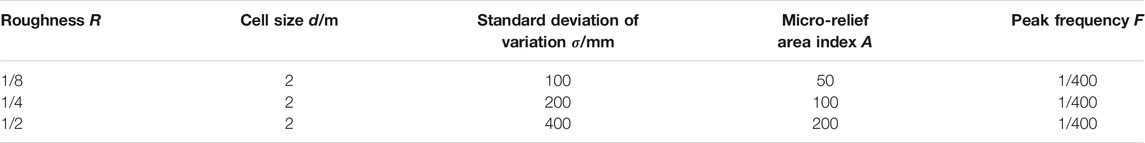
TABLE 1. Standard deviation of variation, micro-relief area index, and peak frequency for each roughness practice
Therefore, coupling with the TRN (triangulated regular network) proposed by Chen et al. (2013) and Wang et al. (2017), stochastic slope surfaces at different roughness levels could be implemented for 3-D DDA rockfall simulation.
2.2 Representing Falling Rock
In actual rockfall disasters, the rock shapes are quite different and relatively irregular. In order to demonstrate the detail shape of falling rock, the half-edge data structure (Figure 3A) is introduced into the simulation. It organizes and describes the Eigen frame of rock body from a cloud of points, which could be captured by laser scans etc. It could represent the complex shape from convex to concave, even multi-connected polygon (2-D) and polyhedron (3-D) (Figure 3B).
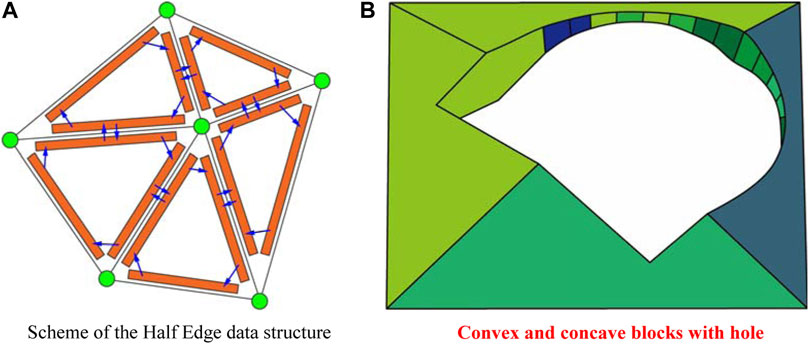
FIGURE 3. Example of complex rock block representations using the half edge data structure. (A) Scheme of the half edge data structure. (B) Convex and concave blocks with hole.
The rock’s mass m is derived from its volume calculated using the Simplex Integration (Shi and Goodman, 1985; Shi, 2001) with user defined density ρ. The rock has 12 degrees of freedom (three translational and three rotational displacements, three tension and three shear strains, Equation (2)) to describe the rock mass center (x0, y0, z0) at any time t. At time t = 0, rocks fill off or are released from the slope surface after destruction, which is located at some distance above the terrain.
2.3 Modelling Flight Trajectory
The trajectory between collisions is computed based on DDA (2-D and 3-D, respectively). The air and vegetation resistance are neglected. The only acceleration is gravity (g). The accuracy was validated using several basic types of rockfall motion models separately (Wang et al., 2017) except the collision-rebound. It shows DDA is an effective tool with high accuracy to predict rockfall dynamics of free fall, rolling, and sliding.
During rockfall, collision-rebound is the most complex and uncertain, usually modelled as an inelastic process and acting at the body’s center of mass. Previous literature shows that DDA has the capacity to accurately determine the contact points (Zhang et al., 2015; Zhang et al., 2016) between rock and slope surface of any arbitrary shapes with appropriate simulation parameters (Zhang et al., 2018). However, the contact force and rebound displacement could be accurate enough within the limit scope of the incident velocity using a fixed spring stiffness value. In other words, it is difficult to reproduce proper energy-losses when the incident velocity varies largely during the whole rockfall process.
It could be simplified using a restitution coefficient determined from field observations or laboratory experiments, by velocity coefficient Rv (the ratio of rebound velocity Vout to incident one Vin) or corresponding energy coefficient Re (Dorren, 2003; Volkwein et al., 2011). For rockfall modelling Rv is commonly further decomposed into slope normal and tangential components (Rn and Rt). Rotational speed (RS) has also been considered in some rockfall models by adding the corresponding energy to access Re (Chau et al., 2002), but there is very limited data on this component due to the difficulties of resolving velocities from video-geometric measurements. The RS effect remains argued and unsolved (Duan et al., 2021; Tang et al., 2021). Meanwhile, some recent laboratory experiment results indicate that energy based definitions do not perform well in rockfall modelling (Asteriou, 2019; Ji et al., 2021). Therefore, only Rv is embedded in the proposed model.
It is achieved by adopting the post-modification proposed by Chen (2003). The rebound velocity (Vx, Vy, Vz) (the velocity when contact between rock block and surface TRN ends) is DDA simulated and then modified to be not greater than Rv times of incident velocity
Rv value is assigned due to the surface material of each TRN cell.
Considering that Rv is obviously dependent on both the modulus and incident angle of Vin the normal direction, various correction schemes have been proposed in previous studies. This paper adopts the model proposed by Pfeiffer and Bowen (1989), as shown.
Among them,
where Vnin and Vnout are the normal components of Vin and Vout, respectively; Vnin≠0. K is the slope of the S-F curve. Rn (scaled) and K could be determined through laboratory or field experiments. For example, K is recommended to be 9.144 m/s, Rn (scaled) is 0.95 for marble surface and 0.45 for vegetation cover surface.
Furthermore, Tetsuya et al. (2009) extended the formula to determine Vout directly, which is much easier to be implemented in DDA algorithms. Rn (scaled) is replaced by Rv (scaled). Both Rv (scaled) and K in the S-F curve could be determined:
Take marble as an example, K = 12 m/s, Rv (scaled) is 0.95.
3 Model Establishment
3.1 Slope with Stochastic Roughness
The meshgrid of the modelling slope and below the accumulation area was 60 m long (x-direction), 40 m wide (y-direction), with a grid size of 2 m. The slope was 30 m high (z-direction) and its slope ratio was set to 1:1. Three 2-m wide platforms were located at 6, 14, and 22 m (x-direction) to meet stability requirements in specification for design of highway subgrades (China Communications Second Highway Survey and Design and Research Institute, 2015). Therefore, this bench slope was 36 m long.
With different R values listed in Table 1, three stochastic rough slope models (S1, R = 1/8; S2, R = 1/4; S3, R = 1/2) were set up and are depicted in Figures 2B–D.
3.2 Rockfalls
In actual rockfall disasters, the shapes of rockfalls are quite different and relatively irregular. In order to avoid further difficulties of other shape factors (Tetsuya et al., 2009) on determining the coefficient of restitution, this paper focused on sphericity, selected rockfalls as regular tetrahedron (R1), regular hexahedron (R2), regular octahedron (R3), and regular dodecahedron (R4) for simulation experiments. The four different rocks are portrayed in Figure 4.
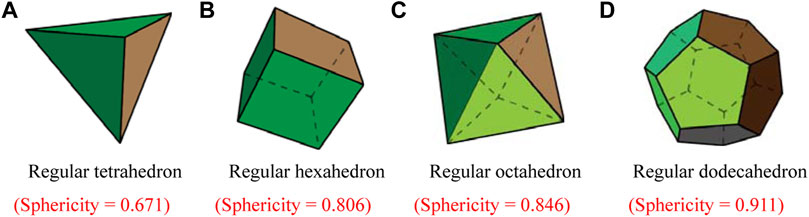
FIGURE 4. Rock blocks with different sphericities. (A) Regular tetrahedron (sphericity = 0.671). (B) Regular hexahedron (sphericity = 0.806). (C) Regular octahedron (sphericity = 0.846). (D) Regular dodecahedron (sphericity = 0.911).
The sphericity (Equation 7) is defined by Wadell (1932) as:
3.3 Simulation Parameters
The TRN cell here was rigid with friction. The Rv (scaled) was 0.95, the standard deviation was 0.05, and K = 12 m/s (coefficient of restitution). According to the field experiment conducted by the Japan Road Association in 2000, a friction coefficient of 0.11–0.20 was adopted, which is equivalent to an average dynamic friction angle 10°, and its standard deviation was set about 0.05.
The volume of falling rock was 1 m3. The density was 2.8 × 10³ kg/m3, the young’s modulus was 3.0 × 10⁴ MPa and the Poisson’s ratio was 0.2.
The values of control parameters for DDA simulations are listed in Table 2.
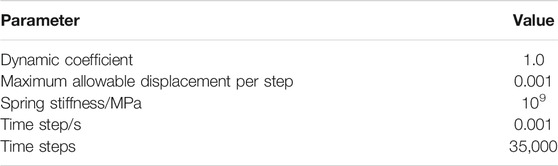
TABLE 2. DDA control parameters.
4 Rockfall Dynamics
4.1 Numerical Procedure and Experiments Designed
Specific simulations were performed to reveal the advantages of the proposed rockfall model using 3-D DDA. In addition, they could help to understand the role of irregularities from both ground roughness and rock shape on the mobility of the falling particles. It is worth noting that all the physic parameters were adopted in the above section and DDA control parameters were adopted from Table 2.
The numerical experiments were designed into two categories and are illustrated in Figure 5.
(1) The simulations were first performed using four different rocks (R1∼R4, volume of 1 m3) initially located 2.5 m (center) above the top of the slope (S1, 30 m high). The numerical procedure used to simulate the experiment begins as the rock was released and free falling to the top of the slope, generated an initial velocity. It ended when the rock finally stopped.
(2) To investigate the importance of ground roughness in rockfall dynamics, the simulations were then conducted using regular dodecahedron (R4), the most sphere rock block for the other two investigated slope surface (S1 and S3). The rock fell from the same initial position.
(3) Rockfall dynamics of various combinations of rock shape and ground roughness were further studied and discussed.
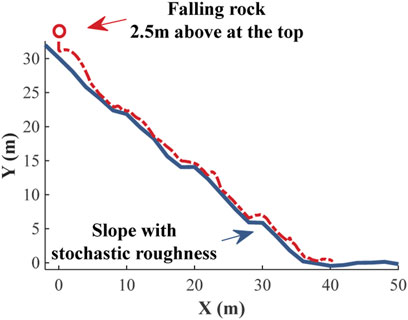
FIGURE 5. 2-D sketch of numerical experiment design.
4.2 The Number of Simulations
Considering the uncertainty raised by the nature of such stochastic models, a limited number of observations will amplify the random fluctuations in rockfall dynamics. To avoid so, the model requires to be performed with a quantity of parallel realizations. The procedure was repeated until the relative error of each observation variable (runout distance, velocity, jumping height, lateral displacement, and platform resistant no.) was less than 1%. As the no. of realization increases, the relative error of lateral displacement decreases greatly, and the one of each other variable also decreases (Figure 6).
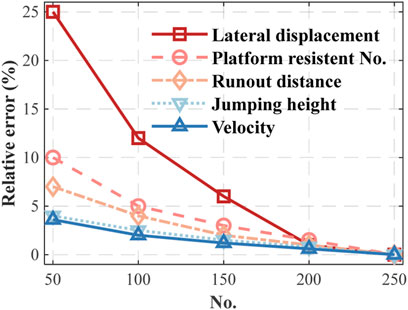
FIGURE 6. Relationship between relative error and number of experiments.
The simulations were performed on each block released 250 times and all realizations were drawn to extract for the distribution of each variable. The modeled maximum value was used to estimate the uncertainty representing the variability in the stochastic results. Although there may still be a potential undersampling, the comparison between the distributions and maximum values derived from different models could indicate that there remain discrepancies from rock shape and ground roughness, respectively. However, it also demonstrated the capability and advantages of the proposed model based on 3-D DDA.
4.3 Results
4.3.1 Typical Trajectories
The trajectory study in this section was carried out under the condition of S2 and R = 1/4. Figure 7 depicts the typical velocities of rockfall with different sphericities varying along the x-direction on a single rough slope. Figure 8 portrays the typical jumping heights varying along the x-direction. It can be clearly seen that when the falling rock collided with each step of the platform, rockfall velocity reduced significantly. After leaving the platforms, the velocity of rockfall increased rapidly when moving on the slope. Finally, when rockfall run across to the bottom of the slope the velocity quickly decreases to 0 m/s.
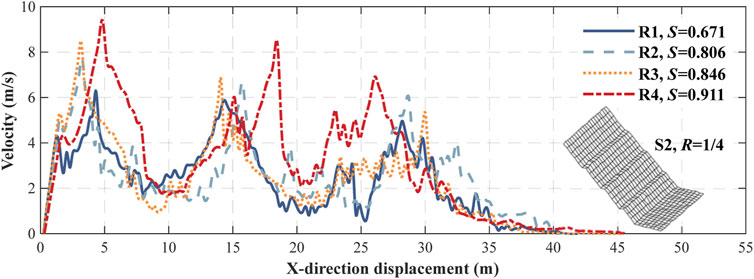
FIGURE 7. Velocity along the x-direction.
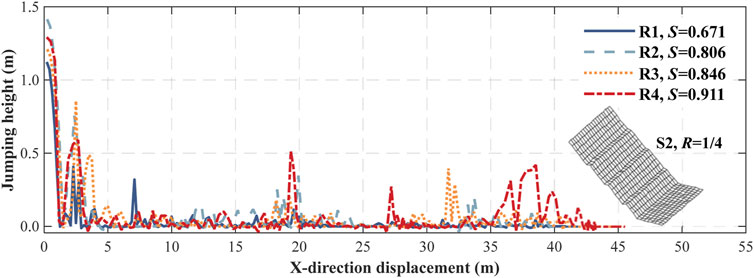
FIGURE 8. Jumping height along the x-direction.
The results were further used to statistically analyze the law about spatial distribution, velocity, and jumping height of rockfall.
4.3.2 Stochastic Maps
The inherent randomness is derived from the impact physics. It is reproduced by a random change of slope orientation at collision. With this stochastic element, the model is well suited for probabilistic rockfall trajectory maps. A Monte-Carlo search was performed, the ground roughness (presented by grid-point elevations) was varied 250 times using a normal distribution for each roughness level as listed in Table 1. The four regular rock blocks were released on each set of slope surfaces, respectively.
Figure 9 exhibits the trajectory distributions of falling rock with different sphericities (R1∼R4) travelling on the slope with a medium ground roughness (S2, R = 1/4). Figure 10 displays the trajectory results of R4 (dodecahedron, S = 0.911) falling on the other two slopes (S1, R = 1/8 and S3, R = 1/2).

FIGURE 9. Maps showing spatial distribution of trajectories vs. sphericities on S2 (R = 1/4). (A) R1, S = 0.671. (B) R2, S = 0.806. (C) R3, S = 0.846. (D) R4, S = 0.911.
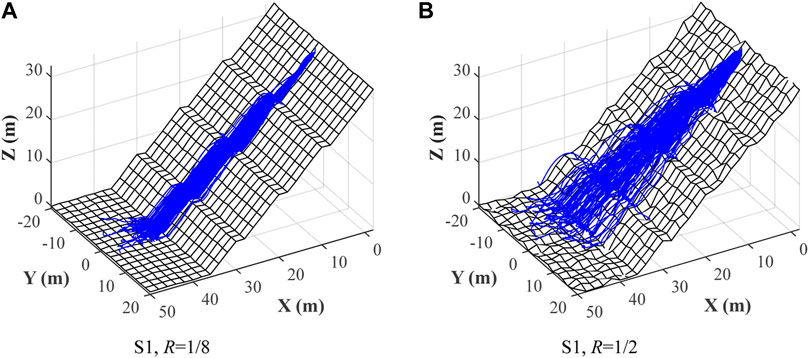
FIGURE 10. Maps showing spatial distribution of trajectories of R4 (S = 0.911) on S1 (R = 1/8) and S3 (R = 1/2), respectively. (A) S1, R = 1/8. (B) S1, R = 1/2.
As a criterion to assess quantitative investigation, the cumulative distribution functions (CDF) were computed, compared, and discussed below.
4.3.3 Effect of Sphericity
The behavior of a single rock moving on S1 slope (R = 1/8) was first investigated using the set of four platonic-shaped blocks. Figure 11 demonstrates the CDF for this subset: (a, b) spatial distributions, in terms of end positions; (c) maximum velocity; and (d) maximum jumping height.
(1) The largest values of runout distance were: R1, 42.68 m; R2, 43.32 m; R3, 45.18 m; and R4, 47.88 m. 23% R1, 26% R2, 36% R3, and 58.1% R4 reached the toe of the slope (>36 m). The entire CDF shifted toward higher runout distance as sphericity increased;
(2) The ranges of later displacement were: R1, [−18.32 m, 3.57 m]; R2, [−8.51 m, 4.88 m]; R3, [−6.32 m, 5.48 m]; and R4, [−5.48 m, 4.26 m]. There was a trend that the CDF curve becomes narrower as sphericity increases;
(3) The largest values of maximum velocity were: R1, 12.66 m/s; R2, 15.65 m/s; R3, 14.99 m/s; and R4, 18.05 m/s. The entire CDF also moved to higher values in terms of velocity;
(4) The largest values of maximum jumping height were: R1, 2.91 m; R2, 2.96 m; R3, 3.13 m; and R4, 4.40 m. However, the entire CDF did not show the trend to vary along one direction.
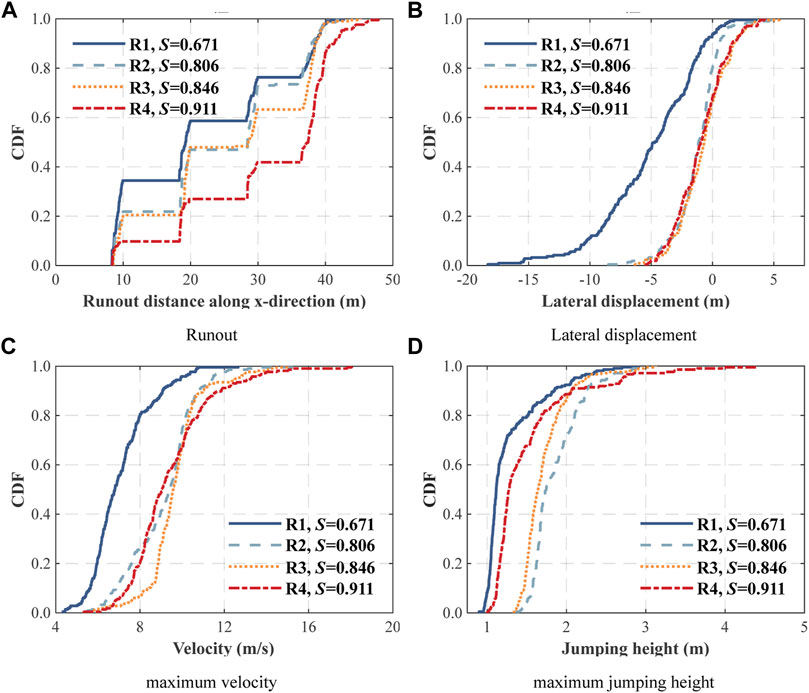
FIGURE 11. Model results for a case with different rock block sphericities: (A) runout distance; (B) lateral displacement; (C) maximum velocity; and (D) maximum jumping height.
The above results suggest that rock sphericity plays important roles on the dynamic behavior of the system and should be taken into consideration in simulating rockfall problems.
4.2.4 Effect of Surface Roughness
The behavior of a single dodecahedron rock (R4, S = 0.911) moving on slope with different roughness levels was then evaluated. Figure 12 illustrates the CDF for this subset: (a, b) spatial distributions, in terms of end positions; (c) maximum velocity; and (d) maximum jumping height.
(1) The largest values of runout distance were: S1, 47.88m; S2, 44.61 m; and S3, 43.91 m. 58.1% S1, 41.9% S2, and 32.6% S3 ran across the last platform, rested on the toe of the slope. In addition, the entire CDF shifted toward lower runout distance as roughness level increased.
(2) The ranges of later displacement were: S1, [−5.44, 4.26 m]; S2, [−5.57, 8.41 m], and S3, [−19.70, 6.89 m]. The CDF curve became much broader for a high roughness level S3, R = 1/2;
(3) The largest values of maximum velocity were: S1, 18.05 m/s; S2, 17.29 m/s; and S3, 16.83 m/s. Although it decreased as roughness level increased, the entire CDF did not vary significantly;
(4) The largest values of maximum jumping height were: S1, 4.40 m; S2, 2.59 m; and S3, 3.72 m; Meanwhile, the entire CDF did not show significant variation when the surface became rougher.
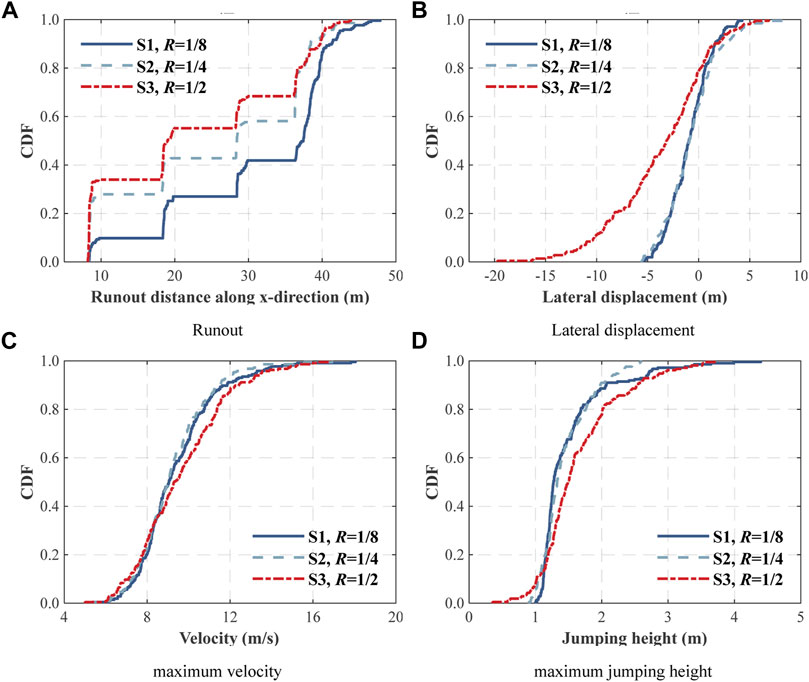
FIGURE 12. Model results for a case with different rock block sphericities: (A) runout distance; (B) lateral displacement; (C) maximum velocity; and (D) maximum jumping height.
The above results manifest that ground roughness also plays important roles on the rockfall dynamics and should be taken into consideration in simulating rockfall problems.
5 Discussion
5.1 Coupling Effect of Rock Shape and Ground Roughness
By examining the measured trajectory profiles for R1∼R4 (Figure 13A), as the ground roughness decreased, the runout distance of all monitored rocks increased. When the ground roughness was 1/2 (S3), the runout distance reached 40.10, 40.70, 42.11, and 43.91 m for rock sphericity 0.671, 0.806, 0.846, and 0.911, respectively. The runout distances of the same set of rocks on slope S2 (R = 1/4) are found to be slightly higher (40.58, 41.27, 42.85, and 44.61 m). The runout distances on slope S1 (R = 1/8) increased significantly (42.68, 43.32, 45.18, and 47.88 m). As the rock sphericity increased, the rock mobility increased as the runout distance of the four monitored rocks increased for all ground roughness levels.
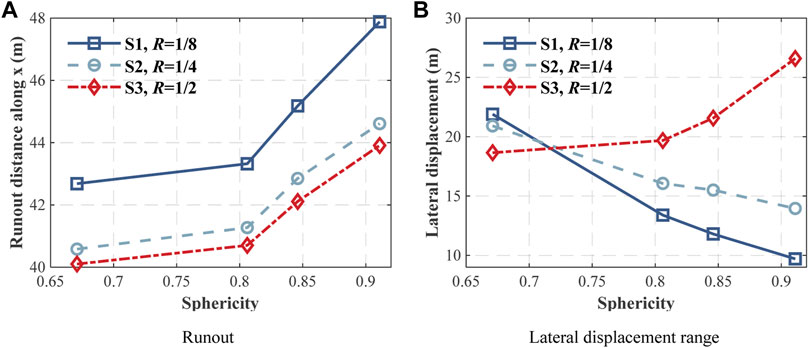
FIGURE 13. Spatial distributions of different roughness levels. (A) Runout. (B) Lateral displacement range.
To illustrate the role of the ground roughness on the lateral displacement of the investigated rockfall problem, the end locations of the rocks were examined for different ground roughness levels that are depicted in Figure 13B. The trends of the lateral displacement by different ground roughness were found to be not consistent overall. When the ground roughness was 1/2 (S3), the lateral displacement range reached 21.89, 13.39, 11.32, and 9.70 m for rock sphericity 0.671, 0.806, 0.846, and 0.911, respectively, showed a decreasing trend. The lateral displacement ranges of the same set of rocks on slope S2 (R = 1/4) were found to be slightly higher (20.62, 16.06, 15.71, and 14.68 m) with the same trend. However, the lateral displacement ranges on slope S1 (R = 1/2) changed to increase (18.65, 19.68, 21.57, and 28.75 m). It became significantly large especially when rounder rock fell. Therefore, the lateral displacement range value was trapped when the ground roughness changed to a higher order magnitude. When the ground roughness is relatively small to the rock size, the rock could more easily run across the local surface undulation. Thus, the lateral displacement range was controlled by rock sphericity.
5.2 Limitations
(1) Rockfalls can range from small cobbles to large boulders of several tens of cubic meters in size. The work presented in this paper is conceptual in nature and represents an ideal condition that involves small rock particles with a certain size (1 m3). Meanwhile, for the sake of simplicity, only four platonic-shaped rocks were considered for monitoring during the numerical simulation. This was limited but justified to the spherical weathering granite rockfall with similar material and geometric characteristics.
(2) In addition, the platform setting in the slope model made rocks usually stagnated, did not reach the toe of slope (Figure 14), causing a kind of undersampling, that masked the statistics of the spatial distribution, velocity, and jumping height. The upper and lower triangle cells in TRN are directionally aligned, which leads the lateral displacement to be bias to one side. This should be improved in a future study.
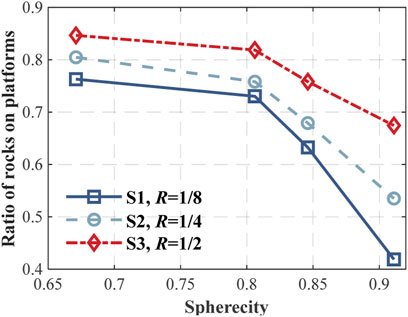
FIGURE 14. Ratio of rocks stagnated on platforms of different roughness levels.
6 Conclusion
In this study, a stochastic model was proposed to perform 3-D rockfall analysis, which has the following main characteristics: (1) it is based on 3-D DDA; (2) rock with arbitrary shape is described using the half-edge data structure; (3) ground roughness is accounted for by a random perturbation of grid point elevation, obeying a normal distribution; (4) trajectory between collisions is directly computed based on DDA; (5) restitution factors depend on the Scale Velocity Restitution model to consider both magnitude and angle of the incident velocity. Lateral displacement scatter is enabled by stochastically perturbing ground orientation at impact. Due to its stochastic nature, this model is flexible for probabilistic rockfall hazard investigations.
A series of three-dimensional numerical simulation was conducted to understand the mobility of rockfall on surfaces with three different roughness levels. Four platonic-shaped blocks were used to investigate the effect of sphericity on the dynamic behavior of the falling rock. The spatial distribution, velocity, and jumping height of selected rocks were recorded in terms of CDF to understand the effect of both rock sphericity and ground roughness on the rockfall dynamics.
General agreement was found: the rock sphericity increased; the rock mobility increased as the runout distance of the four monitored rocks increased for all ground roughness levels. Meanwhile, the mobility decreased as ground roughness increased. Consistent increase of lateral displacement range brought about by the sphericity was not apparent for the ground with relatively higher order roughness level for rocks with certain size. In addition, there was no obvious trend showing in both velocity and jumping height data. Finally, it showed that modeling rock shapes and ground roughness are important to capture the rockfall dynamics.
The next work will attempt to perform application and calibration of the model to find suitable parameter sets. Therefore, the work presented here is part of a series of ongoing studies that attempts to provide efficient and accurate three-dimensional rockfall analysis.
Data Availability Statement
The raw data supporting the conclusion of this article will be made available by the authors, without undue reservation.
Author Contributions
LZ: Conceptualization, methodology, software, validation, investigation, data curation, visualization, project administration, funding acquisition, writing-review and editing, supervision; ZYZ.: Software, validation, investigation, visualization, writing-review and editing; QW: Investigation, visualization, writing; KHR.: Investigation, visualization, writing; YHW.: Investigation, visualization, writing; WW: Methodology, writing-review and editing, funding acquisition; HZ: Methodology, data curation, writing-review and editing, supervision.
Funding
This study was funded by the National Key R&D Program of China (No. 2017YFC1501001-03), the Special Fund for Basic Research on Scientific Instruments of the National Natural Science Foundation of China (No. 4182780021), and the National Natural Science Foundation of China under (Nos. 41977233 and 41902275).
Conflict of Interest
The authors declare that the research was conducted in the absence of any commercial or financial relationships that could be construed as a potential conflict of interest.
Publisher’s Note
All claims expressed in this article are solely those of the authors and do not necessarily represent those of their affiliated organizations, or those of the publisher, the editors, and the reviewers. Any product that may be evaluated in this article, or claim that may be made by its manufacturer, is not guaranteed or endorsed by the publisher.
References
Asteriou, P. (2019). Effect of Impact Angle and Rotational Motion of Spherical Blocks on the Coefficients of Restitution for Rockfalls. Geotech Geol. Eng. 37 (4), 2523–2533. doi:10.1007/s10706-018-00774-0
Chau, K. T., Wong, R. H. C., and Wu, J. J. (2002). Coefficient of Restitution and Rotational Motions of rockfall Impacts. Int. J. Rock Mech. Mining Sci. 39, 69–77. doi:10.1016/s1365-1609(02)00016-3
Chen, G. (2003). Numerical Modelling of Rock Fall Using Extended DDA. J. Rock Mech. Geotechnical Eng. 22 (6), 926–931. doi:10.3321/j.issn:1000-6915.2003.06.008
Chen, G., Zheng, L., Zhang, Y., and Wu, J. (2013). Numerical Simulation in Rockfall Analysis: A Close Comparison of 2-D and 3-D DDA. Rock Mech. Rock Eng. 46 (3), 527–541. doi:10.1007/s00603-012-0360-9
Chen, Y. L. (2013). Influence of Key Factors on Trajectories of Rockfalls. Chin. J. Geotechnical Eng. 35 (s2), 191–196.
Cheng, Q., and Su, S. R. (2014). Movement Characteristics of Collapsed Stones on Slopes Induced by Wenchuan Earthquake. Rock Soil Mech. 35 (3), 772–776.
China Communications Second Highway Survey, Design and Research Institute (2015). JTG D30-2015: Specification for Design of Highway subgrades[M]. China: China Communications Press Co., Ltd.
Crosta, G. B., Agliardi, F., Frattini, P., and Lari, S. (2015). Key Issues in Rock Fall Modeling, hazard and Risk Assessment for rockfall protection[M]. Berlin/Heidelberg, Germany: Springer International Publishing.
Dorren, L. K. A. (2003). A Review of rockfall Mechanics and Modelling Approaches. Prog. Phys. Geogr. Earth Environ. 27, 69–87. doi:10.1191/0309133303pp359ra
Duan, S., Jin, W., Sun, J., and Wang, W. (2021). Trajectory Analysis of the Rockfall Based on the Effect of Rotating Angular Velocity. Geotech Geol. Eng. doi:10.1007/s10706-021-01863-3
Ge, Y., He, X.-R., Yuan, X.-Q., Pu, X.-Y., Meng, L.-D., Wang, H.-K., et al. (2021). Analysis of Rockfall Hazards Stopping Position and Energy Dissipation Based on Orthogonal experiment. E3s Web Conf. 261, 01004. doi:10.1051/e3sconf/202126101004
Gischig, V. S., Hungr, O., Mitchell, A., and Pierre3D, Bourrier. F. (2015). A 3D Stochastic rockfall Simulator Based on Random Ground Roughness and Hyperbolic Restitution Factors. Can. Geotechnical J. 52 (1), 1–14. doi:10.1139/cgj-2014-0312
Glover, H. J. M. (2015). Rock-shape and its Role in rockfall dynamics[D]. Durham, United Kingdom: Durham University.
Guzzetti, F., Crosta, G., Detti, R., and Agliardi, F. (2002). STONE: a Computer Program for the Three-Dimensional Simulation of Rock-Falls. Comput. Geosciences 28, 1079–1093. doi:10.1016/s0098-3004(02)00025-0
Huang, Y., Sun, Q. D., and Xu, Q. (2010). New Development of rockfall Kinematics Study. J. Vibration Shock 29 (10), 31–35. doi:10.3969/j.issn.1000-3835.2010.10.007
Hungr, O., Leroueil, S., and Picarelli, L. (2014). The Varnes Classification of Landslide Types, an Update. Landslides 11 (2), 167–194. doi:10.1007/s10346-013-0436-y
Ji, Z.-M., Chen, Z.-J., Niu, Q.-H., Wang, T.-J., Song, H., and Wang, T.-H. (2019). Laboratory Study on the Influencing Factors and Their Control for the Coefficient of Restitution during rockfall Impacts. Landslides 16 (10), 1939–1963. doi:10.1007/s10346-019-01183-x
Ji, Z.-M., Hu, S.-M., Chen, Z.-J., Niu, Q.-H., Wang, T.-H., and Wu, F.-Q. (2021). Laboratory Investigation of the Effect of the Rotational Speed on the Coefficient of Restitution. Eng. Geology. 292, 106196. doi:10.1016/j.enggeo.2021.106196
Liu, G., Li, J., and Wang, Z. (2021). Experimental Verifications and Applications of 3d-Dda in Movement Characteristics and Disaster Processes of Rockfalls. Rock Mech. Rock Eng. 54 (5), 2491–2512. doi:10.1007/s00603-021-02394-2
Liu, G. Y., Li, J. J., and Kang, F. (2020). Study on the Protective Effect of rockfall Platform Based on 3D DDA Method. J. Disaster Prev. Mitigation Eng. 40 (05), 679–689. doi:10.13409/j.cnki.jdpme.2020.05.001
Ma, G., Matsuyama, H., Nishiyama, S., and Ohnishi, Y. (2011). Practical Studies on rockfall Simulation by DDA. J. Rock Mech. Geotechnical Eng. 3 (1), 57–63. doi:10.3724/sp.j.1235.2011.00057
Ma, K., and Liu, G. Y. (2021). Three-Dimensional Discontinuous Deformation Analysis of Failure Mechanisms and Movement Characteristics of Slope Rockfalls. Rock Mech. Rock Eng. 54 (5), 2491–2512. doi:10.1007/s00603-021-02656-z
Pappalardo, G., Mineo, S., and Rapisarda, F. (2014). Rockfall hazard Assessment along a Road on the Peloritani Mountains (Northeastern Sicily, Italy). Nat. Hazards Earth Syst. Sci. 14, 2735–2748. doi:10.5194/nhess-14-2735-2014
Pfeiffer, T. J., and Bowen, T. D. (1989). Computer Simulation of Rockfalls. Environ. Eng. Geosci. xxvi (1), 135–146. doi:10.2113/gseegeosci.xxvi.1.135
Romkens, M. J., and Wang, J. Y. (1986). Effect of Tillage on Surface Roughness. Trans. Asae 29 (2), 0429–0433. doi:10.13031/2013.30167
Shi, G.-H., and Goodman, R. E. (1985). Two Dimensional Discontinuous Deformation Analysis. Int. J. Numer. Anal. Methods Geomech. 9 (6), 541–556. doi:10.1002/nag.1610090604
Shi, G. H. (2001). “Three Dimensional Discontinuous Deformation Analysis,” in Proceedings of the 38th US Symposium on Rock Mechanics (USRMS), Washington, DC, July 7–10, 2001 (ARMA), 01–1421.
Singh, A. K., Kundu, J., Sarkar, K., Verma, H. K., and Singh, P. K. (2021). Impact of Rock Block Characteristics on rockfall hazard and its Implications for rockfall protection Strategies along Himalayan Highways: a Case Study. Bull. Eng. Geol. Environ. 80 (7), 5347–5368. doi:10.1007/s10064-021-02288-1
Stacey, T. R., and Gumede, H. (2007). Evaluation of Risk of Rock Fall Accidents in Gold Mine Stops Based on Measured Joint Data. J. South. Afr. Inst. Mining Metall. 107, 345–350.
Sun, J. L., and Duan, S. Z. (2020). Theoretical Analysis of the Random Collision Model of Rolling Stone Particle. J. Mountain Sci. 38 (3), 416–424. doi:10.16089/j.cnki.1008-2786.000521
Tang, J. H., Zhou, X. J., Liang, K., Lai, Y. L., Zhou, G. F., and Tan, J. S. (2021). Experimental Study on the Coefficient of Restitution for the Rotational Sphere Rockfall. Environ. Earth Sci. 80 (11), 1–18. doi:10.1007/s12665-021-09684-6
Tetsuya, S., Yuzo, O., Satoshi, N., Koichi, N., and Naoki, S. (2009). Study on Fundamental Characteristics of Velocity Ratio Used in rockfall Simulation and its Application to Dda. Doboku Gakkai Ronbunshuu C 65 (1), 53–65. doi:10.2208/jscejc.65.53
Vijayakumar, S., Yacoub, T., Ranjram, M., and Curren, J. H. (2012). “Effect of rockfall Shape on normal Coefficient of Restitution,” in Proceedings of the 46th US Rock Mechanics/Geomechanics Symposium, Chicago, IL, United States, 24-27 June 2012 (Chicago, IL: ARMA), 12–631.
Volkwein, A., Schellenberg, K., Labiouse, V., Agliardi, F., Berger, F., Bourrier, F., et al. (2011). Rockfall Characterisation and Structural protection - a Review. Nat. Hazards Earth Syst. Sci. 11, 2617–2651. doi:10.5194/nhess-11-2617-2011
Wadell, H. (1932). Volume, Shape, and Roundness of Rock Particles. J. Geology. 40, 443–451. doi:10.1086/623964
Wang, W., Zhang, H., Zheng, L., Zhang, Y.-b., Wu, Y.-q., and Liu, S.-g. (2017). A New Approach for Modeling Landslide Movement over 3D Topography Using 3D Discontinuous Deformation Analysis. Comput. Geotechnics 81, 87–97. doi:10.1016/j.compgeo.2016.07.015
Wang, X. L., Zhang, L. Q., and Yang, Z. F. (2015). Approaches for rockfall Run-Out Calculation and Uncertainty in rockfall Study. J. Eng. Geology. 23 (s1), 166–172. doi:10.13544/j.cnki.jeg.2015.s1.026
Wei, X. R., Duan, S. Z., Sun, J. L., and Wang, W. D. (2020). Velocity Prediction of Slope Rolling Stone Particle Based on Collision Model. Chin. J. Theor. Appl. Mech. 52 (03), 707–715. doi:10.6052/0459-1879-20-039
Zhang, H., Chen, G., Zheng, L., Han, Z., Zhang, Y., Wu, Y., et al. (2015). Detection of Contacts between Three-Dimensional Polyhedral Blocks for Discontinuous Deformation Analysis. Int. J. Rock Mech. Mining Sci. 78, 57–73. doi:10.1016/j.ijrmms.2015.05.008
Zhang, H., Liu, S.-g., Han, Z., Zheng, L., Zhang, Y.-b., Wu, Y.-q., et al. (2016). A New Algorithm to Identify Contact Types between Arbitrarily Shaped Polyhedral Blocks for Three-Dimensional Discontinuous Deformation Analysis. Comput. Geotechnics 80, 1–15. doi:10.1016/j.compgeo.2016.06.007
Keywords: rockfall, 3-D DDA, rock sphericity, stochastic ground roughness, movement characteristics
Citation: Zheng L, Zhu Z, Wei Q, Ren K, Wu Y, Wu W and Zhang H (2021) A Stochastic Rockfall Model Related to Random Ground Roughness Based on Three-Dimensional Discontinuous Deformation Analysis. Front. Earth Sci. 9:819751. doi: 10.3389/feart.2021.819751
Received: 22 November 2021; Accepted: 01 December 2021;
Published: 28 December 2021.
Edited by:
Xiaodong Fu, Institute of Rock and Soil Mechanics (CAS), ChinaReviewed by:
Qiang Liu, Shandong University of Science and Technology, ChinaGuoyang Liu, Shenyang University of Technology, China
Copyright © 2021 Zheng, Zhu, Wei, Ren, Wu, Wu and Zhang. This is an open-access article distributed under the terms of the Creative Commons Attribution License (CC BY). The use, distribution or reproduction in other forums is permitted, provided the original author(s) and the copyright owner(s) are credited and that the original publication in this journal is cited, in accordance with accepted academic practice. No use, distribution or reproduction is permitted which does not comply with these terms.
*Correspondence: Hong Zhang, aG9uZ3poYW5nQHRvbmdqaS5lZHUuY24=