 Zihao Tian1,2
 Tianling Qin2*
 Huiliang Wang1
 Yizhe Li1,2
 Sheng Yan1,2
 Jun Hou1,2
 Chenhao Li2Sintayehu A. Abebe2
- 1School of Hydraulic Engineering and Civil Engineering, Zhengzhou University, Zhengzhou, China
- 2China Institute of Water Resources and Hydropower Research, Beijing, China
Climatic factors are the main drivers that change net primary productivity (NPP). We chose the Yiluo River Basin as the study area to investigate the response of NPP to climatic factors in the Yellow River’s middle reaches. The temporal and spatial distribution of net primary productivity and the trend change of slope in the basin from 2000 to 2020 are analyzed. In addition, we analyzed the correlation between the NPP and climatic factors (precipitation and temperature) and the time-lag effect. The results show that 1) the annual average NPP in the basin is 556.4 gC/m2/a, the maximum value that occurred in 2019. Most of the NPP’s mutation points in the basin’s forest appeared in 2004, while the NPP’s mutation points in arable land mostly appeared in 2008 and 2009. 2) The slope trend analysis result of NPP from 2000 to 2020 shows that the NPP in 67.88% of the basin shows a significant increasing trend, 3.8% of the basin shows a significant decrease, and the other area show no significant change. 3) The correlation analysis between NPP and climatic factors shows a positive correlation between precipitation and NPP in 62.3% of the basin and a positive correlation between air temperature and NPP in 62.5%. The response of NPP to precipitation and temperature in the basin has different degrees of a time-lag effect. The NPP has a time-lag effect on precipitation in 44.8% of the basin, and its mean lag time is 8 days. NPP has a time-lag effect on temperature in 55.7% of the basin, and its mean lag time is 1 day. This study is beneficial to understanding the influence of climatic factor change on vegetation activities in the Yiluo River Basin. Our study illustrates the significance of time lag in analyzing the relationship between NPP and climatic factors. Furthermore, it provides support for scientific vegetation regulation and allocation, as well as adaptation to climate change in areas similar to the Loess Plateau, based on the lag time distribution corresponding to different vegetation types in different regions of the Yiluo River Basin. After that, these areas’ water resources will be fully utilized by vegetation, and ecological restoration could be accelerated.
Introduction
Nowadays, promoting the ecological protection and high-quality development of the Yellow River and protecting the ecological environment of the Yellow River are top priorities (Liu et al., 2021; Tang et al., 2021; Zhang et al., 2022). It is critical to perform excellent soil and water conservation in the Loess Plateau, as well as pay close attention to the changing trends and impacts of vegetation ecology and climate in the basin (Zhang et al., 2022). The Yiluo River Basin is located in the middle and lower reaches of the Yellow River. As a critical model area of soil and water conservation in the Loess Plateau, it occupies a crucial position in the high-quality development of the Yellow River. So far, many studies have analyzed the relationship between NPP and climatic factors (Chen et al., 2017; He et al., 2018; Poungparn et al., 2020). Many studies show that net primary productivity (NPP) is an indicator of climatic factor change, and climatic factors are important drivers of NPP (Wang et al., 2019; Ji et al., 2020). NPP is essential for maintaining the ecosystem’s carbon cycle and energy balance (Wang et al., 2017). The response pattern of NPP to climate factors is different in different regions (Li et al., 2020; Yuan et al., 2021). Precipitation has a significant impact on NPP in most areas of the Yellow River Basin in the middle reaches due to infrequent precipitation, soil erosion, and other factors. Furthermore, we studied the delayed response of NPP to climatic change in the Yiluo River Basin to better understand the evolution of NPP in the Yellow River’s middle reaches and its response to changes in climatic factors.
In general, there are three ways to obtain NPP data: The first method is to calculate the NPP using model simulation. This method applies to a large study area and unlimited study time, but the numerical accuracy of the model simulation is relatively low. People often choose the CASA model and the Thornthwaite Memorial model to simulate NPP (Chen et al., 2017; Liu et al., 2020; Li et al., 2021) (Zhang et al., 2019). The second method for calculating NPP is based on measured vegetation data from the study area (Zhan et al., 2018; Linger et al., 2020; Ge et al., 2021). This method cannot obtain NPP data on a large-scale area due to the study area and study time limitations, but the numerical accuracy is relatively high. The third method is the reanalysis of data. It obtains data from the NASA website’s Moderate Resolution Imaging Spectrum (MODIS) Analyzer data (Gao et al., 2017; Wang J. et al., 2017; Wang et al., 2021). The NPP data obtained from this method compensate for the time and regional scope limitations of measured data as well as the data accuracy problem of model simulation calculation. As a result, in this study, we decided to obtain NPP from reanalysis data. Different reanalysis data have different resolutions, time intervals, and time scales. We should select these data based on the specific study demand. In some studies, people often choose the MODIS series data to analyze the spatiotemporal distribution of NPP in the basin and its response to climatic factors (Liu et al., 2018). Furthermore, NPP product data are frequently used to validate the accuracy of the model’s NPP result, for instance, using MOD17A3 NPP data to validate the NPP value estimated by the CASA model during the growing period to determine whether the simulated data is reliable (Jiang et al., 2020; Guo et al., 2021). In recent years, one of the critical research hotspots has been the study of the impact of climatic factors on NPP (Ngoma et al., 2019). The spatiotemporal distribution of NPP and climate factors and their correlation with climate factors are frequently studied in various study areas (Sun and Du, 2017; Wang Z. et al., 2019; Yang et al., 2020). Different vegetation distributions have different distribution laws when analyzing the response of NPP to climatic factors (He et al., 2018; Nanzad et al., 2021), and the impact of climatic factors on NPP in some places has a certain time lag (Kuzyakov and Gavrichkova, 2010; Kong et al., 2020). The time series of NPP data can be reorganized to analyze the time lag of NPP response to climatic factors (Zhang et al., 2017; Luo et al., 2018).
Currently, the Yellow River is in a critical period of ecological protection and high-quality, sustainable development. Therefore, by studying NPP’s response to climatic factors in the Yiluo River Basin, we can gain a better understanding of the relationship between vegetation and climatic factors in the Yellow River’s middle reaches. In this study, we chose NPP and climatic data from the years 2000–2020 for analysis and discussion. This study aims to obtain 1) the temporal and spatial distribution of NPP in the Yiluo River Basin and 2) the time-lag effect of net primary productivity on climatic factor change. The research results could reveal that the lag effect of net primary productivity due to climate change in the Yiluo River Basin will provide some reference value in managing environmental problems on the Loess Plateau in the Yellow River’s middle reaches.
Data resource and research methods
Watershed introduction
The Yiluo River Basin is located at 33°33′–35°05′N and 109°35′–113°06′E. It flows through Henan and Shanxi provinces, has a total length of 974 km, and an area of 18,881 km2. The Yiluo River Basin consists of the Yi River Basin and the Luo River Basin, and the flow directions of the two rivers are nearly parallel, as is typical for twin rivers. The sources of the Yi River and the Luo River are in Luonan and Luanchuan counties, respectively, and they meet in ZaoZhuang, Yanshi City. The terrain distribution features are high in the southwest and low in the northeast. The elevation distribution of the Yiluo River Basin and its location in the Yellow River Basin and Loess Plateau is shown in the figure (Figure 1). The Yiluo River is the largest tributary of the middle Yellow River. In the Yellow River’s middle and lower reaches, the Yiluo River serves as an essential flood control system. It contributes to the control and distribution of water and sediment (Zhang et al., 2021). The Yiluo River is distributed in the southeast part of the Loess Plateau, and its lower plain is one of the largest plains in the Loess Plateau. The Yiluo River Basin is situated in the region that separates the warm temperate and subtropical climate zones. Its climate characteristics are those of the warm-tempered monsoon climate; cold and dry winter; and hot and rainy summer. The average annual precipitation is 500–900 mm, and the average annual temperature is 12–14°C. During the growing season period, the average accumulated temperature over the years is about 110°C (Wang X. et al., 2019). The basin’s forest area increased by 107.6 km2 between 2000 and 2020, while the area of arable land shrunk by 623.1 km2. The vegetation distribution of the Yiluo River in 2020 is shown in Figure 2.
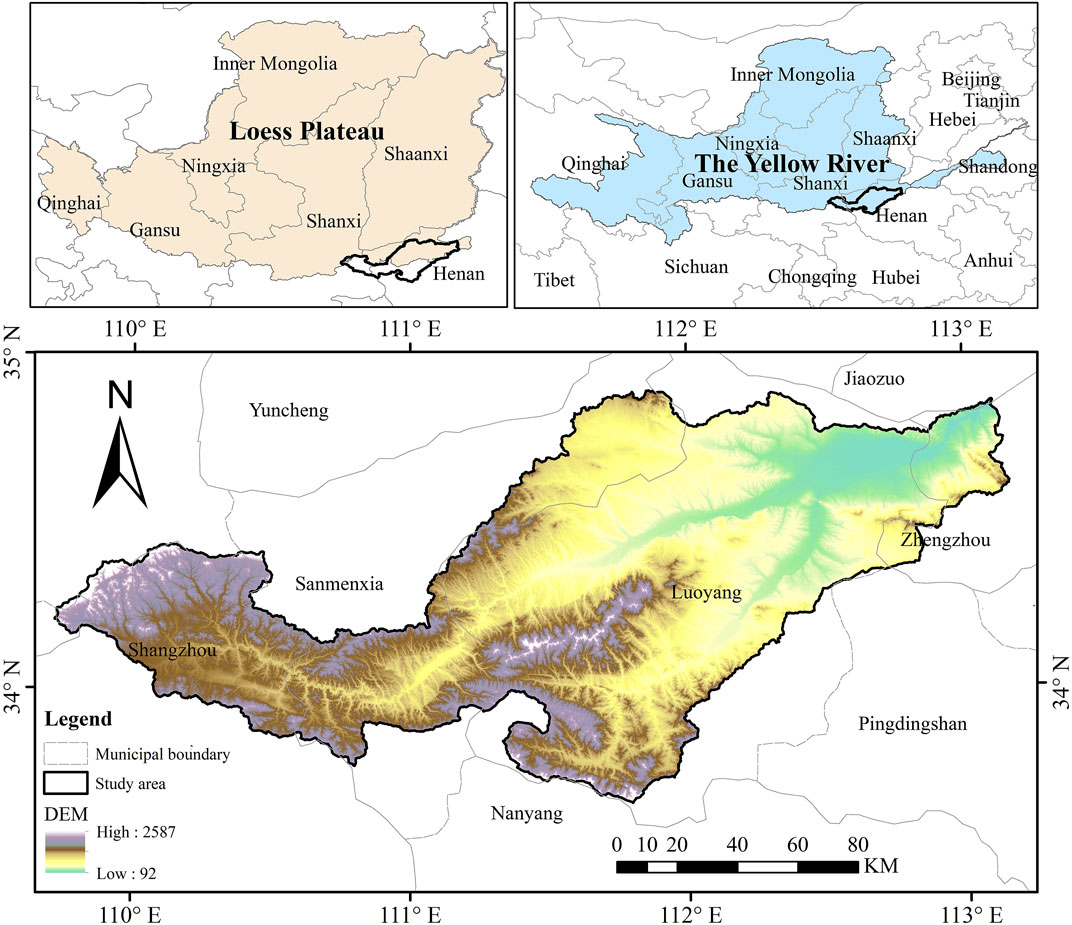
FIGURE 1. Elevation distribution of the Yiluo River Basin and its location of the Yellow River Basin and Loess Plateau.
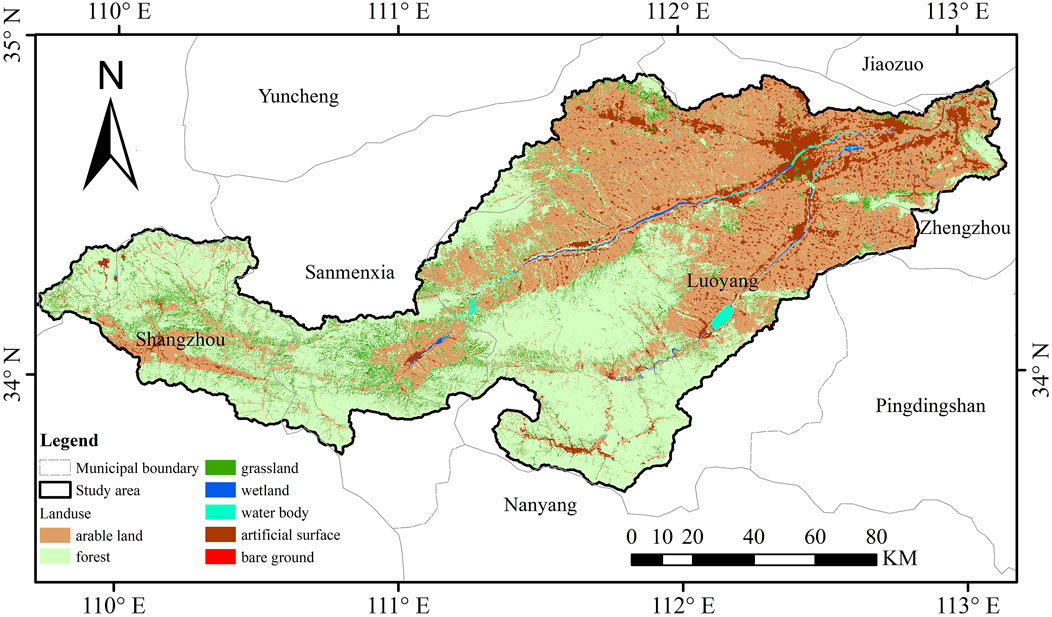
FIGURE 2. Distribution of land use types in Yiluo River Basin.
Data source and preprocessing
The MOD17A2HGF product of MODIS is used to obtain the NPP data for the years 2000–2020. Its unit is KgC/m2/8 days, and the scaling factor is 10−4. The spatial resolution is 500 m, and the temporal resolution is 8 days. The distribution of multi-year average NPP at various time scales in the watershed could be obtained by converting the NPP data from the 8-day scale to the monthly, growing-season, and annual scales using time-scale conversion (Wang J. et al., 2017). The climatic data are the daily scale data of precipitation and temperature from 26 meteorological stations in the basin from 2000 to 2020 (Table 1).
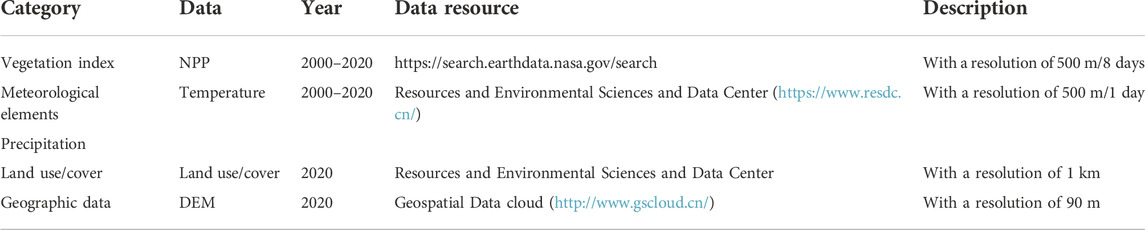
TABLE 1. Data resource.
Research methods
In this study, we analyzed NPP and climatic factors from both time and space scales. On the time scale, the variation of the basin’s average NPP over various time scales and the mutation point were analyzed. The spatial distribution of NPP and the trend of slope variation under different time scales were analyzed on the spatial scale. The specific technical route is shown in Figure 3.
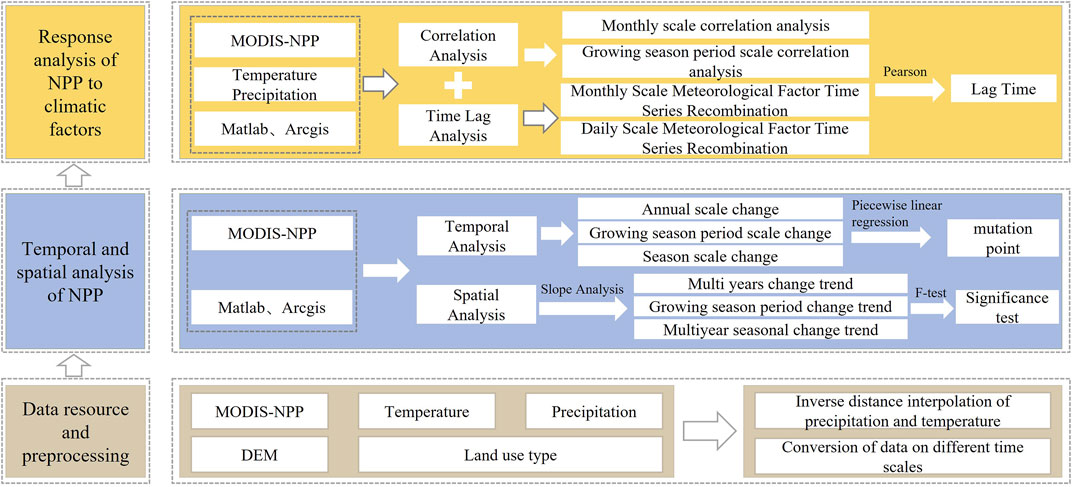
FIGURE 3. Logical framework diagram.
Trend change analysis
The changing trend of NPP over time in the study area was subjected to a slope analysis. According to the changing trend of each pixel, the changes in different regions and the whole basin were analyzed. The slope analysis results were tested for significance by using the F-test, and the confidence range was selected as significant when p<0.05 (Zhang et al., 2016; Chen et al., 2019). Therefore, when analyzing the multi-year change trend of the NPP in the Yiluo River Basin from 2000 to 2020, according to the increase and decrease of the changing trend and whether it is significant, the changing trend can be divided into four types: significant increase; significant decrease; no significant increase; and no significant decrease.
The mutation point
The mutation point of each pixel was analyzed so that the distribution characteristics on a time scale could be comprehended when analyzing the multi-year change trend of NPP. The mutation point of each pixel in the time series was extracted based on the principle of a piecewise linear regression model and multi-year NPP in the Yiluo River Basin from 2000 to 2020. Regression fitting was performed on the time series before and after the mutation point, and the point where the sum of squared residuals is the smallest is used as a possible mutation point. Then, the NPP trend of the time series before and after the possible mutation point was tested for significance. If significant, the possible mutation point is the actual pixel mutation point.
The correlation analysis
We calculated the correlation coefficient between climatic factors (precipitation and temperature) and NPP on a monthly scale and performed the correlation analysis based on the method of Pearson’s correlation coefficient. The results of the correlation analysis were tested for significance by using the F-test to prove the existence of the correlation between NPP and climatic factors.
The time-lag effect analysis
Since the NPP is impacted by both current and historical climatic factors, it is not just affected by climatic factors in the same period. A time-lag effect analysis of net primary productivity under climate change is required. We reorganized the time series of climatic factors (Kong et al., 2020). First, we take the month as the time scale and delay the time series by 1–3 months to form a new monthly scale series of climatic factors. Based on this, we used MATLAB to conduct a correlation analysis between the new climatic factor time series and the net primary productivity. The time corresponding to the maximum correlation coefficient of each pixel is the lag time, which is determined by performing the daily-scale lag time analysis after identifying the month with the highest correlation.
Result and analysis
Temporal analysis
During 2000–2020, the spatial mean annual NPP in the Yiluo River Basin showed an increasing trend, with a distribution range of 436 to 705 gC/m2. The spatial mean of NPP in 2020 increased by 236.4 gC/m2 compared with that in 2000, and the spatial mean of NPP in the summer was higher than that in the autumn and spring. The change in annual NPP after 2012 is more significant than before (Figure 4).
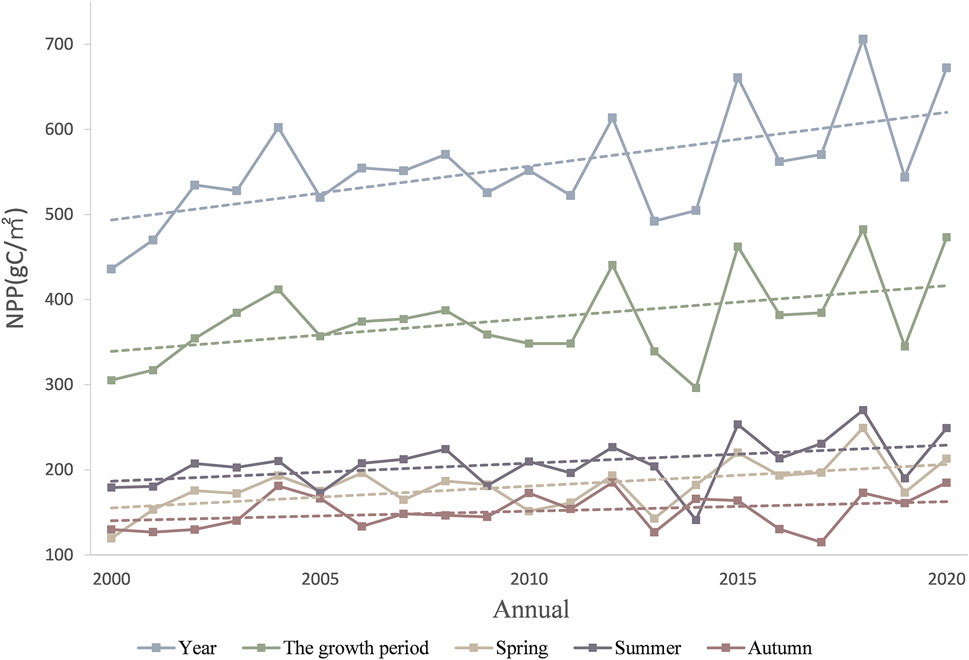
FIGURE 4. Change trend of spatial mean of NPP at different time scales.
The annual average NPP value in the basin’s pixel mutation point was analyzed, and 60.7% of the area has no mutation point. Most of the mutation points in the remaining 39.3% of the area, which spans the years 2004–2015, occurred in 2004, 2007, 2008, and 2009. The grid area with 2004 as the mutation point comprised the largest portion of them, making up 16.3% of the total area. Before and after the mutation point, the regional change rate of NPP in the central and western regions of the basin showed an increasing trend that slowed down. The NPP in the central area of the basin changed the trend from decreasing to increasing. According to a comparison of the NPP in the basin before and after the mutation point, the area with an increasing trend grows larger, and the area with a decreasing trend gets smaller. Before the mutation point, the average NPP slope of the basin was 11.4; after the mutation point, the average NPP slope of the basin was 4.2. The distribution of mutation points in the basin and the change rate before and after mutation points are shown in Figure 5; Figure 6.
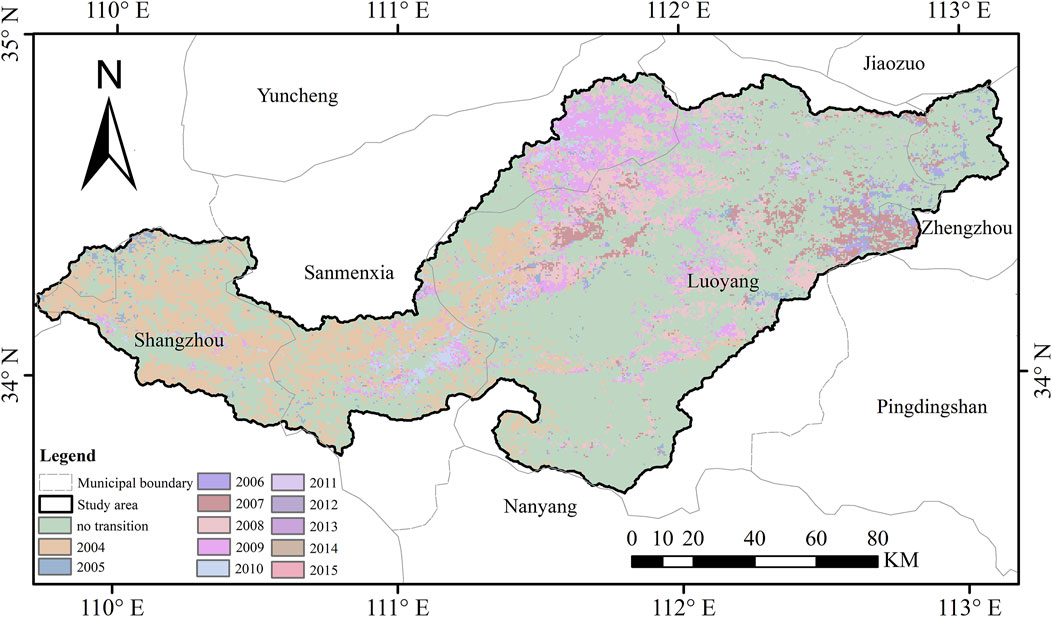
FIGURE 5. Distribution of NPP’s mutation points in the basin.
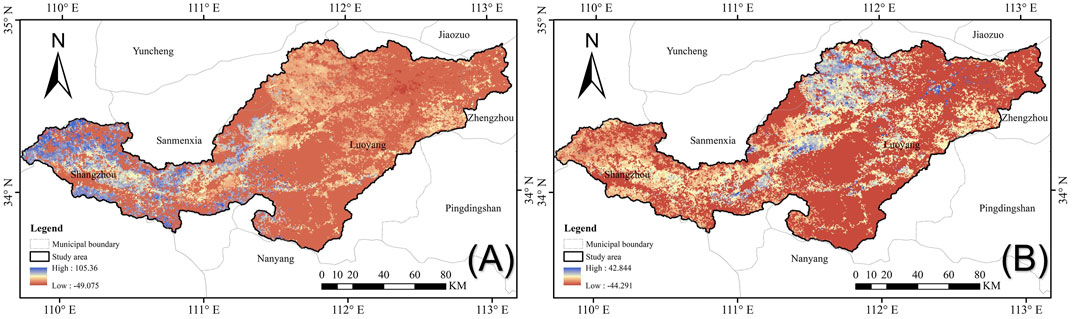
FIGURE 6. NPP’s change rate before (A) and after (B) mutation points.
Spatial analysis
On the year scale, the multi-year average NPP in the basin gradually decreases from south to north and from west to east. The NPP ranges from 0 to 1065 gC/m2, with an annual mean of 556.4 gC/m2. The NPP in 92.9% of the basins showed an increasing trend during the study period, and 67.9% of the basins showed a significant increasing trend. The land use type in the high NPP-value area of the basin is mainly forest, and the land use type in the low-value area is mainly arable land and artificial surfaces. During the growing season, the NPP in the basin accounts for about 75% of the annual NPP. The area with a significant increase trend in the study time range accounted for 47.3%. In the multi-year NPP distribution of the basin at different time scales, the southern region is always has a high NPP value. According to the multi-year NPP distribution of the basin on a seasonal scale, the value of NPP in the summer is significantly higher than that in the spring and autumn. This phenomenon is due to the vigorous vegetation activity in summer, especially in the forest vegetation distribution area in the southwest, which is the most obvious. Significant increases in NPP occurred in the spring, summer, and autumn in 25.7%, 25.3%, and 23.0% of the country, respectively. (Figure 7). The percentage of the area with different trends of NPP variations in the basin under different time scales is shown in Table.2.
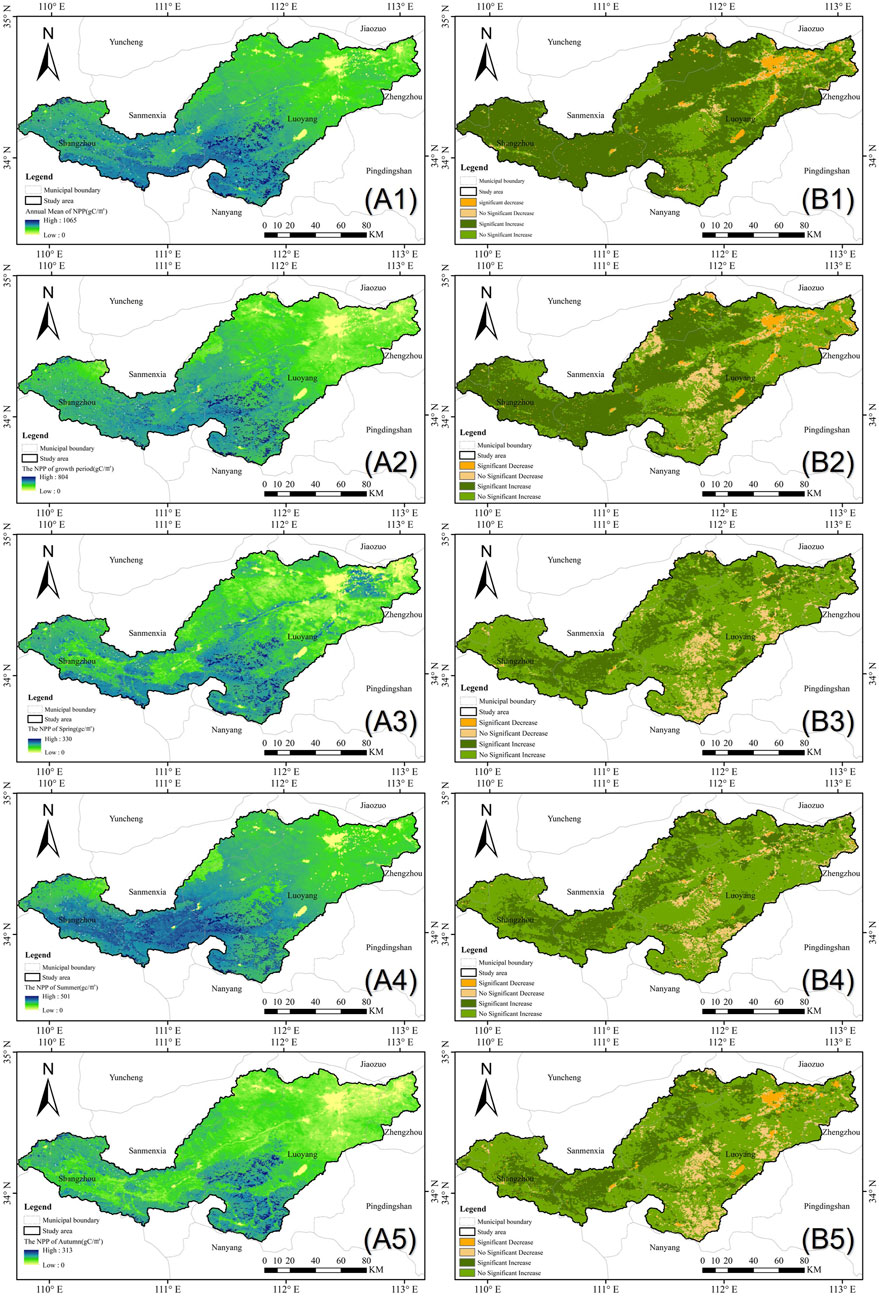
FIGURE 7. Multi-year average spatial distribution (A) and slope trend analysis (B) of NPP at different time scales (1: annual scale; 2: growing season period; 3: spring; 4: summer; 5: autumn) in the watershed.
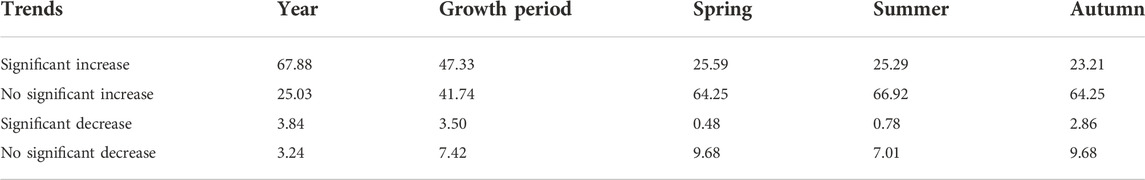
TABLE 2. Proportion of the variation trend area of NPP with different degrees on different time scales.
Analysis of the time-lag effect of net primary productivity on climatic factors
First, we analyzed the correlation between monthly scale NPP and contemporaneous climatic factors, and its result is shown in Figure 8. The correlation coefficients of each pixel passed the significance test. The correlation coefficients between NPP and contemporaneous precipitation range from −0.2 to 0.7, and there is a positive correlation in 58% of the areas. They are mainly distributed in the eastern part of the basin, and most of the land use type in this region is arable land. Moreover, in the basin’s upper reaches, the correlation coefficients between NPP and the contemporaneous temperature range from 0 to 0.9, so there is a positive correlation between NPP and temperature in the basin. There is an extremely significant positive correlation in the eastern part of the basin, and the correlation was stronger in arable land than in forest.
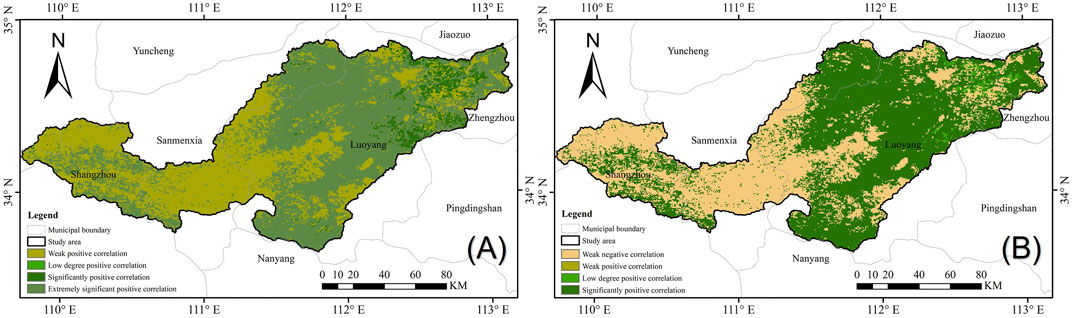
FIGURE 8. Spatial distribution of correlation coefficients between NPP and precipitation (A) and temperature (B) over the same period.
Since the distribution of NPP is more evident during the growing season period, the correlation of NPP with climatic factors is stronger. The results of the correlation analysis showed that during the growing season period, the correlation coefficient between NPP and precipitation ranges from −0.4 to 0.5 and the correlation coefficient between NPP and temperature ranges from −0.7 to 0.7, and the results of the correlation analysis all passed the significance test.
In the precipitation process, water infiltration’s effect on vegetation is not immediate (Chen et al., 2014; A et al., 2016). Moreover, the NPP is affected not only by climatic factors of the same period but also by those of the previous period, so the response of the NPP to precipitation and temperature has a time-lag effect. First, the climatic factors were respectively deferred for 1–3 months from the current time. The correlation between NPP and climatic factors after time series recombination was analyzed to determine the lag time range.
The correlation analysis was conducted between climatic factors after time series adjustment and the NPP of the corresponding month. The spatial distribution of the correlation coefficient at different delay times is shown in Figure 9, and the area proportions of different correlation degrees in the basin are shown in Table 3 and Table 4. As previously mentioned, the correlation between NPP and climatic factors is strongest in the current month, followed by 1 month. Therefore, the lag time range of precipitation and temperature in the basin is determined to be 0–1 month.
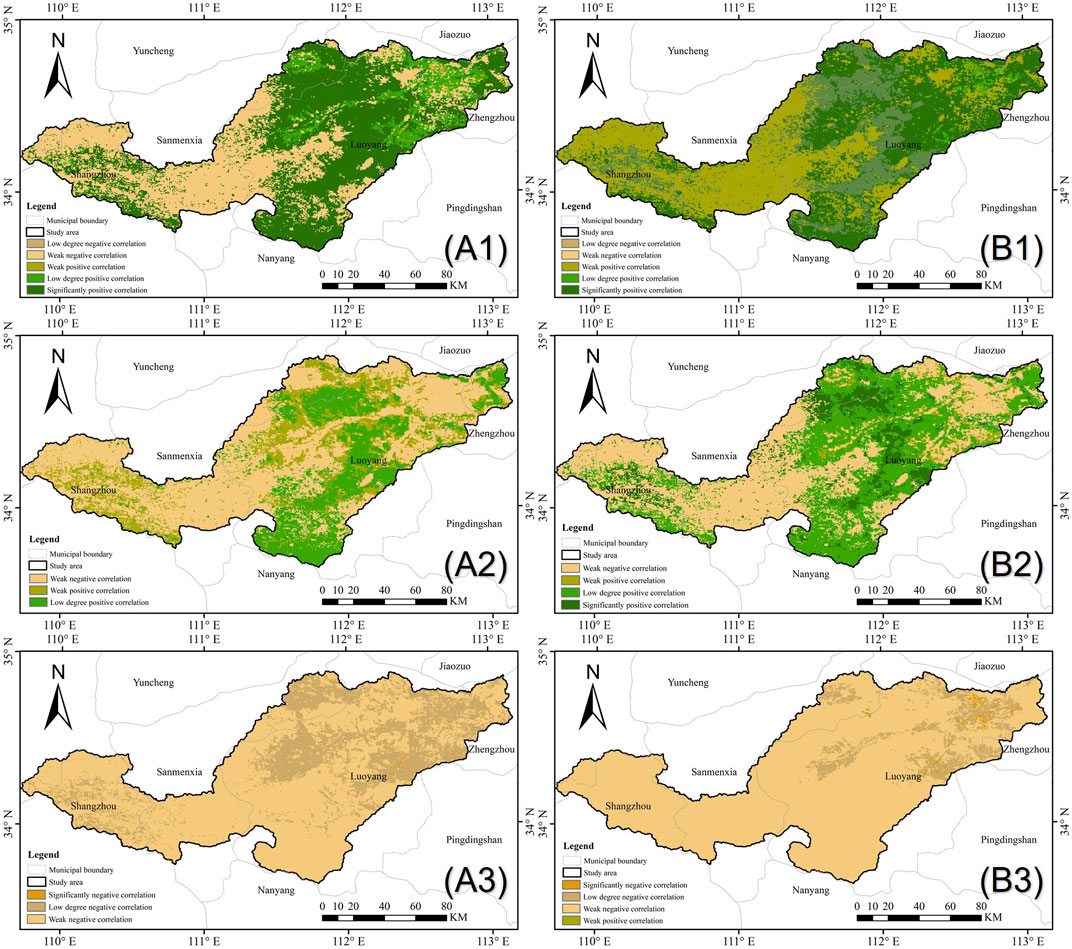
FIGURE 9. Spatial distribution of correlation coefficients between NPP and precipitation (A) and air temperature (B) with different lag times (1 month and 2 and 3 months). (A1–B3) part labels represent the delayed months, (A) and (B) respectively represent precipitation and temperature.
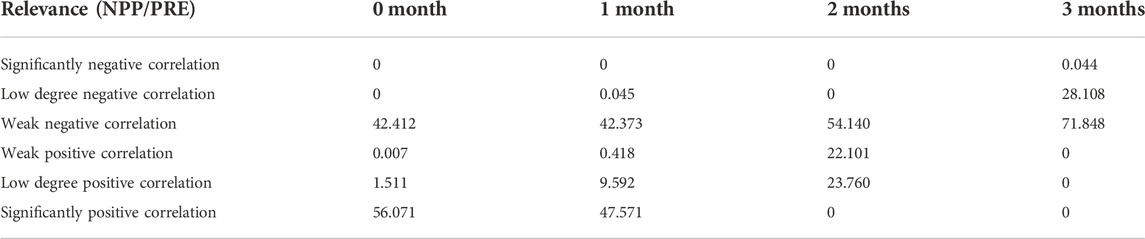
TABLE 3. Proportion of watershed area with different correlation degree between NPP and precipitation under different lag time (%).
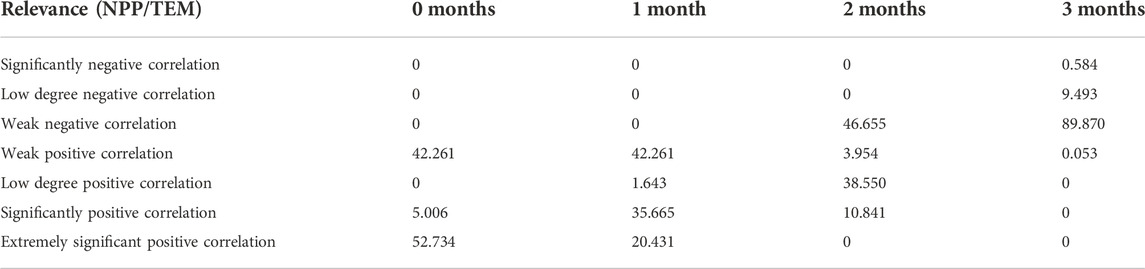
TABLE 4. Proportion of watershed area with different correlation degree between NPP and temperature under different lag time (%).
Then, we respectively delayed the time series of temperature and precipitation by 1–31 days to reconstruct the new time series. The correlation between NPP and climatic factors (precipitation and temperature) in the new time series was analyzed, and the number of days when the correlation coefficient was at its maximum is the corresponding lag time. The lag time of each pixel in the basin is shown in Figure 10. NPP has a time-lag effect on precipitation in 44.8% of the basin, and its mean lag time is 8 days. The maximum lag time of the NPP response to precipitation is 29 days. Among the areas with a time-lag effect, the area with a lag time of 4 days accounts for the largest area at 24.5%. The area where NPP has a time-lag effect on precipitation is mainly distributed near the Yi River and the Luo River’s lower reaches. Moreover, there is no time-lag effect of the NPP response to precipitation in 55.2% of the basin. NPP has a time-lag effect on temperature in 55.7% of the basin, and its mean lag time is 1 day. The maximum lag time of the NPP response to temperature is 11 days. Among the areas with time-lag effects, the area with a lag time of 1 day accounts for the largest area of 55.7%. The area where NPP has a time-lag effect on temperature is also mainly distributed near the Yi River and the Luo River’s lower reaches. Moreover, there is no time-lag effect on the NPP response to temperature in 44.3% of the basin (Figure 11). Most importantly, in the majority of areas where NPP exhibits a lag in response to climatic factors, NPP exhibits a greater lag in response to precipitation than to temperature.
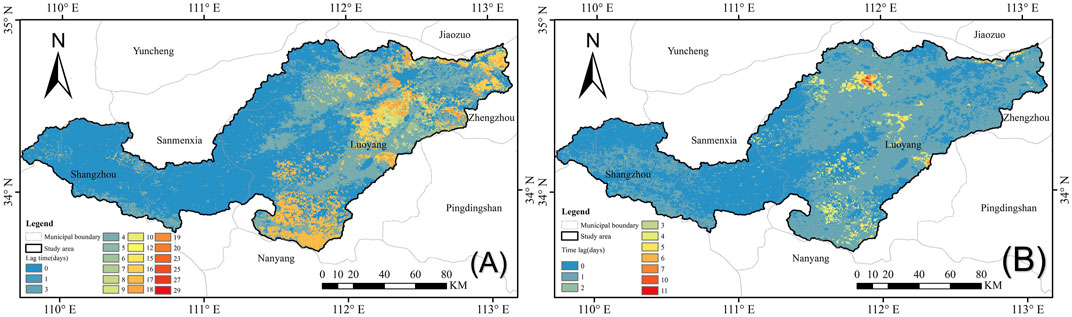
FIGURE 10. Lag time of NPP responses to precipitation (A) and air temperature (B) in the basin.
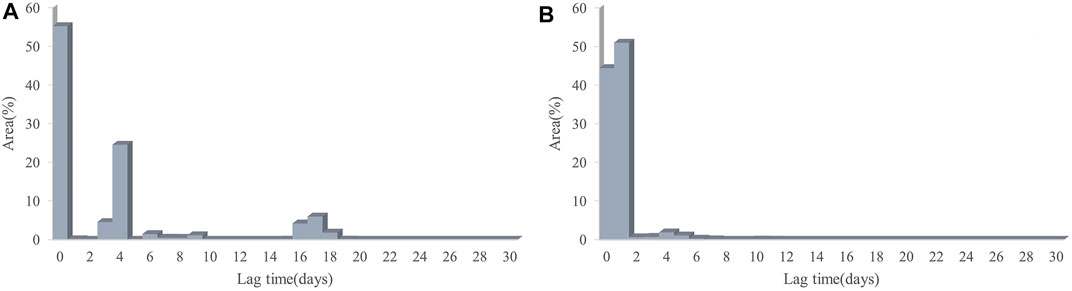
FIGURE 11. Proportion of NPP to precipitation (A) and temperature (B) with different lag times in the watershed area (%).
Multiple regression analysis
Both precipitation and temperature have different degrees of influence on the net primary productivity in the basin. To determine the extent to which various climatic factors have an impact on net primary productivity, a long-term pixel-by-pixel multiple regression analysis of NPP with precipitation and temperature was conducted. The regression coefficients of precipitation and temperature were obtained, and they both passed the significance test with a confidence level of 0.05. The climatic factor with the highest significance value is the main thing that affects each pixel’s NPP.
According to Figure 12, the area where precipitation was the dominant factor of NPP accounted for 43.2% of the basin area. As for the temperature, it accounted for 23.6%. The other area was probably influenced by human activity (Yan et al., 2021).
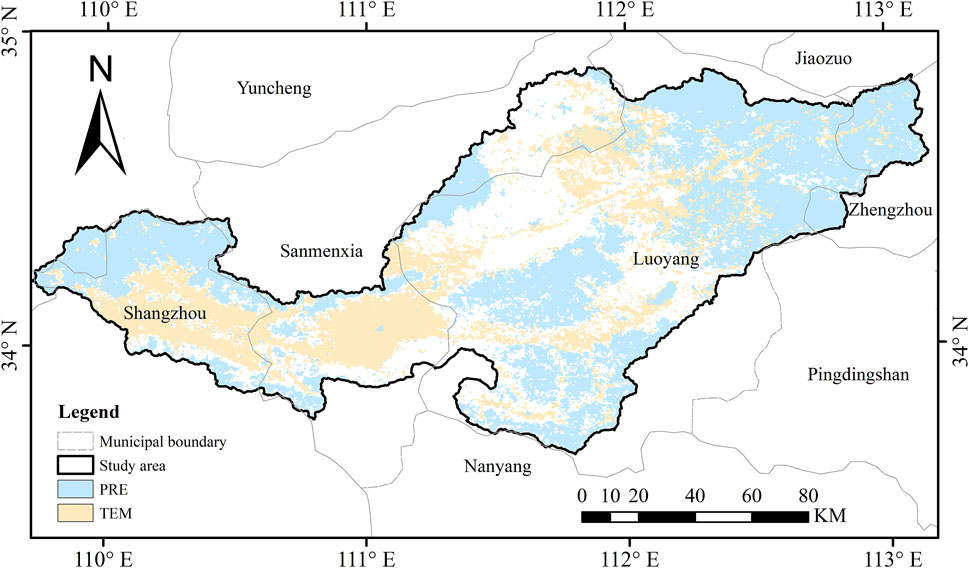
FIGURE 12. Factor that has a greater impact on NPP in each pixel in the basin.
Discussion
Temporal change and time lag of net primary productivity
Since the 1950s, the Yiluo River Basin’s ecological issues have gotten worse as a result of changes in land use patterns, vegetation cover, and effects of human activity (Liu et al., 2009; Yan et al., 2016; Li et al., 2022). Furthermore, the plain of the lower reaches of the basin is one of the most extensive plains of the Loess Plateau. It once experienced significant soil erosion issues. Therefore, in recent years, the ecological restoration of the basin has been carried out by planting artificial forest species and returning the grain plots to forestry (Wang et al., 2019). The ecological issues in the basin, like soil erosion, have somewhat improved as a result of the ecological restoration work in recent years. In the distribution of land use types in 2000, the proportion of forest area was 46.0% and the proportion of arable land was 40.8% of the area. In 2020, the proportion of forest area of land use types in the basin was the highest, reaching 46.5%. Arable land was the second, reaching 37.5%.
The decrease in arable land and increase in the forest caused the spatial mean of NPP in the basin to increase over the study period, and the change in land use type is also the primary cause of the variation of NPP in each pixel. The NPP also showed an increasing trend within the growing season period for many years; NPP in this period occupied the central part of the annual NPP, and it indicates that vegetation activity in the growing season period is stronger than at other times. The annual distribution of NPP shows high values in the summer and low values in the winter. Because the summer climate conditions are favorable for vegetation growth, the net primary productivity shows a higher value distribution in the summer on a seasonal scale. During 2000–2020, there were mutation points in the change process of the annual mean NPP in the basin, and the time of mutation in the region with mutation points was mainly before 2010.
Vegetation activity is a continuous process, and the response of NPP to precipitation and temperature is not instantaneous (Ding et al., 2020). The effects of infiltration of precipitation and temperature changes on the net primary productivity may have different time lags according to different vegetation characteristics (Wu et al., 2015; A et al., 2016). According to related research, the reason for the time lag in precipitation on NPP is that during the rainy season, there is less water available for vegetation to grow in a short period of time than what is currently falling, so the extra water is stored in the soil for later vegetation growth (Zhao et al., 2020). According to the analysis of the lag effect between NPP and climatic factors (precipitation and temperature) after the reconstructed time series, we can obtain the lag time distribution of NPP for climate factors in each region of the basin. The lag effect of the NPP response to precipitation reflects the length of time between the occurrence of precipitation and the arrival of water at the plant roots (Jobbagy et al., 2002). The NPP has a time-lag effect on precipitation in 44.8% of the basin, and its mean lag time is 8 days; these areas with a lag effect are mainly distributed in the northeastern and southeastern parts of the basin. There is almost no water infiltration in these areas due to the loess characteristics (Kong et al., 2018). There is no time-lag effect of the NPP response to precipitation in 55.2% of the basin, and the land use type of these areas is mainly forest. The difference in the time lag of precipitation among different vegetation types is due to the difference in vegetation density. The lag of NPP on precipitation is weak or even nonexistent in the forest area, whereas it is evident in arable land. Because the higher vegetation density accelerates water infiltration in the forest, the response of the NPP to precipitation has little lag. The lag of NPP response to temperature is related to soil temperature, organic matter decomposition, and nutrient availability (Braswell et al., 1997). The NPP has a time-lag effect on temperature in 55.7% of the basin, and its mean lag time is 1 day; these areas with a lag effect are mainly distributed in the eastern part of the basin. There is no time-lag effect in the NPP response to temperature in 55.2% of the basin. In the areas where the response of NPP to climatic factors (precipitation and temperature) is lagged, the lag of NPP to precipitation is stronger.
Effects of climatic factors on the spatial change of net primary productivity
The spatial distribution pattern of precipitation in our country is more concentrated in the south and east and less in the north and west. Moreover, the spatial distribution pattern in the Yiluo River basin is the same. The main vegetation distribution in the western and central areas is forest, and the primary vegetation type in the eastern basin is arable land. Due to the higher species diversity and coverage of forest vegetation, the NPP of the forest-covered area in the western part of the basin is higher than that of the cultivated area in the eastern part. Moreover, at different times, the areas with increasing NPP made up about 90% of the basin.
The distribution of land use types from 2000 to 2020 shows that the majority of land use types in the NPP reduction area have shifted from forest to the current artificial surface (Yan et al., 2021). The land use types corresponding to NPP from high to low were forest, grassland, arable land, bare land, artificial surface, and water wetland. It indicates that the NPP in the area with good vegetation status usually shows an increasing trend, and the NPP in the area with poor vegetation status, such as an artificial surface, usually shows a decreasing trend.
Temperature and precipitation are essential for affecting factors of NPP in the Yiluo River Basin. We respectively compared the multiple regression coefficients of NPP with temperature and precipitation. There are more areas in the basin where precipitation is the main influencing factor than where the temperature is the main influencing factor. It means that the mean NPP of the basin is more affected by the precipitation. The correlation between the monthly NPP and precipitation in the basin shows a negative correlation in the western region, which is dominated by forest vegetation. Moreover, the correlation between the monthly NPP and temperature in the basin shows a positive correlation in the eastern region, which is dominated by arable land vegetation types. It could be indicated that the precipitation in the forest has a certain negative effect on the NPP. In contrast, the precipitation on arable land has a positive effect on the NPP.
Conclusion
Climate variables play a significant role in net primary productivity. The effect of temperature on NPP is greater than that of precipitation. During the study time frame, the NPP showed an increasing trend. In comparison to 2000, the NPP increased by 236.2 gC/m2/a in 2020. The NPP showed a high value in the western area of the basin and a low value in the eastern area. The annual average NPP was 556.3 gC/m2 from 2000 to 2020. Only the middle area of the eastern part of the basin displays a decreasing trend, making up about 90% of the area where the NPP at various time scales in the basin exhibits an increasing trend. The temperature conditions have a positive effect on vegetation in the basin, while precipitation has a negative effect on most forests in the basin and a positive effect on arable land. The area of NPP with a time-lag effect response to climate factors accounted for nearly half of the basin. NPP has a time-lag effect on precipitation in 44.8% of the basin, and its mean lag time is 8 days. It is mainly distributed in the northeastern and southeastern parts of the basin. The NPP has a time-lag effect on temperature in 55.7% of the basin, and its mean lag time is 1 day, mainly distributed in the eastern area. The time-lag effect of NPP response to climatic factors in the arable land is stronger than that in the forest, and the time-lag effect of NPP response to precipitation is stronger than that of temperature. Based on the analysis of the time-lag effect of NPP on climatic factors in the basin, we can better understand the response of vegetation activities to climatic factors, and we can try to reduce the time-lag effect of NPP response to climatic factors by increasing vegetation density. It allows the water in the Yiluo River Basin to be used efficiently and reduces soil erosion. Additionally, as an important component of the Yellow River basin, its ecological protection and development have received much attention. Thus, it has some reference value for the Yellow River basin and the Loess Plateau’s management of ecological issues.
Data availability statement
The original contributions presented in the study are included in the article/Supplementary Material; further inquiries can be directed to the corresponding author.
Ethics statement
Written informed consent was obtained from the individual(s) for the publication of any potentially identifiable images or data included in this article.
Author contributions
TQ, HW, and ZT participated in the research, proposed the topic, and designed the research scheme, and TQ and HW are responsible for the guidance work. JH, ZT, and YL acquired and processed the experimental data. After the data processing was completed, ZT was responsible for the editing and writing of the manuscript. After the first draft of the manuscript was completed, HW and TQ proposed revision and guidance for the manuscript, and ZT revised the manuscript and submitted it for publication. CL and SA improved the quality and fluency of the language.
Funding
This work was supported by the National Science Fund for Distinguished Young Scholars (Grant No. 51725905), the National Natural Science Foundation of China (Grant No. 51879275), The National Natural Science Foundation of China (Grant No. 52130907), and the Five Major Excellent Talent Programs of China Institute of Water Resources and Hydropower Research (Grant No. WR0199A012021).
Conflict of interest
The authors declare that the research was conducted in the absence of any commercial or financial relationships that could be construed as a potential conflict of interest.
Publisher’s note
All claims expressed in this article are solely those of the authors and do not necessarily represent those of their affiliated organizations, or those of the publisher, the editors, and the reviewers. Any product that may be evaluated in this article, or claim that may be made by its manufacturer, is not guaranteed or endorsed by the publisher.
References
Braswell, B. H., Schimel, D. S., Linder, E., and Moore, B. (1997). The response of global terrestrial ecosystems to interannual temperature variability. Science 278, 870–873. doi:10.1126/science.278.5339.870
Chen, G., Huang, Y., Chen, J., and Wang, Y. (2019). Spatiotemporal variation of vegetation net primary productivity and its responses to climate change in the huainan coal mining area. J. Indian Soc. Remote Sens. 47, 1905–1916. doi:10.1007/s12524-019-01039-w
Chen, T., De Jeu, R. a. M., Liu, Y. Y., Van Der Werf, G. R., and Dolman, A. J. (2014). Using satellite based soil moisture to quantify the water driven variability in ndvi: A case study over mainland Australia. Remote Sens. Environ. 140, 330–338. doi:10.1016/j.rse.2013.08.022
Chen, T., Peng, L., Liu, S., and Wang, Q. (2017). Spatio-temporal pattern of net primary productivity in hengduan mountains area, China: Impacts of climate change and human activities. Chin. Geogr. Sci. 27, 948–962. doi:10.1007/s11769-017-0895-5
Ding, Y., Li, Z., and Peng, S. (2020). Global analysis of time-lag and -accumulation effects of climate on vegetation growth. Int. J. Appl. Earth Observation Geoinformation 92, 102179. doi:10.1016/j.jag.2020.102179
Duo, A., Zhao, W., Qu, X., Jing, R., and Xiong, K. (2016). Spatio-temporal variation of vegetation coverage and its response to climate change in North China plain in the last 33 years. Int. J. Appl. Earth Observation Geoinformation 53, 103–117. doi:10.1016/j.jag.2016.08.008
Gao, T., Xu, B., Yang, X., Deng, S., Liu, Y., Jin, Y., et al. (2017). Aboveground net primary productivity of vegetation along a climate-related gradient in a eurasian temperate grassland: Spatiotemporal patterns and their relationships with climate factors. Environ. Earth Sci. 76, 56. doi:10.1007/s12665-016-6158-4
Ge, W., Deng, L., Wang, F., and Han, J. (2021). Quantifying the contributions of human activities and climate change to vegetation net primary productivity dynamics in China from 2001 to 2016. Sci. Total Environ. 773, 145648. doi:10.1016/j.scitotenv.2021.145648
Guo, D., Song, X., Hu, R., Cai, S., Zhu, X., and Hao, Y. (2021). Grassland type-dependent spatiotemporal characteristics of productivity in Inner Mongolia and its response to climate factors. Sci. Total Environ. 775, 145644. doi:10.1016/j.scitotenv.2021.145644
He, J., Zhang, P., Jing, W., and Yan, Y. (2018). Spatial responses of net ecosystem productivity of the Yellow River basin under diurnal asymmetric warming. Sustainability 10, 3646. doi:10.3390/su10103646
Ji, Y., Zhou, G., Luo, T., Dan, Y., Zhou, L., and Lv, X. (2020). Variation of net primary productivity and its drivers in China’s forests during 2000–2018. For. Ecosyst. 7, 15. doi:10.1186/s40663-020-00229-0
Jiang, Y., Guo, J., Peng, Q., Guan, Y., Zhang, Y., and Zhang, R. (2020). The effects of climate factors and human activities on net primary productivity in Xinjiang. Int. J. Biometeorol. 64, 765–777. doi:10.1007/s00484-020-01866-4
Jobbagy, E. G., Sala, O. E., and Paruelo, J. M. (2002). Patterns and controls of primary production in the patagonian steppe: A remote sensing approach. Ecology 83, 307–319. doi:10.1890/0012-9658(2002)083[0307:Pacopp]2.0.Co;2
Kong, D., Miao, C., Borthwick, A. G. L., Lei, X., and Li, H. (2018). Spatiotemporal variations in vegetation cover on the Loess Plateau, China, between 1982 and 2013: Possible causes and potential impacts. Environ. Sci. Pollut. Res. 25, 13633–13644. doi:10.1007/s11356-018-1480-x
Kong, D., Miao, C., Wu, J., Zheng, H., and Wu, S. (2020). Time lag of vegetation growth on the Loess Plateau in response to climate factors: Estimation, distribution, and influence. Sci. Total Environ. 744, 140726. doi:10.1016/j.scitotenv.2020.140726
Li, H., Zhang, H., Li, Q., Zhao, J., Guo, X., Ying, H., et al. (2021). Vegetation productivity dynamics in response to climate change and human activities under different topography and land cover in northeast China. Remote Sens. 13, 975. doi:10.3390/rs13050975
Li, Q., Hou, J., Yan, P., Xu, L., Chen, Z., Yang, H., et al. (2020). Regional response of grassland productivity to changing environment conditions influenced by limiting factors. PLoS One 15, e0240238. doi:10.1371/journal.pone.0240238
Li, T., Zhang, Q., Singh, V. P., Zhao, J., Song, J., Sun, S., et al. (2022). Identification of degradation areas of ecological environment and degradation intensity assessment in the Yellow River basin. Front. Earth Sci. (Lausanne). 10. doi:10.3389/feart.2022.922013
Linger, E., Hogan, J. A., Cao, M., Zhang, W.-F., Yang, X.-F., and Hu, Y.-H. (2020). Precipitation influences on the net primary productivity of a tropical seasonal rainforest in southwest China: A 9-year case study. For. Ecol. Manag. 467, 118153. doi:10.1016/j.foreco.2020.118153
Liu, F.-H., Xu, C.-Y., Yang, X.-X., and Ye, X.-C. (2020). Controls of climate and land-use change on terrestrial net primary productivity variation in a subtropical humid basin. Remote Sens. 12, 3525. doi:10.3390/rs12213525
Liu, H., Zhang, A., Jiang, T., Zhao, A., Zhao, Y., and Wang, D. (2018). Response of vegetation productivity to climate change and human activities in the shaanxi–gansu–ningxia region, China. J. Indian Soc. Remote Sens. 46, 1081–1092. doi:10.1007/s12524-018-0769-z
Liu, H., Zhang, A., Liu, C., Zhao, Y., Zhao, A., and Wang, D. (2021). Analysis of the time-lag effects of climate factors on grassland productivity in Inner Mongolia. Glob. Ecol. Conservation 30, e01751. doi:10.1016/j.gecco.2021.e01751
Liu, Q., Yang, Z., Cui, B., and Sun, T. (2009). Temporal trends of hydro-climatic variables and runoff response to climatic variability and vegetation changes in the Yiluo River basin, China. Hydrol. Process. 23, 3030–3039. doi:10.1002/hyp.7414
Luo, Z., Wu, W., Yu, X., Song, Q., Yang, J., Wu, J., et al. (2018). Variation of net primary production and its correlation with climate change and anthropogenic activities over the Tibetan plateau. Remote Sens. 10, 1352. doi:10.3390/rs10091352
Ngoma, J., Braakhekke, M. C., Kruijt, B., Moors, E., Supit, I., Speer, J. H., et al. (2019). Modelling the response of net primary productivity of the Zambezi teak forests to climate change along a rainfall gradient in Zambia. Biogeosciences 16, 3853–3867. doi:10.5194/bg-16-3853-2019
Poungparn, S., Komiyama, A., Umnouysin, S., Rodtassana, C., Sangtiean, T., Maknual, C., et al. (2020). Ten-year estimation of net primary productivity in a mangrove forest under a tropical monsoon climate in eastern Thailand: Significance of the temperature environment in the dry season. Forests 11, 987. doi:10.3390/f11090987
Sun, J., and Du, W. (2017). Effects of precipitation and temperature on net primary productivity and precipitation use efficiency across China’s grasslands. GIScience Remote Sens. 54, 881–897. doi:10.1080/15481603.2017.1351147
Tang, W., Liu, S., Kang, P., Peng, X., Li, Y., Guo, R., et al. (2021). Quantifying the lagged effects of climate factors on vegetation growth in 32 major cities of China. Ecol. Indic. 132, 108290. doi:10.1016/j.ecolind.2021.108290
Wang, J., Dong, J., Yi, Y., Lu, G., Oyler, J., Smith, W. K., et al. (2017a). Decreasing net primary production due to drought and slight decreases in solar radiation in China from 2000 to 2012. J. Geophys. Res. Biogeosci. 122, 261–278. doi:10.1002/2016jg003417
Wang, J., Sun, R., Zhang, H., Xiao, Z., Zhu, A., Wang, M., et al. (2021). New global MuSyQ GPP/NPP remote sensing products from 1981 to 2018. IEEE J. Sel. Top. Appl. Earth Obs. Remote Sens. 14, 5596–5612. doi:10.1109/jstars.2021.3076075
Wang, W. J., Ma, S., He, H. S., Liu, Z., Thompson, F. R., Jin, W., et al. (2019a). Effects of rising atmospheric CO2, climate change, and nitrogen deposition on aboveground net primary production in a temperate forest. Environ. Res. Lett. 14, 104005. doi:10.1088/1748-9326/ab3178
Wang, X., Tan, K., Chen, B., and Du, P. (2017b). Assessing the spatiotemporal variation and impact factors of net primary productivity in China. Sci. Rep. 7, 44415. doi:10.1038/srep44415
Wang, X., Zhang, P., Liu, L., Li, D., and Wang, Y. (2019b). Effects of human activities on hydrological components in the YiLuo river basin in middle Yellow River. Water 11, 689. doi:10.3390/w11040689
Wang, Z., Zhong, J., Lan, H., Wang, Z., and Sha, Z. (2019c). Association analysis between spatiotemporal variation of net primary productivity and its driving factors in inner Mongolia, China during 1994–2013. Ecol. Indic. 105, 355–364. doi:10.1016/j.ecolind.2017.11.026
Wu, D., Zhao, X., Liang, S., Zhou, T., Huang, K., Tang, B., et al. (2015). Time-lag effects of global vegetation responses to climate change. Glob. Chang. Biol. 21, 3520–3531. doi:10.1111/gcb.12945
Yan, N., Liu, W., Xie, H., Gao, L., Han, Y., Wang, M., et al. (2016). Distribution and assessment of heavy metals in the surface sediment of Yellow River, China. J. Environ. Sci. 39, 45–51. doi:10.1016/j.jes.2015.10.017
Yan, Y., Wu, C., and Wen, Y. (2021). Determining the impacts of climate change and urban expansion on net primary productivity using the spatio-temporal fusion of remote sensing data. Ecol. Indic. 127, 107737. doi:10.1016/j.ecolind.2021.107737
Yang, H., Hu, D., Xu, H., and Zhong, X. (2020). Assessing the spatiotemporal variation of NPP and its response to driving factors in Anhui province, China. Environ. Sci. Pollut. Res. 27, 14915–14932. doi:10.1007/s11356-020-08006-w
Yuan, Z., Wang, Y., Xu, J., and Wu, Z. (2021). Effects of climatic factors on the net primary productivity in the source region of Yangtze River, China. Sci. Rep. 11, 1376. doi:10.1038/s41598-020-80494-9
Zhan, X., Guo, M., and Zhang, T. (2018). Joint control of net primary productivity by climate and soil nitrogen in the forests of eastern China. Forests 9, 322. doi:10.3390/f9060322
Zhang, J., Ge, Y., Yuan, G., and Song, Z. (2022). Consideration of high-quality development strategies for soil and water conservation on the loess plateau. Sci. Rep. 12, 8336. doi:10.1038/s41598-022-12006-w
Zhang, M., Lal, R., Zhao, Y., Jiang, W., and Chen, Q. (2017). Spatial and temporal variability in the net primary production of grassland in China and its relation to climate factors. Plant Ecol. 218, 1117–1133. doi:10.1007/s11258-017-0756-4
Zhang, X., Xiao, W., Wang, Y., Wang, Y., Wang, H., Wang, Y., et al. (2019). Spatial-temporal changes in NPP and its relationship with climate factors based on sensitivity analysis in the Shiyang River Basin. J. Earth Syst. Sci. 129, 24. doi:10.1007/s12040-019-1267-6
Zhang, Y., Zhang, C., Wang, Z., Chen, Y., Gang, C., An, R., et al. (2016). Vegetation dynamics and its driving forces from climate change and human activities in the Three-River Source Region, China from 1982 to 2012. Sci. Total Environ. 563-564, 210–220. doi:10.1016/j.scitotenv.2016.03.223
Keywords: net primary productivity, climatic factor, temporal and spatial distribution, correlation, time-lag effect
Citation: Tian Z, Qin T, Wang H, Li Y, Yan S, Hou J, Li C and Abebe SA (2023) Delayed response of net primary productivity with climate change in the Yiluo River basin. Front. Earth Sci. 10:1017819. doi: 10.3389/feart.2022.1017819
Received: 12 August 2022; Accepted: 08 November 2022;
Published: 11 January 2023.
Edited by:
Weili Duan, Xinjiang Institute of Ecology and Geography (CAS), ChinaReviewed by:
Fubo Zhao, Xi’an Jiaotong University, ChinaHaijun Deng, Fujian Normal University, China
Copyright © 2023 Tian, Qin, Wang, Li, Yan, Hou, Li and Abebe. This is an open-access article distributed under the terms of the Creative Commons Attribution License (CC BY). The use, distribution or reproduction in other forums is permitted, provided the original author(s) and the copyright owner(s) are credited and that the original publication in this journal is cited, in accordance with accepted academic practice. No use, distribution or reproduction is permitted which does not comply with these terms.
*Correspondence: Tianling Qin, cWludGxAaXdoci5jb20=