 Ziqi Chen
 Yanhong Zhang1*
 Peng Zang
- 1College of Geo-Exploration Science and Technology, Jilin University, Changchun, China
- 2Northeast Institute of Geography and Agriculture, Chinese Academy of Sciences, Changchun, China
- 3College of New Energy and Environment, Jilin University, Changchun, China
In response to the difficulties of flood plain quality assessment, red-edge spectral remote sensing data acquired from the Jilin-01 satellite were used. The Grassland Quality Index (GQI) was formed by the Normalized Difference Vegetation Index (NDVI) and Normalized Difference Red Edge Index (NDRE) related to the determination of grassland quality and the first principal component of the red-edge Chlorophyll Index obtained by principal component analysis. The GQI was applied to evaluate grassland quality in the flooded plain, which is an important grassland ecological-barrier area in the western area of Jilin Province, and was then verified using field measurement data. Results show that 1) 80% of grasslands in Xianghai Nature Reserve are of a medium quality, and the grasslands with good growth status account for approximately 15% and are mainly concentrated in the wetland and swamp areas in the central south part of the reserve and that 2) the correlation of the evaluation results was verified using the survey field biomass, and the coefficient of the empirical correlation model is 0.96, which indicates good consistency. This study is of practical significance for the timely and accurate monitoring of grassland growth, which is beneficial for the development of livestock husbandry and the protection of the ecological environment in northern China.
1 Introduction
With the synchronous improvement of high spatial and high spectral resolution of remote sensing technology, the quantitative evaluation capability of ground objectives has been further strengthened (Kanke et al., 2012; Das et al., 2014; Sibanda et al., 2017). This is especially true for surface vegetation, which is a very effective feature on the earth’s surface due to its spatial position and its spectral sensitivity to radiation changes (Amy et al., 2014). The multi-spectral satellite payload in the traditional visible band occurs mainly in the blue band (450–520 nm), green band (520–590 nm), red band (630–690 nm), and near-infrared band (770–890 nm) (Niemann et al., 2015; Zhou et al., 2021). Red-edge spectra are between the red band and the near-infrared band (Baranoski and Rokne, 2005; Cho et al., 2008; Shaokui et al., 2011).
Additionally, red-edge spectra have been used to estimate the plant nitrogen content, chlorophyll content, and biomass. This is due to the development of hyper-spectra remote sensing, which can be used to estimate the leaf nitrogen content and chlorophyll concentration more accurately (Eitel et al., 2009; Ramoelo et al., 2012; Clevers and Gitelson, 2013; Delegido et al., 2013; Vincini et al., 2014; Kanke et al., 2016). Red-edge data of Rapid-Eye and World-View satellites are mainly applied to the research of crops, woodlands, and land cover. These studies (Ma and Weiwei, 2015; Fang et al., 2017; Shu et al., 2018; Su et al., 2018) mainly focused on the following: 1) an evaluation of the overall quality of regional vegetation using red-edge spectra; 2) the study the index system of vegetation evaluation; and 3) usually single indicators, such as the nitrogen content of vegetation, chlorophyll content, or control of certain pests and diseases, are evaluated. In terms of single indices, Fang et al. (2017) evaluated the effectiveness of different red-edge indices on inverting the health level obtained in grasslands by comparison, and the results showed that NDRE can be applied to accurately and quickly monitor the health of grasslands with an accuracy of more than 80%. Li et al. (2014) studied various vegetation indices based on the performance of red-edge spectral indices of bandwidth and crop growth stage changes. Regarding integrated indices, Hu et al. (2017) proposed a new vegetation health index (VHI), which integrates three factors, namely, the normalized mountain vegetation index, the nitrogen reflectance index, and yellow light band reflectance, through principal component transformation. This is a way to reduce errors caused by the subjective weighted summation integration method and facilitate extensive and rapid evaluation and monitoring of vegetation health in soil erosion areas. From the perspective of the research and realization process, first, the evaluation index system is complex, which makes it difficult in many cases to obtain supporting data; second, the selection of indicators is too subjective, which is not conducive to promoting the method to other times and places. The main reason for the above problems is that sensors with red-edge spectra are still seldom, the transmission time is not long, and research on remote sensing using red-edge spectra still needs further study.
Jilin-1 is the first commercial satellite to be named after a province in China. Among data with a spatial resolution of 4 m acquired by 07 satellites launched in January 2018, B4 is a red-edge spectra and is based on the significant expression of B4 to the vegetation. In this study, the grassland quality index (GQI) was established using a principal component analysis (PCA) method, considering the vegetation-related NDVI, NDRE, and chlorophyll indexes that were integrated to evaluate the quality of grassland in the Xianghai Nature Reserve. Also, biomass data were used to confirm the performance for the grassland quality evaluation, especially in dispersed grassland habitat, to enhance its ability to quantitatively evaluate vegetation quality. This paper quickly and accurately judged the regional grassland growth conditions to improve the inverse accuracy of grassland quality by constructing a comprehensive vegetation index, which is of great significance for the protection and improvement of the ecological environment.
2 Materials and methods
2.1 Study area
The study area is located in the Xianghai Nature Reserve in the western Jilin province. The area occurs at a latitude and longitude of 122° 04′E–122° 30′E and 43° 59′N–48° 33′N and covers a total area of 1054.67 km2 as shown in Figure 1. This area belongs to the continental monsoon climate of the north temperate zone with an annual average temperature of 5.1 °C and annual average precipitation of 408.3 mm. Most rainfall is concentrated in July and August. There are semi-arid grasslands embedded in this area, which show the landscape characteristics of a dune elm forest—vast grassland—reed grass field—lake water. However, marsh vegetation, meadow vegetation, and the saline-alkali vegetation community are more common. The plants belong to 537 species, 237 genera, 89 families, and 5 phyla. Grassland is not only the base of animal husbandry development but is also the main habitat for many waterfowl, especially for Grusgrus (see Table1). Thus, grasslands play an important role in local economic and ecological construction and require extra attention.
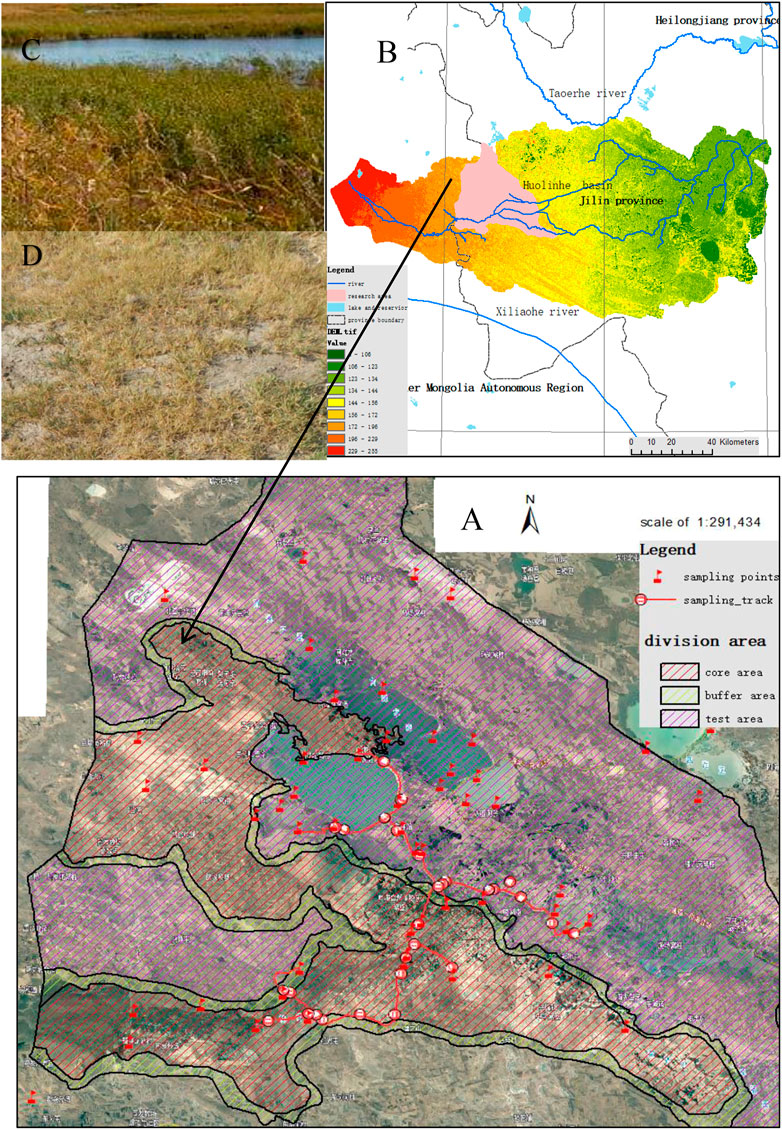
FIGURE 1. The location and condition map of the study area. (A) Image and surveying point from 2014 to 2018 in Xianghai nature reserve; (B) the location of Xianghai nature reserve in Jilin province; (C) the reed community; and (D) the meadow community.
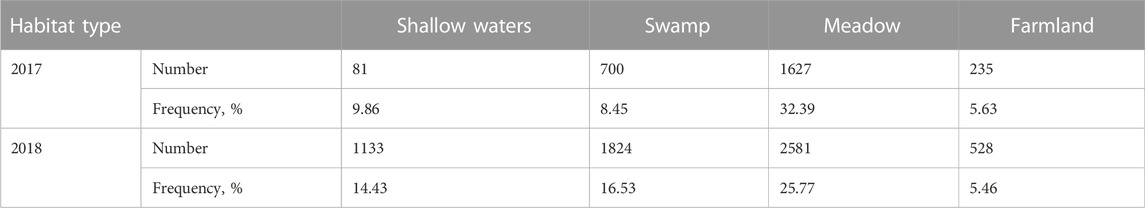
TABLE 1. Habitat types and population statistics of Grusgrus.
2.2 Data collection and processing
Figure 2 provides the overall methodological flowchart for the evaluation of grassland quality from Jilin-01 satellite images.
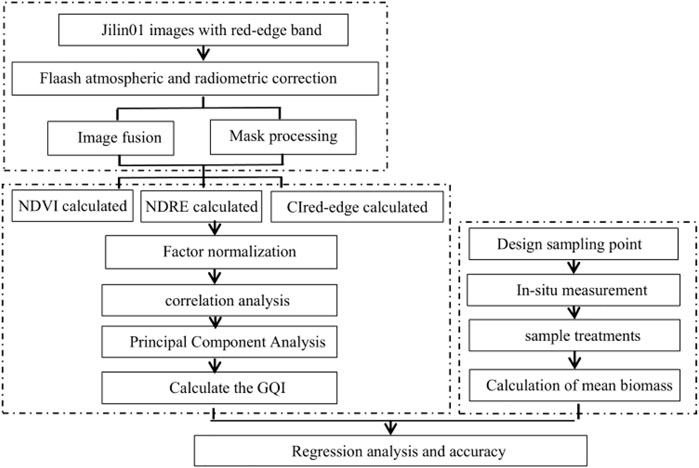
FIGURE 2. The overall methodological flowchart for evaluation of the grassland quality.
2.2.1 “Jilin-01” images and processing
“Jilin-01” is a high spatial resolution satellite platform that was independently developed by Changguang Satellite Technology Co., Ltd. The images are remote sensing image data of the 04–07 satellite of “Jilin No.01,” and the 04–06 satellite was launched on 21 November 2017 while the 07 satellite was launched on 19 January 2018. Multi-spectral data were obtained by this satellite, which had a spatial resolution of 4 m while B4 carried the red-edge spectra information. This was a sensitive spectrum and indicated a growing status of green plants. The images used in this study were acquired on the 19th, 25th, 26th, and 27th of September 2018.
First, the center wavelength value and bandwidth were input according to the 07-star image spectra information. The radiation gain and radiation offset were set using the absolute gain coefficient and absolute bias coefficient stored in the metadata. Then, the Flash atmospheric correction and radiometric calibration with a scaling factor of 1 were performed on the image using radiometric calibration parameters. To obtain a complete image of the tested area, the four images obtained at different times were processed with mosaic, feathered, and light evenness processing.
2.2.2 Field sampling data
To test the accuracy and applicability of GQI formed in this paper, 27 large plots, which cover the 3 photo communities, were selected with a slightly larger scope of 4.0 m × 4.0 m to ensure a pure pixel with a single species. Within each plot, small plots of 1.0 m × 1.0 m are set at the four corners and center of each quadrat to investigate the species and their abundance, height, and coverage. Then, all the above-ground parts of the five small quadrats at ground level were cut, and the soil, gravel, and other debris were removed after returning to the laboratory. The material was then dried at 65 °C to a constant weight. The mean weight of the five small plots is used as the biomass of the large quadrat.
2.3 Method
The differences in spectral characteristics reflect the differences in chlorophyll and leaf water content, which not only influenced each other, but were also closely related to grassland quality. The red-edge index is very sensitive to various physical and chemical properties of vegetation and can be used to identify the growing status of grasslands. The location, height, and slope of the “red edge” may vary with different vegetation and different growing conditions of the same vegetation (Yang et al., 2012). In this study and according to the spectral band characteristics of the Jilin-1 satellite image, the Normalized Difference Vegetation Index (NDVI), Normalized Difference Red Edge Index (NDRE), and Red Edge Chlorophyll Index are selected (
2.3.1 NDVI
NDVI can quantify the growth of grassland vegetation and has been widely used for grassland vegetation monitoring (Chen et al., 2023). One study showed that NDVI is sensitive to the change in soil background (Xu, 2013), and is linearly correlated with the vegetation distribution density. Additionally, it is a comprehensive reflection of vegetation types, cover forms, and growth conditions in a unit pixel, and its size depends on the vegetation coverage and leaf area index. NDVI has a wide range of vegetation coverage detection and good temporal and spatial adaptability and it is therefore widely used.
The expression of NDVI is as follows:
where
2.3.2 NDRE
NDRE can be used to analyze the health of vegetation in the images obtained by multi-spectral sensors. Replacing the red band of NDVI with the red-edge band of NDRE provides a new measurement method and its calculation formula is as follows:
where
2.3.3 Chlorophyll index,
where
2.4 Grassland quality index (GQI)
Based on the above three planting indices, this study continuously experimented and explored and also proposed the grassland quality index (GQI) constructed by the combination of NDVI, NDRE, and
Because the subjective determination of the weight of each index usually affects the calculation results of the index, the current and common method is used to carry on the weighted sum of various indexes. When two or more indicators jointly contribute to ecological change, it is difficult to determine which indicator plays the main role in ecological change and then assign a specific weight to it. Previous studies have shown that use of a principal component analysis (PCA) can solve this problem (Hu et al., 2017). The PCA method maintains the low-order principal component and reduces the influence of the high-order principal component so that it can reduce the dimension of the dataset while maintaining the maximum variance contribution of the dataset. PCA was used to integrate the three variables into GQI through a linear transformation to avoid bias caused by subjective weighting due to the conventional weighted summation integration method.
PCA was conducted on three factors, and three principal component characteristic factor subsets were obtained as shown in Table 2. This shows that PC1 has concentrated most of the eigenvalues of the three factors. Among them, NDRE and
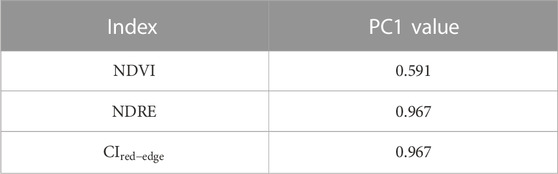
TABLE 2. Three indices of the principal component analysis.
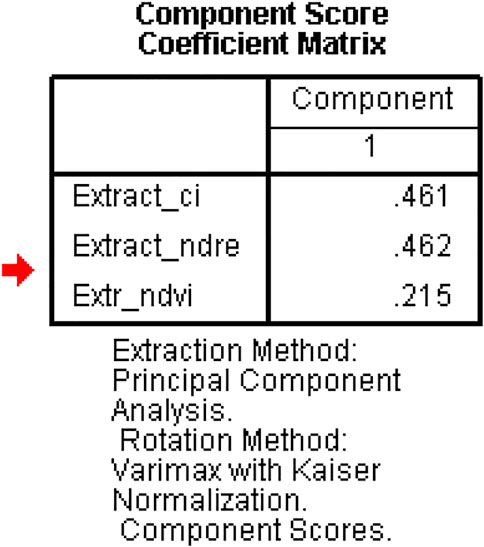
FIGURE 3. The component score coefficient matrix.
2.5 Error measurement
Biomass is an important index used to measure the quality of the ecological environment and the value of nature conservation (Qu et al., 2010). To verify the evaluation results, 15 random sites were arranged as sampling points within the scope of the study area, and the above-ground biomass of the sample points was measured using quadrate harvesting. Then, a correlation model was established using nine effective measuring sites. The larger the correlation index, the more reliable the evaluation result. To avoid individual differences, a buffer zone was delimited with each sample point as the center and at a radius of 4 m. Then, a square of 64 m2 was made and GQI values were obtained from five points (a, b, c, d, and e) that were randomly selected in the square to calculate the average value, which is considered the quality index of the square.
3 Results and analysis
3.1 The grassland quality map and grassland distribution
The GQI was applied to the Xianghai Nature Reserve. As shown in Figure 4, the overall grassland quality in the study area occurred at a medium level, and 15% of grasslands had good growth conditions and were mainly concentrated in the wetland and marsh areas in the south-central part of the reserve. This indicates that the environmental management in this area has achieved certain results and the vegetation health was in relatively good condition. A total of 80% of the grassland was of medium quality and was widely distributed in the study area. However, there are still a small number of scattered areas with poor grassland quality in approximately 5% of the region. These areas were mainly saline-alkali land and sandy land with an insufficient water supply and serious land degradation. In this study, 0.8 was used as the step length for each grade, and the grassland quality was divided into seven grades as follows: super poor (−2.6–−1.8), very poor (−1.8–−1), poor (−1–−0.2), medium (−0.2–0.6), good (0.6–1.4), better (1.4–2.2) and best (2.2–3.0). According to Figure 5, the grassland quality index is generally a normal distribution, which is more consistent with reality.
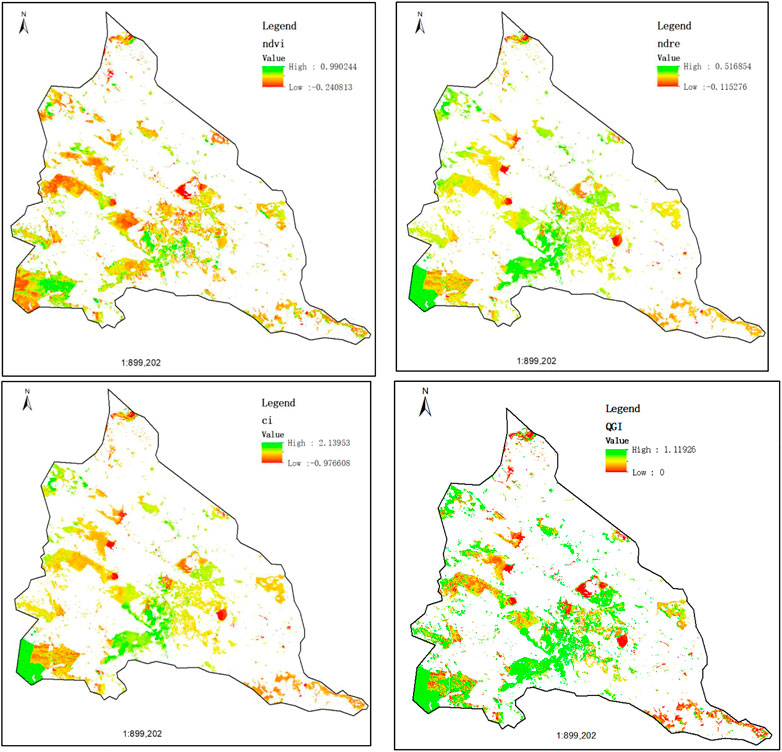
FIGURE 4. Results of study area NDVI, NDRE, and
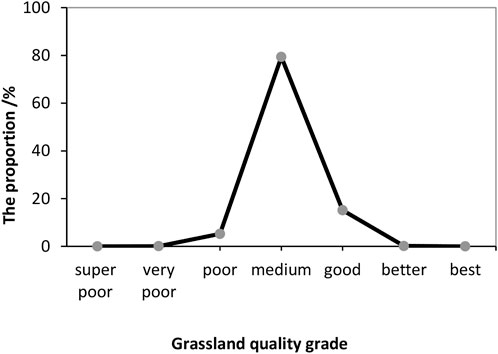
FIGURE 5. Classification statistics of the grassland quality index.
3.2 Error analysis
According to the data, the bi-coordinate longitudinal curve of above-ground biomass and grassland index of GQI was made as shown in Figure 6. The figure clearly shows that the two indices present the same trend and indicate that the established comprehensive index of grassland quality GQI is highly consistent with above-ground biomass. To quantify the relationship between the two variables, the least square method is further used to establish the correlation, the correlation model is y = 0.0004x + 0.0017, and R-squared is 0.96.
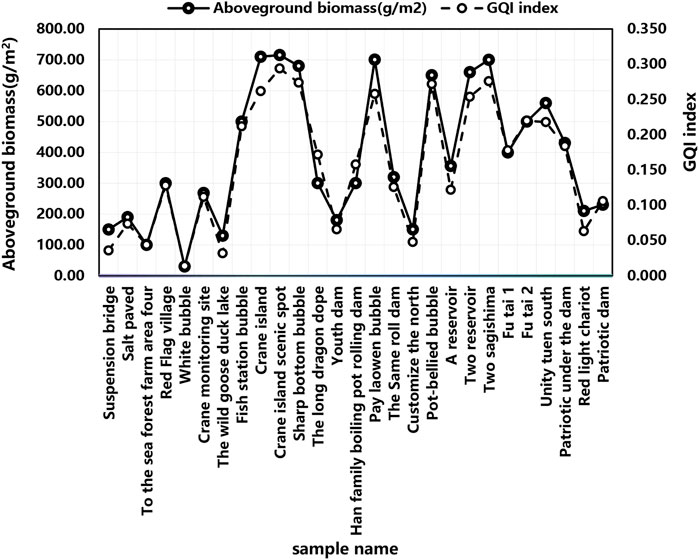
FIGURE 6. The graph of two vertical axis.
The scatter plot of the correlation is shown in Figure 7. This also quantitatively shows that the GQI is highly consistent with above-ground biomass, which further indicates that the comprehensive index of grassland quality GQI can reflect grassland quality.
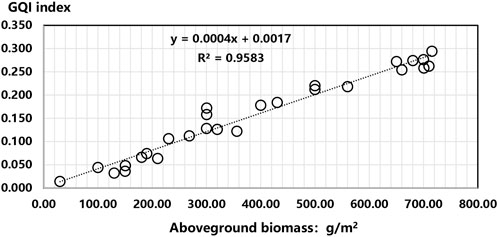
FIGURE 7. The two-index scatterplot.
4 Discussion and conclusion
4.1 Discussion
4.1.1 Analysis of factors influencing the grassland quality
The grassland quality in the south-central and southwestern parts of Xianghai Nature Reserve is good and the area is recharged by rivers and reservoirs and the marshland soil is relatively fertile, and so the growth conditions required for vegetation are at a high level. In contrast, the grassland quality in the central-western and southeastern areas is poor, especially in the NDVI, which reflects the low coverage of grassland in the area, which is mostly degraded to saline conditions. Currently, agriculture and animal husbandry in the protected areas are still blindly reclaimed, farmed, and overgrazed and are crudely operated at the cost of the environment and the destruction of resources.
4.1.2 Limitations of the grassland quality index
Previous studies mostly focused on the use of red-edge bands to evaluate the overall quality of regional vegetation, but often needed several indicators and only monitored a single situation of vegetation such as nitrogen and chlorophyll content. The selection of index factors is also often affected by individual factors. Based on the PCA of the normalized vegetation index (NDVI), normalized difference red-edge index (NDRE), and red-edge chlorophyll index (CI-red-edge), a new vegetation index-grassland quality index (GQI) is constructed. The integration of each index is not a weighted sum but is based on the contribution of each index to the first principal component. Therefore, the index can be objectively coupled with each index and reasonably represents the regional ecological quality. Compared with the single vegetation index, the comprehensive index can more comprehensively reflect the advantages and disadvantages of different indicators used to evaluate the grassland quality. The red-edge band adds more spectral information and therefore reflects the various physical and chemical properties of grasslands and improves the accuracy of the grassland quality index (GQI).
However, the index also has some shortcomings as follows: for the areas with sparse grassland coverage, the index has a large error with the actual situation. The NDRE and the red-edge band are affected by soil moisture and light intensity, and the sensitivity of the index to the changes in chlorophyll content is changed. Therefore, the grassland quality index (GQI) is not suitable for use in large areas of grassland.
4.1.3 The accuracy verification
Based on the “Jilin No.1” remote sensing image and using Jilin Xianghai Nature Reserve as the study area, this study analyzed the quantitative evaluation of grassland quality with the vegetation index extracted from satellite image “07.” To verify the accuracy, field survey data of above-ground biomass were used to compare the GQI values from the inversion map one by one. It is not easy to ensure the exact correspondence between the field’s measured points and the GQI map points. To improve and ensure the accuracy of the measured sample points corresponding to the position of the points taken on the map, and for the field measurement points this paper adopts the method of averaging five measuring points in the upper, lower, left, right, and center positions within the 4 m*4 m quadrate. For the GQI value of the inversion map, the averaging method is adopted to collect five measurement points at the upper, lower, left, and right positions and center positions with a 16 m*16 m quadrate. Although the corresponding correlation coefficient of the point values in this paper was as high as 0.9583, the determination of the quadrat size is very random and needs to be further studied and improved.
4.2 Conclusion
The grassland quality evaluation index (GQI) is formed by constructing NDVI and NDRE related to grassland quality and the first principal component of the red-edge Chlorophyll Index obtained by principal component analysis. Then, it is used for the evaluation of the grassland quality in the Xianghai Nature Reserve. Results show that 80% of grasslands in Xianghai Nature Reserve are of medium quality and widely distributed. The mean value of the GQI in the study area was 0.062. Approximately 15% of grasslands had good growth status and were mainly concentrated in the wetland and swamp areas in the central south part of the reserve. There are still scattered patches with very poor grassland quality in the reserve area, where the water supply is insufficient and land degradation is serious (most of which are saline-alkali land and sandy land). The correlation of the evaluation results were verified using the survey field biomass, and the coefficient of the established empirical correlation model was 0.96, which indicated good consistency. The results also indicated that the GQI is an effective indicator of grassland quality growth.
Data availability statement
The datasets presented in this article are not readily available because they are not fully published. Requests to access the datasets should be directed to Zhangyanhong, Z2lzd29ya0AxNjMuY29t.
Author contributions
ZC and YZ designed the paper and completed the manuscript. ZL revised the paper. PZ and WZ contributed to data collection and processing. All authors read and agreed to the published version of the manuscript.
Funding
This research was supported by the Strategic Priority Research Program of the Chinese Academy of Sciences (Grant No. XDA28110503) and the National Key Research and Development China (Project No. 2021YFD1500104-3).
Acknowledgments
First, we would like to thank the Remote Sensing of Chang Guang Satellite Technology Co., Ltd., Changchun, who provided the remote sensing images and conducted the processing workshop. Then, we would like to thank the National Xianghai Nature Reserve Administration, who provided guidance for the sample site investigation. Third, we would like to thank the Wetland Center, Northeast Institute of Geography and Agroecology, and Chinese Academy of Sciences, which provided the identification of wetland plants and types. Last, we would like to thank the editor and the reviewers for their careful work and thoughtful suggestions that have substantially improved this paper.
Conflict of interest
The authors declare that the research was conducted in the absence of any commercial or financial relationships that could be construed as a potential conflict of interest.
Publisher’s note
All claims expressed in this article are solely those of the authors and do not necessarily represent those of their affiliated organizations, or those of the publisher, the editors, and reviewers. Any product that may be evaluated in this article, or claim that may be made by its manufacturer, is not guaranteed or endorsed by the publisher.
References
Amy, E. F., Wang, L., and Chen, J. (2014). Two new hyperspectral indices for comparing vegetation chlorophyll content. Geo-spatial Inf. Sci. 17, 17–25. doi:10.1080/10095020.2014.889264
Baranoski, G. V. G., and Rokne, J. G. (2005). A practical approach for estimating the red edge position of plant leaf reflectance. Int. J. Remote Sens. 26 (3), 503–521. doi:10.1080/01431160512331314029
Chen, C., Li, G., and Peng, J. (2023). Temporal and spatial characteristics of Xinjiang grassland normalized vegetation index and its response to climate change from 1981 to 2018[J/OL]. J. Ecol. 2023 (04), 1–16. AvaliableAt: http://kns.cnki.net/kcms/detail/11.2031.Q.20220908.1607.002.html.
Cho, M. A., Skidmore, A. K., and Atzberger, C. (2008). Towards red-edge positions less sensitive to canopy biophysical parameters for leaf chlorophyll estimation using properties optique spectrales des feuilles (PROSPECT) and scattering by arbitrarily inclined leaves (SAILH) simulated data. Int. J. Remote Sens. 29 (8), 2241–2255. doi:10.1080/01431160701395328
Clevers, J., and Gitelson, A. A. (2013). Remote estimation of crop and grass chlorophyll and nitrogen content using red-edge bands on Sentinel-2 and -3. Int. J. Appl. Earth Observation Geoinformation 23, 344–351. doi:10.1016/j.jag.2012.10.008
Das, P. K., Choudhary, K. K., Laxman, B., Rao, S. K., and Seshasai, M. (2014). A modified linear extrapolation approach towards red edge position detection and stress monitoring of wheat crop using hyperspectral data. Int. J. Remote Sens. 35 (3-4), 1432–1449. doi:10.1080/01431161.2013.877616
Delegido, J., Verrelst, J., Meza, C. M., Rivera, J. P., Alonso, L., and Moreno, J. (2013). A red-edge spectral index for remote sensing estimation of green LAI over agroecosystems. Eur. J. Agron. 46, 42–52. doi:10.1016/j.eja.2012.12.001
Eitel, J., Long, D. S., Gessler, P. E., Hunt, E. R., and Brown, D. J. (2009). Sensitivity of ground-based remote sensing estimates of wheat chlorophyll content to variation in soil reflectance. Soil Sci. Soc. Am. J. 73 (5), 1715–1723. doi:10.2136/sssaj2008.0288
Fang, C. Y., Wang, L., and Xu, H. Q. (2017). Comparison of red edge index of different vegetation in urban grassland health discrimination [J]. J. Geo-Information Sci. 19 (10), 1382–1392. doi:10.3724/SP.J.1047.2017.01382
Hu, X. J., Xu, H. Q., Guo, Y. B., and Zhang, B. B. (2017). [Remote sensing detection of vegetation health status after ecological restoration in soil and water loss region]. J. Appl. Ecol. 1 (28), 250–256. doi:10.13287/j.1001-9332.201701.020
Kanke, R., Solie, S., and Taylor, R. (2012). Red edge as a potential index for detecting differences in plant nitrogen status in winter wheat[J]. J. PLANT Nutr. 35 (10), 1526–1541. doi:10.1080/01904167.2012.689912
Kanke, Y., Dalen, M., and Harrell, D. (2016). Evaluation of red and red-edge reflectance-based vegetation indices for rice biomass and grain yield prediction models in paddy fieldsEvaluation of red and red-edge reflectance-based vegetation indices for rice biomass and grain yield prediction models in paddy fields[J]. Precis. Agric. 17 (5), 507–530. doi:10.1007/s11119-016-9433-1
Li, F., Miao, Y. X., Feng, G. H., Yuan, F., Yue, S., C., Gao, X., W., et al. (2014). Improving estimation of summer maize nitrogen status with red edge-based spectral vegetation indices. Field Crops Res. 157, 111–123. doi:10.1016/j.fcr.2013.12.018
Ma , , and Weiwei, (2015). Research on remote sensing inversion methods for grassland types and their quality parameters [D]. Shanghai: Graduate School of the Chinese Academy of Sciences Shanghai Institute of Technical Physics.
Niemann, K. O., Quinn, G., Stephen, R., Visintini, F., and Parton, D. (2015). Hyperspectral remote sensing of mountain pine beetle with an emphasis on previsual assessment. Can. J. Remote Sens. 41 (3), 191–202. doi:10.1080/07038992.2015.1065707
Qu, Y. Y., Gao, W., Guo, T. Y., and Chen, W. (2010). Migratory waterbirds in yeyahu wetland nature reserve of beijing[J]. Wetl. Sci. 8 (2), 144–150. doi:10.3788/HPLPB20102208.1780
Ramoelo, A., Skidmore, A. K., Cho, M. A., Schlerf, M., Mathieu, R., and Heitk?Nig, I. M. A. (2012). Regional estimation of savanna grass nitrogen using the red-edge band of the spaceborne RapidEye sensor. Int. J. Appl. Earth Observations Geoinformation 19, 151–162. doi:10.1016/j.jag.2012.05.009
Shaokui, G. E., Carruthers, R. I., Kramer, M., Everitt, J. H., and Anderson, G. L. (2011). Multiple-level defoliation assessment with hyperspectral data: Integration of continuum-removed absorptions and red edges. Int. J. Remote Sens. 32 (21), 6407–6422. doi:10.1080/01431161.2010.510492
Shu, M., Gu, X., Sun, L., Zhu, J., and Zhang, L. (2018). High spectral inversion of winter wheat lai based on new vegetation index[J]. Sci. Agric. Sin. 51, 3486–3496. doi:10.3864/j.issn.0578-1752.2018.18.005
Sibanda, M., Mutanga, O., and Rouget, M. (2017). Testing the capabilities of the new WorldView-3 space-borne sensor’s red-edge spectral band in discriminating and mapping complex grassland management treatments. Int. J. Remote Sens. 38 (1-2), 1–22. doi:10.1080/01431161.2016.1259678
Su, W., Hou, N., Li, Q., Zhang, M. Z., Zhao, X. F., and Jiang, K. P. (2018). Inversion of corn canopy leaf area index based on sentinel-2 remote sensing image [J]. Trans. Chin. Soc. Agric. Mach. 49 (1), 151–156. doi:10.6041/j.issn.1000-1298.2018.01.019
Vincini, M., Amaducci, S., and Frazzi, E. (2014). Empirical estimation of leaf chlorophyll density in winter wheat canopies using sentinel-2 spectral resolution. IEEE Trans. Geoscience Remote Sens. 52 (6), 3220–3235. doi:10.1109/TGRS.2013.2271813
Xu, H. Q. (2013). Remote sensing evaluation index of regional ecological environment changes [J]. China Environ. Sci. 33 (5), 889–897. doi:10.3969/j.issn.1000-6923.2013.05.019
Yang, H. F., Li, J. L., Mu, S. J., Yang, Q., Hu, X. X., Jin, G. P., et al. (2012). Research on hyperspectral reflection characteristics of three main grassland vegetation types in xinjiang [J]. J. Grassl. 21 (6), 258–266. doi:10.11686/cyxb20120634
Keywords: grassland quality index (GQI), normalized difference vegetation index (NDVI), red-edge spectrum band, principal component analysis, grassland quality evaluation
Citation: Chen Z, Zhang Y, Zang P, Liu Z and Zhao W (2023) Mapping the grassland quality of the flooded plain based on Jilin-01 images with a red-edge spectral band. Front. Earth Sci. 10:1024680. doi: 10.3389/feart.2022.1024680
Received: 22 August 2022; Accepted: 08 December 2022;
Published: 04 January 2023.
Edited by:
Jun Yang, Northeastern University, ChinaReviewed by:
Shaohua Wang, Aerospace Information Research Institute (CAS), ChinaDongxue Zhao, The University of Queensland, Australia
Copyright © 2023 Chen, Zhang, Zang, Liu and Zhao. This is an open-access article distributed under the terms of the Creative Commons Attribution License (CC BY). The use, distribution or reproduction in other forums is permitted, provided the original author(s) and the copyright owner(s) are credited and that the original publication in this journal is cited, in accordance with accepted academic practice. No use, distribution or reproduction is permitted which does not comply with these terms.
*Correspondence: Yanhong Zhang, Z2lzd29ya0AxNjMuY29t