 Yeonjin Choi1,2
 Seung-Goo Kang1*
 Young Keun Jin1
 Jong Kuk Hong1Sung-Ryul Shin2
 Sookwan Kim3Youngil Choi1
- 1Division of Earth Sciences, Korea Polar Research Institute, Incheon, South Korea
- 2Department of Ocean Energy and Resource Engineering, Korea Maritime and Ocean University, Busan, South Korea
- 3Marine Active Fault Research Unit, Korea Institute of Ocean Science and Technology, Busan, South Korea
A multichannel seismic survey was conducted to investigate the geophysical characteristics of gas hydrates along the western continental margin of the Chukchi Rise around an ARAON mound cluster, which was first recovered in 2016. In the seismic data, gas hydrate-related bottom simulating reflection was widely distributed along the western continental margin of the Chukchi Rise. High-precision seismic P-wave velocity was obtained to investigate the geophysical characteristics of the gas hydrate structures in the BSR areas. Iterative migration velocity analysis was used to construct a detailed P-wave velocity model from the acquired seismic data. The gas hydrate and free gas layers have abnormally high- and low-seismic P-wave velocities; the precise velocity model allows us to understand the detailed spatial distribution of gas hydrate and free gas structures. The effective medium theory model enables estimations of the gas hydrate saturation from constructed seismic P-wave velocity model. We propose the P-wave velocity and gas hydrate saturation models from acquired multichannel seismic data in the western continental margin of the Chukchi Rise for the first time.
1 Introduction
Gas hydrates are ice-like crystalline solids composed of natural gas and water molecules under low-temperature and high-pressure conditions, which are known as the gas hydrate stability zone (GHSZ) (Kvenvolden, 1988; Sloan and Koh, 2008). Since gas hydrates were first discovered in the 1970’s, they have attracted attention as a potential energy source, a geological hazard, and a scientific issue related to climate change It has been reported that gas hydrates are distributed in the marine settings on the continental shelf and continental slope areas, which satisfy the gas hydrate stability conditions. In the Arctic regions, it is known that permafrost is closely related to the formation and distribution of gas hydrates. During the Pleistocene, cold temperature conditions were maintained beneath the Arctic permafrost region, and many gas hydrates were formed in this period (Collett et al., 2011). Nowadays, the relic gas hydrates remain under the Arctic permafrost regions (Kvenvolden, 1988; Kvenvolden et al., 1993; Kvenvolden, 1994; Collett et al., 2011; Ruppel, 2014; Chadburn et al., 2017; Kang et al., 2021b).
Geophysical techniques have been used to confirm the occurrence of gas hydrates, including well-logging analysis, seismic surveys, electromagnetic surveys, multibeam echo sounders, sub-bottom profilers, and side scan sonar (Sloan and Koh, 2008; Osadetz and Chen, 2010; Riedel et al., 2010; Tóth et al., 2014; Lu et al., 2017; Ruppel and Kessler, 2017; Singhroha et al., 2019; Kang et al., 2021a; Choi et al., 2021; Monteleone et al., 2022). Among these techniques, seismic surveys are widely used to confirm the occurrence of gas hydrates because the presence of gas hydrates brings about bottom simulating reflections (BSRs) in seismic data (Shipley and Houston, 1979; Yoo et al., 2013; Lu et al., 2017). BSRs are located in the seismic section at the base of the GHSZ, where the physical interface between gas hydrate-bearing sediments and free gas-saturated sediments has different seismic velocities and densities. A BSR has a reverse polarity reflector with high amplitude and shows a parallel trend to the seafloor topography (Yoo et al., 2013; Lu et al., 2017). However, a BSR may not appear in seismic data if there is an absence of free gas beneath the gas hydrate-bearing sediments or the seismic velocity of the sediment layer is higher than that of the gas hydrate-bearing sediments. The negative reflection coefficient of BSRs in seismic data is occurred due to a contrast between the upper high-velocity anomalies of gas hydrates and the lower low-velocity anomalies of the free gas layer. The seismic velocity is increased where gas hydrates exist in the pore space of the sediments because the seismic velocity of the pure gas hydrate is generally higher than that of the water-filled sediments. Conversely, the seismic velocity of the free gas-saturated sediments is decreased. Thus, the seismic velocity anomalies can be considered evidence of the presence of gas hydrates and free gas. The size of the anomalies in the velocity models is proportional to the volume of gas hydrates and free gas contained within the pore space. As a result, the velocity anomaly provides quantitative information regarding the gas hydrate and free gas saturation in the pore space of the sediments (Ecker et al., 2000; Riedel et al., 2010).
In the Arctic region, subsea permafrost-related gas hydrates are distributed at shallow water depths because the Arctic permafrost possesses temperature and pressure conditions in which gas hydrates can form in a relatively shallow continental shelf (Collett et al., 2011). Alaska/US and the Beaufort Sea continental shelf/Canada are regions where permafrost-related gas hydrates have been discovered (Dallimore et al., 2002; Carcione and Gei, 2004; Osadetz and Chen, 2010; Majorowicz et al., 2012; Riedel et al., 2017). The East Siberian Arctic Shelf is reportedly an area where a methane eruption was actively caused by permafrost and gas hydrate dissociation (Shakhova et al., 2010; Shakhova et al., 2017; Shakhova et al., 2019). Many studies have been conducted in this area, with a focus on the interaction between permafrost and gas hydrate dissociation, changes in the seabed environment, and the relationship to climate change (Shakhova et al., 2010; Shakhova et al., 2015; Shakhova et al., 2017). Additionally, various gas hydrate-bearing venting structures on the seafloor, such as gas flares, Pingo, and mud volcanoes, were observed in the Vestnesa Ridge in northwest Svalbard (Hustoft et al., 2009). In this area, gas hydrate-related studies are being conducted using state-of-the-art geophysical exploration technology (Hustoft et al., 2009; Singhroha et al., 2019). The seismic velocity and saturation models of the Vestnesa Ridge were proposed based on seismic data analysis. The distribution of gas hydrates, which were controlled by the topography and faults, was presented for the Vestnesa Ridge (Singhroha et al., 2019). However, the Chukchi Sea and East Siberian Sea regions remain unknown; no published gas hydrate-related research or information is available.
The Korea Polar Research Institute (KOPRI) has conducted geological and geophysical explorations in the East Siberian and Chukchi Seas continental margin regions to study changes in the Arctic seafloor environment and seafloor resources with the icebreaker research vessel ARAON in 2016 and 2018 (Jin and Party, 2017, 2018; Kim et al., 2020a; Kim et al., 2020b). In the first research cruise in 2016, mound morphologies were discovered in the western continental margin of the Chukchi Rise, and gas hydrate samples were obtained through gravity coring (Jin and Party, 2017). In the second cruise in 2018, intensive gas hydrate explorations, including sparker single channel seismic surveys, were conducted in the surrounding area of the mound structures (Jin and Party, 2018). As a result, a total of eight mound morphologies (ARAON mound) were discovered in the survey area, and the gas hydrate samples were obtained from two different mound morphologies. Additionally, the seismic data on 15 lateral lines were obtained, and heat flow and CTD (conductivity, temperature, and depth) profiles were acquired from five stations over the Chukchi Rise continental shelf area down to the continental margin. The single channel sparker seismic data showed that high-amplitude reflections with reversed polarity were widely distributed from the clustered mounds toward the continental margin and under the seafloor (Kang et al., 2021a). The depth of the lower boundary of the GHSZ was calculated using the geothermal gradient and seafloor water temperature measurements obtained during the exploration and then compared with the depth at which strong reflective structures with reversed polarity have appeared in seismic images (Dickens and Quinby-Hunt, 1994; Miles, 1995; Andreassen et al., 2006). Gas hydrate-related BSRs were considered if the depth of the strong reflective structure with reversed polarity in the cross-section was the same as the calculated depth of the lower boundary of the GHSZ (Dickens and Quinby-Hunt, 1994; Miles, 1995; Andreassen et al., 2006). This case is the first in which geophysical evidence and distribution information have been presented regarding the occurrence of gas hydrates along the western continental margin of the Chukchi Rise (Kang et al., 2021a).
A multichannel seismic survey (MCS) was conducted during the third expedition in 2019 to investigate the geophysical characteristics of gas hydrates along the western continental margin of the Chukchi Rise around the ARAON mound cluster. In the MCS data, gas hydrate-related BSRs were widely distributed along the western continental margin of the Chukchi Rise. The acquired MCS data were applied to the iterative migration velocity analysis (IMVA) method to construct seismic P-wave velocity models to investigate the geophysical characteristics of the gas hydrate structures. By applying the IMVA method, we present the geophysical model of the gas hydrate and free gas in the western continental margin of the Chukchi Rise. The seismic velocity model recovered the high-velocity and low-velocity structures near a BSR. These velocity anomalies provide strong evidence that gas hydrates and free gas exist within the pore space of the sediments. Additionally, we employed the effective medium theory (EMT) in the seismic velocity model to derive the gas hydrate and free gas saturation model. In this model, the spatial distribution and characteristics of the gas hydrates and free gas are well represented. As a result of this study, we presented several geophysical evidence of the presence of gas hydrate in the western continental margin of the Chukchi rise.
2 Geological setting
Chukchi Rise is the southern part of the Chukchi Plateau, and the northern part of the Chukchi Rise is the Chukchi Cap of the Chukchi Plateau. On the southern side, the Chukchi Rise is directly connected to the Siberian-Chukchi continental shelf, and it is connected to the Chukchi Basin to the west, as shown in Figure 1A. The average depth of the Chukchi Rise is 0.2 km, and it has a relatively flat top (Kim et al., 2021). The study area is the western continental margin of the Chukchi Rise (black box in Figure 1B), where the water depth ranges from 0.5 km (shelf break) to 2.5 km (Chukchi Basin). In the center of the study area, a triangular-shaped highland, named the western spur, protrudes 20 km toward the Chukchi Basin (Kim et al., 2021). Hegewald and Jokat (2013) interpreted the seismic section obtained from the Chukchi Rise to the Chukchi Basin and classified three stratigraphic horizons (Base Tertiary, Top Oligocene, and Top Miocene). The average thickness of the sedimentary layer of the Chukchi Rise is 0.6 km, and it was confirmed that many normal faults have developed from the acoustic basement to the seafloor. Additionally, the average velocity of the upper sedimentary layer of the acoustic basement was suggested to be 2.3 km/s based on sonar buoy data (Hegewald and Jokat, 2013). The other study was suggested that the P-wave velocity of the upper sedimentary layer of the Chukchi Plateaus was 1.7 km/s and the P-wave velocity of the lower sedimentary layer was 3.8–4.0 km/s using the wide-angle multichannel seismic reflection survey (Kashubin et al., 2018).
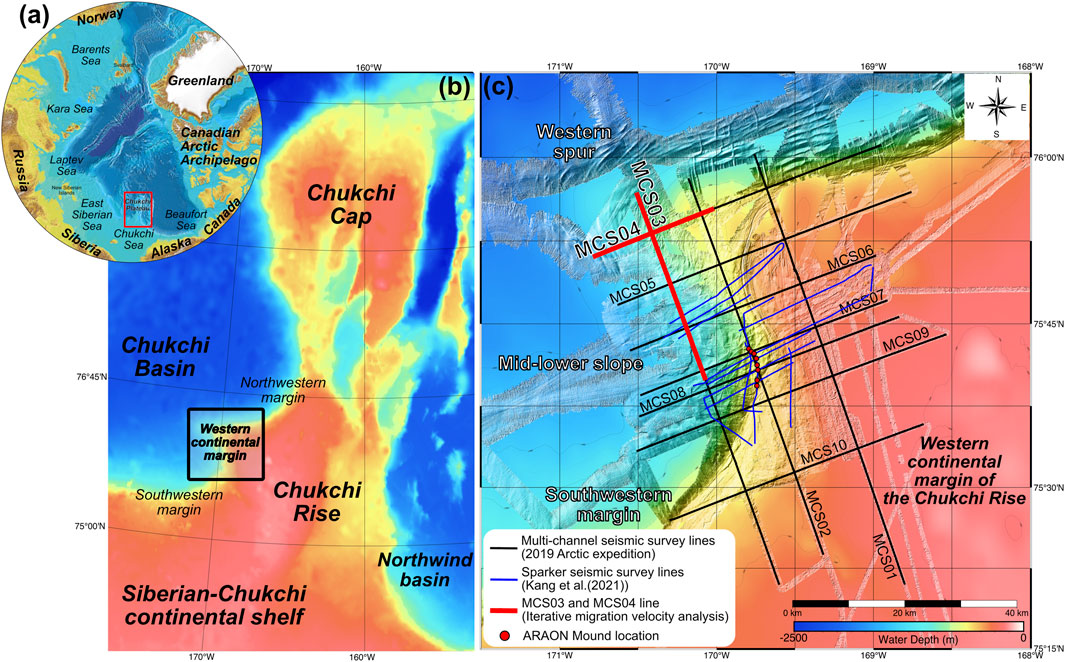
FIGURE 1. Map of the study area. (A) Bathymetric map of the Arctic Ocean. (B) is the map of the Chukchi Plateau, and the study area is located on the western continental margin of the Chukchi Rise (black box). (C) Map of the seismic track lines in the 2018 and 2019 Arctic expeditions.
3 Data
The MCS data acquired in 2019 were used to identify the geophysical characteristics of the gas hydrates in the western continental margin of the Chukchi Rise (Jin and Party, 2019). The seismic source comprised two GI-gun with a total volume of 710 cubic inches, and the receiver comprised a 120-channel solid-type streamer. The shot and group spacings were 25.0 m and 12.5 m, respectively. The recording time was 7.0 s, and the sampling interval was 0.001 s. Figure 1C shows the map of survey tracks for the MCS data. Our survey area is the western continental margin of the Chukchi Rise, as shown in the black box in Figure 1B. Ten survey lines (marked with the solid black lines in Figure 1C) were acquired around the ARAON mound cluster area (marked with the red circles in Figure 1C), where the gas hydrate samples were recovered by gravity coring in 2016 and 2018 (Jin and Party, 2017, 2018). The total length of the seismic survey tracks was 617.49 km.
Figure 2 shows the seismic shot gathers extracted from the MCS03 line containing the BSR. The seafloor reflections appeared at 1.3–1.6 s (blue dashed line), and polarity-reversed reflections (red dashed line), which are assumed to be a BSR, can be found below the seafloor reflection in the presented seismic shot-gathers.
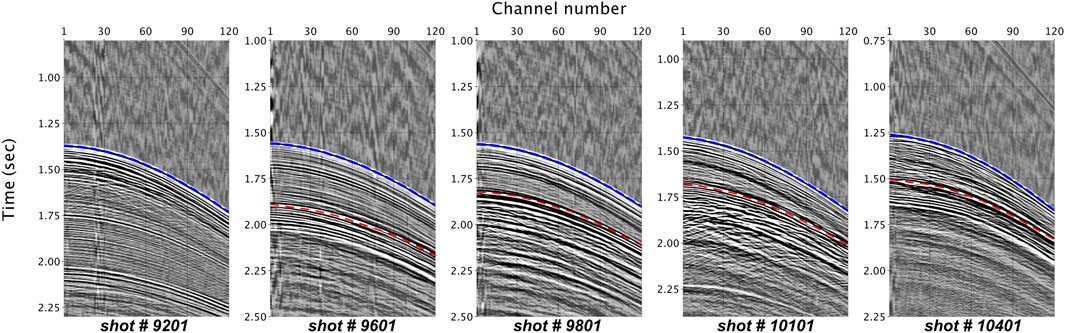
FIGURE 2. Raw shot-gathers on MCS03 lines. The blue dashed line is marked on the seafloor reflections, and the red dashed line is marked on the polarity-reversed reflections.
In this study, we select two seismic tracks (MCS03 and MCS04, marked with the solid-red lines in Figure 1C) to construct the precise seismic P-wave velocity model by IMVA and estimate the gas hydrate and saturation model.
4 Materials and methods
4.1 Data processing and iterative migration velocity analysis
Seismic data processing, including the iterative migration velocity analysis (IMVA), was performed on the raw seismic data obtained from the above-mentioned geophysical survey. First, the raw seismic data was needed to check the survey geometry and add missing information or corrections (Yilmaz, 2001). Additionally, the seismic data applied several data processing algorithms in the prestack step, such as the Butterworth low-frequency filtering, static correction, spherical divergence correction, and deconvolution techniques, to improve the data quality, certainty, and signal-to-noise (S/N) ratio. After the prestack data processing step, the seismic data (preprocessed and CMP sorted) were applied to the first velocity analysis to generate the initial seismic velocity model for the next IMVA step and multiple attenuations.
We used the IMVA method to construct an accurate P-wave velocity model to confirm the spatial distribution of the gas hydrate and estimate the gas hydrate saturation. The IMVA method was operated by the Iterative Velocity Analysis module in the Omega2 seismic data processing platform by Schlumberger. Figure 3 illustrates the detailed IMVA workflow. The first step of the IMVA is a Kirchhoff migration for preprocessed seismic data (CMP sorted) based on an initial seismic P-wave velocity model. The migrated seismic data were applied to the inverse NMO procedure to generate a semblance panel for the migration velocity analysis. The velocity model was constructed by migration velocity analysis for the first iteration. Then it was used for the initial velocity of the Kirchhoff migration in the second iteration of the IMVA.
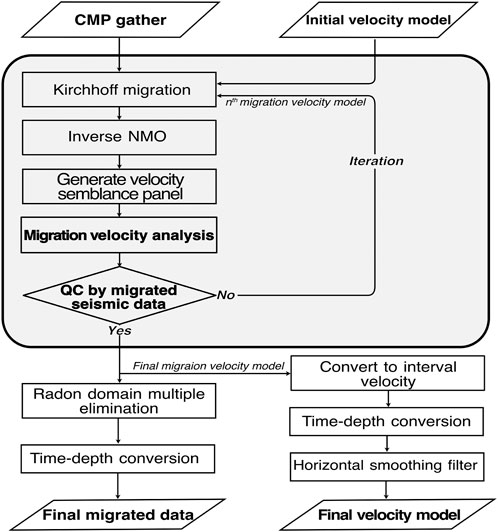
FIGURE 3. Detailed workflow of the iterative migration velocity analysis to construct the seismic velocity model.
The final migration velocity model constructed from sufficient iterative steps was evaluated by a quality control procedure based on analysis of the NMO correlated gathers and migrated seismic data. The iteration number of the IMVA is five for each seismic track. The P-wave velocity model from IMVA, constructed in the last iteration step, was used to build the final migrate seismic image. The final velocity model was converted from RMS to interval velocity using Dix’s equation. Then, time-to-depth conversion was applied to confirm the spatial distribution of gas hydrates at each depth in the survey area. In Figure 4, we present the seismic semblance panels for IMVA with NMOed seismic data. Figure 4A shows the seismic semblance panel and NMOed seismic data for the survey area without BSR, which is the typical subsea sediment environment. Figure 4B illustrates the seismic panel and NMOed seismic data for the survey area with a BSR, where free gas and gas hydrates exist. In the seismic semblance panels, the solid black line represents the RMS velocity profile, and the solid white line represents the estimated interval velocity profile. Generally, the seismic velocity of gas hydrates is higher than that of water-filled sediment. Therefore, the seismic velocity profile on the seismic panel shows a trend of a rapid increase in the hydrate layer compared to the typical sediment layer. A free gas layer exists below the gas hydrate layer, and the seismic velocity in the free gas layer shows a rapidly decreasing trend because the seismic velocity of free gas is very slow. The estimated interval (P-wave) velocity for the seafloor is 1.45 km/s; the gas hydrate layer velocity is 1.8 km/s, and that of free gas is 0.8 km/s.
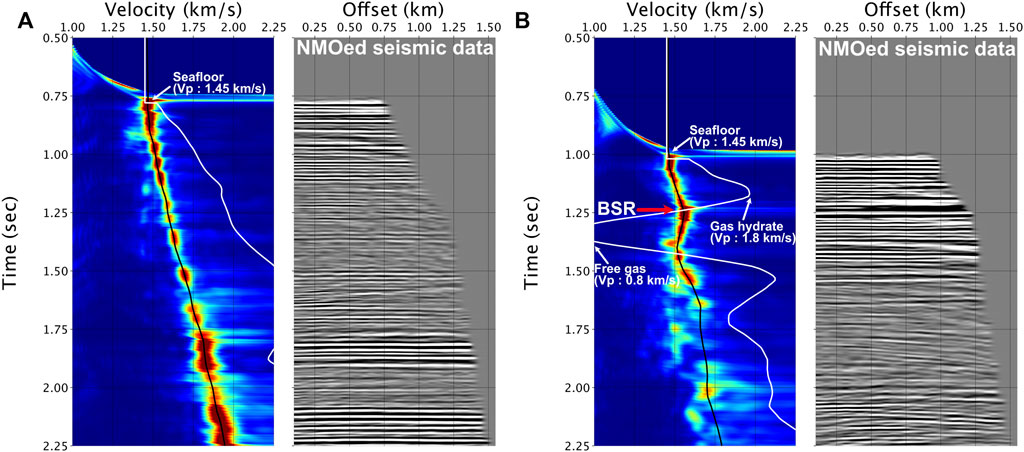
FIGURE 4. Velocity semblance panel (left) and NMO-corrected seismic data (right) for the iterative migration velocity analysis. (A) is the area without a BSR, and (B) is the area with a BSR.
The accuracy and resolution of the velocity model derived from a semblance-based velocity analysis are affected by several factors, including the streamer length, stacking fold, signal-to-noise ratio, and the main frequencies (Yilmaz, 2001). Assuming that the velocity analysis error in this study is approximately ±15 m/s of the RMS velocity based on the width of the velocity semblance spectrum. This RMS velocity error causes an error of 0.15 km/s in the interval velocity, which implies an inaccuracy of up to 10%, assuming a sediment velocity of around 1.5 km/s (Hajnal and Sereda, 1981; Tóth et al., 2014). Considering that an acceptable RMS velocity error is 2%–10% in general (Yilmaz, 2001), this study’s velocity errors are considered reliable.
4.2 Estimation of the gas hydrate saturation
In a rock physics model, there is a quantitative relationship theory between the elastic properties (P-wave velocity, S-wave velocity, density) and physical properties (porosity, clay volume, lithology, fluid material within the pore, and fluid saturation) of the rock. This method is mostly used in oil and gas reservoir characterization for petrophysical analysis. Nevertheless, many rock physics models, such as the weighted equation, three-phase biot equation, EMT, and SCA-DEM model, have been used to quantify gas hydrate resources (Lee et al., 1996; Jakobsen et al., 2000; Lee, 2002; Chand et al., 2004). In this paper, we applied the EMT model to estimate the gas hydrates saturation from a seismic velocity model. The EMT model is a theoretical or numerical theory used to analyze the properties of an effective medium composed of several constituent materials. The EMT model was proposed by Dvorkin et al. (1999); it is assumed to be the unconsolidated marine sediments with high porosity (0.36–0.4). In addition, Ecker et al. (2000) estimated the gas hydrate saturation by applying the EMT model to the gas hydrate-rich sedimentary layer for the first time. Also, several additional cases have been reported that used the EMT model to verify the gas hydrate saturation in various regions (Ghosh et al., 2010; Chhun et al., 2018; Pan et al., 2019). In this method, the elastic modulus of the gas hydrate-bearing sediments is related to mineralogy, effective pressure, porosity, and characteristics of the fluid material within the pore space.
4.2.1 Effective medium theory model of water-filled sediments without gas hydrates
In water-filled sediments, the bulk and shear moduli of the dry frame of sediments are expressed by the Hashin-Shtrikman-Hertz‒Mindlin theory as follows:
1)
2)
where
where
where
where
where
4.2.2 Contact model
Ecker et al. (2000) introduced two different types of EMT models based on the sediment abundance type of gas hydrates. The contact model represents the gas hydrates that are in contact with or surrounding the mineral grains; thus, the gas hydrates are part of the solid phase. Therefore, the reduced porosity is obtained as follows:
where
where
4.2.3 Noncontact model
The other model introduced by Ecker et al. (2000) is the noncontact model, in which gas hydrates are floating in the pore-filling material. Therefore, gas hydrates are not in contact with the mineral grains, so they do not affect the solid phase. Hence, the bulk and shear moduli of the solid phase are not changed, and only the bulk modulus of the fluid phase is modified as follows:
The modified bulk modulus of the fluid phase is replaced by
Finally, the P-wave (
Figure 5 illustrates the workflow used to estimate the gas hydrate saturation. This workflow is based on the methods described in Ghosh et al. (2010). The seismic velocity model from IMVA and the physical properties of sediment were used as input parameters in this workflow. The physical properties of sediments include the volume ratio, the elastic modulus of the minerals within the sediment, and the elastic modulus of the water, gas hydrates, and free gas. Table 1 shows the values of the elastic modulus in this study. Due to the absence of physical property information for the sediments in this area, the bulk and shear moduli of the sediments were computed using constituent mineral information from the southern margin of the Siberian-Chukchi shelf, as investigated by Kolesnik et al. (2019).
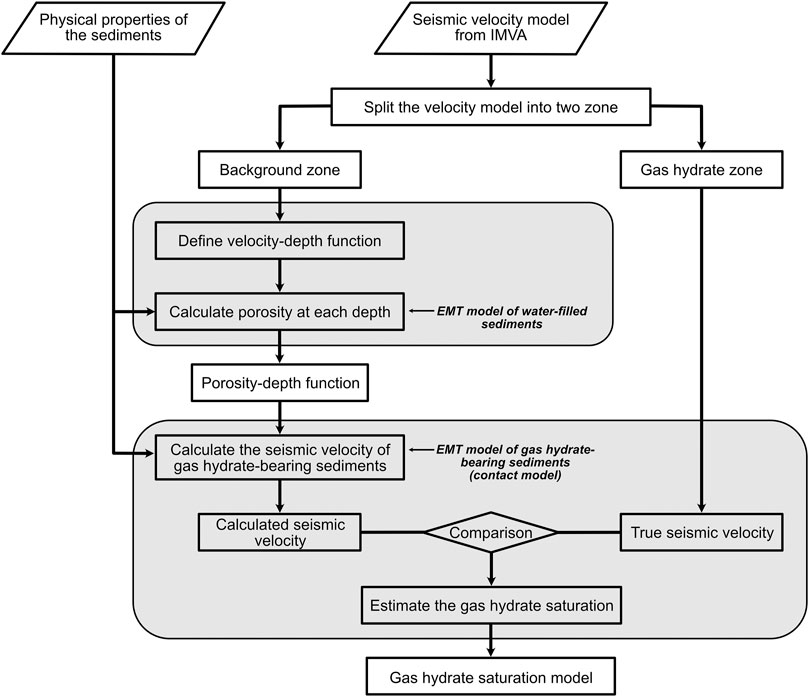
FIGURE 5. Detailed workflow to estimate the gas hydrate saturation model using the EMT model.
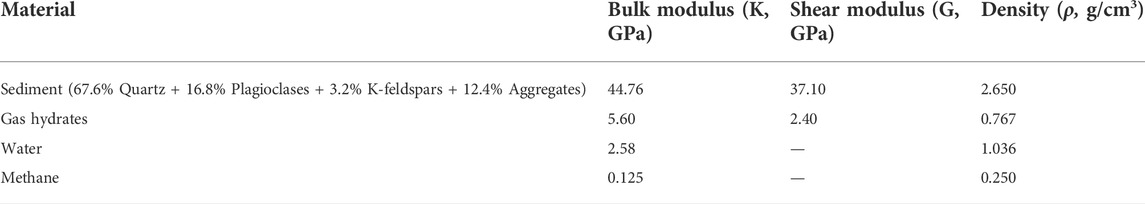
TABLE 1. Elastic modulus and density of sediment.
The seismic velocity model from IMVA was split into two zones: the background zone and the gas hydrate zone. The background zone means the water-filled sediment, in which pore space is filled with water without gas hydrate and free gas. The gas hydrate zone is the area where gas hydrates are present. In this study, the background zone for estimating the gas hydrate saturation in the EMT model was determined to be along the MCS03 line between CMP#6501 and CMP#7000 (Figure 6), and the gas hydrate zone was selected as the area where a BSR exists (Figures 6, 7)This workflow was started to define the velocity-depth function using linear regression from the velocity profile extracted from the background zone. Then, the porosity‒depth function was calculated from the velocity-depth function using the EMT model of the water-filled sediments Eqs. 1–13. In this step, several assumptions were included. First, the background zone is fully saturated water within the pore space. Second, the mineralogical properties were similar throughout the study area. The porosity‒depth function derived from the background zone is also used for the gas hydrate zone in this assumption.
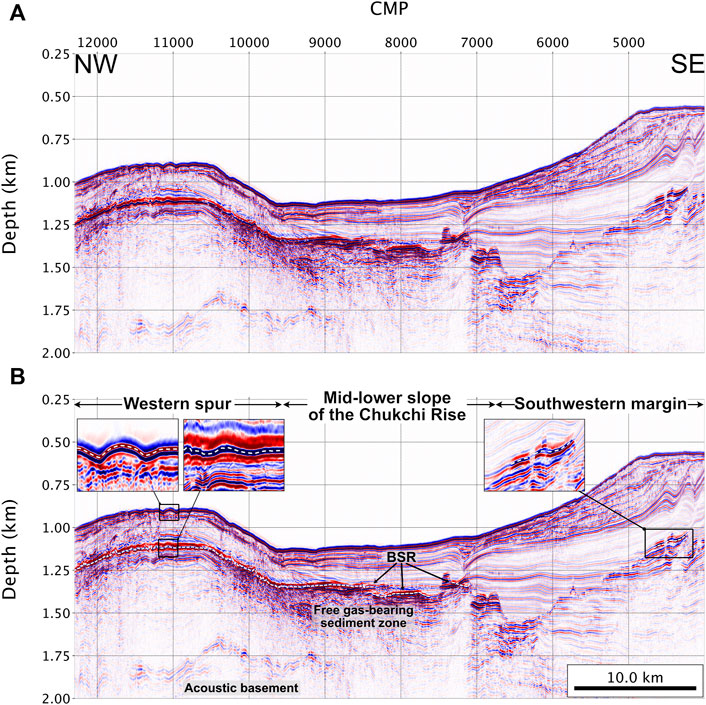
FIGURE 6. (A) Uninterpreted and (B) interpreted migrated seismic images obtained from the MCS03 line.
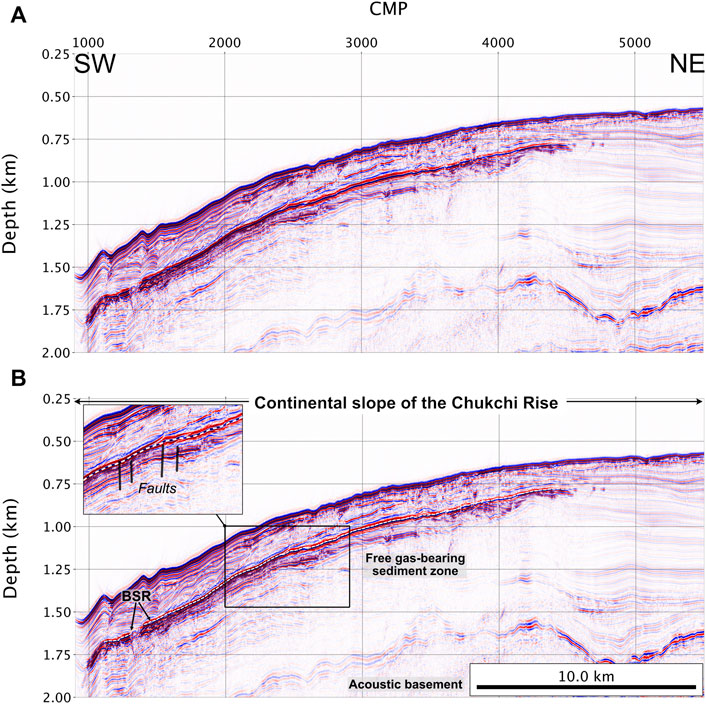
FIGURE 7. (A) Uninterpreted and (B) interpreted migrated seismic images obtained from the MCS04 line.
In the second step, shown in the red box in Figure 5, we calculated the seismic velocity of the gas hydrate-bearing sediments using the EMT model of gas hydrate-bearing sediments, which is the contact model (Eqs 14–16). The precalculated porosity‒depth function and the physical properties of sediments were used as input parameters. Then, the gas hydrate saturation model can be constructed by comparing the calculated seismic velocity with the true velocity extracted from the gas hydrate zone. The free gas saturation can be estimated using the same method; however, the noncontact model (Eq. 17) is applied instead of the contact model.
4.3 Quantified error analysis related to the estimation of gas hydrate saturation by the effective medium theory model
This study used the EMT model to estimate the gas hydrate and free gas saturation from seismic velocity. This method only used seismic P-wave velocity and assumed that the other factors were the same in all areas. Therefore, we will obtain inaccurate results when we use the incorrect velocity to estimate the gas hydrate saturation. Therefore, the incorrect velocity caused inaccuracy in the estimated gas hydrate saturation.
The quantitative error analysis was conducted using the numerical test using a simple 4-layer velocity model comprised of a sediments layer near the seafloor, gas hydrate, free gas, and an acoustic basement, as shown in Figure 8. Figure 8A shows the 4-layer velocity profiles for the numerical test. The solid black line represents the true velocity profile, whereas the dashed line represents the incorrect velocity profile when+/-10% velocity errors occur. The Red dashed line shows a 10% higher velocity profile than the true velocity, while the blue dashed line shows a 10% lower velocity profile than the true velocity. Figure 8B demonstrates the porosity profile derived when+/-10% velocity errors occur. As a result, the error in porosity was 20% caused by the+/-10% inaccurate velocity. Figures 8C,D represent the estimated gas hydrate and free gas saturation profile when+/-10% velocity errors occur. The inaccuracy of the results was 9% for gas hydrate saturation and 20%–26% for free gas saturation, respectively. We note that when an erroneous velocity is used, the EMT model’s estimated gas hydrate and free gas saturations are inaccurate, and the result of free gas saturation is more sensitive to inaccurate velocity than the result of the gas hydrate saturation.
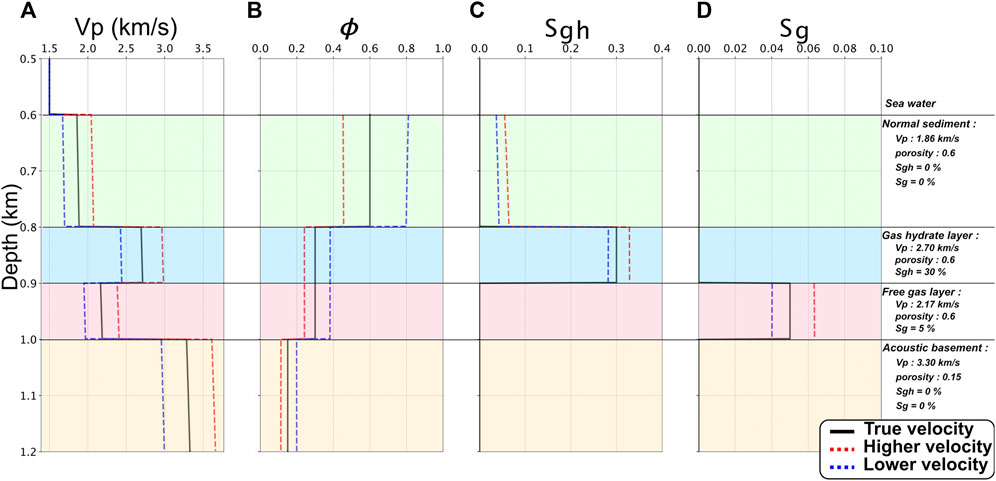
FIGURE 8. The results of the quantified error analysis (A) 4-layer velocity profiles (B) calculated porosity-depth profiles (C) estimated gas hydrate saturation profiles, and (D) estimated free gas saturation profiles. The black solid line is the true velocity. The dashed line is the 10% higher (red) and 10% lower (blue) velocity than the true velocity.
In our IMVA methods, we determined that the velocity model contained a maximum of 10% of the inaccuracy of the interval velocity (see Section 4.1). Therefore, according to the quantified error analysis, saturation models can expect an inaccuracy of 9% for gas hydrate saturation and 20%–26% for free gas saturation, respectively.
5 Results
5.1 Final migrated seismic images
To identify the geophysical characteristics of the gas hydrate along the western continental margin of the Chukchi Rise, we applied seismic data processing, including static and spherical divergence correction, noise attenuation, deconvolution, IMVA, and migration. As a result, an interpretable P-wave velocity model and final seismic section (migrated), which confirm the geological structures below the seafloor, were successfully constructed from the acquired multichannel seismic data. The migrated seismic images for seismic tracks MCS03 and MCS04, as shown in Figures 6, 7, present the information on the sediment and subsea geological structures and BSR, which is parallel to the seafloor with a reversed polarity, strong amplitude, and cross-cutting of the strata.
Figure 6 shows the migrated seismic image for the MCS03 line, which was obtained from the southwestern margin to the western spur through the mid-lower slope of the western continental margin of the Chukchi Rise. Figure 6A is the final migrated seismic image of the MCS03 line, and Figure 6B is the same as the final migrated seismic image of the MCS03 line, including the descriptions and interpretations related to gas hydrates and free gas. The migrated seismic image describes the typical continuous BSR between CMP#7150 and CMP#12300 (Shedd et al., 2012). The length of the continuous BSR is 32.18 km horizontally, and the depth is 1.3 km at the mid-lower slope of the western continental margin of the Chukchi Rise and 1.1 km at the western spur. The high-amplitude dipping reflection is shown beneath the BSR (Figure 6B). Similar to several previous studies, our results also imply that free gas exists in the pore space of the sediments (White, 1979; Lin et al., 2009; Yoo et al., 2013). At the southwestern margin, a continuous BSR was not present, but it showed a partial high-amplitude reflection on the migrated seismic images, which can be considered to be a gas-charged layer (Figure 6B).
Figure 7 shows the migrated seismic image for the MCS04 line, which was acquired along the continental slope of the western spur. Figure 7A is the final migrated seismic image of the MCS04 line, and Figure 7B is the same as the final migrated seismic image of the MCS04 line, including the descriptions and interpretations related to gas hydrates and free gas. The CMP#2800 on the MCS04 line intersects the CMP#11050 on the MCS03, and the two migrated seismic images represent a similar BSR characterization. Similar to the results of Shedd et al. (2012), the MCS04 migration images revealed a well-developed, continuous BSR along the slope of the western spur. The length of the continuous BSR is 21.25 km, and it extends from the shallow part of the western spur to the deeper part. The shallowest water depth that appeared in the BSR is 0.6 km, and the BSR depth is 0.78 km (Figure 7B). The deepest water depth that appeared in the BSR is 1.25 km. Several faults developed from CMP#2000 to CMP#3000, which are expected to play a key role in the methane migration pathway.
The gas hydrate-related BSR at the western continental margin of the Chukchi Rise was confirmed by migrated seismic images. Our results imply that gas hydrates are widely distributed throughout the study area because gas hydrate-related BSR considers the geophysical evidence of the presence of the gas hydrate.
5.2 P-wave velocity models constructed by the iterative migration velocity analysis method
We used the IMVA method to construct an interpretable P-wave velocity model from the seismic data. A constructed P-wave velocity model was used to understand the spatial distribution of the gas hydrate and free gas layers near the BSR in each survey area. The P-wave velocity models of the MCS03 and MCS04 lines are presented with the velocity contours in Figures 9, 10, respectively. The P-wave velocity models constructed by the IMVA method contain high-velocity anomalies (1.9–2.5 km/s) above the BSR and low-velocity anomalies (1.0–1.5 km/s) below the BSR.
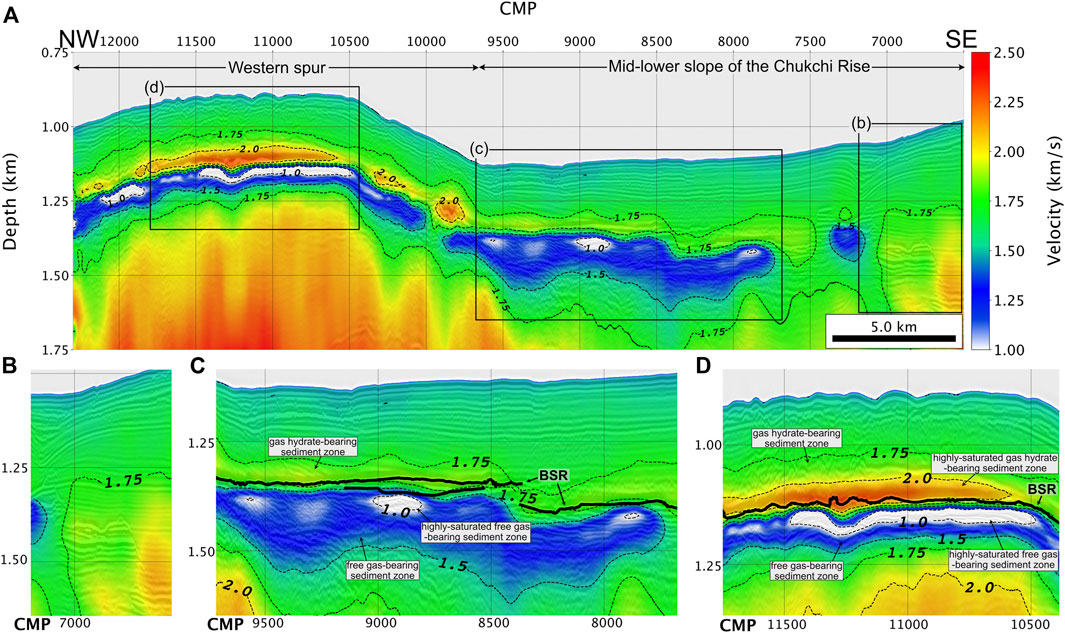
FIGURE 9. (A) Constructed P-wave velocity model overlaid with migrated seismic images using the IMVA of the MCS03 line. The analysis range is marked on the solid red line in Figure 1C. (B)–(D) is the enlarged velocity model: (B) absence area of the gas hydrate, (C) mid-lower slope of the western continental margin, and (D) crest of the western spur area.
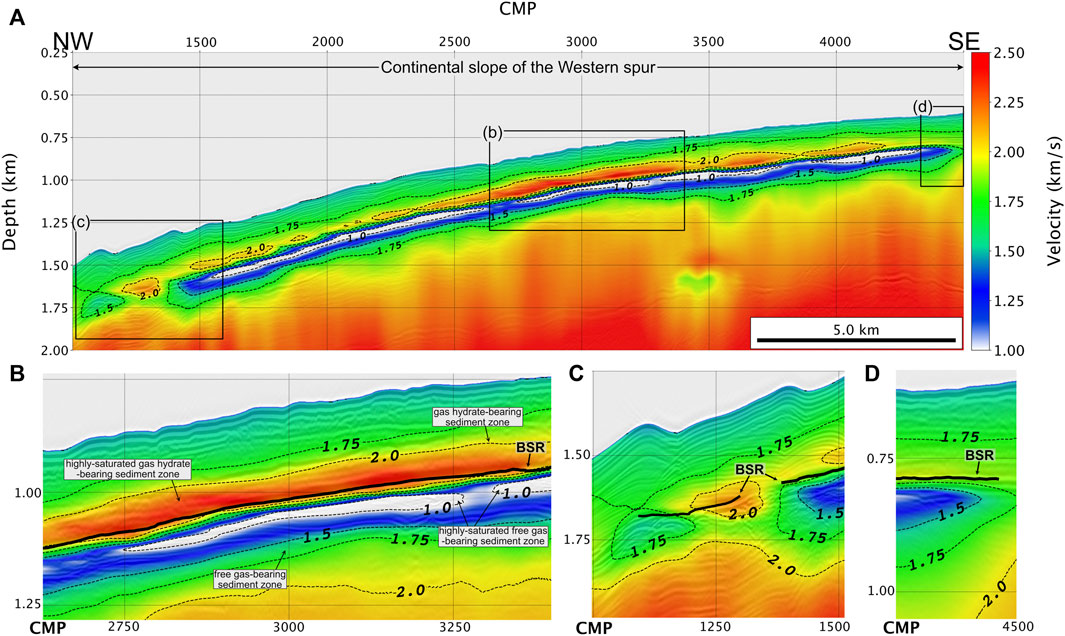
FIGURE 10. (A) Constructed P-wave velocity model overlaid with migrated seismic images using the IMVA of the MCS04 line. The analysis range is marked on the solid red line in Figure 1C. (B)–(D) Enlarged velocity model: (B) continental slope of the western spur, (C) deepest area showing the BSR of the western spur, and (D) shallower area showing the BSR of the western spur.
Figure 9 presents the images overlaid on the seismic velocity model with the migrated seismic images for the MCS03 lines. Figure 9A is the seismic velocity model for the entire MCS03 line. The velocity model between CMP#6500 and CMP#7200 is considered a background velocity zone, where the BSR did not appear. This background velocity zone shows the linear trend of increasing velocity with respect to depth without any velocity anomalies (Figure 9B). Between the CMP#7700 and CMP#9950 areas in the velocity model (Figure 9C), which contains the continuous BSR in the migrated seismic images, high- and low-velocity zones were constructed near the BSR. The area between CMP#10450 and CMP#11775 in the velocity model also contains the continuous BSR with the high- and low-velocity zones, as shown in Figure 9D.
The low-velocity anomaly suggests the presence of free gas. In the P-wave velocity model between CMP#7700 and CMP#9950, a thick low-velocity zone was identified in the mid-lower slope, as shown in Figure 9C. The low-velocity zone has a width of 12.5 km, a maximum thickness of 0.25 km, and a velocity range of 1.0–1.5 km/s. In the P-wave velocity model between CMP#8800 and CMP#9000, the lowest velocity below 1.0 km/s was observed, shown in Figure 9D. We note that the highly saturated free gas-bearing sediments exist along the crest of the western spur.
The high-velocity anomalies with a velocity range of 1.7–1.8 km/s, indicating a gas hydrate-bearing sediment zone, appeared above the BSR in the western spur (Figure 9D). The velocity anomalies in the western spur area are more noticeable than those in the mid-lower slope. The highest velocity (>2.0 km/s) and lowest velocity (<1.0 km/s) in this model are distributed on the ridge of the western spur. Notably, the western spur contains more gas hydrates and free gas than the mid-lower slope. On the other hand, the thickness of the low-velocity zone in the western spur is 0.05 km, confirming that the mid-lower slope has a thicker low-velocity zone than the western spur.
Figure 10 presents the images overlaid on the P-wave velocity model with the migrated seismic images for the MCS04 lines. Figure 10A shows the entire P-wave velocity model, which covers the slope side of the western spur, with 0.7–1.5 km of water depth. High-velocity anomalies (velocity ranges are 1.75–2.25 km/s) were discovered above the BSR. The highest velocity structures (P-wave velocity over 2.25 km/s) are distributed between CMP#2650 and CMP#3400, as shown in Figure 10B. Low-velocity anomalies (P-wave velocity ranges 0.5–1.75 km/s) were discovered from CMP#1450 to CMP#4450 beneath the BSR. The thickness of this low-velocity structure averages 0.125 km.
In our P-wave velocity model obtained by the IMVA method, the high-and low-velocity anomalies caused by gas hydrate and free gas are well represented. Because the velocity anomalies suggest the presence of gas hydrate and free gas within the pore space of the sediments, these results provide additional evidence that gas hydrate exists in the study area.
5.3 Gas hydrate saturation estimated by the Effective medium theory model
We used the EMT model to construct gas hydrate saturation models from the seismic P-wave velocity model of the MCS03 and MCS04 lines. The gas hydrate saturation model is used to understand the geophysical characteristics and indirectly estimate the total amount of subsurface gas hydrates in the study area. The gas hydrate saturation model is presented with the saturation contours in Figures 11, 12.
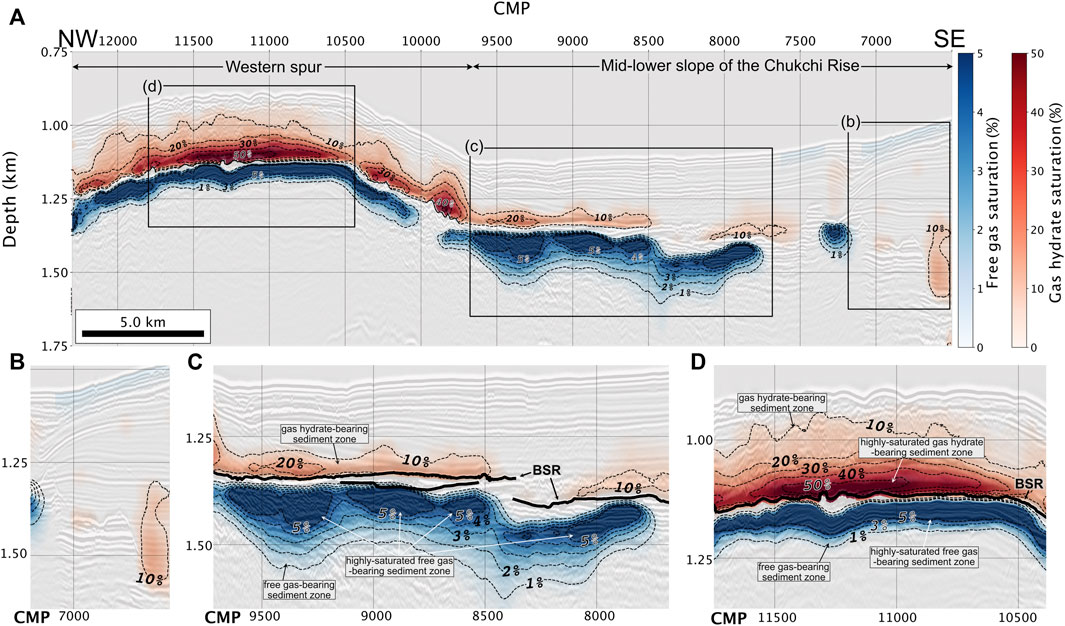
FIGURE 11. (A) Estimated gas hydrate and free gas saturation model overlaid with migrated seismic images using the IMVA of the MCS03 line. The analysis range is marked on the solid red line in Figure 1C. (B)–(D) is the enlarged velocity model: (B) absence area of the gas hydrate, (C) mid-lower slope of the western continental margin, and (D) crest of the western spur area.
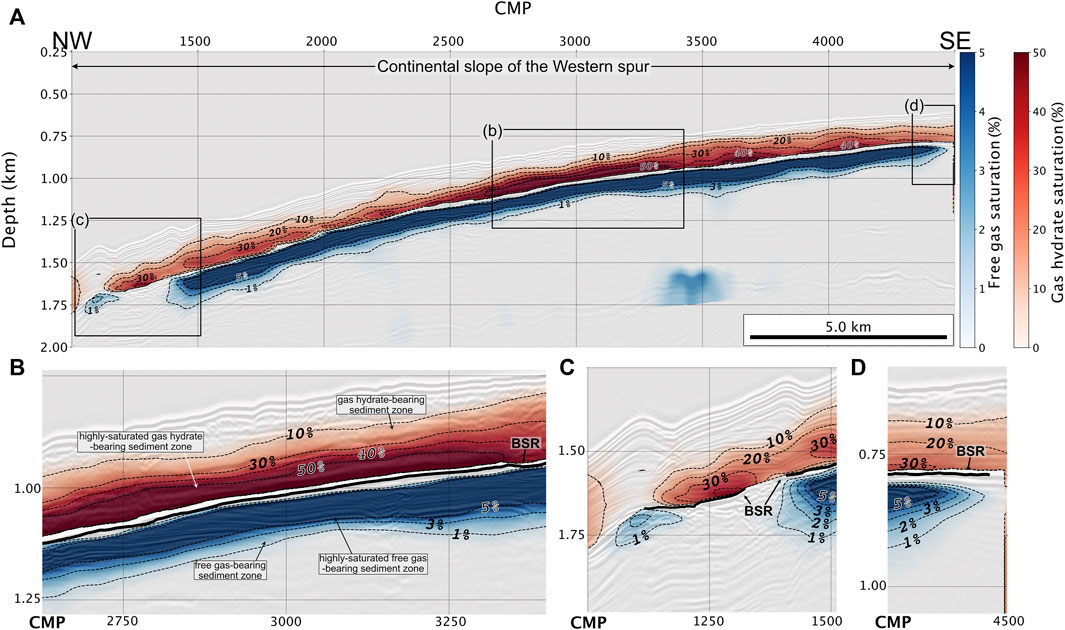
FIGURE 12. (A) Estimated gas hydrate, and free gas saturation model overlaid with migrated seismic images using the IMVA of the MCS04 line. The analysis range is marked on the solid red line in Figure 1C. (B)–(D) Enlarged velocity model: (B) continental slope of the western spur, (C) deepest area showing the BSR of the western spur, and (D) shallower area showing the BSR of the western spur.
Figure 11A represents the gas hydrate and free gas saturation models of the MCS03 line. The saturation model shows that 10–50% of the gas hydrate is saturated above the BSR, and 1–5% of the free gas is saturated below the BSR throughout the western continental margin of the Chukchi Rise. In the mid-lower slope of the Chukchi Rise, an average of 7.8% ± 0.7% and a maximum of 25.6% ± 2.3% of gas hydrates and an average of 2.7% ± 0.5% of free gas are saturated (Figure 11C). The thickness of the gas hydrate layer is approximately 0.085 km, and the free gas layer is approximately 0.176 km thick. In the western spur, an average of 16.9% ± 1.5%, a maximum of 56.7% ± 5.1% of gas hydrates, and an average of 6.2% ± 1.2% of free gas are saturated (Figure 11D). The thicknesses of gas hydrates and free gas are 0.181 km and 0.091 km, respectively. The mid-lower slope of the Chukchi Rise has a lower gas hydrate saturation than the western spur, but it has a thicker free gas zone.
Figure 12A illustrates the gas hydrate and free saturation models derived from the MCS04 line. This model shows a similar trend to the western spur area of the MCS03 line. Above the BSR, the gas hydrate layer is 0.155 km thick, and 10%–50% (an average of 23.1% ± 2.1%) of the gas hydrate saturation is estimated. Between CMP#2650 and CMP#3400, the gas hydrate is highly saturated at 67.5% ± 6.1% (Figure 12B). However, a low gas hydrate saturation of 10%–20% is estimated in the deeper part (CMP#4300-CMP#4500) and shallower part (CMP#1000-CMP#1250) (Figures 12C,D). The free gas saturation is determined to be 7.1% ± 1.4% on average (Figure 12A).
The distribution and structures of the gas hydrate in the western continental margin of the Chukchi Rise are well represented in the saturation model obtained from the P-wave velocity model using the EMT model. In our saturation model, the mid-lower slope contains low-saturated gas hydrate and free gas, whereas the western spur contains high-saturated gas hydrate and free gas. It is inferred that the western spur and mid-lower slope have two different environments for the formation of gas hydrates.
6 Discussion
The BSR provides evidence of the presence of gas hydrates and related free gas in the seismic images. Figure 13A is the distribution map of the BSR that was confirmed by the seismic images from the multichannel seismic and sparker seismic tracks acquired in 2018 and 2019 in the western spur of the Chukchi Rise (Jin and Party, 2018; Kang et al., 2021a). According to the distribution map, the BSR was widely distributed around the ARAON mound cluster, as marked by blue triangular symbols in Figure 13A. The shallowest BSR is located in the area where the water depth of 0.5–0.6 km corresponds to the shelf break. Most of the BSR is observed at a water depth of 0.8–1.4 km, which is marked with a black dashed line. The black dashed line in Figure 13A depicts the distribution area of the BSR on the northern slope of the western spur. Due to a lack of seismic data, the distribution of the BSR cannot be clearly confirmed in these areas. The deepest limit of the BSR appeared in the mid-lower slope of the Chukchi Rise at a water depth of 1.3–1.5 km, extending to the southern slope and the western spur ridge. Therefore, it is presumed that the BSR is distributed in up to 1.4 km of water depth, even on the northern slope of the western spur. Additionally, the migrated seismic images of the MCS03T transit line between MCS03 and MCS04 were taken from parts of the northern slope of the western spur (Figures 13A,B), confirming the BSR to some extent.
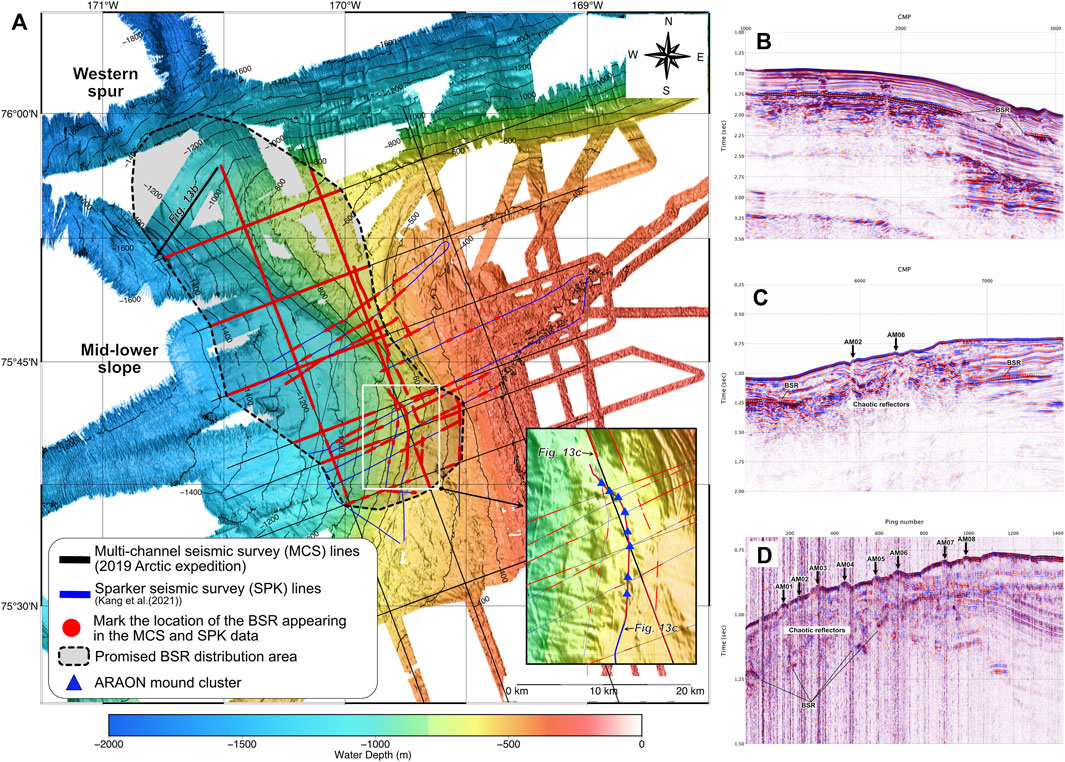
FIGURE 13. (A) Distribution map of the BSR in the western continental margin of the Chukchi Rise. (B)–(D) are the MCS and sparker seismic images: (B) migrated seismic images of the MCS03T transit line, (C) migrated seismic images of the MCS02 line, and (D) seismic images of the ES_SP004 line modified from Kang et al. (2021a).
The BSR is not clearly confirmed in the ARAON mound cluster area because chaotic reflections appeared beneath the mound morphologies in the seismic images, as shown in Figures 13C,D. Figure 13C shows part of the migrated seismic images obtained from the MCS02 line, and Figure 13D illustrates the sparker seismic images of the ES_SP004 line. In these seismic images, acoustic blanking and irregular strong amplitude reflectors appear beneath the mound morphologies, and the BSR is observed on both sides of the ARAON mound area (Figures 13C,D). According to the analysis of the heat flow measurement from the ARAON mound, the fluid is supplied to the mound structure (Kim et al., 2020b). Considering the result of Kim et al. (2020b), it is probable that the upward-moving fluid disturbed the strata of the sedimentary layer and disrupted the continuity of the BSR.
In our results, the low-velocity range of 0.8–1.5 km/s was estimated on the slope side of the western spur. The previous studies suggest that the low-velocity of the free gas-bearing sediment is related to an overpressure environment (Tinivella, 2002; Dash et al., 2004; Chhun et al., 2018). Tinivella (2002) and Dash et al. (2004) demonstrated that the seismic velocity of free gas-bearing sediments was decreased under overpressure conditions. Chhun et al. (2018) evaluated an abnormally high gas saturation of 20% in the Kumano basin. They interpreted that the high gas saturation was caused by the overpressure condition based on the permeability-porosity relationship through the laboratory test from the core samples. Because the study area does not have borehole samples, we cannot prove that the subsurface environment is in an overpressure condition. However, considering the overpressure condition makes it possible to describe the abnormally low velocity and high free gas saturation on the western spur.
Several analyses of the gas hydrate samples obtained from the ARAON mounds indicated that a gas hydrate of an s1 structure composed of more than 99% methane migrated from deep sediment to the surface layer (Kim et al., 2020a; Kim et al., 2020b; Choi et al., 2021). Therefore, it is reasonable to assume that the gas hydrate along the western spur and mid-lower slope of the western continental margin of the Chukchi Rise is also composed of pure methane originating from the deep structures. The western spur showed a higher saturation when we compared our saturation model in the western spur to the mid-lower slope. This finding implies that the western spur has favorable conditions for gas hydrate formation. Several previous studies have shown that gas hydrate and free gas are highly saturated along crests in ridge-type topography (Baba and Yamada, 2004; Singhroha et al., 2019). The reason for the high saturation was the abundance of methane supplied during gas hydrate formation because methane prefers to migrate to the crests in ridge-shaped topography (Singhroha et al., 2019). Additionally, the several faults shown in the migrated seismic images obtained from the western spur are connected to the BSR by deep structures. These faults may have acted as the main pathway for the upward migration process of methane (Kim et al., 2020a).
7 Summary and conclusion
The spatial distribution and geophysical characteristics of the gas hydrate in the western continental margin of the Chukchi Rise were proposed by the P-wave velocity and gas hydrate saturation models from the seismic data. An accurate seismic velocity model was derived using IMVA to confirm the spatial distribution of gas hydrates. The EMT model was used to estimate the gas hydrate saturation. In the saturation model, highly saturated gas hydrates are distributed along the ridge of the western spur region. In the western spur, the maximum gas hydrate saturation is 56.7% ± 5.1%, with an average of 16.9% ± 1.5% of gas hydrates being distributed in the area. The free gas below the BSR has an average of 6.2% ± 1.2% saturation in the western spur. Approximately 7.8% ± 0.7% of gas hydrates and 2.7% ± 0.5% of free gas exists in the mid-lower slope. The gas hydrates and free gas are highly saturated on the western spur ridge because the gas migrated to the top of the ridge-shaped topography. Our result will provide the basic information to estimate the methane flux from sediments to the ocean, verify the gas hydrate formation environments, and analyze the behavior of Arctic gas hydrate related to climate change.
Data availability statement
The datasets presented in this study can be found in online repositories. The names of the repository/repositories and accession number(s) can be found below: https://kpdc.kopri.re.kr/search/c854a4e8-5012-471c-9976-9fa77e31ce6c.
Author contributions
YC processed, analyed and interpretated the data, and writing the manuscript. S-GK designed and coordinate the study, and led the writting of the manuscript. YJ desinged and directed the survey as the chief scientist, and reviewed the manuscript. JH and S-RS reviewd the manuscript. SK reviewed the manuscript, specifically geological setting. YC participated the survey and reviewd the manusciprt. All authors contributed to the writing of the manuscript.
Funding
This work is supported by the research project entitled “Survey of Geology and Seabed Environmental Change in the Arctic Seas,” which was funded by the Korean Ministry of Ocean and Fisheries (KIMST Grant 20210632).
Conflict of interest
The authors declare that the research was conducted in the absence of any commercial or financial relationships that could be construed as a potential conflict of interest.
Publisher’s note
All claims expressed in this article are solely those of the authors and do not necessarily represent those of their affiliated organizations, or those of the publisher, the editors and the reviewers. Any product that may be evaluated in this article, or claim that may be made by its manufacturer, is not guaranteed or endorsed by the publisher.
References
Andreassen, K., Mienert, J., Bryn, P., and Singh, S. C. (2006). A double gas-hydrate related bottom simulating reflector at the Norwegian continental margin. Ann. N. Y. Acad. Sci. 912, 126–135. doi:10.1111/j.1749-6632.2000.tb06766.x
Baba, K., and Yamada, Y. (2004). BSRs and associated reflections as an indicator of gas hydrate and free gas accumulation: An example of accretionary prism and forearc basin system along the nankai trough, off central Japan. Resour. Geol. 54, 11–24. doi:10.1111/j.1751-3928.2004.tb00183.x
Carcione, J. M., and Gei, D. (2004). Gas-hydrate concentration estimated from P- and S-wave velocities at the Mallik 2L-38 research well, Mackenzie Delta, Canada. J. Appl. Geophys. 56, 73–78. doi:10.1016/j.jappgeo.2004.04.001
Chadburn, S. E., Burke, E. J., Cox, P. M., Friedlingstein, P., Hugelius, G., and Westermann, S. (2017). An observation-based constraint on permafrost loss as a function of global warming. Nat. Clim. Chang. 7, 340–344. doi:10.1038/nclimate3262
Chand, S., Minshull, T. A., Gei, D., and Carcione, J. M. (2004). Elastic velocity models for gas‐hydrate‐bearing sediments—a comparison. Geophys. J. Int. 159, 573–590. doi:10.1111/j.1365-246x.2004.02387.x
Chhun, C., Kioka, A., Jia, J., and Tsuji, T. (2018). Characterization of hydrate and gas reservoirs in plate convergent margin by applying rock physics to high-resolution seismic velocity model. Mar. Petroleum Geol. 14, 719–732. doi:10.1016/j.marpetgeo.2017.12.002
Choi, W., Lee, J., Kim, Y. G., Kim, H., Rhee, T. S., Jin, Y. K., et al. (2021). The impact of the abnormal salinity enrichment in pore water on the thermodynamic stability of marine natural gas hydrates in the Arctic region. Sci. Total Environ. 799, 149357. doi:10.1016/j.scitotenv.2021.149357
Collett, T. S., Lee, M. W., Agena, W. F., Miller, J. J., Lewis, K. A., Zyrianova, M. V., et al. (2011). Permafrost-associated natural gas hydrate occurrences on the Alaska North Slope. Mar. Petroleum Geol. 28, 279–294. doi:10.1016/j.marpetgeo.2009.12.001
Dallimore, S. R., Uchida, T., and Collett, T. S. (2002). Scientific results from JAPEX/JNOC/GSC mallik 2L-38 gas hydrate research well, mackenzie delta, northwest territories, Canada. Ottawa, ON (Canada): Geological Survey of Canada, Natural Resources Canada.
Dash, R. K., Sain, K., and Thakur, N. K. (2004). Overpressure detection from seismic amplitude versus offset response: An application to gas-hydrates. Curr. Sci. 86, 985–990.
Dickens, G. R., and Quinby-Hunt, M. S. (1994). Methane hydrate stability in seawater. Geophys. Res. Lett. 21, 2115–2118. doi:10.1029/94gl01858
Dvorkin, J., Prasad, M., Sakai, A., and Lavoie, D. (1999). Elasticity of marine sediments: Rock physics modeling. Geophys. Res. Lett. 26, 1781–1784. doi:10.1029/1999gl900332
Ecker, C., Dvorkin, J., and Nur, A. M. (2000). Estimating the amount of gas hydrate and free gas from marine seismic data. Geophysics 65, 565–573. doi:10.1190/1.1444752
Ghosh, R., Sain, K., and Ojha, M. (2010). Estimating the amount of gas-hydrate using effective medium theory: a case study in the blake ridge. Mar. Geophys. Res. (Dordr). 31, 29–37. doi:10.1007/s11001-010-9084-y
Hajnal, Z., and Sereda, I. T. (1981). Maximum uncertainty of interval velocity estimates. Geophysics 46, 1543–1547.
Hegewald, A., and Jokat, W. (2013). Tectonic and sedimentary structures in the northern Chukchi region, Arctic Ocean. J. Geophys. Res. Solid Earth 118, 3285–3296. doi:10.1002/jgrb.50282
Hustoft, S., Bünz, S., Mienert, J., and Chand, S. (2009). Gas hydrate reservoir and active methane-venting province in sediments on <20 Ma young oceanic crust in the Fram Strait, offshore NW-Svalbard. Earth Planet. Sci. Lett. 284, 12–24. doi:10.1016/j.epsl.2009.03.038
Jakobsen, M., Hudson, J. A., Minshull, T. A., and Singh, S. C. (2000). Elastic properties of hydrate‐bearing sediments using effective medium theory. J. Geophys. Res. Solid Earth 105, 561–577. doi:10.1029/1999jb900190
Jin, Y. K., and Party, O. S. S. (2017). ARA07C cruise report : 2016 Korea-Russia-Germany East Siberian Sea research program. Incheon: Korea Polar Research Institute.
Jin, Y. K., and Party, O. S. S. (2018). ARA09C cruise report : 2018 Korea-Russia-Japan East Siberian Sea/Chukchi Sea research program. Incheon: Korea Polar Research Institute.
Jin, Y. K., and Party, O. S. S. (2019). ARA10C cruise report : 2019 Korea-Russia East Siberian/Chukchi Sea research program. Incheon: Korea Polar Research Institute.
Kang, S.-G., Jang, U., Kim, S., Choi, Y., Kim, Y.-G., Hong, J. K., et al. (2021a). Exploration of the gas hydrates on the southwestern continental slope of the Chukchi Plateau in the Arctic Ocean. ksmer. 58, 418–432. doi:10.32390/ksmer.2021.58.5.418
Kang, S.-G., Jin, Y. K., Jang, U., Duchesne, M. J., Shin, C., Kim, S., et al. (2021b). Imaging the P‐wave velocity structure of arctic subsea permafrost using laplace‐domain full‐waveform inversion. J. Geophys. Res. 124. doi:10.1029/2020jf005941
Kashubin, S. N., Petrov, O. V., Artemieva, I. M., Morozov, A. F., Vyatkina, D. V., Golysheva, Y. S., et al. (2018). Crustal structure of the mendeleev rise and the Chukchi Plateau (Arctic Ocean) along the Russian wide-angle and multichannel seismic reflection experiment “arctic-2012”. J. Geodyn. 119, 107–122. doi:10.1016/j.jog.2018.03.006
Kim, J. H., Hachikubo, A., Kida, M., Minami, H., Lee, D.-H., Jin, Y. K., et al. (2020a). Upwarding gas source and postgenetic processes in the shallow sediments from the ARAON Mounds, Chukchi Sea. J. Nat. Gas Sci. Eng. 76, 103223. doi:10.1016/j.jngse.2020.103223
Kim, Y.-G., Kim, S., Lee, D.-H., Lee, Y. M., Kim, H. J., Kang, S.-G., et al. (2020b). Occurrence of active gas hydrate mounds in the southwestern slope of the Chukchi Plateau, Arctic Ocean. Episodes 43, 811–823. doi:10.18814/epiiugs/2020/020053
Kim, S., Polyak, L., Joe, Y. J., Niessen, F., Kim, H. J., Choi, Y., et al. (2021). Seismostratigraphic and geomorphic evidence for the glacial history of the northwestern Chukchi margin, Arctic Ocean. J. Geophys. Res. Earth Surf. 126, 29. doi:10.1029/2020jf006030
Kolesnik, O. N., Kolesnik, A. N., Vologina, E. G., and Maryash, A. A. (2019). Mineralogical characteristics of the sand fraction in quaternary sediments from the southern margin of the Chukchi Plateau, Arctic Ocean. Oceanology 59, 556–576. doi:10.1134/s000143701904009x
Kvenvolden, K. A., Ginsburg, G. D., and Soloviev, V. A. (1993). Worldwide distribution of subaquatic gas hydrates. Geo-Marine Lett. 13, 32–40. doi:10.1007/bf01204390
Kvenvolden, K. A. (1988). Methane hydrate — a major reservoir of carbon in the shallow geosphere? Chem. Geol. 71, 41–51. doi:10.1016/0009-2541(88)90104-0
Kvenvolden, K. A. (1994). Natural gas hydrate occurrence and issues. Ann. N. Y. Acad. Sci. 715, 232–246. doi:10.1111/j.1749-6632.1994.tb38838.x
Lee, M. W., Hutchinson, D. R., Collett, T. S., and Dillon, W. P. (1996). Seismic velocities for hydrate-bearing sediments using weighted equation. J. Geophys. Res. 101, 20347–20358. doi:10.1029/96jb01886
Lee, M. W. (2002). Biot–Gassmann theory for velocities of gas hydrate‐bearing sediments. Geophysics 67, 1711–1719. doi:10.1190/1.1527072
Lin, C.-C., Lin, A. T.-S., Liu, C.-S., Chen, G.-Y., Liao, W.-Z., and Schnurle, P. (2009). Geological controls on BSR occurrences in the incipient arc-continent collision zone off southwest Taiwan. Mar. Petroleum Geol. 14, 1118–1131. doi:10.1016/j.marpetgeo.2008.11.002
Lu, Y., Luan, X., Lyu, F., Wang, B., Yang, Z., Yang, T., et al. (2017). Seismic evidence and formation mechanism of gas hydrates in the Zhongjiannan Basin, Western margin of the South China Sea. Mar. Petroleum Geol. 84, 274–288. doi:10.1016/j.marpetgeo.2017.04.005
Majorowicz, J., Safanda, J., and Osadetz, K. (2012). Inferred gas hydrate and permafrost stability history models linked to climate change in the Beaufort-Mackenzie Basin, Arctic Canada. Clim. Past. 8, 667–682. doi:10.5194/cp-8-667-2012
Miles, P. R. (1995). Potential distribution of methane hydrate beneath the European continental margins. Geophys. Res. Lett. 22, 3179–3182. doi:10.1029/95gl03013
Monteleone, V., Marín-Moreno, H., Bayrakci, G., Best, A., Shaon, F., Hossain, M. M., et al. (2022). Seismic characterization and modelling of the gas hydrate system in the northern Bay of Bengal, offshore Bangladesh. Mar. Petroleum Geol. 141, 105690. doi:10.1016/j.marpetgeo.2022.105690
Nur, A., Mavko, G., Dvorkin, J., and Galmudi, D. (1998). Critical porosity: A key to relating physical properties to porosity in rocks. Lead. Edge 17, 357–362. doi:10.1190/1.1437977
Osadetz, K. G., and Chen, Z. (2010). A re-evaluation of Beaufort Sea-mackenzie delta basin gas hydrate resource potential: Petroleum system approaches to non-conventional gas resource appraisal and geologically-sourced methane flux. Bull. Can. PETROLEUM Geol. 58, 56–71. doi:10.2113/gscpgbull.58.1.56
Pan, H., Li, H., Grana, D., Zhang, Y., Liu, T., and Geng, C. (2019). Quantitative characterization of gas hydrate bearing sediment using elastic-electrical rock physics models. Mar. Petroleum Geol. 105, 273–283. doi:10.1016/j.marpetgeo.2019.04.034
Riedel, M., Willoughby, E. C., and Chopra, S. (2010). Geophysical characterization of gas hydrates. Tulsa: Society of Exploration Geophysicists.
Riedel, M., Brent, T. A., Taylor, G., Taylor, A. E., Hong, J. K., Jin, Y. K., et al. (2017). Evidence for gas hydrate occurrences in the Canadian Arctic Beaufort Sea within permafrost-associated shelf and deep-water marine environments. Mar. Petroleum Geol. 81, 66–78. doi:10.1016/j.marpetgeo.2016.12.027
Ruppel, C. D., and Kessler, J. D. (2017). The interaction of climate change and methane hydrates. Rev. Geophys. 55, 126–168. doi:10.1002/2016rg000534
Ruppel, C. (2014). Permafrost-Associated gas hydrate: Is it really approximately 1 % of the global system? J. Chem. Eng. Data 60, 429–436. doi:10.1021/je500770m
Shakhova, N., Semiletov, I., Salyuk, A., Yusupov, V., Kosmach, D., and Gustafsson, O. (2010). Extensive methane venting to the atmosphere from sediments of the East siberian arctic shelf. Science 327, 1246–1250. doi:10.1126/science.1182221
Shakhova, N., Semiletov, I., Sergienko, V., Lobkovsky, L., Yusupov, V., Salyuk, A., et al. (2015). the East siberian arctic shelf: Towards further assessment of permafrost-related methane fluxes and role of sea ice. Phil. Trans. R. Soc. A 373, 20140451. doi:10.1098/rsta.2014.0451
Shakhova, N., Semiletov, I., Gustafsson, O., Sergienko, V., Lobkovsky, L., Dudarev, O., et al. (2017). Current rates and mechanisms of subsea permafrost degradation in the East Siberian Arctic Shelf. Nat. Commun. 8, 15872. doi:10.1038/ncomms15872
Shakhova, N., Semiletov, I., and Chuvilin, E. (2019). Understanding the permafrost–hydrate system and associated methane releases in the East siberian arctic shelf. Geosciences 9, 251. doi:10.3390/geosciences9060251
Shedd, W., Boswell, R., Frye, M., Godfriaux, P., and Kramer, K. (2012). Occurrence and nature of “bottom simulating reflectors” in the northern Gulf of Mexico. Mar. Petroleum Geol. 34, 31–40. doi:10.1016/j.marpetgeo.2011.08.005
Shipley, T. H., and Houston, M. H. (1979). Seismic evidence for widespread possible gas hydrate horizons on continental slopes and rises. Am. Assoc. Pet. Geol. Bull. 63. doi:10.1306/2f91890a-16ce-11d7-8645000102c1865d
Singhroha, S., Chand, S., and Bünz, S. (2019). Constraints on gas hydrate distribution and morphology in Vestnesa Ridge, western svalbard margin, using multicomponent ocean‐bottom seismic data. J. Geophys. Res. Solid Earth 124, 4343–4364. doi:10.1029/2018jb016574
Sloan, E. D., and Koh, C. A. (2008). Clathrate hydrates of natural gases. Boca Raton, FL: CRC Press.
Tinivella, U. (2002). The seismic responce to overpressure versus gas hydrate and free gas concentration. J. Seismic Explor. 11, 283–305.
Tóth, Z., Spiess, V., Mogollón, J. M., and Jensen, J. B. (2014). Estimating the free gas content in Baltic Sea sediments using compressional wave velocity from marine seismic data. J. Geophys. Res. Solid Earth 119, 8577–8593. doi:10.1002/2014jb010989
White, R. S. (1979). Gas hydrate layers trapping free gas in the Gulf of Oman. Earth Planet. Sci. Lett. 42, 114–120. doi:10.1016/0012-821x(79)90196-1
Keywords: gas hydrates along the western continental margin of the chukchi rise in the arctic ocean, bottom simulating reflections (BSRs), seismic P-wave velocity model, iterative migration velocity analysis, estimation of gas hydrate saturation by the effective medium theory (EMT) model, characteristic of free gas-bearing sediment
Citation: Choi Y, Kang S-G, Jin YK, Hong JK, Shin S-R, Kim S and Choi Y (2022) Estimation of the gas hydrate saturation from multichannel seismic data on the western continental margin of the Chukchi Rise in the Arctic Ocean. Front. Earth Sci. 10:1025110. doi: 10.3389/feart.2022.1025110
Received: 22 August 2022; Accepted: 14 October 2022;
Published: 24 October 2022.
Edited by:
Luan Thanh Pham, VNU University of Science, VietnamReviewed by:
Huong Phan, Hanoi University of Mining and Geology, VietnamMichela Giustiniani, Istituto Nazionale di Oceanografia e di Geofisica Sperimentale, Italy
Tran Danh Hung, Hanoi University of Mining and Geology, Vietnam
Copyright © 2022 Choi, Kang, Jin, Hong, Shin, Kim and Choi. This is an open-access article distributed under the terms of the Creative Commons Attribution License (CC BY). The use, distribution or reproduction in other forums is permitted, provided the original author(s) and the copyright owner(s) are credited and that the original publication in this journal is cited, in accordance with accepted academic practice. No use, distribution or reproduction is permitted which does not comply with these terms.
*Correspondence: Seung-Goo Kang, a3NnOTMyMkBrb3ByaS5yZS5rcg==