 Ruyuan Lee
 Lei Chen
 Guoyu Ren
- 1Department of Atmospheric Science, School of Environmental Studies, China University of Geosciences, Wuhan, Hubei, China
- 2Centre for Severe Weather and Climate and Hydro-Geological Hazards, Wuhan, China
- 3National Climate Center, Laboratory for Climate Studies, China Meteorological Administration, Beijing, China
Based on different reanalysis datasets, reconstructions of East Asia landfall tropical cyclones (TCs) were compared with observations. The 20th-century reanalysis version 3 dataset (20CRv3) received the most approval in this assessment. It performed better in terms of annual frequency. The fifth generation of atmospheric reanalysis dataset (ERA5) and Japanese 55-year reanalysis dataset (JRA55) are also recommended in this study. Nevertheless, an apparent inconsistency in reconstructed TCs before and after 1980 is visible. Temporally, after the satellite era, the underestimation on TC frequency of the National Centres for Environmental Prediction and National Centre for Atmospheric Research (NCEP/NCAR) reanalysis dataset (NCAR) and 20-century reanalysis of European Center for Medium-Range Weather Forecasts (ERA20C) has been greatly improved. The downward trend of landfalling TCs is well captured by ERA5 and ERA20C. Spatially, the underestimation of TC track discrepancy is reduced in the post-satellite era. ERA5 and 20CRv3 showed relatively consistent performance compared to the former reanalysis in pre-and post-satellite time, which might be due to their better TC treatment. Despite the essential need for high resolution, this study stressed the importance of observation and assimilation development for the reanalysis TCs.
1 Introduction
Tropical cyclones (TCs) are important natural hazards in East Asia and have been of great concern to policymakers and researchers due to their large socioeconomic impacts. As TC observational data are relatively limited spatially and temporally, atmospheric reanalysis datasets play an indispensable role in TC research. Reanalysis datasets are used as an observation supplement for large-scale systems, such as monsoons (Zhou and Wu, 2019) and the El Nino Southern Oscillation (ENSO) (Zhang et al., 2018), when investigating their relationship with TCs, and the direct representation of TCs in reanalysis data is important to those studies (Scoccimarro et al., 2012). Reanalysis data have also been used to describe the thermodynamic, dynamic, and other environmental factors that favor TC genesis (Pu et al., 2019). Some reanalysis data have even been used in historical TC research for over a century (Liu et al., 2021). Furthermore, reanalysis data act as a bridge between the model and observations. Before the tracking method and identification criteria made for TCs are adapted in models, reanalysis data can provide reliability tests for those schemes (Bengtsson et al., 2007a; Murakami and Sugi, 2010). Other than that, reanalysis data can also specify the regional model boundary conditions for the model-based future projection study of TCs (e.g., Walsh, 2015).
Investigations of reanalysis TCs have been performed in the last 2 decades. It was found that reanalysis TCs are basin-dependent in their representation of TC track, the position difference is less in eastern America and eastern China, which have the densest observations in their neighboring basins (Schenkel and Hart, 2012). By using 6 reanalysis datasets, Murakami (2014) discovered that with finer resolution and assimilation of wind data, Japanese reanalysis gives the finest and the most reasonable result in TC spatial distribution and TC structure. Their research also showed that the interannual variation in reanalysis TCs in the Western North Pacific (WNP) and North Atlantic has a high correlation with observation data. Furthermore, Hodges et al. (2017) also affirmed that reanalysis TC genesis can reach close-to-realistic annual counts through a proper identification scheme. The limited resolution of reanalysis data means that they cannot truly reproduce strong TCs (Murakami and Sugi, 2010; Strachan et al., 2013). Malakar et al. (2020) investigated the intensity, structure and evolution history of 28 TCs in the North Indian Ocean and found that the Global Forecast System reanalysis and ERA5 capture the realistic evolution of different TC cases, while its interim dataset underestimates TC intensity and intensification, and their study also stated the importance of high resolution. However, a reasonable description of TC intensity can not only be solved by increasing the resolution but also be achieved by improving data assimilation, model physical processes, and air-sea coupling (Murakami, 2014).
Previous studies gave us an increased understanding of how TC reconstruction was realized by improving reanalysis data and the TC tracking method. However, most studies do not show pre-satellite time reanalysis TC results due to considerations of inconsistency in the quality of TC data before and after the satellite era. Meanwhile, there have been many developments in East Asia landfalling TC climatology, landfalling TC’s trend and variation on the scale of 60-year were investigated (e.g., Chan and Xu, 2008; Shan and Yu, 2021). Data on landfalling TCs in East Asia are considered reliable beyond 60 years, especially the more intense ones.
This paper reports a succinct TC tracking method and its application to the reconstruction of historical landfalling TCs in East Asia by using different reanalysis data, tries to figure out if there exits inconsistency before and after satellite era, and answers the question that if there is any reanalysis dataset considered to be better when we want to analyze the climate change of tropical cyclones. The remainder of this paper is organized as follows. Section 2 describes the observational and reanalysis datasets used in our work, as well as the TC tracking method used. Section 3 gives the results of the reanalysis TCs in terms of track, genesis density, duration, variability and trend of TCs before and after 1980. Section 4 provides a conclusion of this work and briefly discusses the issues to be investigated in the future.
2 Data and methods
2.1 Data
One observational and six reanalysis datasets were used in this study, including the best-track data from the International Best-Track Archive for Climate Stewardship (IBTrACS, Knapp et al., 2010), NCAR (Kalnay et al., 1996) from NCEP/NCAR, 20CRv3 (Slivinski et al., 2019) from the National Oceanic and Atmospheric Administration (NOAA), the Cooperative Institute for Research in Environmental Sciences and the U.S. Department of Energy, JRA55 (Kobayashi et al., 2015) from the Japan Meteorological Agency, the ECMWF reanalysis interim dataset (ERAI, Dee et al., 2011), ERA5 (Hersbach et al., 2020; Bell et al., 2021) and ERA20C (Poli et al., 2016). Further details are provided below.
2.1.1 Observation data
The IBTrACS project merges TC information from agencies around the world and offers various TC variables, including Universal Time Coordinate (UTC) time, longitude and latitude. This study used best-track data from the Chinese Meteorological Administration Shanghai Typhoon Institute (CMA, Ying et al., 2014), obtained from IBTrACS version 04 (Knapp et al., 2010). CMA data offer longitude, latitude, minimum central pressure (MCP), storm type and max sustained wind speed (MSW) with a 2-min average time. The MSW is the highest surface wind that occurs within the TC circulation. We used CMA’s 2-min average MSW to satisfy the national standard, which states that typhoon (TY) intensity occurs when the TC’s central 2-min average wind speed exceeds 32.7 m/s but is no greater than 41.4 m/s. In this study, we use TCs with a maximum intensity exceeding 32.7 m/s.
2.1.2 Reanalysis data
The assimilation method, resolution, period, and TC treatment of the six reanalysis datasets used are given in Table 1. All the reanalysis data we used are based on a temporal frequency of 6 h, and each day contains four timesteps of 00 UTC, 06 UTC, 12 UTC and 18 UTC. Five out of six reanalysis datasets used in this work adapt a four-dimensional variation data assimilation, which yields a more accurate large-scale flow and should produce TCs more precisely (Whitaker et al., 2009; Dee et al., 2011). Based on all these data, 20CRv3 and ERA5 assimilate the International Surface Pressure Databank (ISPD), which contains the TC minimum central pressure from IBTrACS. Furthermore, 20CR has a special treatment for TCs; it allows significant low-pressure values caused by TCs to bypass quality control (QC) in the IBTrACS data assimilation (Compo et al., 2011). In version 3, a 4D incremental analysis method replaces the digital filter so that low-pressure values of TCs are retained and yet do not cause any system instability (Slivinski et al., 2019). The measures above enable the 20CRv3 data to present a more accurate location, sea level pressure and wind distribution around the TC (Slivinski et al., 2019). ERA20C uses a method called “bogus TC” to improve TC presentation, that is, it uses information, such as TC structure and behavior obtained from observations, as well as empirical formulas and gradient wind relationships to generate more realistic TCs in the model (Ahn and Lee, 2002; Poli et al., 2016). JRA55 assimilates the retrieval data (TCR) of the TC surrounding wind profile from Dr. Michael Fiorino (from NOAA). This technology makes the former JRA25 more representative for TCs than other reanalysis data in the same period. However, when applied to JRA55, the detection rate of TCs appears to unexpectedly decline in the 2000s, which is most likely affected by the artificial weakening trend of TCR’s global average wind speed (Kobayashi et al., 2015).
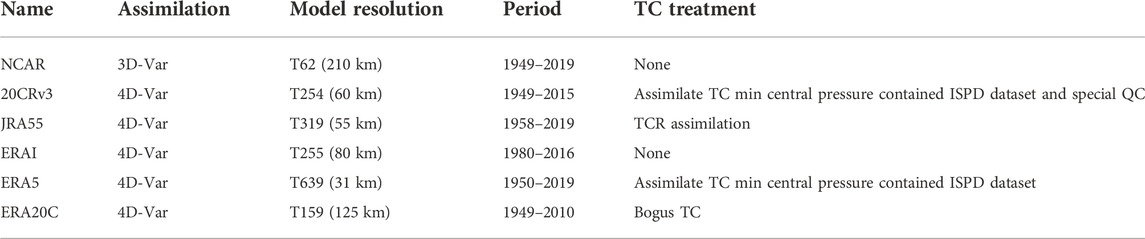
TABLE 1. The assimilation method, model resolution, research period and TC treatment of the NCAR, 20CRv3, JRA55, ERAI, ERA5, and ERA20C reanalysis datasets.
2.2 Methods
2.2.1 Objective tracking method
The objective tracking method for reanalysis cyclone data in this study was proposed by Hodges (1994). Objective tracking is an approach that uses appropriate meteorological fields to segment background and object points and then identifies the initial feature points, tracks them by frame to obtain a series of feature points, forming the systems’ path. In this study, the tracking utilized the 850 hPa relative vorticity field and set the segmentation threshold to
2.2.2 Identification scheme
At present, apart from manual identification methods, many previous works focus on the TC warm core structure. Coupled with thresholds, such as duration and low-level relative vorticity, vorticity or temperature differences between levels are widely used (Bengtsson et al., 1996; Camargo and Zebiak, 2002; Bengtsson et al., 2007b; Zhao et al., 2009; Murakami and Sugi, 2010; Bell et al., 2013; Strachan et al., 2013; Hodges et al., 2017). Alternately, the Okubo–Weiss–Zeta (OWZ) diagnostic method focuses on the environmental conditions conducive to the generation and development of TCs (Tory et al., 2013). However, there is great disagreement among the different tracking schemes, in which the determination of duration, wind speed and genesis latitude thresholds play an important role, and the difference in each scheme’s focus point can also lead to disparities (Horn et al., 2014).
In this study, together with the landing criterion, we used an overall identification method similar to Hodges et al. (2017). Limitations in the track starting area were used, the initial point of the track must be in WNP basin. The applied objective tracking method has been shown to produce an extended TC life cycle including the post-TC stage in which vorticity disturbance has just emerged and the extratropical transition stage of the positive vorticity system remains (Strachan et al., 2013). To remove false alarms that are unlikely even to be attributed to tropical depressions, a longer duration of no less than 4 days (16 timesteps) was considered. Here, the duration refers to the trajectory existence time, as a longer life cycle was demonstrated in objective tracking TC, and a longer duration condition has little impact on the TCs that we focused on.
Reanalysis TC position uncertainty was considered when developing the landfall criterion. TCs were considered to be linked to landfall when the minimum distance between the coastline and its track was less than 1°. Here, we focused on five landfall regions, including China, the Philippines, Malaysia, Brunei, and Vietnam, collectively described as the East Asia area. Apart from the requirement below, a distinctive approach, namely, the west-moving requirement, was added to our identification scheme. The surrounding atmospheric circulation is the dominant factor that affects TC movement (Chan and Gray, 1982). In East Asia, tropical easterlies, monsoon throughs and subtropical highs are strongly associated with TC trajectories as part of background flows (Harr and Elsberry, 1995), and their combined effect drives TCs, showing straight-forward or recurving trajectories (Chen et al., 2009). Most of the studied landfall TCs in our concerned regions are straight-forward or recurving when they move out of the genesis basin, and their movement direction is mainly westward, especially at the beginning (Camargo et al., 2007). Among all the positive vorticity systems affecting East Asia, a considerable false alarm was composed of extratropical cyclones, which are dominated by westerlies and perform differently from TCs. We have captured the key difference between these two cyclones’ trajectories mentioned above in East Asia, limiting the direction of motion in the early stages of cyclone generation, successfully separated extra-tropical cyclones and ensured the reliability of TC landfall processes.
The key to finding the 850 hPa RV threshold at TY intensity is to construct the connections between RV and MSW values. A TY’s intensification can be accompanied by enhanced positive vorticity near its center, along with the appearance of a positive vorticity column through the middle to upper troposphere (Yu et al., 2008). To avoid the interference track such as tropical depression, we matched the best-track (BT) TCs with reanalysis TCs using the direct matching method (Hodges et al., 2017), and we found that the maximum intensity times of all six-reanalysis data TCs appeared to be early or delayed compared with the BT TCs within their matching period. The maximum intensity time lags within each dataset are shown in Figure 1. The time lag is calculated by using the observation MSW maximum timestep minus the reanalysis RV maximum timestep (in their matching period). A positive value (blue) means that the RV maximum appears early to the MSW maximum, while a negative value (yellow) means a delay. The early and delayed appearance of RV maximums compared to MSW maximums are within the back and front 10 timesteps (60 h), which means there is a great chance to find an RV maximum within the back and front 60 h in the observational TC’s maximum MSW.
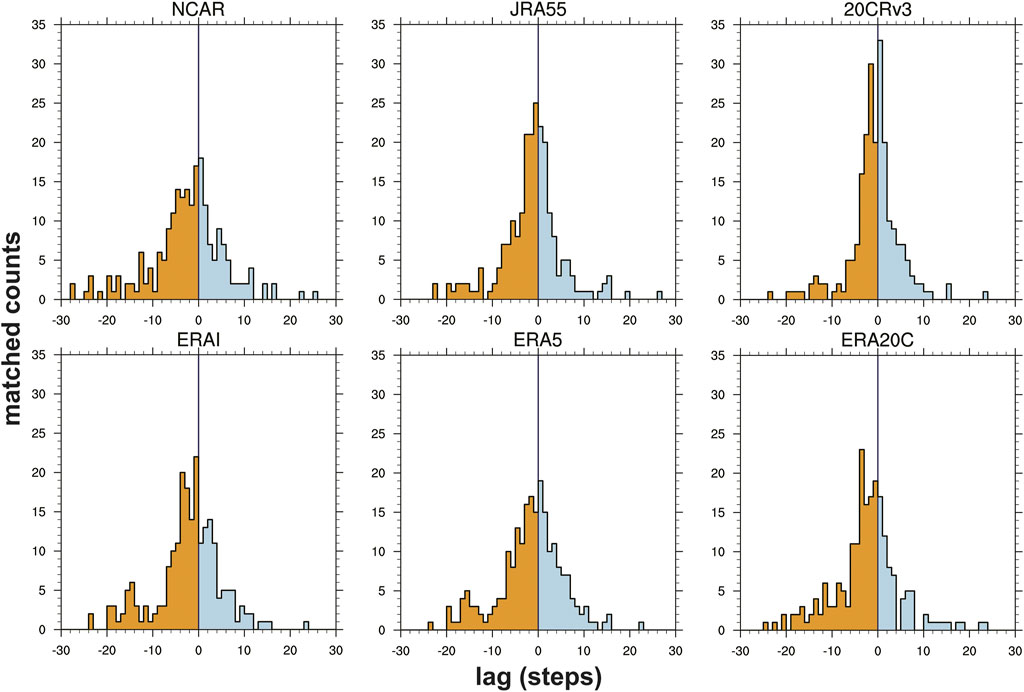
FIGURE 1. BT-RV time lag distribution for NCAR, 20CRv3, JRA55, ERAI, ERA5, and ERA20C (1980–2009). The Y-axis represents the sample number of matching tracks, and the X-axis represents the lag time (6 h a step) between the reanalysis and observed TC.
With the discovery above, we draw the MSW maximum and time corresponding to the RV value in its surrounding 60 h, as depicted in Figure 2. To objectively find the intensity threshold, linear and e functions were used to fit those scatter points. With the highest
(1) The shortest distance between reanalysis TC tracks and coastlines is less than 1°.
(2) The duration of TCs must exceed 4 days.
(3) The first point of TCs must be in the WNP basin (0°–35° N, 105°–210° E).
(4) The tracks must move west from the genesis time compared to the third day (12 steps).
(5) The 850 hPa RV must reach the threshold of
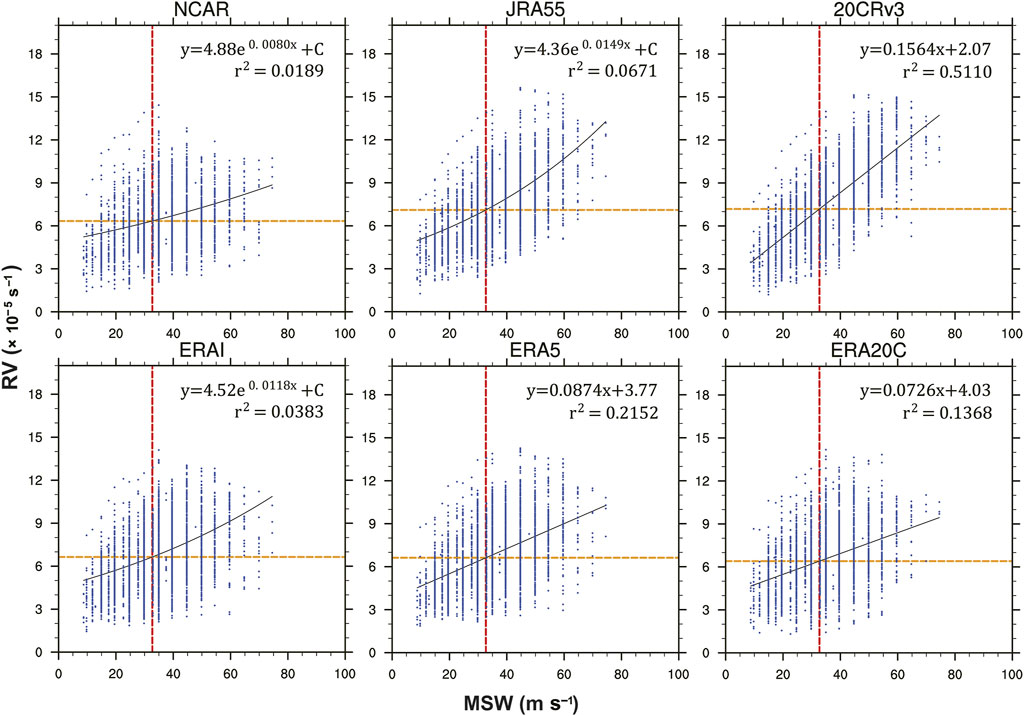
FIGURE 2. BT max sustained wind (MSW) and matching 850 hPa relative vorticity (RV) scatter (blue) (1980–2009), with the fitting function (black straight line), the TY wind speed threshold of 32.7 m/s (red dotted line), and the vorticity threshold corresponding to the typhoon wind speed threshold on the fitting function (yellow dotted line).
The identification used here is highly based on the regional circulation characteristics; therefore, it is a basin-dependent method that should change accordingly when applied to other basins. The threshold of RV chosen here is based on the MSW-RV relationship, which can allocate different thresholds based on different reanalysis, despite their resolution difference. However, this study attempted to find a general threshold for TY intensity; thus, a RV threshold of
3 Results
3.1 TC track, genesis and lifetime
Figure 3 shows the TC tracks of the observations and six reanalysis datasets. The classification of reanalysis TC intensity levels was determined according to the fitting function that was determined in subsection 2.2.2. The TY trajectories of all reanalysis data are more widely distributed, extending near the equator to the south, to the Indochina Peninsula and the Bay of Bengal to the west, and covering Northeast China, the Korean Peninsula and Japan to the north. At the same time, it is noteworthy that reanalysis TCs demonstrate the process of extratropical transition more obviously, which reminds us that it is very important to deal with the information of the extratropical transition stage when using those data to evaluate TC trajectory.
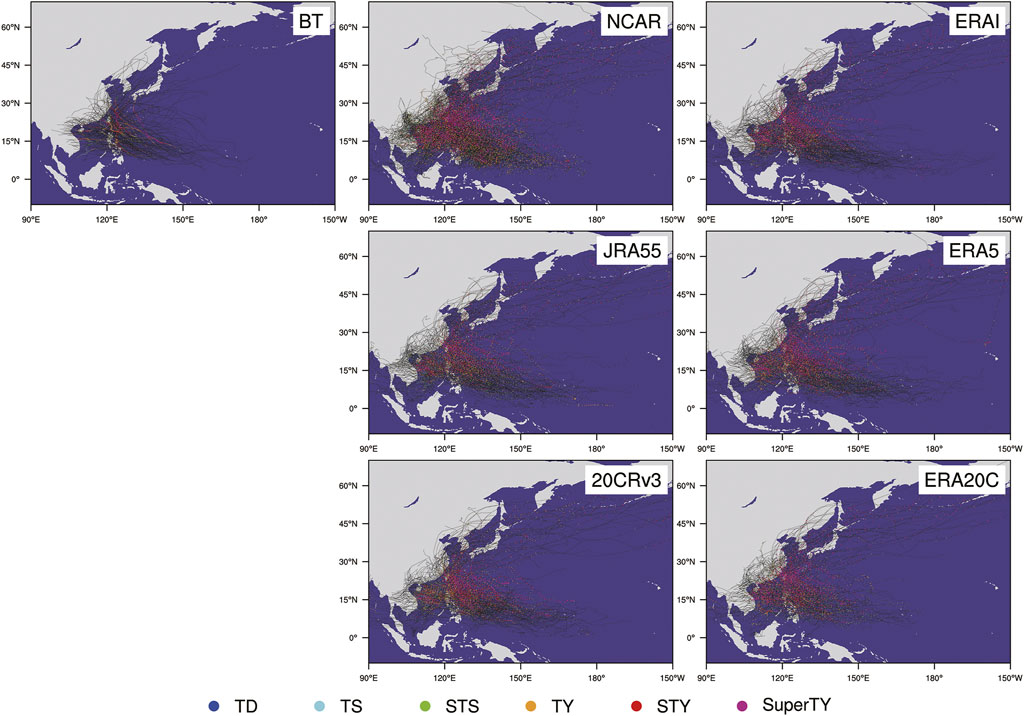
FIGURE 3. NCAR, 20CRv3, JRA55, ERAI, ERA5, ERA20C, and BT TC tracks (1980–2009) (black). Scatter in different colors indicate different intensity stages: tropical depression (TD) is blue; tropical storm (TS) is cyan; strong tropical storm (STS) is green; typhoon (TY) is yellow; strong typhoon (STY) is red; and super typhoon (Super TY) is purple.
As the reanalysis TC tracks seem to be longer, as shown in Figure 3, the durations and genesis position of reanalysis and observation TCs were investigated. Characteristically, most reanalysis datasets have longer life cycles than the observations (Figure 4, red bar). The duration of observed TCs is mostly distributed at 3–12 days, while ERAI, ERA5, ERA20C, JRA55, and 20CRv3 TCs last longer than 12 days (Figure 4). As a characteristic of the tracking method itself, most reanalyzes have a consistent lifetime distribution (Hodges et al., 2017). High resolutions like ERA5 and JRA55 are linked to a longer lifetime, and course resolutions like NCAR and ERA20C can surely infect the result of the life cycle. Figure 5 shows the genesis distribution difference between reanalysis and observed TCs. The reanalysis TC generation position was closer to the equator and northern central Pacific, especially in 20CRv3, JRA55, ERAI, and ERA5, while the northern South China Sea and the Philippine Sea had a greater genesis of observed TCs. Reanalysis TC’s more distant generation, longer life cycle and the extended track are coherent with the previous objective tracking results (Strachan et al., 2013; Hodges et al., 2017). No manual processing was applied to the initial tracks as we intended to retain more information from the initial tracking results.
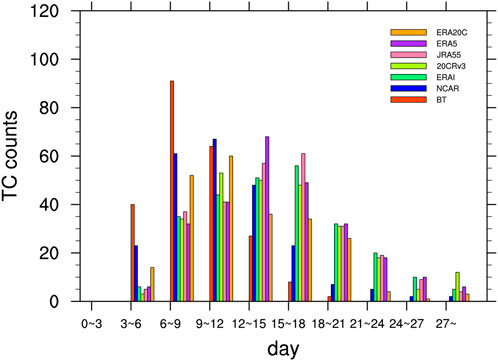
FIGURE 4. Duration in the distributions of BT TCs and NCAR, ERAI, 20CRv3, JRA55, ERA5, and ERA20C (1980–2009) TCs.
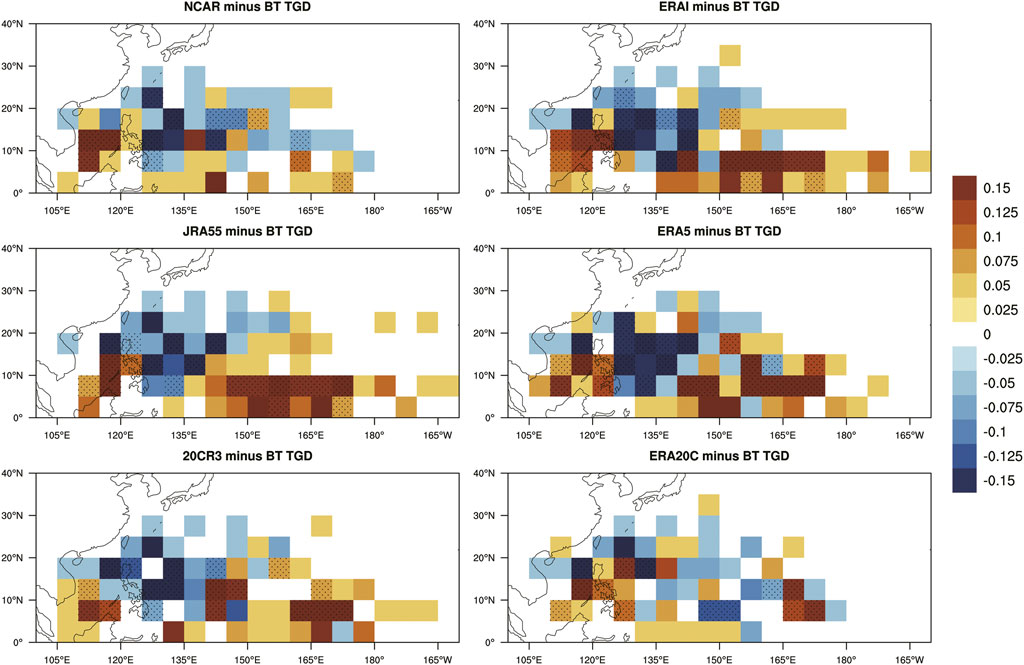
FIGURE 5. The differences between the BT TGD (TC genesis density) and NCAR, 20CRv3, JRA55, ERAI, ERA5, and ERA20C (1980–2009) TGDs. The shadow indicates that the difference is significant at the 0.05 level.
3.2 TC detection rate
In this section, a direct method was used to evaluate the restoration of the reanalysis to the observed TCs. Similar to Hodges et al. (2017), we defined the probability of detection (POD) as the reanalysis TC matching rate reaching that of the observed TC. Additionally, the false alarm rate (FAR) was defined as the proportion of the tracks in the reanalysis data that could not be confirmed by observation data. Table 2 lists the annual count, annual hit count, POD, FAR, correlation coefficient and linear trend difference between the reconstruction series and BT series for six reanalysis TCs. In NCAR and ERA20C, the average annual reanalysis landfall TC counts reach 7.39 and 7.32, respectively, with an average BT landfall TC count of approximately 8.5, NCAR and ERA20C were the only two reanalysis datasets that underestimate the annual genesis number, while the other reanalysis datasets appear to be slightly overestimated. Overall, numerically, the observed annual frequency of TCs has been practically restored. Furthermore, based on POD and FAR, 20CRv3 is the best of all reanalysis data, for it retained a high POD value when the application of the identification scheme reduced the FAR to a small enough value. Notably, JRA55 shows an equal performance for POD with 20CRv3, even though its FAR is slightly higher and can also be considered a good presentation for an actual TC. Four out of six reanalysis data PODs reach to or above 0.70, and four out of six data FARs are approximately 0.3, demonstrating that the identification used in this work can largely determine the TC characteristic. The correlation coefficients of the 20CRv3, JRA55, and ERA5 TC series compared with the observations surpassed 0.5 and appeared to be significant at the 0.05 level, while the NCAR value was 0.16 and considered statistically nonsignificant, which is supportive of the result that 20CRv3, JRA55, and ERA5 are better reanalysis datasets in terms of presenting East Asia TCs making landfall compared with the other three datasets.
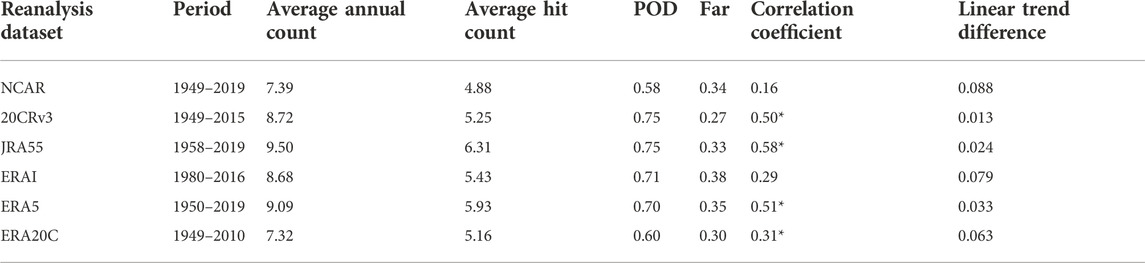
TABLE 2. The identification result, matching result, correlation coefficient (* means significant at the 0.05 level) and linear trend differences in the NCAR, 20CRv3, JRA55, ERAI, ERA5, and ERA20C TCs.
3.3 TC annual variation and inconsistency in approximately 1980
Figure 6 gives the annual variation in TC counts during the reanalysis dataset’s different research periods compared with those in the observations. The annual TC counts in 20CRv3, JRA55, and ERA5 have higher correlation coefficients (Table 2); together, their annual variations are closer to the observations. Similar to the observations, through their research period, 20CRv3, JRA55, and ERA5 show a downward trend, and 20CRv3 has the smallest linear trend difference from the observations (Table 2). In contrast, NCAR, ERAI, and ERA20C show an upward trend, in which NCAR and ERA20C show an upward trend mainly because they underestimated East Asia landfall TCs before 1975.
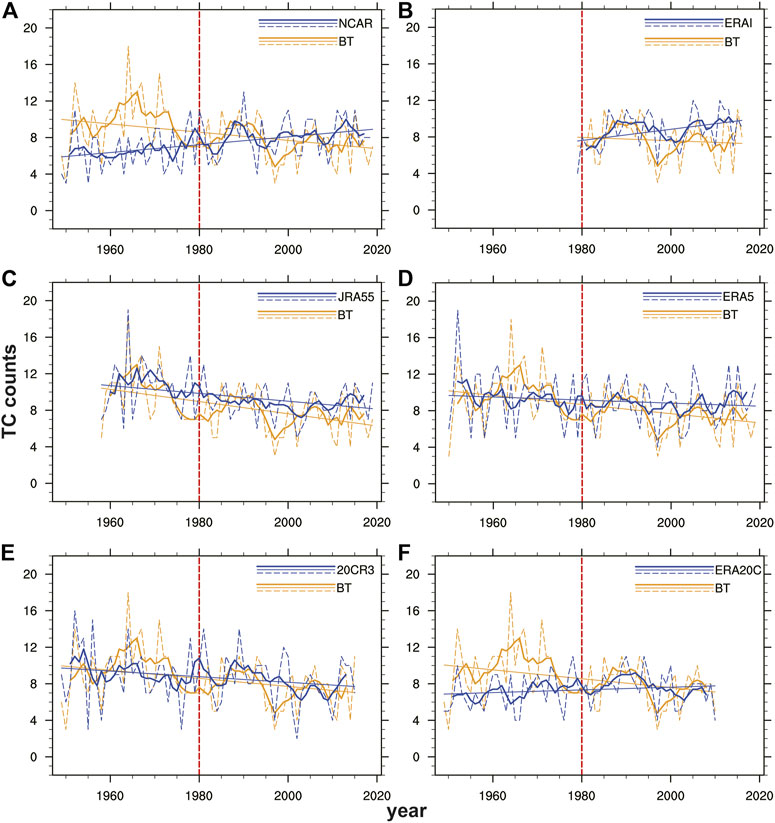
FIGURE 6. The annual variation in NCAR (A), ERAI (B), JRA55 (C), ERA5 (D), 20CRv3 (E), and ERA20C (F) in the reference observations (dashed line). Blue means reanalysis series, and yellow means observations. The thick solid line indicates the 5-year running average, and the thin solid line indicates the linear regression fit curve. The red dash lines are the cutting line of the pre- and post-satellite era.
We divided the NCAR, 20CRv3, ERA5, and ERA20C TC series into two 30-year periods around 1980 to determine whether reanalysis TCs have apparent inconsistencies during the pre-satellite time and after. And as an investigation of how resolution becomes the essential background of reanalysis TCs, we performed the relationship between the POD and RMSE in Figure 7. Before 1980, NCAR and ERA20C show an obvious underestimation of the annual TC count, with maximum underestimated counts both exceeding 9 (Figure 6). At the same time, the root mean square error (RMSE) values of those two reanalysis datasets are higher, and the POD values are lower (Figure 8). ERA5 and 20CRv3 did not show an obvious underestimation; however, the observed TC has a higher count between 1960 and 1975, which explains why their linear trend shows a downward overestimation in the first 30 years (Figure 8). Most reanalysis data were more comparable to the observations after 1980, even though they were obtained in different ways. A higher POD value appears for all the reanalysis TCs; among them, the increases in NCAR and ERA20C were more obvious, and their RMSE decreased to the same level as the other two reanalysis datasets. The linear trend of 1980–2009 restored by reanalysis showed a consistent downward trend with the observations. This downward trend was obtained more accurately in ERA5 and ERA20C. In all the reanalysis datasets, including ERAI and JRA55, the reanalysis datasets almost uniformly overestimated the low values of TC interannual variability in approximately 1998 and 2014 (Figure 6), which means that the interannual variability amplitude of reanalysis TC is smaller than that of the observation. Considering the extremely high, directly matching POD value, this overestimation may be related to the inaccurate estimation of TC intensity by the reanalysis datasets. In summary, the reanalysis datasets with higher resolutions tends to have more consistent POD and RMSE in pre- and post-satellite era. In contrast, the reanalysis datasets with lower resolution showed greatly improved when satellite data are available. However, it is worth noting that at resolutions below 80 km, the influence of satellite data becomes less remarkable, and it is more likely that the results will be determined by different data assimilation schemes (Figure 7).
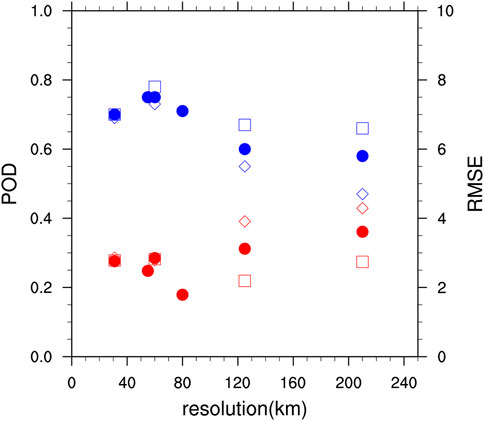
FIGURE 7. Scatter of resolution- POD (blue) and RMSE (red) relationships, solid dots indicate results for full-time periods, when squares indicate 1980–2009 and diamonds indicate 1950–1979.
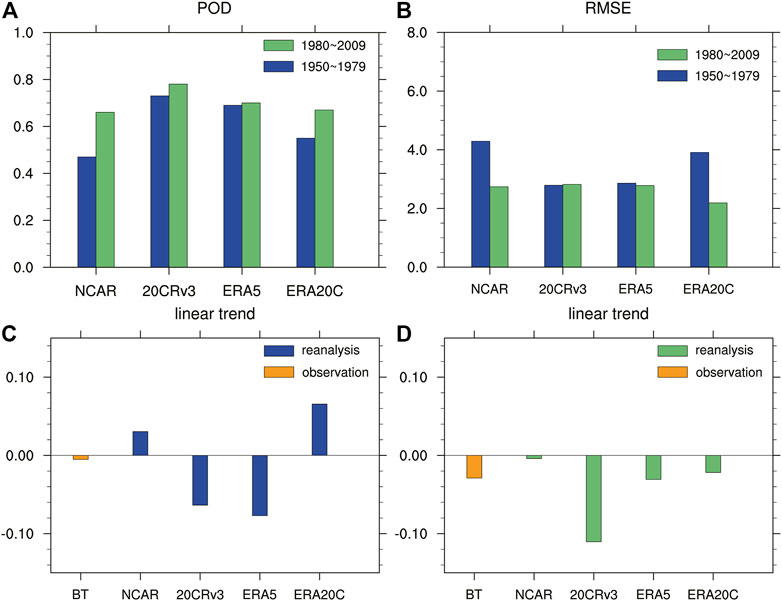
FIGURE 8. The comparison of two periods of POD (A) and RMSE (B) of NCAR, 20CRv3, ERA5, and ERA20C and their linear trend with BT TCs in 1950–1979 (C) and 1980–2009 (D).
In order to see the change in the difference between the reanalysis and observation TCs’ spatial distribution before and after the satellite era, we show the mean TC track density (TCTD) difference in the two 30-year periods in Figure 9. The TCTD is calculated by the frequency of TC tracks over the 5° latitude × 5° longitude area; one track will only be counted once in the same grid box. After 1980, consistent with a longer life cycle, all four sets of reanalysis data have a higher distribution of tracks near the Caroline Islands, in the Bay of Bengal, in central and north-eastern China to Japan, Korea and the northern North Pacific. For Figures 9D,F the multi-distribution of TC tracks located near the Caroline Islands can be explained by the TGD distribution, with both 20CRv3 and ERA5 TC having a larger generation frequency between 140°–180° N, compared to the observed tracks (Figure 5). ERA5 has the highest horizontal resolution, which corresponds to the smallest negative differences and the largest positive differences of TC tracks after 1979, and this correspondence of high resolution with less negative track deviation is also mentioned in Roberts et al. (2020).
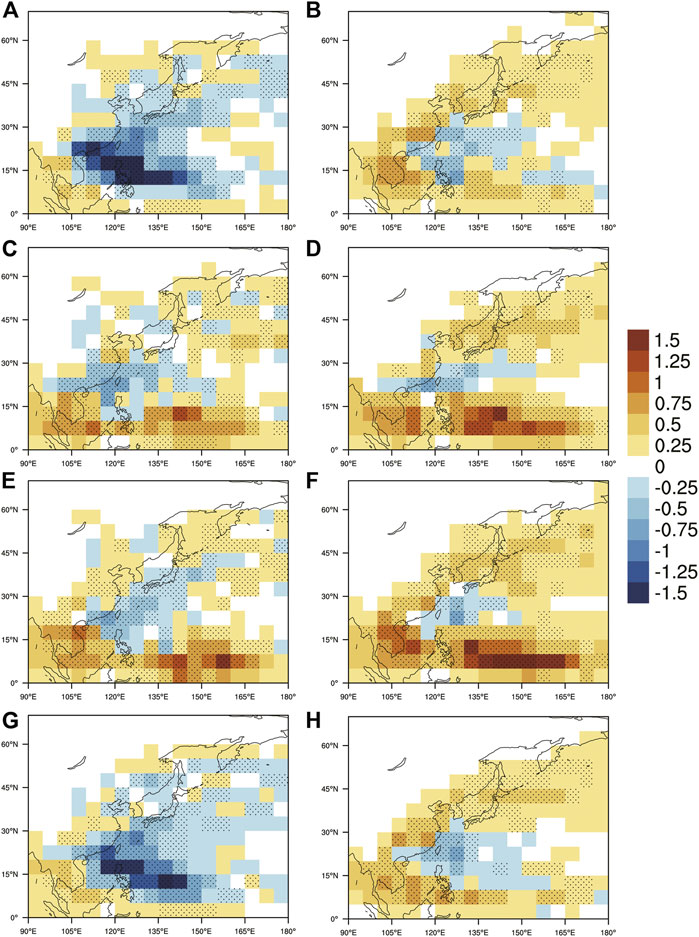
FIGURE 9. The differences between the BT TCTD and NCAR (A,B), 20CRv3 (C,D), ERA5 (E,F) and ERA20C (G,H) TCTDs in 1950–1979 (A,C,E,G) and 1980–2009 (B,D,F,H). The shadow indicates that the difference is significant at the 0.05 level.
Compared to the overestimation of trajectories in the above regional in reanalysis, it is more interesting to note the large values of observed trajectories near the Northern South China Sea, Taiwan Island and the Ryukyu Islands. The matching passages between observed and reanalyzed trajectories are distributed highly in this region, and the average distance between matched trajectories of those data does not exceed 3°N. Therefore, we believe that the underestimations of the reanalysis in this region are not a result of the inaccurate trajectories, but because of the missing TCs in the reanalysis datasets. With more TCs missing, the under-valuation of the NCAR and ERA20 shows further expansion from the original area and is more pronounced in the pre-1980 period (Figures 9A,C,E,G). In the case of 20CRv3 and ERA5 TCs in the pre-satellite era, underestimations dispersedly appear at higher latitudes. It is uncertain whether the missing TCs or the reanalysis TC’s position uncertainty are blamed, as it is possible that the reanalysis trajectories diverge more from the observed positions after landfall and into higher latitudes.
4 Conclusions and discussion
4.1 Conclusions
In this work, a concise East Asia landfall TC identification scheme was used to evaluate the reanalysis TC spatially and temporally, and the NCAR, 20CRv3, ERA5, and ERA20C TC’s performance before and after 1980 were carefully investigated. Overall, 20CR3 gives the most satisfactory result in this assessment, ERA5 and JRA55 also showed encouraging results. Most reanalysis TCs showed discontinuities in approximately 1980, they tended to show better simulations after that, and the newer, higher resolution reanalysis’s discontinuities are lesser found than others.
By evaluating the POD, RMSE and linear trends, the reconstruction of NCAR and ERA20C improved significantly after 1980. After 1980, the downward trend of landfalling TCs is well captured by ERA5 and ERA20C, however, nearly all reanalysis data failed to display the low TC genesis years of approximately 1998 and 2014. Reanalysis TCs have longer life cycles, and their paths also cover areas near the equator to the south, the Indochina Peninsula and the Bay of Bengal to the west, and Northeast China, the Korean Peninsula and Japan to the north. The missing TCs are mostly located around the Northern South China Sea, Taiwan Island and the Ryukyu Islands, causing reanalysis TC paths appear underestimates in such areas. In the pre-satellite era, the underestimated range of TCTD became greater with the absence of more TCs.
4.2 Discussion
Apparently, the resolution has a strong relationship with the results presented by reanalysis of TCs. For the higher resolution ones, such as ERA5, fewer underestimations and larger overestimations of TC tracks occur compared to 20CRv3, which has similar TC treatments when forming the data, but owns a lower resolution. However, it’s not convincing that resolution is the only impact of the disagreement between different reanalysis, especially considering the inconsistency within the same reanalysis in pre-and post-satellite time. NCAR used all available data at that time, including multiple satellite data (Kalnay et al., 1996). With no special treatment against TC, the unstable performance of NCAR shows that the inclusion of satellite data alone can help reanalysis TC improve significantly. ERA20C is also sensitive to changes in satellite data, its inconsistency might arise from bogus TCs assimilation. The number of assimilated bogus TC increased in post-satellite time (Poli et al., 2016), but the details of bogus TC’s quality change around this time and its influence still need further investigation. There are reports about ERA5 back extensions switched off quality control to avoid rejection of IBTrACS observation data, but this initiative has also led to an overestimation of TC intensity (Bell et al., 2021). Some ERA5 TCs before 1979 are found too intense with much deeper central pressure and may come with greater 10 m wind (Bell et al., 2021). In our study, due to the relative vorticity-based tracking method, the overestimated intensity did not affect the tracking result excessively. The relatively high credit of JRA55 and ERA5 TCs has been proposed in former studies (Murakami, 2014; Hodges et al., 2017; Zarzycki et al., 2021). This study shows that 20CRv3 TCs are also worth further study. For future investigations, it is necessary to demonstrate the relationship between intensity uncertainty and the overestimation of low TC genesis years and find out how the identification scheme affects the pre-satellite time TCs. This study displayed the relationships of RV and MSW peak intensity time, with the observation TC’s intensification and weakening period becoming shorter (Kishtawal et al., 2012; Wang et al., 2020), it’s also the direction of interest to understand TC intensity evolution in reanalysis.
Data availability statement
The IBTrACS data are openly available from: https://www.ncei.noaa.gov/data/international-best-track-archive-for-climate-stewardship-ibtracs/v04r00/access/netcdf/. The reanalysis data are available from the following website: https://psl.noaa.gov/data/gridded/data.ncep.reanalysis.html (NCAR), https://psl.noaa.gov/data/gridded/data.20thC_ReanV3.html (20CRv3), http://rda.ucar.edu/datasets/ds628.0/ (JRA55), https://www.ecmwf.int/en/forecasts/datasets/browse-reanalysis-datasets (ERAI, ERA5, ERA20C).
Author contributions
RL: Methodology, formal analysis, writing–original draft, writing–review and editing. LC: Conceptualization, methodology, writing–review and editing. GR: Funding acquisition, supervision, writing–review.
Funding
This work is supported by the National Key R&D Program of China (2018YFA0605603).
Acknowledgments
The authors are grateful to Kevin Hodges for his invaluable help.
Conflict of interest
The authors declare that the research was conducted in the absence of any commercial or financial relationships that could be construed as a potential conflict of interest.
Publisher’s note
All claims expressed in this article are solely those of the authors and do not necessarily represent those of their affiliated organizations, or those of the publisher, the editors and the reviewers. Any product that may be evaluated in this article, or claim that may be made by its manufacturer, is not guaranteed or endorsed by the publisher.
References
Ahn, Y. I., and Lee, D. K. (2002). Impact of bogus tropical cyclones on summertime circulation in regional climate simulation. J. Geophys. Res. 107 (D16), ACL 8-1–ACL 8-16. doi:10.1029/2001JD000416
Bell, B., Hersbach, H., Simmons, A., Berrisford, P., Dahlgren, P., Horányi, A., et al. (2021). The ERA5 global reanalysis: Preliminary extension to 1950. Q. J. R. Meteorol. Soc. 147 (741), 4186–4227. doi:10.1002/qj.4174
Bell, R., Strachan, J., Vidale, P. L., Hodges, K., and Roberts, M. (2013). Response of tropical cyclones to idealized climate change experiments in a global high-resolution coupled general circulation model. J. Clim. 26 (20), 7966–7980. doi:10.1175/JCLI-D-12-00749.1
Bengtsson, L., Botzet, M., and Esch, M. (1996). Will greenhouse gas-induced warming over the next 50 years lead to higher frequency and greater intensity of hurricanes? Tellus A Dyn. Meteorology Oceanogr. 48 (1), 57–73. doi:10.3402/tellusa.v48i1.11632
Bengtsson, L., Hodges, K. I., Esch, M., Keenlyside, N., Kornblueh, L., Luo, J. J., et al. (2007b). How may tropical cyclones change in a warmer climate? Tellus A Dyn. Meteorology Oceanogr. 59 (4), 539–561. doi:10.1111/j.1600-0870.2007.00251.x
Bengtsson, L., Hodges, K. I., and Esch, M. (2007a). Tropical cyclones in a T159 resolution global climate model: comparison with observations and re-analyses. Tellus A Dyn. Meteorology Oceanogr. 59 (4), 396–416. doi:10.1111/j.1600-0870.2007.00236.x
Camargo, S. J., Robertson, A. W., Gaffney, S. J., Smyth, P., and Ghil, M. (2007). Cluster Analysis of typhoon tracks. Part I: general properties. J. Clim. 20 (14), 3635–3653. doi:10.1175/JCLI4188.1
Camargo, S. J., and Zebiak, S. E. (2002). Improving the detection and tracking of tropical cyclones in atmospheric general circulation models. Weather Forecast. 17 (6), 1152–1162. doi:10.1175/1520-0434(2002)017<1152:itdato>2.0.co;2
Chan, J. C. L., and Gray, W. M. (1982). Tropical cyclone movement and surrounding flow relationships. Mon. Weather Rev. 110 (10), 1354–1374. doi:10.1175/1520-0493(1982)110<1354:tcmasf>2.0.co;2
Chan, J. C. L., and Xu, M. (2008). Inter-annual and inter-decadal variations of landfalling tropical cyclones in east Asia. Part I: time series analysis. Int. J. Climatol. 29 (9), 1285–1293. doi:10.1002/joc.1782
Chen, T., Wang, S., Yen, M., and Clark, A. J. (2009). Impact of the intraseasonal variability of the Western north pacific large-scale circulation on tropical cyclone tracks. Weather Forecast. 24 (3), 646–666. doi:10.1175/2008WAF2222186.1
Compo, G. P., Whitaker, J. S., Sardeshmukh, P. D., Matsui, N., Allan, R. J., Yin, X., et al. (2011). The twentieth century reanalysis project. Q. J. R. Meteorol. Soc. 137 (654), 1–28. doi:10.1002/qj.776
Dee, D. P., Uppala, S. M., Simmons, A. J., Berrisford, P., Poli, P., Kobayashi, S., et al. (2011). The ERA-interim reanalysis: configuration and performance of the data assimilation system. Q. J. R. Meteorol. Soc. 137 (656), 553–597. doi:10.1002/qj.828
Harr, P. A., and Elsberry, R. L. (1995). Large-scale circulation variability over the tropical Western north pacific. Part I: Spatial patterns and tropical cyclone characteristics. Mon. Weather Rev. 123 (5), 1225–1246. doi:10.1175/1520-0493(1995)123<1225:lscvot>2.0.co;2
Hersbach, H., Bell, B., Berrisford, P., Hirahara, S., Horányi, A., Muñoz-Sabater, J., et al. (2020). The ERA5 global reanalysis. Q. J. R. Meteorol. Soc. 146 (730), 1999–2049. doi:10.1002/qj.3803
Hodges, K., Cobb, A., and Vidale, P. L. (2017). How well Are tropical cyclones represented in reanalysis datasets? J. Clim. 30 (14), 5243–5264. doi:10.1175/JCLI-D-16-0557.1
Hodges, K. L. (1994). A general method for tracking analysis and its application to meteorological data. Mon. Weather Rev. 122 (11), 2573–2586. doi:10.1175/1520-0493(1994)122<2573:agmfta>2.0.co;2
Horn, M., Walsh, K., Zhao, M., Camargo, S. J., Scoccimarro, E., Murakami, H., et al. (2014). Tracking scheme dependence of simulated tropical cyclone response to idealized climate simulations. J. Clim. 27 (24), 9197–9213. doi:10.1175/JCLI-D-14-00200.1
Kalnay, E., Kanamitsu, M., Kistler, R., Collins, W., Deaven, D., Gandin, L., et al. (1996). The NCEP/NCAR 40-year reanalysis project. Bull. Am. Meteorol. Soc. 77 (3), 437–471. doi:10.1175/1520-0477(1996)077<0437:tnyrp>2.0.co;2
Kishtawal, C. M., Jaiswa, N., Singh, R., and Niyogi, D. (2012). Tropical cyclone intensification trends during satellite era (1986–2010). Geophys. Res. Lett. 39 (10). doi:10.1029/2012GL051700
Knapp, K. R., Kruk, M. C., Levinson, D. H., Diamond, H. J., and Neumann, C. J. (2010). The international best track archive for climate stewardship (IBTrACS). Bull. Am. Meteorol. Soc. 91 (3), 363–376. doi:10.1175/2009BAMS2755.1
Kobayashi, S., Ota, Y., Harada, Y., Ebita, A., Moriya, M., Onoda, H., et al. (2015). The JRA-55 reanalysis: General specifications and basic characteristics. J. Meteorological Soc. Jpn. 93 (1), 5–48. doi:10.2151/jmsj.2015-001
Liu, K. S., Chan, J. C. L., and Kubota, H. (2021). Meridional oscillation of tropical cyclone activity in the Western North Pacific during the past 110 years. Clim. Change 164, 23. doi:10.1007/s10584-021-02983-8
Malakar, P., Kesarkar, A. P., Bhate, J. N., Singh, V., and Deshamukhya, A. (2020). Comparison of reanalysis data sets to comprehend the evolution of tropical cyclones over north Indian ocean. Earth Space Sci. 7 (2), e2019EA000978. doi:10.1029/2019EA000978
Murakami, H., and Sugi, M. (2010). Effect of model resolution on tropical cyclone climate projections. SOLA 6, 73–76. doi:10.2151/sola.2010-019
Murakami, H. (2014). Tropical cyclones in reanalysis data sets. Geophys. Res. Lett. 41 (6), 2133–2141. doi:10.1002/2014GL059519
Poli, P., Hersbach, H., Dee, D. P., Berrisford, P., Simmons, A. J., Vitart, F., et al. (2016). ERA-20C: an atmospheric reanalysis of the twentieth century. J. Clim. 29 (11), 4083–4097. doi:10.1175/JCLI-D-15-0556.1
Pu, X., Chen, Q., Zhong, Q., Ding, R., and Liu, T. (2019). Influence of the north pacific victoria mode on western north pacific tropical cyclone Genesis. Clim. Dyn. 52, 245–256. doi:10.1007/s00382-018-4129-z
Roberts, M. J., Camp, J., Seddon, J., Vidale, P. L., Hodges, K., Vanniere, B., et al. (2020). Impact of model resolution on tropical cyclone simulation using the HighResMIP–PRIMAVERA multimodel ensemble. J. Clim. 33 (7), 2557–2583. doi:10.1175/JCLI-D-19-0639.1
Schenkel, B. A., and Hart, R. E. (2012). An examination of tropical cyclone position, intensity, and intensity life cycle within atmospheric reanalysis datasets. J. Clim. 25 (10), 3453–3475. doi:10.1175/2011JCLI4208.1
Scoccimarro, E., Gualdi, S., and Navarra, A. (2012). Tropical cyclone effects on Arctic Sea ice variability. Geophys. Res. Lett. 39. doi:10.1029/2012GL052987
Shan, K., and Yu, X. (2021). Variability of tropical cyclone landfalls in China. J. Clim. 34 (23), 9235–9247. doi:10.1175/JCLI-D-21-0031.1
Slivinski, L. C., Compo, G. P., Whitaker, J. S., Sardeshmukh, P. D., Giese, B. S., McColl, C., et al. (2019). Towards a more reliable historical reanalysis: improvements for version 3 of the Twentieth Century Reanalysis system. Q. J. R. Meteorol. Soc. 145 (724), 2876–2908. doi:10.1002/qj.3598
Strachan, J., Vidale, P. L., Hodges, K., Roberts, M., and Demory, M. (2013). Investigating global tropical cyclone activity with a hierarchy of AGCMs: the role of model resolution. J. Clim. 26 (1), 133–152. doi:10.1175/JCLI-D-12-00012.1
Tory, K. J., Chand, S. S., Dare, R. A., and McBride, J. L. (2013). The development and assessment of a model-grid-and basin-independent tropical cyclone detection scheme. J. Clim. 26 (15), 5493–5507. doi:10.1175/JCLI-D-12-00510.1
Walsh, K. (2015). Fine resolution simulations of the effect of climate change on tropical cyclones in the South Pacific. Clim. Dyn. 45, 2619–2631. doi:10.1007/s00382-015-2497-1
Wang, S., Rashid, T., Throp, H., and Toumi, R. (2020). A shortening of the life cycle of major tropical cyclones. Geophys. Res. Lett. 47 (14), e2020GL088589. doi:10.1029/2020GL088589
Whitaker, J. S., Compo, G. P., and Thépaut, J. (2009). A comparison of variational and ensemble-based data assimilation systems for reanalysis of sparse observations. Mon. Weather Rev. 137 (6), 1991–1999. doi:10.1175/2008MWR2781.1
Ying, M., Zhang, W., Yu, H., Lu, X., Feng, J., Fan, Y., et al. (2014). An overview of the China meteorological administration tropical cyclone database. J. Atmos. Ocean. Technol. 31 (2), 287–301. doi:10.1175/JTECH-D-12-00119.1
Yu, Y. B., Chen, L. S., and Yang, C. X. (2008). The features and mechanism analysis on rapid intensity change of super typhoon saomai(2006) over the offshore of China. Chin. J. Atmos. Sci. 32, 405–416. Available at: https://kns.cnki.net/kcms/detail/detail.aspx?
Zarzycki, C. M., Ullrich, P. A., and Reed, K. A. (2021). Metrics for evaluating tropical cyclones in climate data. J. Appl. Meteorol. Climatol. 60 (5), 643–660. doi:10.1175/JAMC-D-20-0149.1
Zhang, Q., Gu, X., Li, J., Shi, P., and Singh, V. P. (2018). The impact of tropical cyclones on extreme precipitation over coastal and inland areas of China and its association to ENSO. J. Clim. 31 (5), 1865–1880. doi:10.1175/JCLI-D-17-0474.1
Zhao, M., Held, I. M., Lin, S., and Vecchi, G. A. (2009). Simulations of global hurricane climatology, interannual variability, and response to global warming using a 50-km resolution GCM. J. Clim. 22 (24), 6653–6678. doi:10.1175/2009JCLI3049.1
Keywords: relative vorticity, tropical cyclone, satellite era, reanalysis data, observation, East Asia
Citation: Lee R, Chen L and Ren G (2023) A comparison of East-Asia landfall tropical cyclone in recent reanalysis datasets--before and after satellite era. Front. Earth Sci. 10:1026945. doi: 10.3389/feart.2022.1026945
Received: 24 August 2022; Accepted: 31 October 2022;
Published: 12 January 2023.
Edited by:
Jianjun Xu, Guangdong Ocean University, ChinaReviewed by:
Wei Zhang, Utah State University, United StatesCheng Sun, Beijing Normal University, China
Copyright © 2023 Lee, Chen and Ren. This is an open-access article distributed under the terms of the Creative Commons Attribution License (CC BY). The use, distribution or reproduction in other forums is permitted, provided the original author(s) and the copyright owner(s) are credited and that the original publication in this journal is cited, in accordance with accepted academic practice. No use, distribution or reproduction is permitted which does not comply with these terms.
*Correspondence: Lei Chen, bGVpY2hlbkBjdWcuZWR1LmNu