- 1Earth System Modeling and Prediction Centre (CEMC), Beijing, China
- 2State Key Laboratory of Severe Weather, Beijing, China
- 3National Meteorological Center, Beijing, China
- 4CMA GDOU Joint Laboratory for Marine Meteorology and South China Sea Institute of Marine Meteorology, Guangdong Ocean University, Zhanjiang, Guangdong, China
We assimilated radiance observations from the Geostationary Interferometric Infrared Sounder (GIIRS) onboard the FengYun-4A geostationary satellite to evaluate their impact on the forecast of Typhoon Bavi using WRFDA. The temperature channels with high information content, representing 90% of the information content of all temperature channels, were selected for assimilation. All radiance observations above the cloud-top were assimilated by comparing the channel height to the cloud-top height coming from the product of the Advanced Geosynchronous Radiation Imager (AGRI). The assimilation of the GIIRS observations decreased the root-mean-square error of the temperature by 2% and improved the precipitation forecast. The rain band in southeast China was reproduced well, thus showing that infrared hyperspectral radiance observations have added value in improving the circulation around typhoons and, therefore, provide better forecasts. The increased relative humidity in the upper layer and stronger typhoon outflow were found to related to the intensify of typhoon in the analysis compared with the control experiment.
1 Introduction
Tropical cyclones are organized convective weather systems that occur over tropical and subtropical oceans. They usually consist of a non-frontal vortex with high temperatures and low pressures in the center of the cyclone. These major weather systems bring gales, rainstorms, and storm surges, often causing great losses to property and human lives in coastal areas. The forecast of tropical cyclones has, therefore, always been a focus of numerical weather prediction (NWP). Tropical cyclones occur over the ocean and generally weaken and dissipate rapidly after making landfall; thus, observational data over the sea are important in their forecast. Satellite remote sensing is an important way to monitor and study the tropical cyclone due to the lack of conventional observational data over the oceans.
Infrared hyperspectral instruments onboard satellites commonly have one long-wave band mainly measuring atmospheric temperature and one or two middle-wave bands measuring atmospheric moisture. Unlike other infrared (IR) instruments, hyperspectral instruments have thousands of channels that allow atmospheric observation at a higher resolution in the vertical direction. Hyperspectral payloads have developed rapidly in recent years and include the atmospheric infrared sounder (AIRS), the Cross-track Infrared Sounder (CrIs), and the infrared atmospheric sounding interferometer (IASI) on polar-orbiting satellites. The data from these hyperspectral instruments have been widely used in data assimilation (Collard, 2001; Cameron et al., 2005; Le Marshall et al., 2006; McNally et al., 2006; Joiner et al., 2007; Collard and McNally, 2009; Hilton et al., 2009; Bormann et al., 2016). The hyperspectral radiance data are generally assimilated in the numerical weather prediction systems of major operational centers.
Many studies have shown that the assimilation of IR hyperspectral observations can improve the forecast of tropical cyclones. Reale et al. (2018) showed the positive effects of the AIRS on the forecast of tropical cyclones through an observational experiment, especially the method of cloud clearing, which can increase the score of the forecast after the assimilation of AIRS data. Li and Lui (2009) assimilated the temperature and humidity profiles retrieved from the AIRS, which greatly reduced the track and intensity forecast errors for Typhoon Ike. Liu and Li (2010) assimilated the temperature and humidity profiles retrieved from the AIRS and forecast the rapidly strengthening Typhoon Sinlaku, improving the vortex analysis and the track forecast. Xu et al. (2013) assessed the impact of assimilating IASI data on the analyses and forecasts of Hurricane Maria (2011) and Typhoon Megi (2010) with Weather Research and Forecasting Data Assimilation (WRFDA) and proved that IASI radiances with channels around 15-µm CO2 band and 6.7-µm H2O band had consistent positive impacts on the forecast skills for the track, minimum sea level pressure, and maximum wind speed.
Polar-orbiting satellites pass over a fixed location twice daily with poor temporal resolution while geostationary orbit (GEO) meteorological satellites perform a full disc scan in 1 or 2 hours, providing almost continuous measurements of the atmosphere. The observation from Polar-orbiting satellites compared with GEO meteorological satellites, lack information about the development of tropical cyclones compared with, which affects their application in numerical prediction forecasts. The FengYun-4A (FY-4A) generation of geostationary orbit meteorological satellites was launched by China in December 2016. The Geostationary Interferometric Infrared Sounder (GIIRS) onboard the FY-4A satellite was the first instrument to detect the vertical structure of the atmosphere by infrared interferometry spectroscopy in a geostationary orbit (Zhang et al., 2016; Yang et al., 2017). The satellite is fixed at 104.5° E and completes an observation of East Asia every 2 h. As a result of its extremely high spatiotemporal resolution, this satellite can observe the entire evolution of a tropical cyclone. Hyperspectral data from geostationary satellites are, therefore, expected to improve the forecast of tropical cyclones compared to polar-orbiting satellites. Yin et al. (2020) analyzed the quality of the clear-sky pixels of the GIIRS temperature channels using pixel cloud detection data from the Advanced Geostationary Radiation Imager (AGRI), showing the potential of the GIIRS in data assimilation applications. They also used the assimilation of a 30-min intensified observational dataset from the GIIRS to carry out a forecast experiment on Typhoon Maria, which proved the value of the high spatiotemporal resolution of infrared hyperspectral data in the forecast of tropical cyclones (Yin et al., 2021). Fengyun-4A GIIRS LWIR radiances have been operationally assimilated into the CMA-GFS system since 2019. Evaluations have indicated an overall neutral to positive impact on the numerical forecasts (Han et al., 2019). Li et al. (2022a) expanded from measurements in clear sky to measurements from partially cloud-filled footprints with help from collocated imager measurements. With geostationary hyperspectral observations, more thermodynamic information in cloudy areas (also sensitive areas) is available for assimilation; thus, improvement in high-impact weather forecasts can be expected. The retrieval of moisture-tracked wind profiles from the GIIRS showed the potential of sounder sub-footprint cloud information available from the geostationary platform to provide better QC for application in weather nowcasting and forecasting (Li et al., 2022b). While the hyperspectral IR radiances provided added value for the numerical forecast, some challenges remain to be addressed. The large volume of data always poses difficulties in the timely processing, distribution, and extraction of information. Currently, the solutions are representative channel selection or PCs (Collard 2001; Antonelli et al., 2004; Collard 2007; Collard et al., 2010). A balance is needed between retaining major channel information and reducing the data volume. Different applications require different channel selections. The geostationary IR hyperspectral radiances also offer high temporal resolution information in 15 min or 30 min. Fast and slow-changing atmosphere information should be separated for better utilization of the time continuity. Thus, the retrieval method for some atmosphere parameters may differ, and the assimilation scheme may also need to change. The assimilation of IR hyperspectral radiances is limited to clear skies or above-cloud situations because of the uncertainty of the radiative transfer model (RTM) in modeling the hydrometers in clouds. The radiances of clear-sky channels (above-cloud) are assimilated in most of the NWP models as much as possible for remaining observations. The clear-sky channels can be identified by comparing the observed and simulated radiance spectra (McNally and Watts, 2003). The effectiveness of this method critically depends on the accuracy of the NWP models, and the results are easily affected by model biases.
WRFDA (Barker et al., 2012) is widely used to assimilate the radiances of remote sensing. This is the first attempt to use the three-dimensional variational (3DVAR) component (Barker et al., 2004) of WRFDA, which is technically more mature than other components, to assimilate GIIRS data. This study addresses some of the issues mentioned previously in the assimilating experiments to give some reference for subsequent studies. To avoid affecting the model bias, we modified the method described by McNally and Watts (2003) and used AGRI product assistance to identify the clear-sky channels for the GIIRS, as described as follows. A 1-h cycling assimilation scheme was designed for the GIIRS to better take advantage of the temporal continuity information. We also applied statistical analysis to determine the bias correction predictors for GIIRS. With assimilation and forecast experiments on Typhoon Bavi, we verified that IR hyperspectral radiances from geostationary satellites have added value in the assimilation/forecasts of tropical cyclones in the 2-h regional conventional observation mode.
The paper is organized as follows: Section 2 introduces the relevant data used in the data assimilation, including the assimilated observational data, the model initial field and boundary field data, and the profile set used in the channel selection. Section 3 presents the weather research and forecasting (WRF) model (Skamarock et al., 2019), WRFDA, and assimilation/forecast schemes. Section 4 introduces the preprocessing scheme of the observational data, including cloud detection, channel selection, and bias correction. Section 5 describes the experimental results for the analysis and forecast of Typhoon Bavi. Finally, Section 6 presents our discussion and conclusions.
2 Dataset and assimilation system
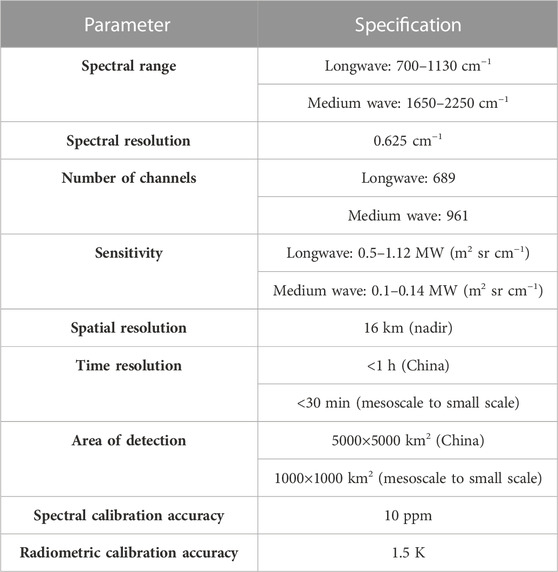
We used level 1 radiance data from the GIIRS onboard the FY-4A satellite for data assimilation. The GIIRS is an interferometric Fourier transform infrared hyperspectral payload that operates in an area-array detection mode with 128 detectors. It has 1600 channels with a spatial resolution of 16 km and a spectral resolution of 0.625 cm-1. At present, the GIIRS can conduct regional observations every 2 h in the observation range (3°–55° N, 60°–137° E). The 2-h observations in the GIIRS are shown in Figure 1A. Table 1 gives the specific performance parameters of the GIIRS. The data assimilation forecast experiment used the regional model with initial field and boundary field data from the operational Global Forecast System of the National Centers for Environmental Prediction. The spatial resolution of the data was 0.25°, and the temporal resolution was 6 h.
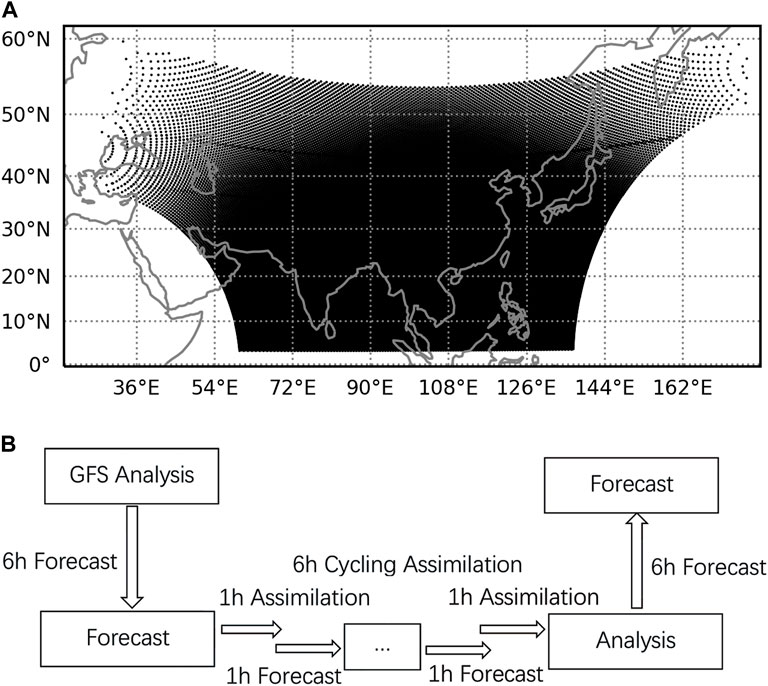
FIGURE 1. (A) Observation distribution of the GIIRS in 2 h. (B) Assimilation/forecast cycle. The assimilation/forecast cycles were performed every hour from August 22 to 27, 2022.
The Diverse 52 profile dataset from the Numerical Weather Prediction Satellite Application Facility was augmented as the profile data in the channel selection. These data are produced by the forecast field statistics generated by the ensemble forecast system of the European Centre for Medium-Range Weather Forecasts (ECMWF). The data have 60 layers, including temperature, humidity, and ozone. This dataset is widely used in the evaluation of statistical regression and radiation transmission models.
The WRF4.2 model developed by the National Center for Atmospheric Research was used for the assimilation forecast experiment. This integrated system includes the WRF preprocessing system, the WRFDA system, the Advanced Research WRF numerical model system, and a post-processing system. The Advanced Research WRF model contains multiple physical process packages that can simulate atmospheric motion at scales from tens of meters to thousands of kilometers. The WRFDA supports 3DVAR, 4DVAR, and mixed assimilation of 3DVAR and 4DVAR. It also integrates the assimilation interfaces of various conventional observational datasets, remote sensing data, and radar data. The WRF4.2 model is widely used in atmospheric research, including in numerical simulations, data assimilation, parameterization, and coupled models. We developed the assimilation interface of the GIIRS using the Radiative Transfer for TOVS (RTTOV) fast radiation transmission model to directly assimilate the radiation observations from the GIIRS. Through this interface, the WRFDA system can read the GIIRS level 1 data directly in the hierarchical data format, perform quality control and bias correction in the system, and carry out the assimilation analysis.
The GIIRS completes a regional scan every 2 h; therefore, we adopted an hourly cycle assimilation scheme (Figure 1B) to make full use of the high-resolution satellite data. The GIIRS data were grouped into 1-h intervals to input into the three-dimensional variational data assimilation system at every analysis point. A 6-h forecast was produced from the initial Global Forecast System data, followed by a 6-h assimilation/forecast cycle. In every 6-h assimilation/forecast cycle, the observations were assimilated using the previous 1-h model forecast as a background to produce a new estimate of the three-dimensional atmospheric fields. The new 1-h model forecast was produced from the analysis obtained from the previous assimilation. After a 6-h assimilation/forecast cycle, a 6-h forecast was carried out to analyze the tropical cyclone. This cycling assimilation process was repeated every hour to give an hourly analysis of the tropical cyclone. We respectively performed a control experiment assimilating only conventional observations and an assimilation experiment assimilating conventional observations and GIIRS radiances.
3 Cloud detection, channel selection, and bias correction
Based on the characteristics of the infrared hyperspectral data from the FY-4A satellite, we preprocessed the observational data using cloud detection, channel selection, bias correction, and quality control. In contrast with the pixel cloud detection commonly used in infrared remote sensing data, we adopted channel cloud detection, in which radiance observations with high weighting functions remained even if the pixel was covered by cloud. We used the Shannon information entropy method to select a channel subset without damaging the amount of observational information. The redundant channels were eliminated, reducing the computational burden. As differences in instrument performance lead to different sensitivities of the loads to the predictors in bias correction, we performed a predictor sensitivity analysis to obtain the appropriate predictors for bias correction of the air mass.
3.1 Cloud detection
The GIIRS has thousands of channels and provides finer-resolution information in the vertical direction. Radiance observations that are contaminated by clouds can be identified by comparing the cloud-top height and the channel height, as proposed by McNally and Watts (2003) and developed by Clarisse et al. (2010), Eresmaa (2014), Eresmaa (2017), Letertre-Danczak (2016), and Eresmaa et al. (2020). This method is currently used in operational numerical prediction by the ECMWF and the UK Met Office. This method uses numerical forecast data to compare the observed and simulated radiance spectra and identify the channels contaminated by clouds. Its performance largely depends on the quality of the numerical model. We used the AGRI cloud-top product to avoid the impact of the bias of the numerical model in the spectral comparison. The AGRI cloud-top height product is a real-time product of the National Satellite Meteorological Center of China. The identification accuracy of the cloud-top height has been verified to be about 50 km (Wang et al., 2022), which satisfied our need for channel cloud detection. The AGRI cloud-top height product has been matched to the GIIRS pixels as the operational product distributed to the public. The peak height of the channel-weighting function is variable because of the influence of water vapor in the atmosphere. To accurately determine the channels contaminated by clouds, we calculated the real-time channel height of the assimilated GIIRS data from the temperature and humidity profiles output by the numerical model. The overcast radiance was calculated when black clouds were simulated at all levels of each profile. Black clouds are clouds that are assumed to be completely opaque to satellites above the cloud layer. The channel height is determined by the following equation:
In which the radiance for the channel is assumed to be an opaque, black cloud at level i. The left-hand side of the equation is calculated layer-by-layer. When the calculated value of C ≤ 0.01, the height of this layer is the channel height. We used RTTOV13 for radiance transfer simulation. The Fifth Generation ECMWF reanalysis (ERA5) dataset was used for the radiance simulation. The channels with heights higher than the cloud-top heights were identified as clear-sky channels and retained. Six channels with different heights were selected to check the effects of cloud detection. Table 2 shows the channel heights of these six channels and the proportions of observations remaining after cloud detection in the original data. Most observations in the level closest to the Earth’s surface were contaminated by clouds, and only about 1% of the observations remained. In contrast, the reserved observations reached 90% in the upper troposphere channels, and about 50% of the observations in the mid-troposphere were retained. In general, the number of observations was higher than those with pixel cloud detection.
3.2 Channel selection
We augmented the fast radiation transfer model RTTOV13 based on the Diverse 52 profile set to calculate the sensitivity of the atmosphere variables in the full spectrum. The profile temperature, surface temperature, ozone, and humidity were perturbed separately (the profile temperature and surface temperature were perturbed by 1°C, and the ozone and humidity were perturbed by 10%). The difference between the radiation before and after perturbation was defined as the sensitivity for that quantity. The channels sensitive to surface temperature, ozone, and humidity were then removed from the temperature-sensitive channels so that only the temperature-sensitive channels remained. These temperature-sensitive channels of the GIIRS were mainly in two spectral bands: the carbon dioxide absorption band at 670 cm−1 and the water vapor absorption band at 625 cm−1. After the other channels had been removed, 170 temperature-sensitive channels were used in the subsequent information entropy calculation (Collard A. 2007). The information content of each channel was calculated based on this temperature subset. The calculation formulas of the information content
where K is the Jacobian for temperature. The channel information content is sorted from high to low and 30 channels with high information content are selected (Figure 2A). The rest of redundant channels are removed. The information content of selected channels is about 90% of the total temperature channels.
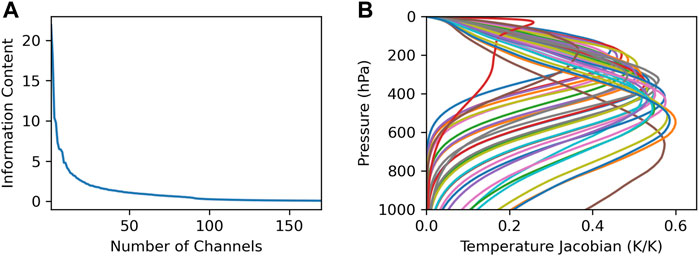
FIGURE 2. (A) Channel information content and (B) Jacobian matrix for the temperature in the selected channels.
3.3 Bias correction and quality control
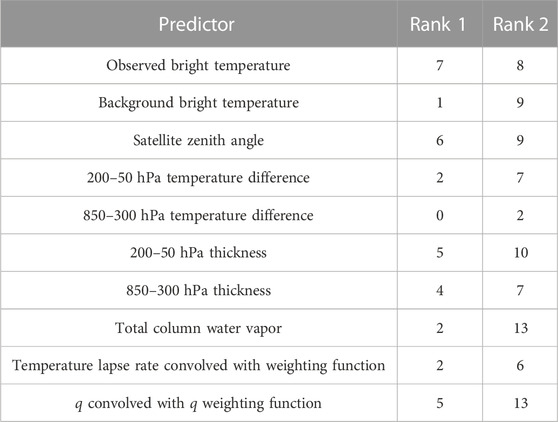
The radiance observed by the satellite remote sensing instrument was biased due to errors associated with the radiative transfer model and the instrument calibration. The bias was modeled in terms of atmospheric parameters referred to as bias predictors. The bias can be forecast and corrected using the bias predictors. We selected 10 predictors commonly used by other instruments and calculated the correlation coefficients between the observation minus the background of each channel and the predictors. The predictors were ranked in two levels based on the correlation coefficients. The first rank contained the channels with correlation coefficients >0.6, while the second rank contained the channels with correlation coefficients between 0.4 and 0.6. Table 3 shows the channel numbers of each predictor in the first and second ranks. Predictors with more than five channels in rank 1 or more than 10 channels in two ranks were selected. Finally, the predictors observed that brightness temperature, satellite zenith angle, 200–500 hPa air column thickness, 300–850 hPa air column thickness, total column water vapor, and the humidity convolved with the weight function had higher correlation coefficients. Therefore, these six quantities were selected to correct the bias. The bias correction formula was as follows:
where
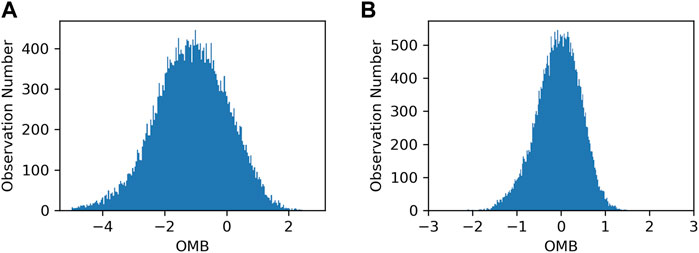
FIGURE 3. Radiance observation bias statistics (A) before and (B) after bias correction. OMB (unit: K), observation minus background.
4 Results
To evaluate the impact of the FY4-GIIRS data assimilation on the forecast of tropical cyclones, we carried out a forecasting experiment for Typhoon Bavi (August 2020) from 00:00 of August 22 to 23:00 of August 28. After 6 h of cycling assimilation, 6 h forecasts were performed in this period. This assimilation/forecast cycle was performed hourly to obtain an analysis and forecast. We evaluated the forecast for Bavi against observational data to evaluate the success of the assimilation. We also analyzed the observation impact and tried to determine the reasons for the improved forecast. Typhoon Bavi was the eighth typhoon in 2020. It formed over the ocean east of Taiwan on August 22, 2020, and made landfall at 08:30 on August 27 in North Phyongan Province, North Korea. It entered northeast China at 11:00 and then weakened rapidly. It was no longer classed as a typhoon at 20:00 on August 27. This typical northward-moving typhoon lasted for 41 h and had a maximum wind force of level 14.
4.1 Forecast evaluation
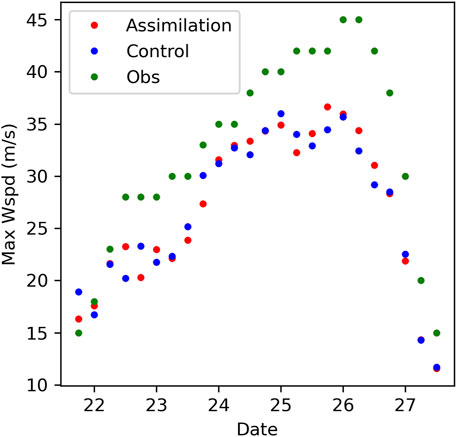
We expected that assimilation would improve the temperature field. In contrast with the reanalysis dataset, which is biased because of the numerical model, radiosonde observations are of high quality. There are >200 radiosonde stations in China, most of which are in southeast China near areas frequently affected by typhoons. We used the temperature profiles of radiosondes to validate the 6-h forecast (Figure 4). The temperature field at 800–500 hPa was improved. The root-mean-square error (RMSE) of the temperature after assimilation was about 2% less than that before assimilation, with a maximum improvement (about 4%) at 800 hPa. The peak of the GIIRS channels in the upper troposphere had little chance of being contaminated by clouds; therefore, the temperature above 800 hPa showed a greater improvement than the temperatures in the other layers. The improvement of the RMSE of the temperature in the west and north of China was greater above 500 hPa, whereas the improvement from the ground to the lower troposphere was greater in southeast China (Figure 5). In some areas, the RMSE was larger after the GIIRS assimilation than before. This error may arise from uncertainties in the emissivity of the land or regional differences in the quality of GIIRS data. Further investigations are required. The track and intensity are important indexes for forecasting tropical cyclones. The models with or without GIIRS assimilation can both predict the tropical cyclone track well, with errors <50 km. In the control experiment before assimilation, the RMSE of the prediction of the tropical cyclone intensity was 6.88 m s−1, whereas that after assimilation was 6.58 m s−1, a reduction of 0.3 m s−1 (Figure 6). Typhoon Bavi brought strong rainfall, with average rainfall in northeast China of 35 mm. Figure 7 shows the distributions of the accumulated precipitation in the observations and the assimilation and control experiments during the typhoon. The rain belt was mainly located in northeast China and the southeastern coastal areas of China (Jiangsu and Zhejiang provinces). The rainfall forecasts after assimilation were better than those in the control experiment in both areas, particularly in the southeastern coastal area. The cold, weak airflow from the north met the warm, wet airflow of the monsoon tailed with Typhoon Bavi at the sea surface; the updraft in this area resulted in strong precipitation. The assimilation of the GIIRS improved the transfer of water vapor, improving the precipitation forecast (Figure 8). Therefore, we concluded that, for this infrared instrument, the improvement in the forecast was not dependent on correcting the typhoon circulation directly, but rather on correcting the outer circulation of the typhoon. An analysis of the threat and Heidke skill scores of precipitation showed that the precipitation scores were much higher than in the control experiment (Figure 9).
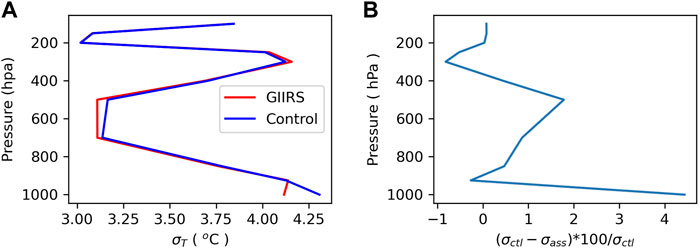
FIGURE 4. RMSE in the assimilation process from August 22 to 27 for (A) temperature and (B) percentage reduction in the RMSE for temperature.
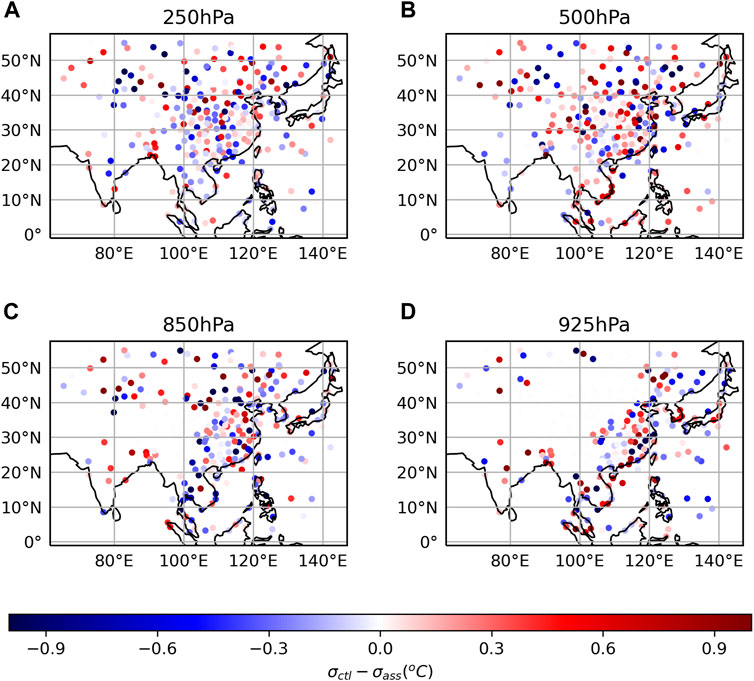
FIGURE 5. RMSE temperature difference respectively at (A) 250hPa (B) 500hPa (C) 850hPa (D) 925hPa from 22th to 27th of August between the control and assimilation experiments at the radiosonde stations. Positive values show that the assimilation is better than the control experiment.
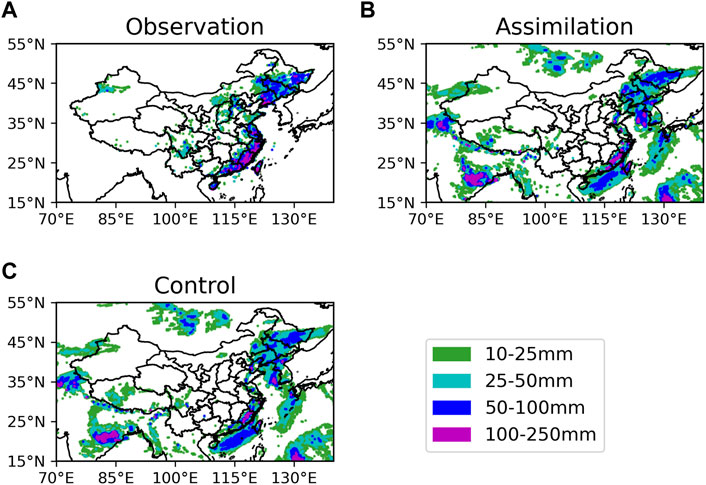
FIGURE 7. Distribution of accumulated precipitation during Typhoon Bavi from August 22 to 27. (A) Observations from in situ data. (B) Precipitation with GIIRS assimilation. (C) Precipitation control experiment without GIIRS assimilation.
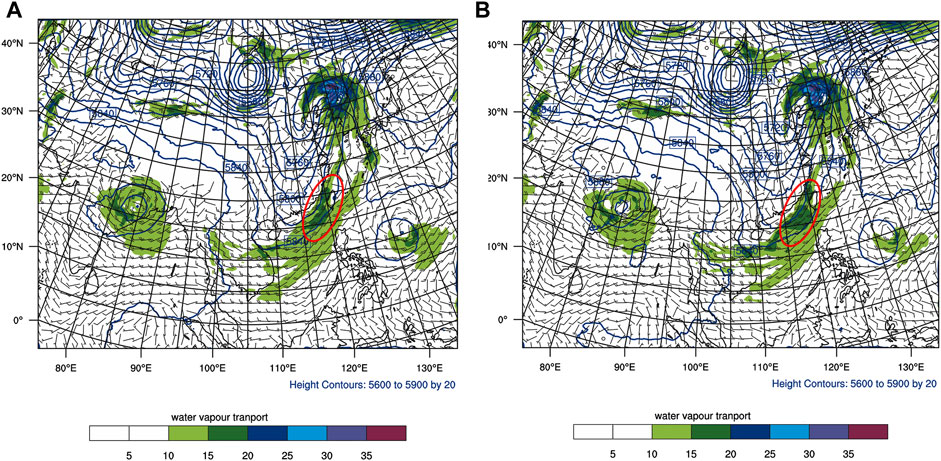
FIGURE 8. Water vapor transfer (Units: kg·(hPa)−1m−1s−1)) for Typhoon Bavi at 06:00 on August 26, 2020, in (A) the control experiment and (B) the assimilation experiment of the GIIRS.
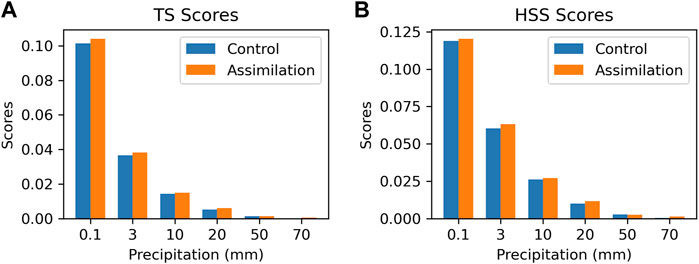
FIGURE 9. (A) TS forecast scores and (B) HSS forecast scores of precipitation during Typhoon Bavi from August 22 to 27.
4.2 Observational impact on the analysis
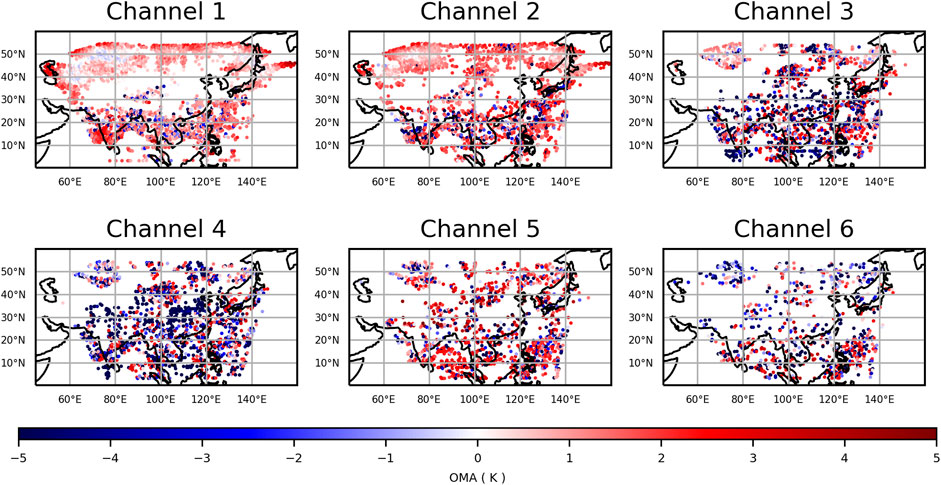
The present study focused on the assimilation of temperature channels in the long waveband. As shown in the weighting function of channels (Figure 2B), the information we expect to obtain from the observations will mainly come from 500 hPa to 200 hPa of the atmosphere. We expect that the most significant effects will occur in the middle and upper troposphere layers. We first examined the OMA (observation minus background) of the brightness temperature. The analysis selected six channels with a weighting function peak at approximately 200 hPa (Ch1 and Ch2), 300 hPa (Ch3 and Ch4), and 500 hPa (Ch5 and Ch6) (Figure 10). The OMA in the high-level channels of Ch1 and Ch2 had similar patterns and were positive in most areas. The OMA in the lower-level channels of Ch3–Ch6 showed no obvious bias and were larger than those in the high-level channels. The high-level channels will not deteriorate due to poor emissivity or clouds and have high quality. As expected, the OMA showed the most improvement for the upper layer temperature in the GIIRS assimilation. Therefore, the optimization of the air temperature of the upper layers provided better forecasts of temperature profiles compared to the CTL experiment shown in Figure 4.
The intensity and precipitation of Bavi also improved according to the forecast verification. Water vapor in the middle and upper layers of the troposphere is vital for typhoon intensification (Kaplan et al., 2003). With water vapor transport near the typhoon, convection develops and latent heat is released near the center of the typhoon, leading to rapid intensification. We examined the variations in relative humidity in the upper layers. From the average relative humidity around 400 km from the typhoon center, we calculated an index representing the relative humidity variation (Figure 11). We observed a significant increase in relative humidity at 12:00 on August 25, after which Bavi strengthened and reached its maximum wind speed at 6:00 on August 26. During this time, the relative humidity modeled in ERA5 was near-saturation, with a value >70% from 300 hPa to 200 hPa (Figure 11A). The relative humidity of the analysis near the center of the typhoon was larger than that in the CTL, which explained the larger typhoon intensity forecast compared to that in the CTL.
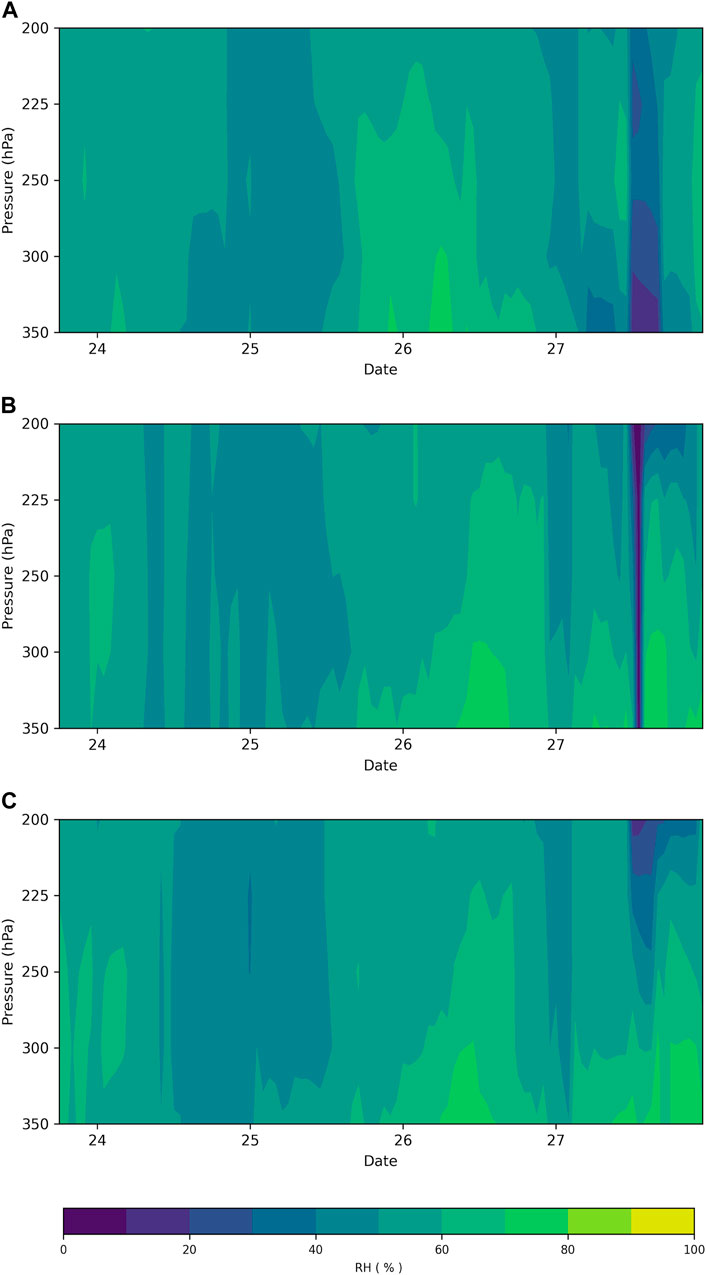
FIGURE 11. Relative humidity variation of (A) ERA5, (B) assimilation, and (C) CTL during Typhoon Bavi.
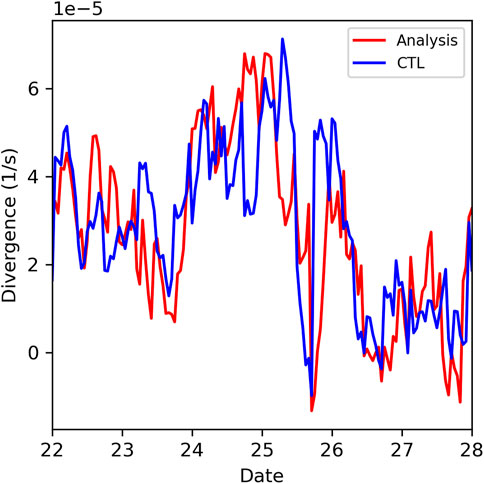
TC upper-level outflow can interact with the upper-level larger-scale environment and the inner core of a TC, thereby playing a mediating role between the environment and the storm core. A stronger outflow implies a stronger typhoon. The strongest TC outflow is, on average, concentrated at the troposphere upper layer and around 500 km from the TC center (W. A. Komaromi et al., 2017). The present study defined the TC outflow as the area-averaged divergence over the 8° × 8° latitude-longitude box around the TC center, at 150 hPa. Two TC outflow peaks were observed. The first occurred at the beginning of the typhoon, and the second was observed from August 24 to 26. Compared to the CTL, the TC outflow in the analysis was much stronger at most time points (Figure 12). Particularly at the beginning of TC formation and the day before TC intensity peaked, the TC outflow in the analysis was larger than that in the CTL.
5 Discussion and conclusions
Typhoons are high-impact weather systems that can lead to disasters; therefore, they require highly accurate forecasts. Satellite remote sensing data are important in the numerical weather prediction of typhoons due to the lack of conventional observational data at sea. Infrared hyperspectral data from geostationary satellites with a high spatiotemporal resolution have great value in regional numerical weather forecasts. The GIIRS on the FY-4 satellite is the world’s only hyperspectral instrument onboard a geostationary satellite. We carried out an assimilation/forecast experiment for Typhoon Bavi using the WRF model and WRFDA. To make full use of the high-resolution time data from geostationary satellites, we designed a rapidly updating assimilation scheme with hourly cycle assimilation and evaluated the GIIRS for 6-h weather forecasts of typhoons. We selected 30 channels with high information content based on Shannon information entropy for assimilation and removed the redundant channels. To make full use of the observational information, we used the cloud-top height product of the National Satellite Meteorological Center to remove channels contaminated by clouds through the channel height calculated in real-time and reserved the clear-sky channel for assimilation. We selected the six predictors with the largest correlation coefficients through hierarchical sensitivity analysis of the bias predictors. We then effectively corrected the GIIRS bias after verification.
We carried out a 6-day assimilation forecast experiment from the formation of Typhoon Bavi from August 22 until its dissipation. We evaluated the experimental results using the radiosonde and ground station precipitation data for China. The evaluation results showed that the assimilation of the temperature channel of the GIIRS improved the temperature. The RMSE of the temperature from the ground to the upper troposphere was reduced by 2% compared to the control experiment. The maximum improvement was in the mid- and upper troposphere from 800 to 500 hPa. The track prediction of the typhoon was consistent with that of the control experiment, with an RMSE of 50 km. The prediction of the intensity of the typhoon was slightly improved.
The GIIRS provides many more water vapor channels. During typhoon formation, intensification, and decay, we believe that water vapor plays a vital role. Therefore, in the future we should use more GIIRS channels in the assimilation to make full use of the data. In this study, we used the more mature 3DVAR assimilation method. The GIIRS loaded in the FY4A geostationary satellite has an even higher time resolution and 4DVAR is more appropriate. Although we showed the benefit of the GIIRS assimilation in typhoon Bavi, more typhoon cases are needed to verify our data.
The analysis of the precipitation forecast showed that infrared hyperspectral radiation was unable to penetrate the deep clouds of the typhoon, so it was difficult to directly improve the atmospheric environmental field in the center of the typhoon. However, the improvement in the mid- and high-level temperature fields around the typhoon changed the environmental circulation, enhanced the transport of water vapor in the troposphere, and significantly improved the precipitation forecast around the typhoon. Therefore, we believe that the assimilation of the temperature channel of the infrared hyperspectral data from the GIIRS can improve the 6-h forecast of typhoons, which is of great value for their analysis and prediction. Based on the real-time preprocessing and assimilation capability of the WRFDA real-time assimilation system established here, we will perform more assimilation prediction experiments to further verify the value of the GIIRS in numerical weather prediction.
Data availability statement
The original contributions presented in the study are included in the article/Supplementary materials, Further inquiries can be directed to the corresponding author.
Author contributions
XX: methodology, writing—original draft, and review and editing; QL: conceptualization, and review and editing; XL: data curation; WS: visualization.
Funding
This study was supported by the Chinese Nature Science Foundation (42130605) and Chinese Nature Science Foundation (42175016).
Conflict of interest
The authors declare that the research was conducted in the absence of any commercial or financial relationships that could be construed as a potential conflict of interest.
Publisher’s note
All claims expressed in this article are solely those of the authors and do not necessarily represent those of their affiliated organizations, or those of the publisher, the editors, and the reviewers. Any product that may be evaluated in this article, or claim that may be made by its manufacturer, is not guaranteed or endorsed by the publisher.
References
Antonelli, P., Revercomb, H. E., Sromovsky, L. A., Smith, W. L., Knuteson, R. O., Tobin, D. C., et al. (2004). A principal component noise filter for high spectral resolution infrared measurements. J. Geophys. Res. 109, D23102–D23124. doi:10.1029/2004JD004862
Barker, D., Huang, X.-Y., Liu, Z., Auligné, T., Zhang, X., Rugg, S., et al. (2012). The weather research and forecasting model's community variational/ensemble data assimilation system: Wrfda. Bull. Amer. Meteor. Soc. 93, 831–843. doi:10.1175/bams-d-11-00167.1
Barker, D. M., Huang, W., Guo, Y. R., and Xiao, Q. N. (2004). A three-dimensional (3DVAR) data assimilation system for use with MM5: Implementation and initial results. Mon. Wea. Rev. 132, 897–914. doi:10.1175/1520-0493(2004)132<0897:ATVDAS>2.0.CO;2
Bormann, N., Bonavita, M., Dragani, R., Eresmaa, R., Matricardi, M., and McNally, A. (2016). Enhancing the impact of IASI observations through an updated observation-error covariance matrix. Quart. J. Roy. Meteor. Soc. 142, 1767–1780. doi:10.1002/qj.2774
Cameron, J., Collard, A., and English, S. (2005). “Operational use of AIRS observations at the Met. Office,”Proceedings of the Fourteenth International TOVS Study Conference, Beijing, China, 25–31.
Clarisse, L., Prata, F., Lacour, J.-L., Hurtmans, D., Clerbaux, C., and Coheur, P.-F. (2010). A correlation method for volcanic ash detection using hyperspectral infrared measurements. Geophys. Res. Lett. 37, 332. doi:10.1029/2010gl044828
Collard, A. (2007). Selection of IASI channels for use in numerical weather prediction. Q. J. R. Meteorol. Soc. 133, 1977–1991. doi:10.1002/qj.178
Collard, A. D. (2001). “Assimilation of IASI and AIRS data: Information content and quality control,” in Proceedings of the ECMWF Seminar on Exploitation of the New Generation, New York, NY, USA.
Collard, A. D., McNally, A. P., Hilton, F. I., Healy, S. B., and Atkinson, N. C. (2010). The use of principal component analysis for the assimilation of high-resolution infrared sounder observations for numerical weather prediction. Q. J. R. Meteorol. Soc. 136, 2038–2050. doi:10.1002/qj.701
Collard, A., and McNally, A. P. (2009). The assimilation of infrared atmospheric sounding interferometer radiances at ECMWF. Q. J. R. Meteorol. Soc. 135, 1044–1058. doi:10.1002/qj.410
Eresmaa, R. (2014). Imager-assisted cloud detection for assimilation of infrared atmospheric sounding interferometer radiances. Q. J. R. Meteorol. Soc. 140, 2342–2352. doi:10.1002/qj.2304
Eresmaa, R., Letertre-Danczak, J., Lupu, C., Bormann, N., and McNally, A. P. (2017). The assimilation of cross-track infrared sounder radiances at ECMWF. Q. J. R. Meteorol. Soc. 143, 3177–3188. doi:10.1002/qj.3171
Eresmaa, R., Letertre-Danczak, J., and McNally, A. P. (2020). “Screening routines for aerosol and trace-gas-affected infrared radiances,”Proceedings of the 22nd International TOVS Study Conference, Saint-Sauveur, Canada.
Han, W., Yin, R., Di, D., Li, J., Wang, J., Shen, X., et al. (2019). “Assimilation of high temporal resolution giirs in global 4D-var,”Proceedings of the 2019 Joint Satellite Conference, Boston, USA.
Hilton, F., Atkinson, N. C., English, S. J., and Eyre, J. R. (2009). Assimilation of IASI at the Met Office and assessment of its impact through observing system experiments. Quart. J. Roy. Meteor. Soc. 135, 495–505. doi:10.1002/qj.379
Joiner, J., Brin, E., Treadon, R., Derber, J., Van Delst, P., Da Silva, A., et al. (2007). Effects of data selection and error specification on the assimilation of AIRS data. Q. J. R. Meteorol. Soc. 133, 181–196. doi:10.1002/qj.8
Kaplan, J., and DeMaria, M. (2003). Large-scale characteristics of rapidly intensifying tropical cyclones in the North Atlantic basin. Weather Forecast. 18 (6), 1093–1108. doi:10.1175/1520-0434(2003)018<1093:lcorit>2.0.co;2
Komaromi, W. A., and Doyle, J. D. (2017). Tropical cyclone outflow and warm core structure as revealed by HS3 dropsonde data. Mon. Weather Rev. 4, 1339–1359. doi:10.1175/mwr-d-16-0172.1
Letertre-Danczak, J. (2016). The use of geostationary radiance observations at ECMWF and aerosol detection for hyper-spectral infrared sounders: 1st and 2nd years report. EUMETSAT/ECMWF Fellowsh. Programme Res. Rep., 40, 18.
Li, J., Geer, A. J., Okamoto, K., Otkin, J. A., Liu, Z., Han, W., et al. (2022a). Satellite all-sky infrared radiance assimilation: Recent progress and future perspectives. Adv. Atmos. Sci. 39, 1–13.
Li, J., and Liu, H. (2009). Improved hurricane track and intensity forecast using single field-of-view advanced IR sounding measurements. Geophys. Res. Lett. 36, L11813. doi:10.1029/2009gl038285
Li, J., Zhang, Y., Di, D., Ma, Z., Li, Z., Schmit, T. J., et al. (2022b). The influence of sub-footprint cloudiness on three-dimensional horizontal wind from geostationary hyperspectral infrared sounder observations. Geophys. Res. Lett. 49, e2022GL098460. doi:10.1029/2022gl098460
Liu, H., and Li, J. (2010). An improvement in forecasting rapid intensification of typhoon Sinlaku (2008) using clear-sky full spatial resolution advanced IR soundings. J. Appl. Meteorol. Clim. 49, 821–827. doi:10.1175/2009jamc2374.1
Marshall, L., and Coauthors, J. (2006). Improving global analysis and forecasting with AIRS. Bull. Amer. Meteor. Soc. 87 (7), 891–895. doi:10.1175/BAMS-87-7-891
McNally, A. P., and Watts, P. D. (2003). A cloud detection algorithm for high-spectral-resolution infrared sounders. Q. J. R. Meteorol. Soc. 129, 3411–3423. doi:10.1256/qj.02.208
McNally, A. P., Watts, P., Smith, J., Engelen, R., Kelly, G., Thepaut, J. N., et al. (2006). The assimilation of AIRS radiance data at ECMWF. Q. J. R. Meteorol. Soc. 132, 935–957. doi:10.1256/qj.04.171
Reale, O., McGrath-Spangler, E. L., McCarty, W., Holdaway, D., and Gelaro, R. (2018). Impact of adaptively thinned AIRS cloud-cleared radiances on tropical cyclone representation in a global data assimilation and forecast system. Weather Forecast 33 (4), 909–931. doi:10.1175/waf-d-17-0175.1
Skamarock, W. C., Klemp, J. B., Dudhia, J., Gill, D. O., Liu, Z., Berner, J., et al. (2019). A description of the advanced research WRF version 4. NCAR Tech.Rep. Natl. Cent. Atmos. Res. Boulder Co Mesoscale Microscale 4. doi:10.5065/1dfh-6p97
Wang, F., Min, M., Xu, N., Liu, C., Wang, Z., and Zhu, L. (2022). Effects of linear calibration errors at low-temperature end of thermal infrared band: Lesson from failures in cloud top property retrieval of FengYun-4A geostationary satellite. IEEE Trans. Geosci. Remote Sens. 2022 (60), 1–11. doi:10.1109/tgrs.2022.3140348
Xu, D., Liu, Z., Huang, X. Y., Min, J., and Wang, H. (2013). Impact of assimilating IASI radiance observations on forecasts of two tropical cyclones. Meteorol. Atmos. Phys. 122, 1–18. doi:10.1007/s00703-013-0276-2
Yang, J., Zhang, Z. Q., Wei, C. Y., Lu, F., and Guo, Q. (2017). Introducing the new generation of Chinese geostationary weather satellites, Fengyun-4. Bull. Am. Meteorol. Soc. 98, 1637–1658. doi:10.1175/bams-d-16-0065.1
Yin, R., Han, W., Gao, Z., and Di, D. (2020). The evaluation of FY4A’s Geostationary Interferometric Infrared Sounder (GIIRS) longwave temperature sounding channels using the GRAPES global 4D-Var. Q. J. R. Meteorol. Soc. 146, 1459–1476. doi:10.1002/qj.3746
Yin, R., Han, W., Gao, Z., and Li, J. (2021). Impact of high temporal resolution FY-4A Geostationary Interferometric Infrared Sounder (GIIRS) radiance measurements on typhoon forecasts: Maria (2018) case with GRAPES Global 4D-Var assimilation system. Geophys. Res. Lett. 48, e2021GL093672. doi:10.1029/2021gl093672
Keywords: GIIRS, Typhoon Bavi, hyperspectral radiance, typhoons, 3DVAR
Citation: Xiao X, Lu Q, Lv X and Shen W (2023) Assimilation of FY-4A GIIRS radiance observations in the forecast of Typhoon Bavi. Front. Earth Sci. 10:1033474. doi: 10.3389/feart.2022.1033474
Received: 31 August 2022; Accepted: 28 December 2022;
Published: 17 January 2023.
Edited by:
Sheng Chen, Northwest Institute of Eco-Environment and Resources (CAS), ChinaReviewed by:
Wei-Bo Chen, National Science and Technology Center for Disaster Reduction (NCDR), TaiwanFeifei Shen, Nanjing University of Information Science and Technology, China
Chao Liu, Nanjing University of Information Science and Technology, China
Copyright © 2023 Xiao, Lu, Lv and Shen. This is an open-access article distributed under the terms of the Creative Commons Attribution License (CC BY). The use, distribution or reproduction in other forums is permitted, provided the original author(s) and the copyright owner(s) are credited and that the original publication in this journal is cited, in accordance with accepted academic practice. No use, distribution or reproduction is permitted which does not comply with these terms.
*Correspondence: Qifeng Lu, bHVxZkBjbWEuY24=
 Xianjun Xiao
 Qifeng Lu1,2*