 Xiangliang Qiu
 Li Ding2
- 1Xi’an Shiyou University, School of Petroleum Engineering, Xi’an, China
- 2PetroChina Changqing Oilfield Shale Oil Development Branch, Qingyang, China
- 3The Fifth Oil Production Plant of Petrochina Changqing Oil Field Company, Xi’an, China
- 4The Seventh Oil Production Plant of PetroChina Changqing Oilfield Company, Qingyang, China
- 5Xi’an Shiyou University, School of Earth Science and Engineering, Xi’an, China
In order to establish a quantitative evaluation system for reservoir quality suitable for tight oil sandstones, in this study, taking the Chang 7 Member in the Maling area of the Ordos Basin as an example, the nuclear magnetic resonance, clay mineral analysis, high pressure mercury injection analysis and logging interpretation technology have been used to carry out a comprehensive evaluation of the pore structures, sand body structures and oil-bearing properties of tight oil sandstone reservoirs. The results show that the pseudo-capillary pressure curves transformed by the NMR T2 spectra are consistent with the capillary pressure curves measured by the core experiments. This method can be used for accurate characterization of the pore structures of the reservoir. The pore structure parameters calculated based on the pseudo-capillary pressure curves can accurately reflect the pore structures of the reservoirs such as micropores-thin throats and complex tortuosity. At the same time, the smoothness feature of conventional logging curves is used to evaluate the sand body structures and heterogeneity of the reservoir, and the apparent energy storage coefficient is introduced to quantitatively evaluate the oil-bearing properties of tight oil reservoirs. The evaluation results are in good agreement with the actual production situation. The larger the apparent energy storage coefficient, the higher the initial output of the oil wells. The evaluation results of the reservoir quality of the tight oil sandstones constructed in this paper are highly consistent with the production status, so the method has broad application prospects.
1 Introduction
At present, tight oil, which enjoys the reputation of “black gold” in the world oil industry, has become a new bright spot in the exploration and development of unconventional oil and gas. The United States and Canada have made breakthroughs in the key technical fields of tight oil development (Yao et al., 2013; Han et al., 2019; Li Y. et al., 2021; Lai et al., 2022a). China has abundant tight oil resources, which are mainly distributed in the Bohai Bay Basin, the Ordos Basin and the Sichuan Basin. Considerable geological reserves of tight oil resources represent that tight oil has broad development prospects. In recent years, many scholars around the world have achieved a lot of results in tight oil exploration and development. For example, Yang et al., (Zhang et al., 2018) redefined it according to the actual situation of different tight oil reservoirs; Zou et al. and Fu et al.(Jia et al., 2016; Jia et al., 2016; Yang et al., 2019) conducted a systematic study on the accumulation type, development characteristics and formation mechanism of tight oil in China; Zou et al. (2013), Li et al. (2019), Li et al. (2022) conducted an in-depth analysis of the accumulation conditions of tight oil, and determined the main controlling factors of hydrocarbon accumulations. In the evaluation of reservoir quality of tight oil sandstones, the difficulties in logging interpretation are mainly reflected in the following two aspects: (1) The geological and petrophysical characteristics of tight oil reservoirs are complex, but the resolution ability of conventional logging series is low and the amount of information is insufficient. Therefore, it is urgent to carry out new logging techniques, new method tests and optimization of logging parameter series; (2) The current logging evaluation of tight oil sandstone reservoirs basically follows the idea of low permeability reservoirs, and its adaptability is obviously insufficient. Therefore, the logging evaluation contents, methods and standards of reservoir quality need to be evaluated (Yao et al., 2013; Zou et al., 2013; Neves et al., 2019; Hassane et al., 2021; Zhang et al., 2020).
Generally, the pore structure of reservoir rocks is the main factor affecting the storage capacity of reservoir fluids (oil, gas, water) and the efficiency of oil and gas recovery (Jia et al., 2016; Iferobia et al., 2019; Yang et al., 2019; Zhu et al., 2019; Li J. et al., 2022). The pore structures of the Chang 7 reservoir in the Ordos Basin is characterized by fine pore throats, complex tortuosity, high capillary pressure, and complex rock and mineral components. The reservoir space is mainly secondary dissolved pores. Rock composition, pore type, pore size, fracture development and the matching relationship between these parameters are important factors for whether a tight oil reservoir can become an effective reservoir. How to define the main controlling factors of reservoir quality on the basis of petrophysical research is an important content of logging evaluation of tight sandstone reservoirs (Zhang et al., 2018; Li et al., 2019; Fan et al., 2022; Li H. et al., 2022; Li, 2022; Lu et al., 2022). Therefore, in this paper, the evaluation of rock composition and pore structures is selected as the core of reservoir quality evaluation. This research is of great significance for the rational and efficient development of tight oil sandstone reservoirs.
2 Geological background
The Maling area of the Ordos Basin is located in the northwest of the Qingcheng area. Its tectonic structure is located in the east of the Tianhuan Depression and the west of the Yishan Slope (Figure 1). Multiple sets of source-reservoir-caprock assemblages developed in the Upper Triassic Yanchang Formation. According to the sedimentary cycle, the Yanchang Formation is divided into 10 oil layers from the Chang 10 to Chang 1 Members from bottom to top. The sedimentary evolution of the Yanchang Formation has experienced the whole process of formation, development, prosperity, decline and extinction. It belongs to a complete set of continental fluvial-delta-lake sedimentary system. Among them, during the depositional period of the Chang 7 Member, the basin entered the maximum lake flooding period, which was also the peak period of lake thermal fluid activity. The prosperity of lake algae and plankton laid the material foundation for the deposition of organic-rich shale. At this time, semi-deep lake-deep lake facies thick dark mudstone and black shale (Zhangjiatan shale) developed in the basin. The average porosity of shale reservoirs is 7.8%, and the average permeability is 0.08×10⁻³ μm2. The Chang 7 Member of the basin is subdivided into three sub-members, that is, the Chang 71, Chang 72 and Chang 73 sub-members, from top to bottom. The object of this study is the tight sandstone reservoirs of the Chang 71 and Chang 72 sub-members in the upper Chang 7 Member of the Maling area, the gravity flow sand bodies are relatively developed interbeded with the source rocks. The near-source high-pressure charging of oil and gas makes the gravity flow sandstone thin interlayers have high oil saturation (Jia et al., 2016; Zhang et al., 2018; Yang et al., 2019). Such sand bodies are the main targets for large-scale exploration and development of tight oil.
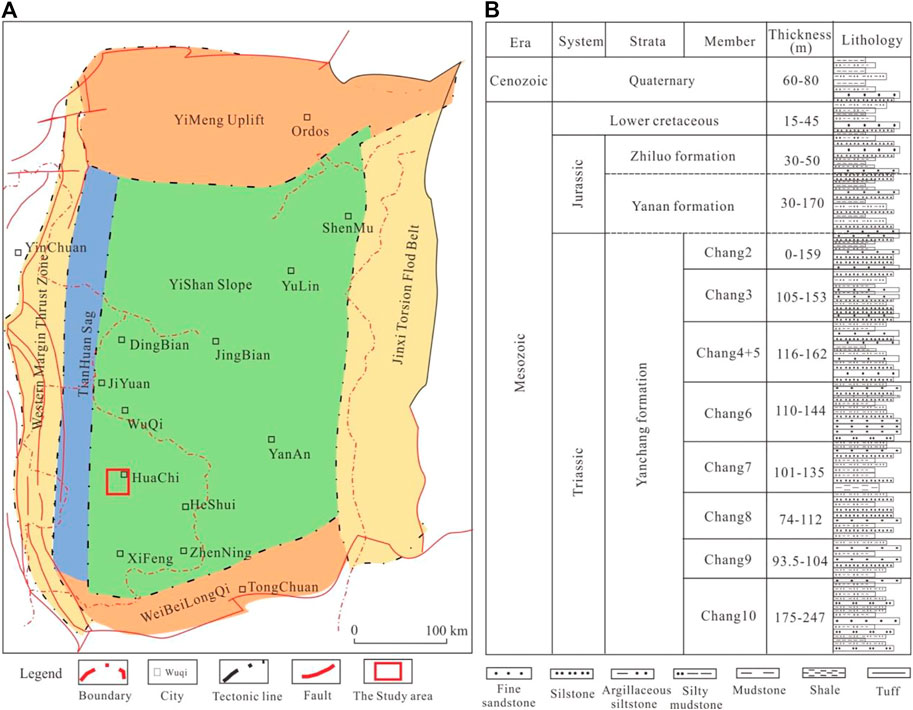
FIGURE 1. Location of study area (A) and division of stratigraphic units of Yanchang Formation (B).
Organic laminae are developed in the black shale of the Chang 7 Member in the Ordos Basin, and their total organic carbon (TOC) content ranges from 6.0% to 26.0%, with an average of 13.8%. The TOC content of dark mudstone ranges from 2.0% to 6.0%, with an average of 3.75%. In addition, the silty mudstone and siltstone associated with black shale and dark mudstone also have certain hydrocarbon generation and expulsion capabilities. Their TOC content is 0.5%–2.8%. According to the evaluation standard of source rocks, medium-good source rocks are well developed in the Chang 7 Member. Overall, the Chang 7 organic-rich shale series has good hydrocarbon-generating capacities.
3 Material and methods
In this study, samples from 15 wells (with an average burial depth of 2082 m) were selected for experimental research. The experimental items include clay mineral X-diffraction, high-pressure mercury intrusion and nuclear magnetic resonance experiments. Among them, the X-ray diffraction analysis and detection of clay minerals is based on “X-diffraction Analysis Method of Clay Minerals and Common Non-clay Minerals in Sedimentary Rocks” SY/T5163-2010, and the experimental instrument is X-ray diffraction analyzer Ultima IV. The high-pressure mercury intrusion experiment adopts the standard of “Determination of Rock Capillary Pressure Curve” SY/T5346-2005, and the experimental instrument is an AutoPore IV9505 mercury intrusion instrument. The experimental temperature was 22 °C and the humidity was 0%. The experimental instrument used for nuclear magnetic resonance is a core nuclear magnetic analyzer, the instrument number is Micro-MR02, and the experimental environment is 25°C and 97.6 KPa.
3.1 Experimental principles and methods
1) X-ray diffraction of clay minerals
X-rays are light waves with very short wavelengths and have strong penetrating power. When X-rays are injected into the lattice of clay minerals, diffraction will occur. Different clay minerals and lattices have different structures and will produce different diffraction patterns. The X-ray diffraction analysis of clay minerals is based on the fact that different clay minerals have different crystal structures, and utilizes the layered structure of clay minerals and the principle of X-ray diffraction (Nikolaev et al., 2019; Si et al., 2020; Li Z. P. et al., 2021). From the diffraction peaks, the interplanar spacing is calculated, and then different mineral types are judged.
2) High pressure mercury intrusion experiments
An AutoPore IV 9505 mercury porosimeter was used to perform high pressure mercury porosimetry. Under a given pressure, the mercury at room temperature is pressed into the pores of the rock sample, and the contact surface between the capillary and the mercury will generate a capillary force in the opposite direction to the external pressure, thereby preventing the mercury from entering the capillary. When the pressure increases above the capillary force, the mercury will continue to penetrate the pores (Li C. L. et al., 2015; Pecanha et al., 2019). Therefore, a pressure value applied from the outside can be used to measure the size of the corresponding pores. The mercury injection process is a dynamic equilibrium process. The injection pressure is approximately equal to the capillary pressure, and the corresponding capillary radius is the pore throat radius. The volume of mercury entering the pores is the volume of the pores connected by the throats. By continuously changing the mercury injection pressure, a complete capillary pressure curve can be obtained. When the mercury injection pressure increases from P1 to P2, the corresponding pore size decreases from r1 to r2, and the mercury injection amount at this stage is the corresponding pore volume between the two pore sizes. When the mercury injection pressure increases continuously, the mercury injection amount of different pore size can be measured.
3) NMR experiments
NMR analysis is based on the principle of the magnetism of the hydrogen nucleus itself and its interaction with an external magnetic field. Furthermore, the NMR relaxation signal intensities and relaxation rates in the pore fluids of the rock samples were measured and the T2 spectra were constructed (Wu et al., 2015; Sun et al., 2015; Zhou et al., 2016). This technique is used to study the pore structures and fluid distribution inside the rock. The strength of the NMR signal depends on the total amount of pore fluids in the sample, and it reflects the porosity of saturated rock samples. However, the length of the T2 relaxation time mainly depends on the force of the rock surface on the pore fluids. The larger the force, the shorter the T2 relaxation time, and it reflects the relaxation characteristics of the fluids on the surface of the pores or in the pores. The smaller the force, the longer the T2 relaxation time, and it reflects the relaxation characteristics of the fluids in the large pores. The difference in T2 relaxation time between movable water and irreducible water is used to detect the content and occurrence of irreducible and movable water in the rock samples.
A core NMR analyzer was used to carry out NMR experiments. The specific experimental steps and methods were as follows: (1) Drilling a standard core with a diameter of 25.4 mm from a full-diameter core; (2) The standard core after oil washing is then dried; (3) Measuring the gas permeability of the standard core; (4) After vacuuming, the core is saturated with simulated formation water; (5) Calculation of core porosity; (6) Nuclear magnetic resonance T2 spectrum tests.
3.2 Well logging interpretation techniques
Sandy debris flow, turbidite and slump turbidite are developed in the Chang 7 reservoir in the study area. Therefore, the Chang 7 tight sandstones have strong heterogeneity. Complex sand body structures include massive sand bodies, sand-mud interbeds, and thin sand layers (mainly in oil shale). Based on a large number of field observations, it is found that there is a good correspondence between the sand body structure and heterogeneity of the Chang 7 Member and the logging curves (Figure 2). Therefore, conventional well logs are usually selected to characterize the sand body structure and heterogeneity of the reservoir.
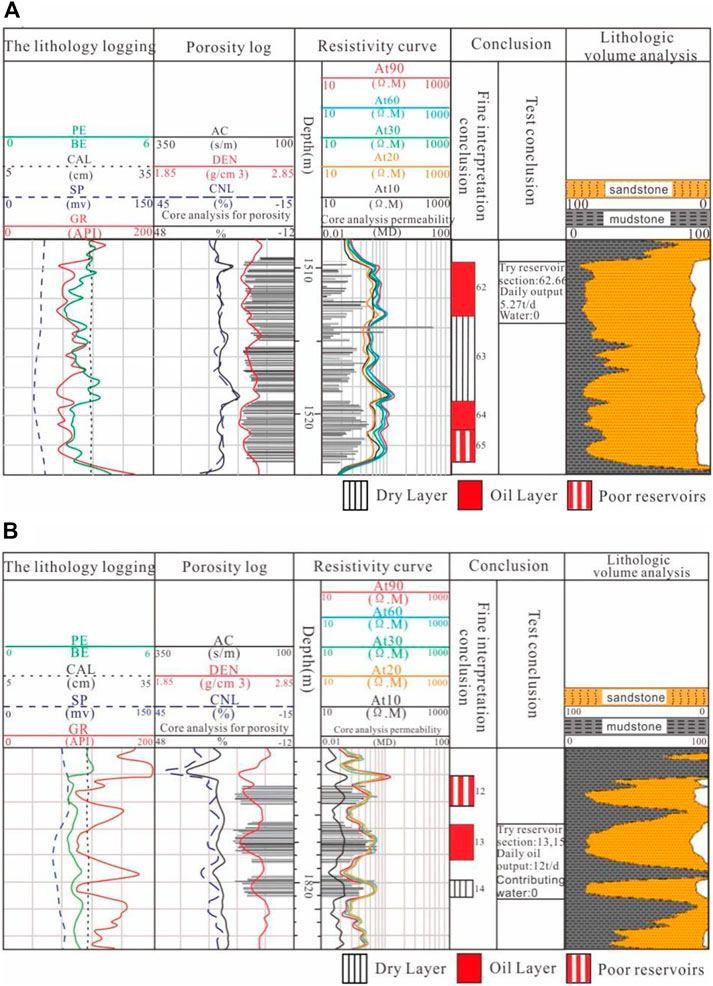
FIGURE 2. (A) Blocky sand body structure and its logging curve characteristics; (B) Interbedded sand body structure and its logging curve characteristics.
The magnitudes of the logging curves can reflect changes in sediment characteristics such as sediment particle size, sorting and shale content. Moreover, the smoothness of the logs is also closely related to the energy of the depositional environment. The parameters extracted from the logging curves can quantitatively analyze the reservoir sedimentary characteristics and sand body structures.
The smoothness of the curves reflects the duration of sediment modification by the hydrodynamic environment, and can be represented by the root of variance variance GS. In order to find Nth and GS, the difference sequence a2-a1, a3-a2, ..., an-an-1 must be constructed first. The number of difference series L can reflect the number of sawtooth, and the variance S2 can reflect the overall volatility of the data:
In order to reflect the size and number of sawtooth as a parameter, the variogram γ(h) in geostatistics is introduced. It reflects the degree of change of regionalized variables within a certain distance in a certain direction, and can reflect the randomness and structure of regionalized variables. The calculation formula is as follows:
In the formula, h is the separation distance between the two sample spaces; N(h) is the number of data pairs (ai, ai+h) with an interval of h; ai and ai+h are the measured values of the regional variable a at spatial positions i and i+h, respectively [i=1,2,…,N(h)]. The variogram reflects the magnitude of the local volatility of the data.
Since the variogram reflects the local volatility of the data, and S2 reflects the overall volatility of the data, they are combined to construct the variance root GS. In this way, it can comprehensively reflect the overall fluctuation size of the curve segment and the number and size of sawtooth, and then reflect the smoothness of the curve data. Its calculation formula is as follows:
For the logging curves, since their intervals are equal, in general, a value is measured every 0.125 m. Since the local volatility is to be reflected, the smaller h is, the better. In order to ensure the accuracy, h=1, 2. Then the above formula simplifies to:
Among them, the smaller the GS, the smoother the curve, the smaller the curve volatility, and the closer the sand body is to the block shape; on the contrary, the larger the GS, the less smooth the curve and the greater the volatility of the curve, the closer the sand body shape is to the interbedded sand-mud combination (Figure 3).
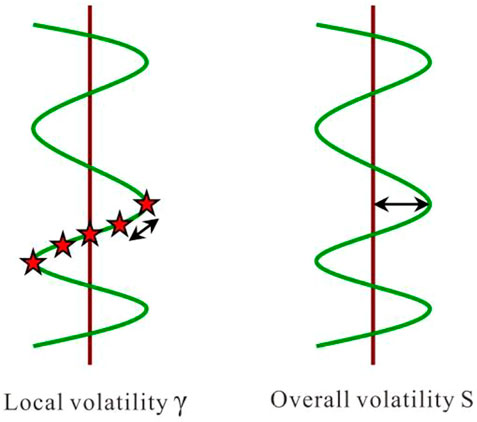
FIGURE 3. Schematic diagram of logging curve fluctuation.
The tight oil reservoirs of the Chang 7 Member in the Ordos Basin are formed by the near-source supply. The more homogeneous the reservoir, the better the physical property, the higher the degree of oil and gas charging, the better the oil-bearing properties of the reservoir. The shape of the logging curves can reflect the deposition environment and the reservoir spot spots. The overall amplitude change index S reflects the change of mud content of reservoir and indirectly reflects the sand body structures. Moreover, the local variation function γ can reflect the heterogeneity of the reservoir. Combined application of S and γ can be used to identify the smoothness of the logging curves, furthermore, it is a comprehensive reflection of sand body structures and reservoir heterogeneity.
Through the analysis, it is found that the smoothness of the logging curves can well characterize the sand body structures. Therefore, the smoothness of the curve can be used to construct a comprehensive parameter that characterizes the sand body structure and the oil-bearing heterogeneity of the reservoir. Therefore, in this study, the curve smoothing function GS was used to construct the logging characterization parameter Pss of the sand body structures and the oil-bearing heterogeneity parameter Ppa of the reservoir. They are defined as follows:
3.3 NMR logging technology
At present, the use of nuclear magnetic resonance logging to characterize the internal structures of pores is a commonly used method. The distribution of the nuclear magnetic resonance T2 spectrum can represent the pore size distribution. In the laboratory, mercury intrusion experiments are also often used to extract pore-throat parameters as well (Sun et al., 2015; Er et al., 2016). Previous studies have shown that the T2 spectral distribution is similar to the pore size distribution curves obtained by mercury intrusion. Therefore, the T2 distribution curves are converted into mercury intrusion curves, thereby realizing the quantitative characterization of the pore structures. The NMR logging instrument used in this paper is Schlumberger CMR type, and the integrated NMR logging data processing system (HERS1.5) is used for NMR data processing and analysis.
CMR is a Schlumberger stick-well nuclear magnetic resonance logging tool, which generally adopts dual-frequency measurement, one for the bound fluid signal and the other for the standard echo group signal. The data processing steps measured by CMR are as follows: data loading→echo generation→T2 spectrum inversion and splicing→reservoir parameter calculation→oil, gas and water analysis→pore structure analysis. Among them, the first two steps belong to the data preprocessing module, and the last four steps are the inversion interpretation module.
4 Results
4.1 Reservoir pore structures
The tight oil reservoirs of the Chang 7 Member in the Maling area are mainly distributed in the Chang 71 and Chang 72 sub-members (Li et al., 2017; Guo et al., 2018). The reservoirs in the study area have poor physical properties. The porosity is mainly distributed in 6.0–10.0%, with an average porosity of 8.3%, and the permeability is concentrated in 0.05–0.20mD, with an average permeability of 0.13mD. It is a typical tight sandstone reservoir. The main pore type of the reservoirs is feldspar dissolved pores, while the primary pores are not developed. Obvious plastic cuttings deformation can be seen in the local sandstones (Figure 4A, Figure 4B); euhedral quartz crystals are observed to fill the remaining pore space in some intervals, resulting in a large reduction of reservoir pores (Figure 4C, Figure 4D).
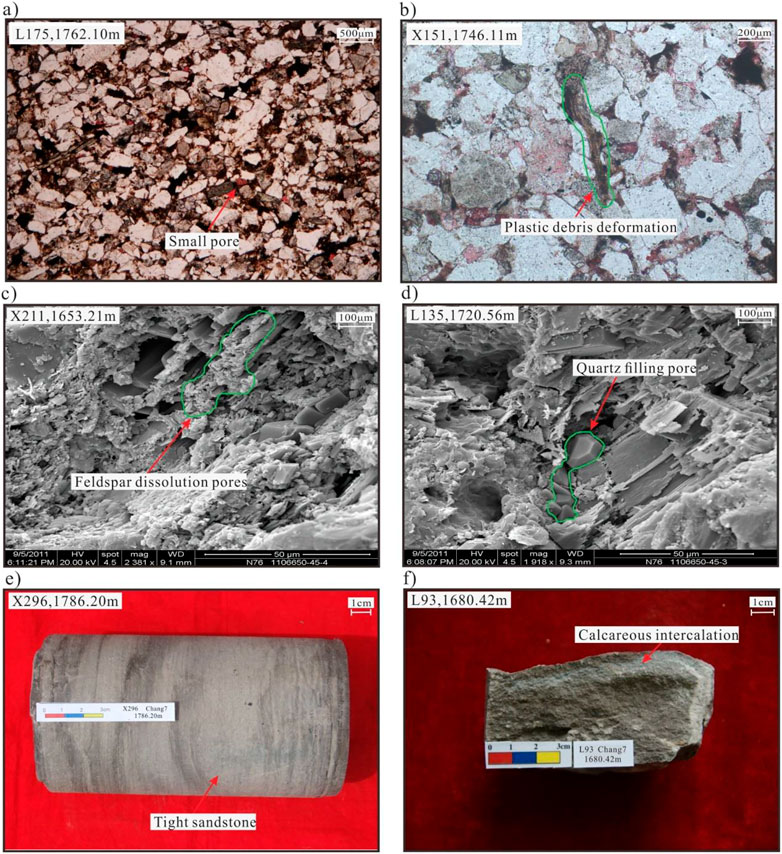
FIGURE 4. Microscopic pore structure characteristics of typical well cores. (A) Well L175, 1762.10 m; (B) Well X151, 1746.11 m; (C) Well 211, 1653.21 m; (D) Well L135, 1720.56 m; (E) Well X296, 1786.20 m; (F) Well L93, 1680.42 m.
The surface porosity of the Chang 7 Members is relatively low, with an average value of 1.66%. The pore throat radius in the target sandstones is small and the sorting is poor. The average median radius is 0.060 μm, and its pore structure belongs to the small-pore micro-throat type (as shown in Figure 4 and Table 1).
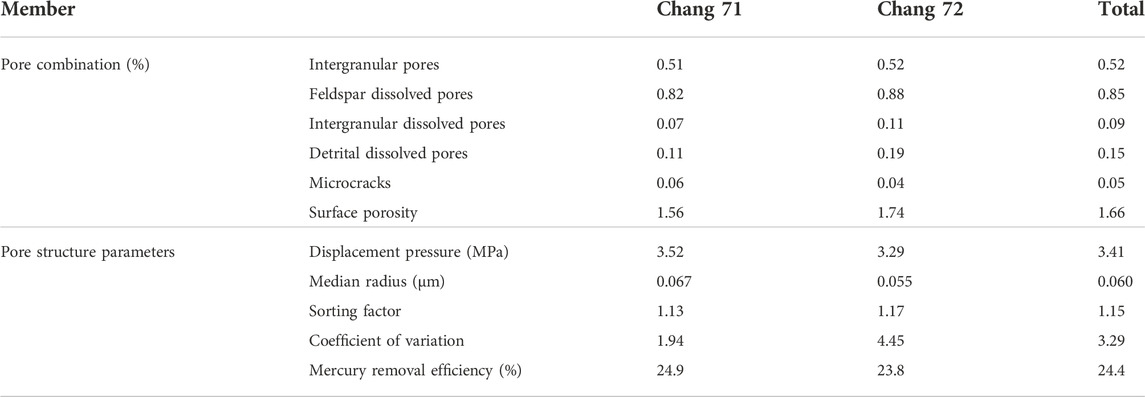
TABLE 1. Pore types and pore structure parameters of reservoirs in the Chang 7 Member in the study area.
The NMR T2 spectral distribution curves are similar to the pore size distribution curves of the mercury intrusion tests, both of which can reflect the microscopic pore structure characteristics of the reservoir. The Chang 7 reservoir in the study area has small pore throats, complex tortuosity, high capillary pressure, and the pore structures of the reservoir is very complex. The modified formula of the power function can convert the NMR T2 spectrum into pseudo-capillary pressure curves. The capillary pressure reflects the nonlinear relationship between the pore throat radius distribution and the NMR T2 spectrum. In this paper, the modified formula of the power function is used to convert the T2 spectrum of the NMR experiment into the pseudo-capillary pressure curves, namely:
where Pc is capillary pressure, MPa; E is echo interval, ms; D is self-diffusion coefficient, μm2/ms; B is fluid free relaxation time, ms; A is pore surface area, cm2; c is conversion coefficient; T2 is volume (free) relaxation time of fluids, ms.
12 sandstone samples were collected from the Chang 7 tight oil reservoir in the study area, they are used to carried out the high-pressure mercury injection and nuclear magnetic resonance experiments. The pseudo-capillary pressure curves were transformed by the NMR T2 spectrum and the high-pressure mercury injection test curves. It is found that the transformation curves of 10 samples are consistent with the test curves. The results show that the pseudo-capillary pressure curves transformed by NMR T2 spectrum can be used to accurately characterize the pore structures of reservoir. For example, the S1 sample has a porosity of 7.9% and a permeability of 0.08 mD. Different methods of NMR conversion of pseudo-capillary pressure curves were used for conversion, and the results are shown in Figure 5. The linear transformation method uses the NMR T2 spectrum data with linear scale values to carry out a reverse accumulation calculation, and then the NMR capillary pressure curves can be obtained. It can be seen from Figure 5 that the error of the linear transformation method is relatively large. The pseudo-capillary pressure in the core can be accurately measured by the power function calibration method (Eq. 9). However, for the tight sandstone reservoir with complex pore structures, the large pore part corresponds well, and the small pore part has a large error. The conversion results of the variable scale method (Eq. 10) is quite different from the measured capillary pressure mercury intrusion curves. In addition, the pseudo-capillary pressure curves transformed by the modified formula proposed in this study can well reflect the pore structure characteristics of the rock, and they are in good agreement with the experimental mercury intrusion curves.
where Pc is capillary pressure, MPa; a1 and b1 are reservoir pore conversion coefficient; K is permeability, mD; D is self-diffusion coefficient, μm2/ms; B is fluid free relaxation time, ms; A is pore surface area, cm2; c is conversion coefficient; T2 is volume (free) relaxation time of fluids, ms.
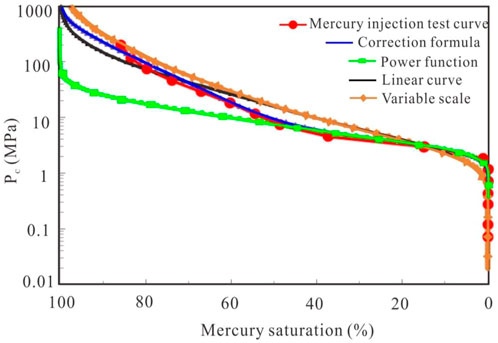
FIGURE 5. Comparison of capillary pressure curves converted by different methods.
In this paper, the oil-bearing effect correction of NMR logging is carried out based on petrophysical experiment calibration. NMR logs were used to invert capillary pressure curves, and the calculated pore parameters were reliable. It can be seen from Figure 6 that the pseudo-capillary pressure curves transformed from the nuclear magnetic resonance T2 spectrum can well reflect the pore structure characteristics of the rock. Moreover, the constructed curves are in good agreement with the capillary pressure curves measured by the core experiments.
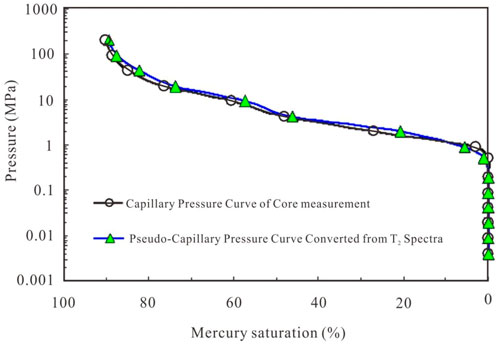
FIGURE 6. Comparison of pseudo-capillary pressure curves converted from NMR T2 spectra.
4.2 Evaluation of oil-bearing properties
The oil-bearing distribution of the reservoirs in the study area is uneven, and some tight sandstone reservoirs with strong calcareous cementation have poor oil-bearing properties (Li Z. et al., 2015; Xiang et al., 2015; Han et al., 2019). For tight sandstone reservoirs, due to the influence of reservoir lithology, the results of physical property and heterogeneity, oil saturation calculated by conventional logging cannot accurately characterize the reservoir oil bearing properties, and the lack of NMR logging data in the study area cannot reflect the plane distribution of oil. Therefore, the apparent energy storage coefficient Y is introduced in this paper to quantitatively characterize the oil bearing properties in the reservoir. The oil-bearing index RI can eliminate the influence of reservoir lithology, physical properties, and formation water changes on resistivity, and highlight the oil-bearing characteristics. Therefore, this parameter can directly reflect the oil content of the reservoir instead of oil saturation. The reservoir porosity reflects the accommodating space of the reservoir fluid, and the product of it and the effective thickness of the reservoir reflects the macroscopic volume of the reservoir. Therefore, the apparent energy storage coefficient Y is constructed to comprehensively characterize the oil content of the reservoir, and the formula is as follows:
In the formula, Rt is the formation resistivity, Ω·m; ϕ is the reservoir porosity, reflecting the fluid storage space of the reservoir, %; a is the lithology coefficient; m is the cementation index; Rw is the formation water resistivity, Ω·m; Y is the apparent energy storage coefficient; H is the effective thickness of the reservoir, and the product of it and the porosity reflects the macroscopic volume of the reservoir, m; RI is the apparent resistivity increase rate, which can reflect the oil content of the reservoir.
5 Case analysis
5.1 Evaluation of reservoir pore structures
Based on the calibration of petrophysical experiments, the modified formula of the power function is used to convert the T2 spectra of the NMR experiments into pseudo-capillary pressure curves. Thus, quantitative evaluation parameters of reservoir pore structures (such as pore throat radius R50) are calculated. These parameters are used to correct for oil effects. Figure 7 shows the interpretation results of the pore structures of the Chang 71 tight sandstones in the Well L38 based on NMR logging. As shown in Figure 7, the pore structure parameters calculated using the pseudo-capillary pressure curves are in good agreement with the experimental test data. The constructed curves can well reflect the small pore throats and complex tortuosity of the reservoirs in the study area.
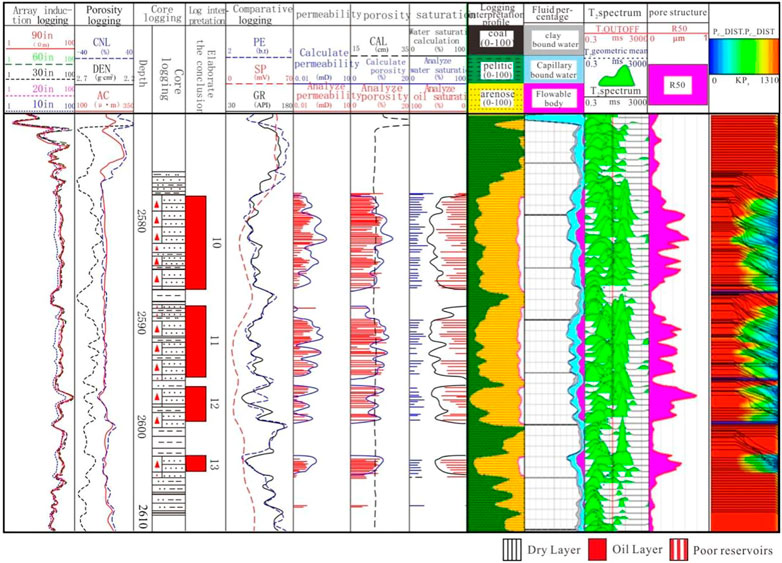
FIGURE 7. Interpretation results of pore structures from nuclear magnetic logging in the target layer of Well L38.
5.2 Evaluation of oil-bearing properties of reservoirs
The oil content of reservoirs can be comprehensively evaluated by the paeameters Pss and Ppa. They are used to construct the logging characterization parameter of the sand body structures and the oil-bearing properties by the curve smoothing function GS. The smaller the Pss value, the weaker the reservoir heterogeneity, the larger the Ppa value, the smaller the reservoir heterogeneity, and the better the oil content. The method was used to evaluate the oil content of 25 wells in the study area with the oil tests and production data, and the evaluation results of 21 wells were consistent with the actual production situation. It is more reliable to evaluate the oil content of tight sandstone reservoir using the parameters Pss and Ppa. Figure 8 shows an example of the calculation of the structural parameters of the sand bodies in Wells L38, B35 and L82. Among them, the first track is the natural potential and natural gamma curves; the second track is the resistivity curve; the third track is the acoustic wave time difference and density curves; the fourth track is the structural parameter results of the sand bodies calculated using the curve smoothness function; the fifth track is the oil test and interpretation results; the sixth track is the profile of sand and mudstone. The gamma logging curve in Well L38 has a slightly dentated medium-amplitude box shape, which represents a massive sand body with good homogeneity. The average value of Pss is 11.5, while that of Ppa is 3.14, the oil heterogeneity of the reservoir is small, and the logging interpretation result is an oil layer. This set of sand body has good oil content, and its daily oil production during the oil testing is 20.9 t/d (Figure 8A). The natural gamma curve in Well B35 has a tooth bell-shaped and finger-shaped features, which represents the interbedded sand-mud structure and poor homogeneity. The reservoir has poor physical property and strong oil heterogeneity, the value of Pss is 15.2, while that of Ppa is 1.43, and it can be interpreted as poor oil reservoir. This set of sand bodies has low oil saturation, and its daily oil production during oil testing is 6.46 t/d (Figure 8B). According to the calculated results of sand body structure parameters and oil-bearing parameters, the smoothness of Well L38 is obviously better than that of Well B35. According to the evaluation results of logging parameters and the actual production situation, the sand body structure and oil content of the reservoir in Well L38 are better than those in Well B35. Figure 8C shows the calculation results of the structural parameters of the sand bodies in Well L82. The reservoir sand bodies in Well L82 have poor quality and strong heterogeneity. The oil test results show that the sandstone reservoir in Well L82 contains no oil.
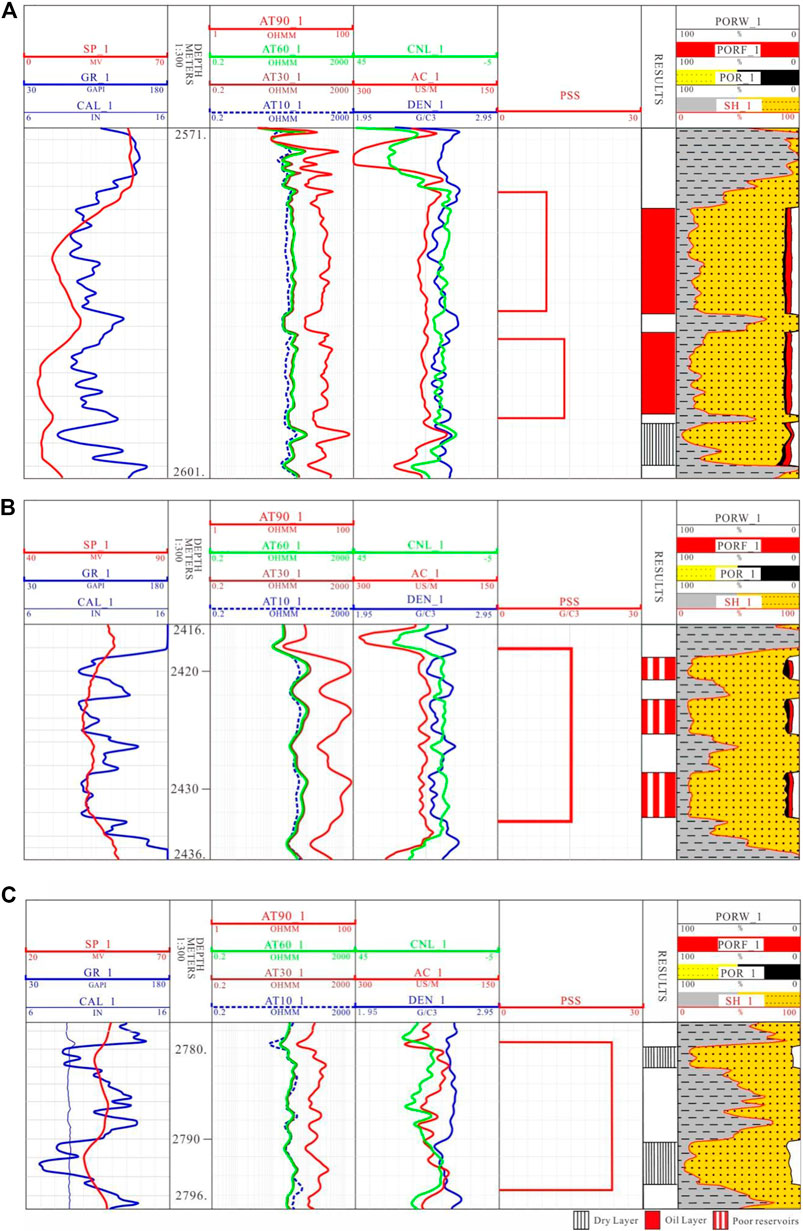
FIGURE 8. Evaluation of the classification of tight oil layers in typical wells in the study area. (A) Well L38; (B) Well B35; (C) Well L82.
At the same time, according to the statistical analysis of the apparent energy storage coefficient in the study area and the initial production of oil wells, it is found that they have a good positive correlation. That is, the larger the apparent energy storage coefficient, the higher the initial production of the oil wells (Figure 9). Therefore, the apparent energy storage coefficient Y is used to comprehensively evaluate the oil and gas-bearing properties of the reservoir.
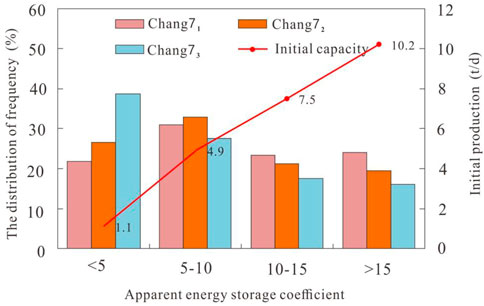
FIGURE 9. Relationship between apparent energy storage coefficient and initial production of the target layer.
According to the planar distribution of the apparent energy storage coefficient of the Chang 7 reservoir in the Maling X233 area (Figure 10), the apparent energy storage coefficient in the central and northern parts of the study area is relatively large, and the value of the energy storage coefficient is mainly concentrated above 10, while that of the local areas can reach more than 15. Combined with the actual production statistics (Table 2), the larger the apparent energy storage coefficient, the higher the initial production capacity of the oil production well. For production wells with apparent energy storage coefficient greater than 15, the average initial daily oil production reached 10.2 t/d.
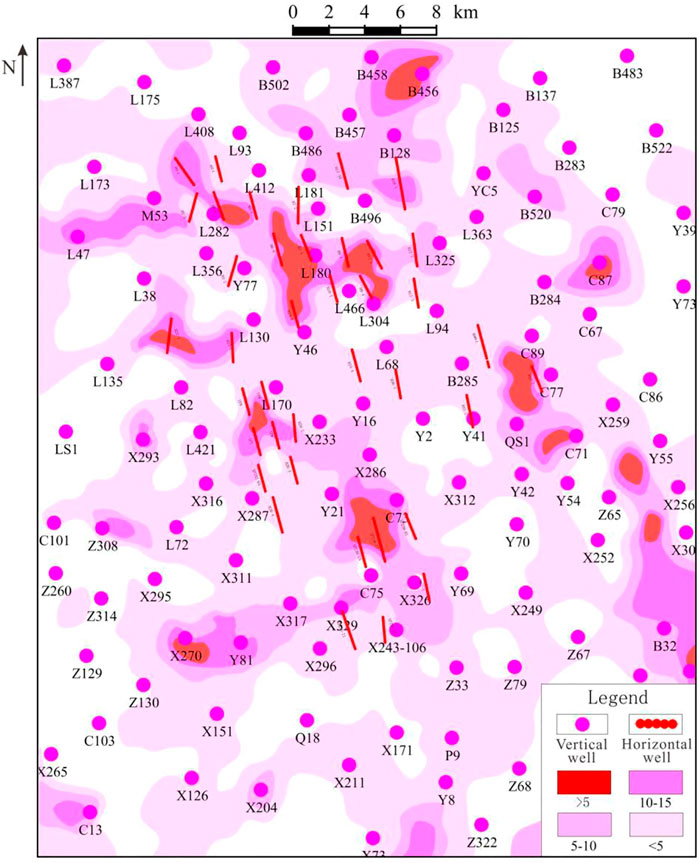
FIGURE 10. Distribution of apparent energy storage coefficient of Chang 7 Member in West 233 area.

TABLE 2. Statistical results of reservoir coefficient in the Chang 7 Member of the study area.
6 Conclusion
1) In this study, taking the Chang 7 Member in the Maling area of the Ordos Basin as an example, the nuclear magnetic resonance, clay mineral analysis, high pressure mercury injection analysis and logging interpretation technology have been used to carry out a comprehensive evaluation of the pore structures, sand body structures and oil-bearing properties of tight oil sandstone reservoirs.
2) The pseudo-capillary pressure curves transformed by the NMR T2 spectra are consistent with the capillary pressure curves measured by the core experiments. This method can be used for accurate characterization of the pore structures of the reservoir. The pore structure parameters calculated based on the pseudo-capillary pressure curves can accurately reflect the pore structures of the reservoirs such as micropores-thin throats and complex tortuosity.
3) The parameters Pss and Ppa constructed by the logging curve smoothness function GS were used to quantitatively characterize the sand body structures and oil-bearing heterogeneity of tight oil reservoir. And the apparent energy storage coefficient is introduced to quantitatively evaluate the oil-bearing properties of tight oil reservoirs. The evaluation results are in good agreement with the actual production situation. The larger the apparent energy storage factor, the higher the initial production of the oil wells.
Data availability statement
The original contributions presented in the study are included in the article/supplementary material, further inquiries can be directed to the corresponding authors.
Author contributions
XQ and CT are responsible for the idea and writing of this paper and LD, JL, ZY and YB are responsible for the data interpretation.
Funding
This study was supported by the Project (2019–18315) of the PetroChina Changqing Oilfield Exploration and Development Research Institute and the Project (42072173) of the National Natural Science Foundation of China).
Conflict of interest
Author LD was employed by the PetroChina Changqing Oilfield Shale Oil Development Branch, author JL was employed by the Fifth Oil Production Plant of Petrochina Changqing Oil Field Company, and authors ZY and YB were employed by the Seventh Oil Production Plant of PetroChina Changqing Oilfield Company.
The remaining author declare that the research was conducted in the absence of any commercial or financial relationships that could be construed as a potential conflict of interest.
Publisher’s note
All claims expressed in this article are solely those of the authors and do not necessarily represent those of their affiliated organizations, or those of the publisher, the editors and the reviewers. Any product that may be evaluated in this article, or claim that may be made by its manufacturer, is not guaranteed or endorsed by the publisher.
References
Er, C., Li, Y., Zhao, J., Wang, R., Bai, Z., and Han, Q. (2016). Pore formation and occurrence in the organic-rich shales of the triassic chang-7 member, Yanchang Formation, Ordos Basin, China. J. Nat. Gas Geoscience 1, 435–444. doi:10.1016/j.jnggs.2016.11.013
Fan, C. H., Xie, H. B., Li, H., Zhao, S. X., Shi, X. C., Liu, J. F., et al. (2022). Complicated fault characterization and its influence on shale gas preservation in the southern margin of the Sichuan Basin, China. Lithosphere 2022, 8035106. doi:10.2113/2022/8035106
Guo, H., He, R., Jia, W., Peng, P., Lei, Y., Luo, X., et al. (2018). Pore characteristics of lacustrine shale within the oil window in the upper triassic Yanchang Formation, southeastern Ordos Basin, China. Mar. Petroleum Geol. 91, 279–296. doi:10.1016/j.marpetgeo.2018.01.013
Han, H., Pang, P., Li, Z., Shi, P., Guo, C., Liu, Y., et al. (2019). Controls of organic and inorganic compositions on pore structure of lacustrine shales of Chang 7 member from Triassic Yan Chang Formation in the Ordos Basin, China. Mar. Petroleum Geol. 100, 270–284. doi:10.1016/j.marpetgeo.2018.10.038
Hassane, A., Ehirim, C. N., and Dagogo, T. (2021). Rock physics diagnostic of Eocene Sokor-1 reservoir in Termit subbasin, Niger. J. Pet. Explor. Prod. Technol. 11, 3361–3371. doi:10.1007/s13202-021-01259-2
Iferobia, C. C., and Ahmad, M. (2020). A review on the experimental techniques and applications in the geomechanical evaluation of shale gas reservoirs. J. Nat. gas Sci. Eng. 74, 103090. doi:10.1016/j.jngse.2019.103090
Jia, C., Zou, C., Li, J., Li, D., and Zheng, M. (2016). Evaluation criteria, major types, characteristics and resource prospects of tight oil in China. Petroleum Res. 1 (1), 1–9. doi:10.1016/S2096-2495(17)30026-1
Lai, J., Wang, G., Fan, Q., Pang, X., Li, H., Zhao, F., et al. (2022). Geophysical well-log evaluation in the era of unconventional hydrocarbon resources: A review on current status and prospects. Surv. Geophys. 43, 913–957. doi:10.1007/s10712-022-09705-4
Li, C. L., Li, C. X., Hou, Y., Shi, Y., Wang, C., Hu, F., et al. (2015b). Well logging evaluation of triassic Chang 7 member tight reservoirs, Yanchang Formation, Ordos Basin, NW China. Petroleum Explor. Dev. 42, 667–673. doi:10.1016/S1876-3804(15)30061-6
Li, H. (2022). Research progress on evaluation methods and factors influencing shale brittleness: A review. Energy Rep. 8, 4344–4358. doi:10.1016/j.egyr.2022.03.120
Li, H., Tang, H. M., Qin, Q. R., Zhou, J. L., Qin, Z. J., Fan, C. H., et al. (2019). Characteristics, formation periods and genetic mechanisms of tectonic fractures in the tight gas sandstones reservoir: A case study of xujiahe formation in YB area, sichuan basin, China. J. Pet. Sci. Eng. 178, 723–735. doi:10.1016/j.petrol.2019.04.007
Li, H., Zhou, J. L., Mou, X. Y., Guo, H. X., Wang, X. X., An, H. Y., et al. (2022b). Pore structure and fractal characteristics of the marine shale of the longmaxi formation in the changning area, southern sichuan basin, China. Front. Earth Sci. (Lausanne). 10, 1018274. doi:10.3389/feart.2022.1018274
Li, J., Li, H., Yang, C., Wu, Y. J., Gao, Z., and Jiang, S. L. (2022a). Geological characteristics and controlling factors of deep shale gas enrichment of the Wufeng-Longmaxi Formation in the southern Sichuan Basin, China. Lithosphere 2022, 4737801. doi:10.2113/2022/4737801
Li, P., Zheng, M., Bi, H., Wu, S., and Wang, X. (2017). Pore throat structure and fractal characteristics of tight oil sandstone: A case study in the Ordos Basin, China. J. Petroleum Sci. Eng. 149, 665–674. doi:10.1016/j.petrol.2016.11.015
Li, Y., Niu, D., Zhang, Y., Wu, H., Fu, H., and Wang, Z. (2021a). Microscopic pore-throat grading evaluation in a tight oil reservoir using machine learning: A case study of the fuyu oil layer in bayanchagan area, songliao basin central depression. Earth Sci. Inf. 14, 601–617. doi:10.1007/s12145-021-00594-6
Li, Z. P., Gao, C. Q., Zhao, B., Guan, Y., and Liu, J. Y. (2021b). Application of nuclear magnetic resonance logging in the low-resistivity reservoir-Taking the XP area as an example. Interpretation 8, T885–T893. doi:10.1190/INT-2019-0179.1
Li, Z., Qu, X., Liu, W., Lei, Q., Sun, H., and He, Y. (2015a). Development modes of triassic Yanchang Formation Chang 7 member tight oil in Ordos Basin, NW China. Petroleum Explor. Dev. 42, 241–246. doi:10.1016/S1876-3804(15)30011-2
Lu, S. F., Li, J. Q., Xiao, D. S., Xue, H. T., Zhang, P. F., Li, J. J., et al. (2022). Research progress of microscopic pore-throat classification and grading evaluation of shale reservoirs: A minireview. Energy fuels. 36, 4677–4690. doi:10.1021/acs.energyfuels.2c00431
Neves, L. F., Guedes, C. C. F., and Vesely, F. F. (2019). Facies, petrophysical and geochemical properties of gravity-flow deposits in reservoir analogs from the Itarare Group (late Carboniferous), Parana Basin, Brazil. Mar. petroleum Geol. 110, 717–736. doi:10.1016/j.marpetgeo.2019.07.038
Nikolaev, M. Y., and Kazak, A. V. (2019). Liquid saturation evaluation in organic-rich unconventional reservoirs: A comprehensive review. Earth-science Rev. 194, 327–349. doi:10.1016/j.earscirev.2019.05.012
Pecanha, A. A., Lupinacci, W. M., Ferreira, D. J. A., and Freire, A. F. M. (2019). A workflow for reservoir characterization applied to presalt coquinas from the Linguado Field, Campos Basin, Brazil. J. petroleum Sci. Eng. 183, 106451. doi:10.1016/j.petrol.2019.106451
Si, Z., Lin, F., Liu, D., Kong, X., Yin, Q., and Zhuang, D. (2020). Research on well logging evaluation method of igneous reservoir in Nanpu No.5 structure. Energy Sources Part A Recovery Util. Environ. Eff., 1–13. doi:10.1080/15567036.2020.1798565
Sun, L., Tuo, J., Zhang, M., Wu, H., Wang, Z., and Zheng, Y. (2015). Formation and development of the pore structure in Chang 7 member oil-shale from Ordos Basin during organic matter evolution induced by hydrous pyrolysis. Fuel 158, 549–557. doi:10.1016/j.fuel.2015.05.061
Wu, S., Zhu, R., Cui, J. G., Cui, J. W., Bai, B., Zhang, X., et al. (2015). Characteristics of lacustrine shale porosity evolution, triassic Chang 7 member, Ordos Basin, NW China. Petroleum Explor. Dev. 42, 185–195. doi:10.1016/S1876-3804(15)30005-7
Xiang, J., Liu, J., and Li, X. (2015). Investigation of pore structure and fractal characteristics of organic-rich Yanchang formation shale in central China by nitrogen adsorption/desorption analysis. J. Nat. Gas Sci. Eng. 22, 62–72. doi:10.1016/j.jngse.2014.11.020
Yang, Z., Zou, C., Wu, S., Lin, S., Pan, S., Niu, X., et al. (2019). Formation, distribution and resource potential of the "sweet areas (sections)" of continental shale oil in China. Mar. Petroleum Geol. 102, 48–60. doi:10.1016/j.marpetgeo.2018.11.049
Yao, J., Deng, X., Zhao, Y., Han, T., Chu, M., and Pang, J. (2013). Characteristics of tight oil in triassic Yanchang Formation, Ordos Basin. Petroleum Explor. Dev. 40 (2), 161–169. doi:10.1016/S1876-3804(13)60019-1
Zhang, B., Shan, B., Zhao, Y., and Zhang, L. (2020). Review of formation and gas characteristics in shale gas reservoirs. Energies 5427, 5427. doi:10.3390/en13205427
Zhang, Y., Zeng, J., Dai, Z., Hari, V., Xiao, T., Ma, Y., et al. (2018). Experimental investigation on oil migration and accumulation in tight sandstones. J. Petroleum Sci. Eng. 160, 267–275. doi:10.1016/j.petrol.2017.10.049
Zhou, Z., Wang, G., Ran, Y., Lai, J., Cui, Y., and Zhao, X. (2016). A logging identification method of tight oil reservoir lithology and lithofacies: A case from Chang7 member of triassic Yanchang Formation in heshui area, Ordos Basin, NW China. Petroleum Explor. Dev. 43, 65–73. doi:10.1016/S1876-3804(16)30007-6
Zhu, P., Zhu, Z., Zhang, Y., Sun, L., Dong, Y., Li, Z., et al. (2019). Quantitative evaluation of low-permeability gas reservoirs based on an improved fuzzy-gray method. Arab. J. Geosci. 3, 80. doi:10.1007/s12517-019-4231-5
Keywords: tight oil sandstone, reservoir quality, nuclear magnetic resonance, pore structure, oil-bearing properties
Citation: Qiu X, Ding L, Liu J, Yan Z, Bao Y and Tan C (2023) Quantitative evaluation of reservoir quality of tight oil sandstones in chang 7 member of Ordos Basin. Front. Earth Sci. 10:1046489. doi: 10.3389/feart.2022.1046489
Received: 16 September 2022; Accepted: 24 October 2022;
Published: 16 January 2023.
Edited by:
Hu Li, Southwest Petroleum University, ChinaReviewed by:
Jingzhe Guo, Northwest University, ChinaDelu Li, Xi’an University of Science and Technology, China
Copyright © 2023 Qiu, Ding, Liu, Yan, Bao and Tan. This is an open-access article distributed under the terms of the Creative Commons Attribution License (CC BY). The use, distribution or reproduction in other forums is permitted, provided the original author(s) and the copyright owner(s) are credited and that the original publication in this journal is cited, in accordance with accepted academic practice. No use, distribution or reproduction is permitted which does not comply with these terms.
*Correspondence: Xiangliang Qiu, MTAzNzU0ODcyMkBxcS5jb20=; Chengqian Tan, MTA5ODM2NDgxMEBxcS5jb20=