 Jie Liu
 Bin Gao
 Haoyuan Du2†
 Qiyu Bai
 Bo Zhong
- 1Science and Technology R&D Center, Xinjiang Transport Planning Survey and Design Institute Co., Ltd., Urumqi, China
- 2College of Water Conservancy and Architectural Engineering, Shihezi University, Shihezi, China
- 3College of Civil Engineering and Architecture, Xinjiang University, Urumqi, China
Based on a specially designed visualization pullout system and digital photographic measurement technology, geogrid pullout tests were conducted by varying the top load, geogrid type, coarse grain content, and particle shape. The evolution and distribution of the reinforcement influence zone and the soil particle displacement field were analyzed, and the effects of various factors on the formation speed of the reinforcement influence zone, gradient layer thickness, and fine-scale particle displacement characteristics were discussed. The study shows that the reinforcement influence zone’s basic form and particle displacement direction do not change with pullout displacement after it is fully developed. The displacement layers in the influence zone are centered at the reinforced soil interface and are distributed in a diffusion gradient. The thickness of each gradient layer in the upper influence zone is greater than that in the lower influence zone. The greater the normal load is, the smaller the particle displacement and thickness of each gradient layer, and the slower the formation of the reinforcement influence zone. Using high-strength geogrids and geogrids with nodes can increase the upper interface thickness and improve the reinforcement influence zone’s formation speed. Horizontal ribs play a major role in forming the reinforcement influence zone, while longitudinal ribs mainly affect the formation speed. The indirect reinforcement effect of the geogrid on angular gravel soil is better than that on pebble soil. As the coarse grain content in the fill increases from 20% to 30%, the reinforcement influence zone forms faster, and the particle displacement of each gradient layer is smaller. When the coarse grain content increases from 30% to 35%, there is no significant change in the forming rate of the reinforcement influence zone.
1 Introduction
Gravelly soil is an excellent filler that is often used in engineering as roadbeds and building foundations to replace weak foundations. Due to bulkiness of gravelly soil, it is unable to withstand tensile stresses, leading to poor overall structural stability (Riwaj et al., 2016; Wang et al., 2020). The stability of gravelly soil can be improved by reinforcement with geosynthetic materials (Liu et al., 2021). The properties at the gravelly soil-geogrid reinforcement soil interface have a decisive influence on the structural stability of reinforced soil and have been a hot research topic. To understand the mechanism of reinforced soil and the interface characteristics between fill soil and reinforced materials, many experimental research studies have been performed using direct shear tests and pullout tests. In previous work, the effect of gravelly soil with different particle sizes on the interface strength parameters of reinforced soil was investigated via direct shear tests (Kim and Ha., 2014; Vangla and Gali., 2016; Wang et al., 2016; Han et al., 2018; Reza and Vahid., 2021). The effect of gravelly soil with different coarse grain contents on the pullout force and interface strength parameters was investigated by using direct shear, compression, and pullout tests (Jayawickrama et al., 2014; Zou et al., 2022). However, due to the limitations of these test methods, the interface parameters were determined at the macroscopic level under the action of the different factors.
The theory of an “indirect reinforcement zone” proposed by Nezhad Mahdi Ghasemi suggests that the reinforcement effect on soil is indirectly produced by the change in position and fragmentation deformation of soil particles through the influence of reinforcement materials in a certain area beyond the direct contact level of the reinforcement soil (Nezhad Mahdi Ghasemi et al., 2021). According to Yunong Li, the scope and strength of this indirect reinforcement effect are influenced by the roughness of the reinforcement materials, soil particle size, and external load magnitude (Li et al., 2022). Gholam H proved the existence of a reinforcement influence zone by a pullout test (Roodi and Zornberg et al., 2017). Through experimental research, Mirzaalimohammadi demonstrated that the thickness of the reinforcement influence zone is related to the structure, roughness, gradation of soil particles, and normal pressure of the reinforcement materials (Mirzaalimohammadi et al., 2021). HU You-chang used a particular visual instrument for the pullout tests and concluded through experimental studies that the gradation of soil particles and the thickness of the geogrid’s horizontal ribs influence the range of the reinforcement influence zone (HU et al., 2017). The particle discrete element program Particle Flow Code (PFC) was used to simulate the pullout test of geogrids in different fill soils to study the generation and development of the reinforcement influence zone and the particle movement law at the fine level (Wang et al., 2014; Chen et al., 2015; Miao et al., 2017; Tan et al., 2020). Studying the fine-scale interface properties of gravelly soil-reinforcement soil is essential for revealing the reinforcement mechanism and promoting the development of reinforced soil technology.
Using traditional test methods, it is difficult to evaluate the evolution of the internal configuration and mechanical properties at the interface of reinforced soil during gravelly soil-geogrid pullout testing at a fine scale. In recent years, with the continuous development of monitoring technology, experimental studies of the fine-scale properties at the interface of reinforced soil have been carried out with digital photographic measurement technology, particularly, particle image velocimetry (PIV) (Puttinger and Saeedipour., 2022). Chen-xi Miao studied the shear strain concentration zone and particle rotation characteristic law of geogrid-reinforced soil from a fine viewpoint (Miao et al., 2017). In some documents, a visualization study was conducted via large direct shear tests on plain gravel soil and reinforced gravel soil (Feng et al., 2018; Zhang et al., 2018; Chen et al., 2019; Zia ur Rehman and Zhang., 2019). These researchers found that the maximum value of the soil particle displacement in the direct shear interface area of reinforced gravel soil was smaller than that of plain gravel soil. Yang Wu investigated the fine-scale properties at the interface between a ribbed geomembrane and sandy soil at different rib heights and temperatures (Wu et al., 2022). Using a pullout test, Zhou found that the displacement of sandy soil particles mainly occurred in the upper part of the reinforced interface (Zhou et al., 2012). Abdi investigated the effect of particle size on the fine-scale properties at the interface of reinforced soil (Abdi and Mirzaeifar., 2017). Previous experimental studies regarding the interface characteristics of reinforced soil have been more focused on the movement law of sandy soil during the pullout process and the fine view of the direct shear interface of gravelly soil. To date, experimental investigations of the factors influencing the pullout properties at the geogrid-gravelly soil reinforcement interface at the fine level have not been comprehensive. Current visualization technology can only observe the edge of the soil inside a box but cannot discern the direct contact interface of reinforced soil at the microscopic level.
Based on a special visualization pullout system and digital photographic measurement technology, geogrid pullout tests in gravelly soil are carried out as a function of normal load, geogrid type, coarse grain content and particle shape. The evolution and distribution of the reinforcement influence zone and the displacement law of soil particles are analyzed. To provide a new understanding of the fine scale mechanism of reinforced soil, the influence of each factor on the forming speed of the reinforcement influence zone, the thickness of each gradient layer and the particle displacement of each fine scale characteristic and other indexes are explored.
2 Testing program
2.1 Test equipment
The test setup comprises a YT1200S type geosynthetic material straight shear pullout friction instrument customized by Wenzhou Jigao Testing Instrument Co., Ltd. Using PIV, which measures soil particle movement, the fine-scale characteristics at the reinforced soil interface are observed, and simultaneously, the changing pattern of soil particle movement during the pullout process is dynamically captured. The PIV system includes a high-resolution camera, a lens, a timing control unit that generates a transistor-transistor logic (TTL) trigger signal to control camera shooting, and a PSP tracer particle. The image acquisition frequency is 0.1 Hz. After the acquisition, the displacement cloud and displacement vector of the whole field and feature points are obtained using image analysis software. The related equipment arrangement is shown in Figure 1.
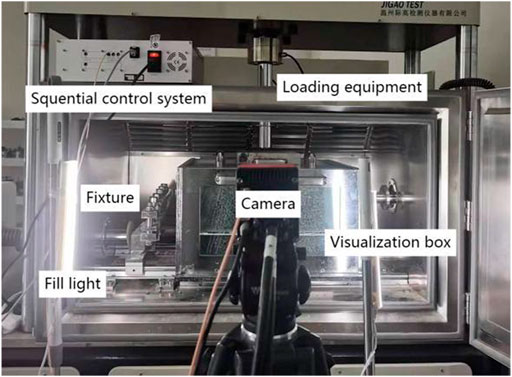
FIGURE 1. Visual instrument for the pullout test and PIV system.
A conventional sidewall transparent pullout box can only observe particle movement at the edge of the soil inside the box; this does not reflect the internally reinforced soil interaction during the pullout process. Experimental studies have shown that the apparent friction angle in the pullout test is positively related to the interface friction angle between the front wall of the pullout box and the fill soil (Christian et al., 2022; Ren et al., 2022; Wang et al., 2022). The friction between the front wall and the soil is larger, so the observation of the soil near the front wall should be avoided, and a large pullout box should be selected as much as possible (Konstantin et al., 2022; Zhao et al., 2022). The optimized design of the model test box is carried out for such problems, and its structure photo is shown in Figure 2.
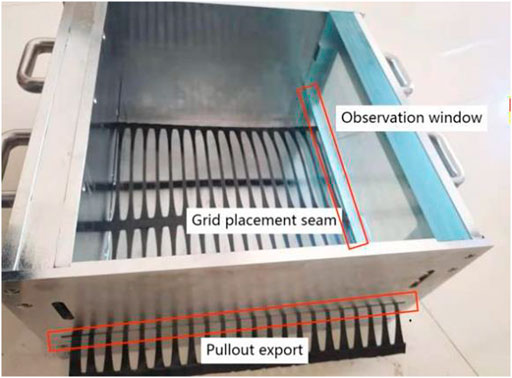
FIGURE 2. Visual box for the pullout test.
In this test, a pullout box is contained inside the main box with dimensions of 50 cm × 40 cm × 30 cm (length × width × height). One of the sidewalls is embedded with organic tempered glass as an observation window. The glass dimensions are 40 cm × 20 cm × 1 cm (length ×width ×thickness). The box is equipped with 50 cm × 20 cm × 5 cm (length × width × thickness) organic tempered glass on the side of the observation window, and a 50 cm × 5 cm × 1 cm (length × width × height) crevice is opened at a position equal to the pullout exit. The inner wall of the glass is coated with a high-definition silicone film and silicone grease to reduce boundary friction. The lateral ends of the geogrid are placed in the inner reserved crevice. This structure enables the observation of the vertical profile of the direct contact layer of the reinforced soil. To avoid the leakage of soil particles from the geogrid outlet on the front side of the box during the pullout process, a thin sheet of retaining steel is placed on the upper surface of the geogrid on the inside of the outlet.
2.2 Test materials
2.2.1 Test soil sample
Following the “Specification for test and measurement of geosynthetics” (SL235 2012) (Nanjing Hydraulic Research Institute, 2012), the soil materials with two different particle shapes are sieved and configured into one group of angular gravel soil filler and five groups of round gravel soil filler. PSP tracer particles are added to mark the soil particles. The filler for the test is air-dried soil, and the formulation scheme and physical property indexes are shown in Table 1. Photographs of the angular gravel soil and the round gravel soil and the particle grading curves of the six groups of coatings are shown in Figure 3.
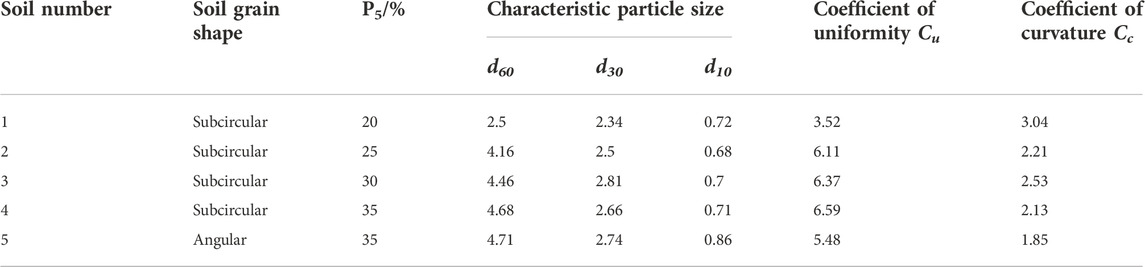
TABLE 1. Characteristic diameters and parameters of the coarse-grained soils.
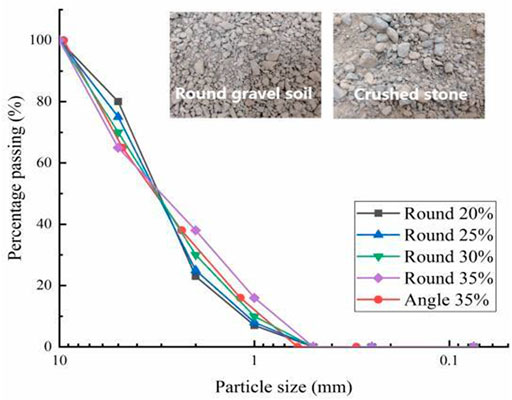
FIGURE 3. Photographs and grain grading curves of the coarse-grained soil.
2.2.2 Geogrid
The specific geometry and mechanical properties of the geogrid as a reinforcing material are shown in Table 2, and the photos of the geogrids are shown in Figure 4.
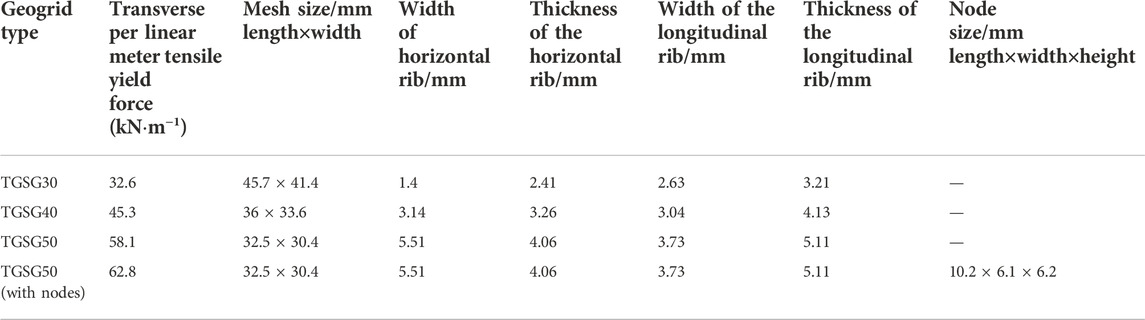
TABLE 2. Mechanical properties of geogrids.
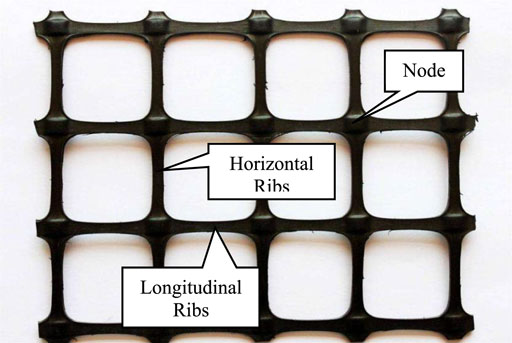
FIGURE 4. Geogrid photos.
2.3 Test program and working conditions
The effects of normal load, geogrid type, coarse grain content, and particle shape on the distribution and evolution law of the reinforcement influence zone and particle displacement law are studied at a fine scale through orthogonal experimental design. The specific working conditions are shown in Table 3.
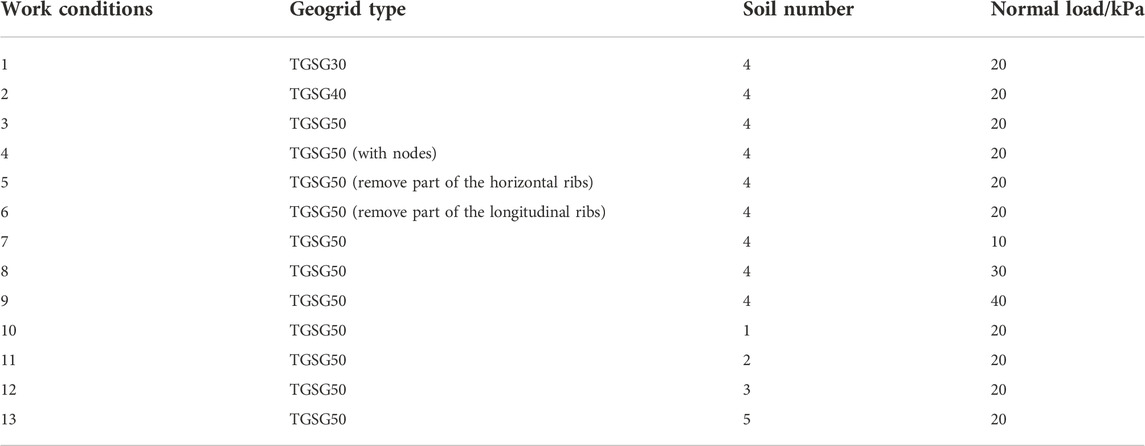
TABLE 3. Pullout test conditions.
In accordance with the Highway geotechnical test regulations (JTG3430-2020) requirements, the prepared gravelly soil is packed layer by layer into the box at a 90% compaction level (Highway geotechnical test regulations, 2020). After completion, each layer and the overall filling are leveled with a horizontal ruler to prevent stress concentration caused by uneven contact between the filler and the rigid pressure plate. To reduce the sidewall effect of the test box, the ratio of the width of the pullout box to the width of the geogrid should be greater than 2, so the size of the geogrid buried in the soil is set at 25 cm × 40 cm (width × length) (Baykal and Dadasbilge., 2008). After filling, the rigid pressure plate is covered, and a vertical stress of 15 kPa is applied per pressure to redistribute the stress. After the pressure head is returned, the test box is slowly pressurized to the predetermined load, the load is set to stand still for 15 min, and then a pullout test is carried out at a preset constant pullout rate of 2 mm/min. When the pulling displacement reaches 30 mm or the pullout curve is seriously destabilized, the test is finished.
3 Experimental results and analysis
3.1 Fine view analysis of the reinforcement influence zone evolution and soil particle displacement law
The movement of gravelly soil particles around the reinforced interface is automatically captured by digital imaging equipment, and the macroscopic and fine-scale analyses of the gravelly soil particle movement law are performed using the image acquisition system. The evolution of the soil particle displacement field concentration zone and the gravelly soil particle displacement law are basically the same in each group of tests, so working condition of three is selected for analysis. Figure 5 shows the evolution of the displacement cloud of gravelly soil in working condition of three (−150 mm is the reserved seam where the geogrid is placed, and the arrow is the pullout direction). Combined with the pullout curve, when the pullout displacement is 2 mm, the stress concentration appears at the front of the first horizontal rib of the geogrid first. At this time, the pullout curve is in the linear stage, which is mainly a small disturbance of soil particles under the frictional effect with the longitudinal ribs of the grid. When the pullout displacement is 12 mm, a more obvious displacement concentration zone at the interface of the reinforced soil is formed initially. This is the pullout development stage. The pullout force is further increased, and the horizontal ribs of the geogrid play a role in continuously squeezing the soil particles at the front of the horizontal ribs, causing the soil particles to move, roll, move incorrectly or even shear through. The static friction between the reinforced soil is changed into dynamic friction, and the embedded locking effect of the geogrid mesh on the soil gradually comes into play and takes the dominant position. Compared with 25 mm and 30 mm, when the pullout force reaches the peak, the soil particle displacement concentration zone has completely evolved and matured. Its basic form no longer changes with the pullout displacement; that is, a stable interface thickness is formed.
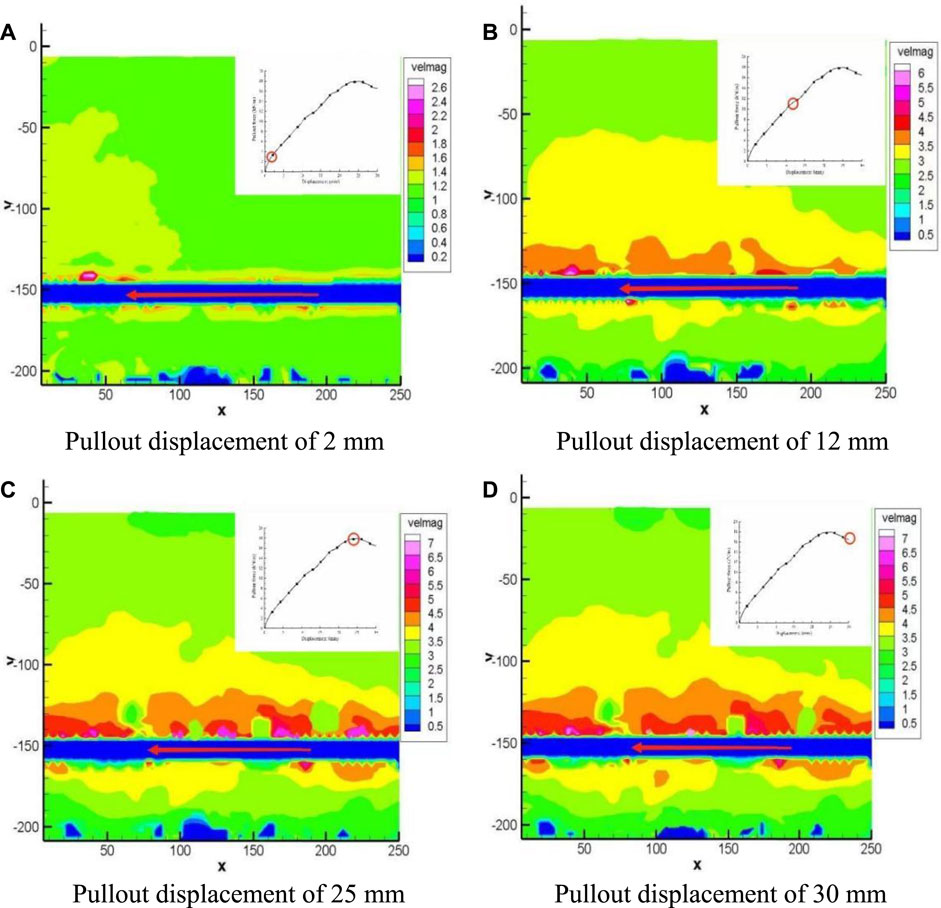
FIGURE 5. The change law of displacement cloud map. (A) Pullout displacement of 2 mm. (B) Pullout displacement of 12 mm. (C) Pullout displacement of 25 mm. (D) Pullout displacement of 30 mm.
Figure 6 shows the displacement vector diagram of gravelly soil. Each characteristic point Ⅰ to Ⅴ is selected, and its particle displacement direction is enlarged to develop a detailed analysis of the soil particle displacement law. When the pullout displacement is 2 mm, soil particles at each point are obliquely displaced downward under the action of normal load and static friction of the reinforced material’s longitudinal ribs. When the pullout displacement is 12 mm, although the soil particles at Ⅰ and Ⅱ are far from the geogrid, the soil particles at Ⅱ keep rotating and falling on the tightly packed soil particles to fill the original gap of the soil, squeezed by other soil particles and flattened. The soil particles at Ⅰ are gradually occluded and embedded into a dense state with the pullout displacement and then are restricted by the sidewall of the pullout box. Soil particles are subjected to reaction forces after reaching the maximum compacted state at the sidewall and moving in the opposite direction with Ⅱ. When the pullout displacement is 25 mm, the soil particles at Ⅲ are located in front of the horizontal rib of the geogrid, and the horizontal rib squeezes the front soil to facilitate punching and shearing. The soil in front of the horizontal rib is in a passive stress state and shows a shear shrinkage effect. The soil particles at Ⅳ are located at the back end of the geogrid’s horizontal rib of the geogrid, and the soil is in an active stress state and shows the shear expansion effect. Compared with the pullout displacement of 30 mm, the particle displacement direction does not change after the pullout force reaches the peak. During the whole pullout process, the soil particles at the lower interface are at V. Under the action of the load and geogrid, the shear expansion movement in the direction of pullout occurs so that the particles at the upper and lower interfaces move asymmetrically along the reinforced soil interface after the soil particle displacement concentration zone evolves and matures.
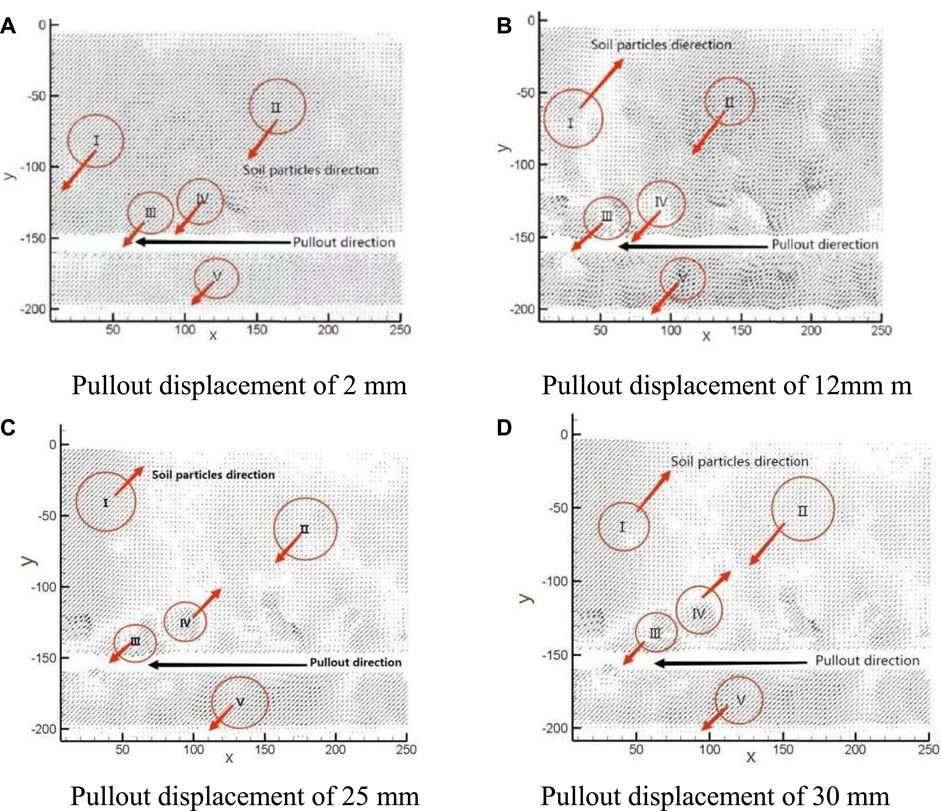
FIGURE 6. Coarse grain soil particle displacement vector. (A) Pullout displacement of 2 mm. (B) Pullout displacement of 12 mm m. (C) Pullout displacement of 25 mm. (D) Pullout displacement of 30 mm.
The distribution pattern and formation mechanism of the fully developed reinforced soil displacement field concentration zone at the pullout interface of soil in Figure 5C are analyzed and compared with the results in Figure 6. The figure confirms that the reinforced materials not only have a reinforcing effect on the soil in direct contact and in the immediately adjacent shear zone but also act on the soil outside of the direct contact surface. This effect of changing the stress field, strain field, and damage mode of the soil due to the presence of reinforced materials is called the “indirect reinforcement effect,” and its area of action is called the “reinforcement influence zone.” The reinforcement influence zone has the following characteristics. First, the displacement of each interface layer, i.e., the direct contact interface with the reinforced soil as the center, exhibits a diffusion gradient distribution. The closer the thickness of the gradient layer is to that of the reinforced material, the more significant the displacement of the soil particles. Second, the thickness of each gradient layer is not uniform everywhere, and there are several discontinuous impact zones with scattered distributions along the interface area of the geogrid length. This is due to the horizontal rib portion of its corresponding geogrid. The mechanism here is consistent with the fine-scale displacement law of soil particles; soil particles in front of the horizontal ribs are sheared and compacted, and the soil particles are sheared and expanded after the horizontal rib to form a loose “cavity.” Third, the thickness of the surface layer of the upper part of the geogrid is greater than that of the geogrid’s lower part, and the particle displacement at the upper interface is more obvious. This is due to the “net pocket effect” of the geogrid. The soil sinks under the load so that a vertical deflection of the geogrid occurs, and the concave surface is formed from the plane. The geogrid generates resistance, which reacts to the upper layer of soil to form an “arch effect” and distributes the stress, making the stress on the concave surface greater than that under the concave surface. Under the effect of greater stress, the embedded bite between the soil particles and upper interface, soil particles, and geogrid is tighter and more significantly influenced by geogrid displacement.
3.2 Effect of a normal load on the fine-scale characteristics of the reinforcement influence zone
The displacement clouds of gravelly soil particles under each normal load are analyzed, and the results indicate that the normal load affected the reinforcement influence zone mainly in the following ways, as shown in Table 4. When the general shape of each displacement gradient layer in the reinforcement influence zone does not change with pullout displacement, the pullout displacement is defined as the displacement required for the evolution of the reinforcement influence zone to mature and is recorded as Sδ. At this time, the indirect reinforcing effect of the geogrid on the soil particles is fully developed. The displacement at the peak of the pullout force is recorded as Sτmax. To correspond to the subsequent theoretical derivation, the cloud diagram at the peak of the pullout force is used to analyze the distribution of each gradient layer in the reinforcement influence zone, and the upper and lower reinforcement influence zones are each taken as the four complete displacement gradient layers within the observation interface according to the distance from the reinforced soil interface, denoted as δU1-4 and δL1-4, respectively. The layer thickness is calculated consistently at the highest point.
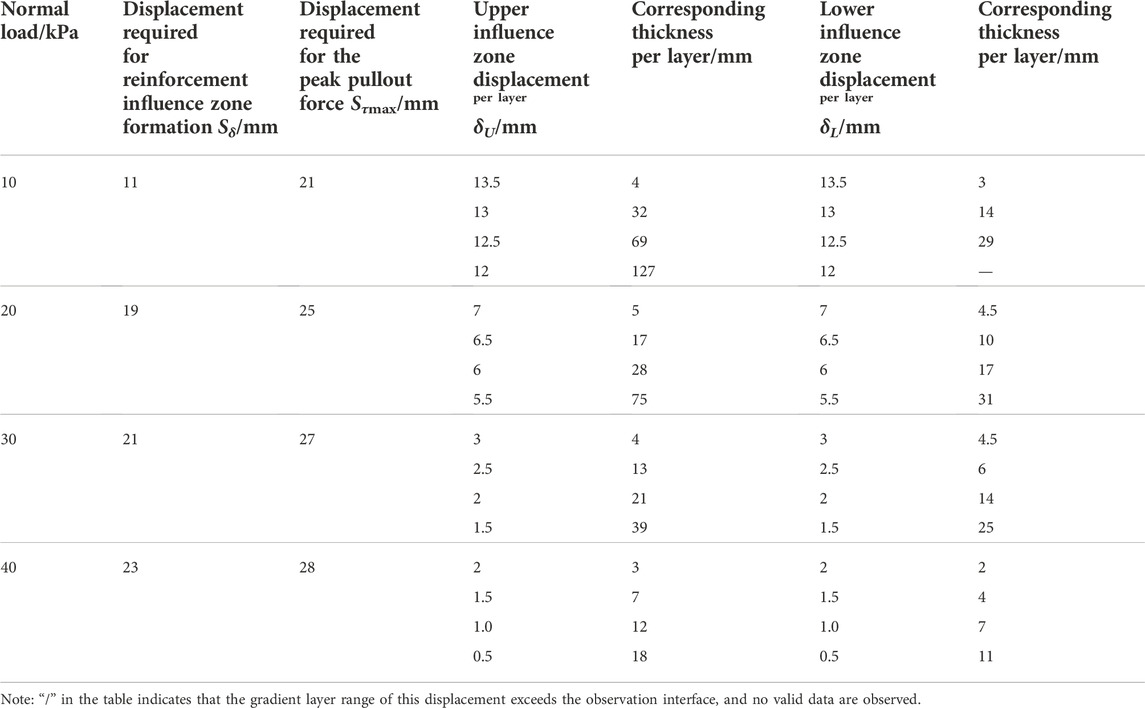
TABLE 4. Displacement and thickness of each layer under different normal loads (at the pullout peak).
From Table 4, both Sδ and Sτmax increase with increasing normal load. The larger the normal load is, the smaller the particle displacement and thickness of each gradient layer in the reinforcement influence zone. The thickness of each gradient layer decays less when the normal pressure increases to a certain degree. This is because the greater the normal load during the pullout process is, the greater the occlusion between soil particles, the greater the embedding and friction between the reinforced soil, and the more difficult it is for the soil particles to be disturbed. The shear zone is formed before the pullout force reaches its peak. The reason is that the formation of the reinforcement zone mainly comes from the dynamic friction stage, and only a very small amount of pullout displacement is needed at this stage to make the horizontal ribs drive the soil particles. Soil particles disturb each other to achieve a solid structure of relative equilibrium at the reinforced soil interface. When the pullout force reaches its peak, the role in the reinforced soil reaches its limit, and the soil particles reach the maximum crowded state. Subsequently, the ultimate equilibrium state is destroyed by the pullout, and the pullout force starts to decrease as the action of the reinforced soil decays. However, particle reorganization quickly reaches a new equilibrium state under the restraint of normal load. This is because after the formation of the reinforcement influence zone, its basic form does not change widely with the peak decay of the pullout force.
The relationship between the thickness of the upper and lower influence zone 1–4 gradient layers and the normal load in Table 4 is plotted in Figure 7, the coefficient of determination (R2) values at 0.965 and 0.953 demonstrate good correlation.
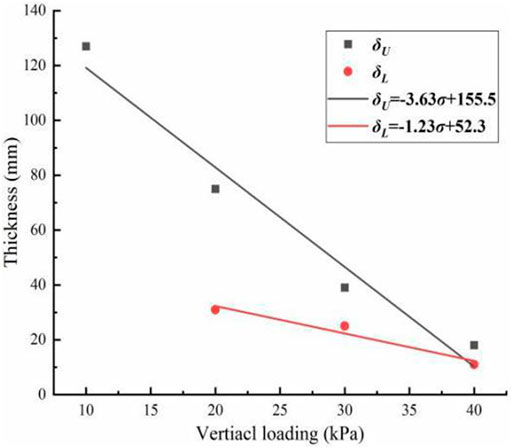
FIGURE 7. Relation curve between the thickness of the 1–3 gradient layer and the normal load.
3.3 Effect of the geogrid type on the fine-scale characteristics of the reinforcement influence zone
After analysis, the displacement clouds of gravelly soil particles with different geogrid types are shown in Figure 8. The results show that the geogrid strength and reinforcement nodes both affect the thickness of the reinforcement influence zone. Due to space limitations, only the particle cloud with reinforcement nodes is shown for comparison with Figure 5C. The data relating to the reinforcement influence zone under each geogrid type are compiled as shown in Table 5. It can be seen that the use of a higher strength geogrid and geogrid with nodes can increase the thickness and displacement of the upper interface gradient layers (1–3 gradient layers) near the geogrid more significantly. Moreover, the scattered discontinuity distribution of these gradient layers is more significant, the “cavity” after the scattered gradient diffusion layer is larger, and the reinforcement influence zone forms faster, while the influence on the gradient layers farther away from the grating (such as four gradient layers) is not significant. The influence of the reinforcement nodes on the gradient layers of the lower interface is not obvious. This is because the embedded locking effect, dominated by the horizontal rib resistance, dominates the contribution of the reinforcement influence zone near the reinforced soil interface. The greater the strength of the geogrid of the same material or with reinforcement nodes is, the greater the thickness of the horizontal rib of the geogrid, and the greater the nibbling and embedding effect of the horizontal rib of the geogrid on the surrounding soil particles. Additionally, the displacement of the soil particles near the horizontal rib of the grating falls into the pore behind the horizontal rib of the geogrid. The soil particles are more easily squeezed under the larger embedding effect to form a solid equilibrium structure, i.e., a reinforcement influence zone.
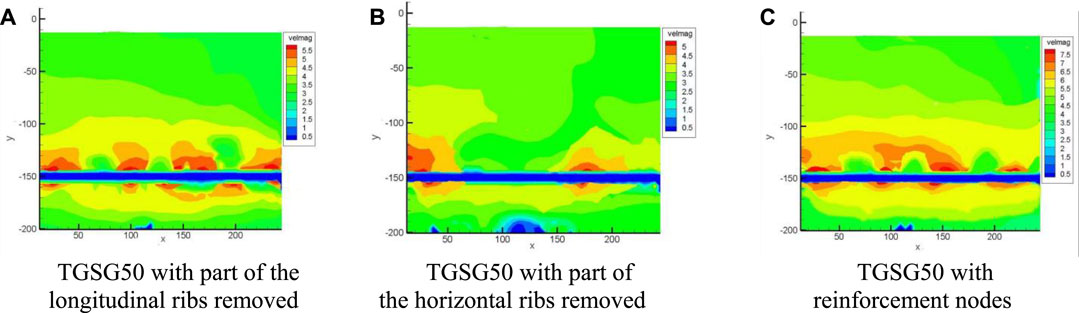
FIGURE 8. The displacement cloud map under different types of grids (at the pullout peak). (A) TGSG50 with part of the longitudinal ribs removed. (B) TGSG50 with part of the horizontal ribs removed. (C) TGSG50 with reinforcement nodes.
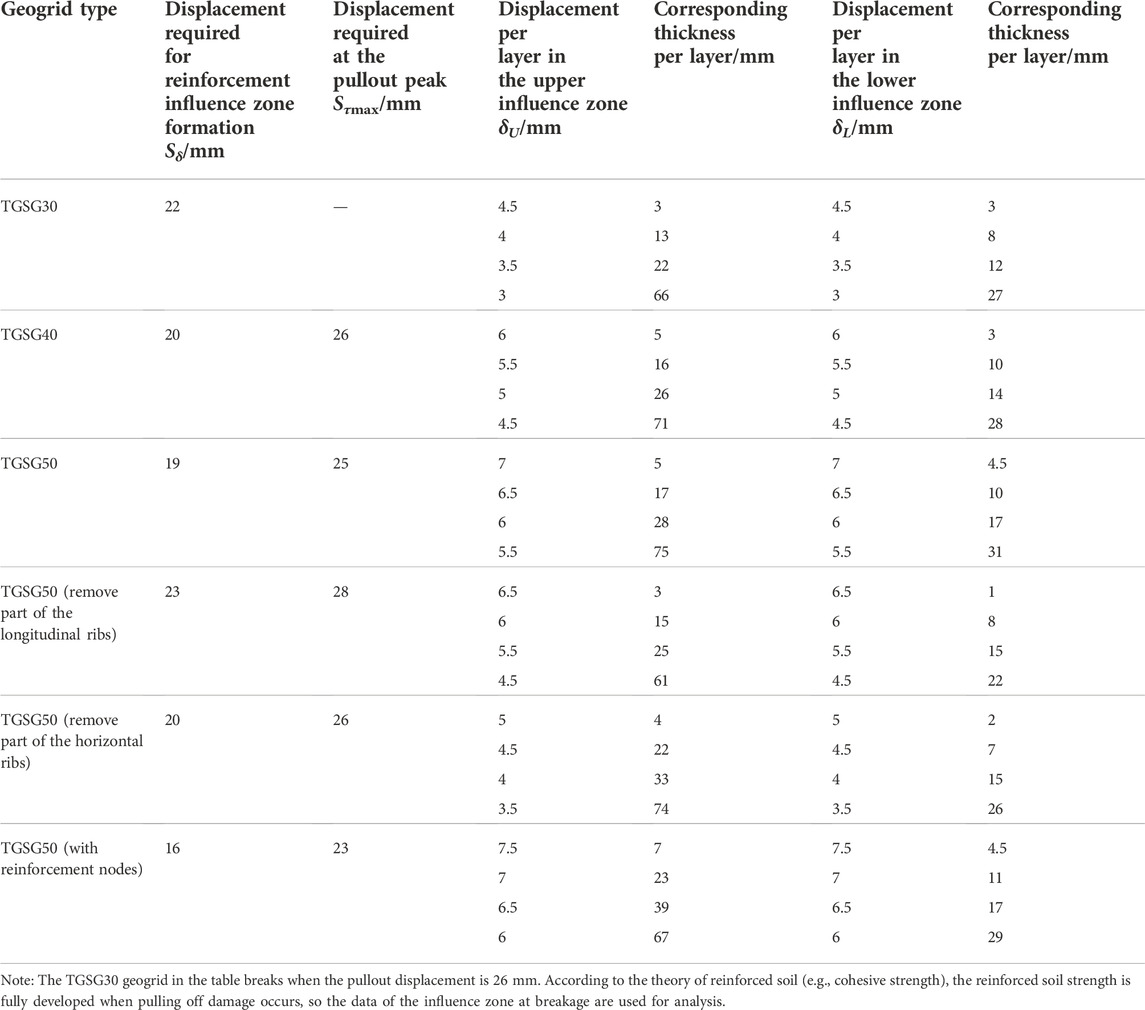
TABLE 5. Displacement and thickness of each layer under different types of grids (at the pullout peak).
After removing some of the geogrid horizontal ribs, the number of scattered gradient diffusion layers and the displacement in the reinforcement influence zone are reduced, and the thickness of the 1–3 gradient layers is reduced by 15.3%. After removing some of the longitudinal ribs of the geogrid, the forming speed of the reinforcement influence zone is 15% slower, the thickness and displacement of the 1–3 gradient layers are slightly reduced, and the thickness of the 4-gradient layer is reduced by 21.7%. This is because the reinforcing effect of the geogrid on the soil is divided into three parts, namely, the longitudinal ribs, the friction between the longitudinal ribs and the soil, and the horizontal ribs, including the occlusion between the nodes of the horizontal ribs and the soil. The former depends on the area of the longitudinal and horizontal ribs and the friction coefficient at the interface between the reinforced materials and the soil. The latter depends on the particle size, the area and thickness of the horizontal ribs and their nodes, and the shape of the horizontal section. A reduction of the longitudinal ribs slows the frictional reinforcing effect, causing an increase in the static frictional phase of pullout displacement required for the passive impedance effect of the horizontal ribs. A reduction of the horizontal ribs reduces the total bite force of the geogrid, the continuity and strength of the soil, and the indirect reinforcement effect on the soil on the macroscopic level. This is reflected in the reduction of the reinforcement influence zone at a fine scale.
To improve the indirect reinforcing effect of the geogrid on soil, the geogrid should be selected as two-way geogrids with small geogrid sizes (dense longitudinal and horizontal ribs), large geogrid stiffnesses, and large reinforcement nodes as much as possible, provided that the influence range of each horizontal rib does not interfere with each other.
3.4 Effect of coarse grain content and particle shape on the fine-scale characteristics of the reinforcement influence zone
The data relating to the reinforcement influence zone under each fill type are shown in Table 6. The gravelly soil particle displacement clouds for the selected conditions 10 (pebbles, coarse grain content P5 = 20%) and 13 (angular gravel, P5 = 35%) are shown in Figure 9 and compared with those of Figure 5C. The coarse grain content P5 increases from 20% to 35%. The formation rate of the reinforcement influence zone increases by 17%, 16.6%, and 5%, and the range of the “cavity” after the scattered gradient diffusion layer is reduced. The particle displacement in the “cavity” is small, and the thickness of the 1–4 gradient layers increases by 63.6%, 35%, and 33.95%. Moreover, the particle displacement in the gradient layer decreased by 16.6%, 15%, and 17.6%. This is because when P5 = 20%, the coarse particles distributed in the fine-grained soil are separated. It is difficult to achieve mutual occlusion, and the combined effect of coarse particles does not occur. The coarser the particle content is, the stronger the interlocking engagement between the geogrid and gravelly soil particles, and the faster it plays out. The coarse particles play a skeletal role in the soil material, and the continuity and integrity of the reinforced soil complex are enhanced. This is evident in both the indirect reinforcement effect of the expanded reinforcement and the not easily disturbed soil particles. When P5 increases from 30% to 35%, the reinforcement influence zone forming rate does not change much, probably because of the following: too many coarse particles, reduced fine particle content, the existence of voids in the coarse particles, and decreased frictional effect in the reinforced soil.
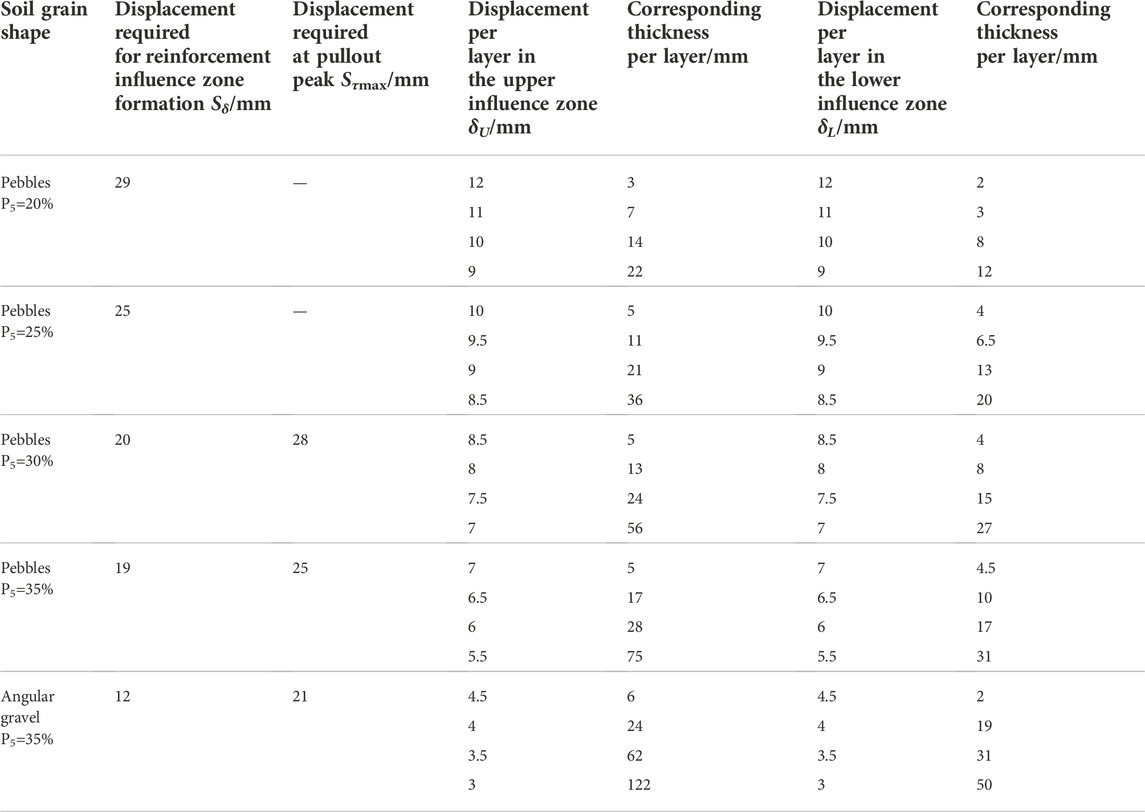
TABLE 6. Displacement and thickness of each layer under different types of soil materials (at the pullout peak).
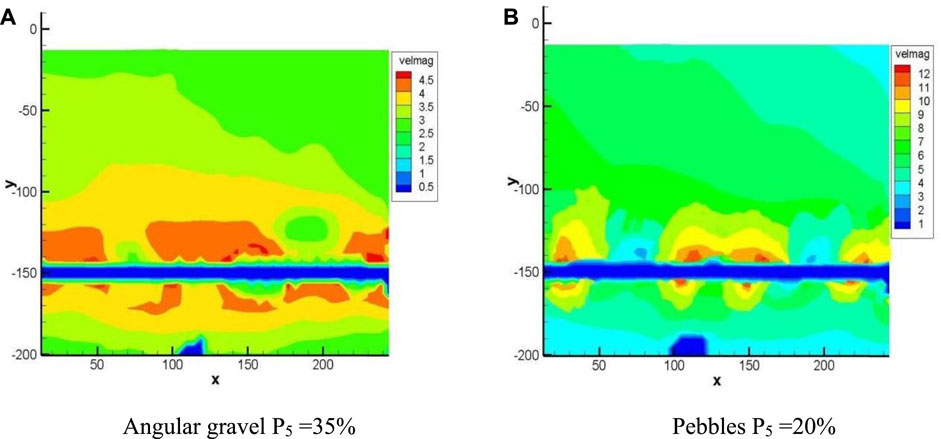
FIGURE 9. The displacement cloud map under different types of soil materials (at the pullout peak). (A) Angular gravel P5 =35% (B) Pebbles P5 =20%.
The fine-scale characteristics of the reinforcement influence zone of the angular gravel soil and the pebble soil for the same coarse grain content are compared. The formation rate of the reinforcement influence zone is 37% higher in the angular gravel soil than in the pebble soil, the thickness of the 1–4 gradient layers is 62% higher, and the displacement of particles in each gradient layer is 21% lower. This is because the coarse particle surface of the angular gravel soil is rougher and more uneven than that of the pebble soil, and its interparticle and particle-geogrid friction and interlocking engagement are better than those of the pebble soil. Only a very small pullout displacement is required to form a solid soil particle movement continuum. This shows that the indirect reinforcement effect of the geogrid on gravel soil is better than that on pebble soil. Therefore, angular gravel soil with certain particle angles is recommended as the filler in the reinforced soil project.
4 Discussion
In this paper, we analyze the fine-scale characteristics of the reinforcement influence zone of geogrid-gravelly soil under the effect of various influencing factors through geogrid pullout tests and digital photographic measurement technology. However, only the normal load, geogrid type, coarse grain content, and particle shape are used in the experimental investigation and analysis, and the sample size of each influencing factor is small. Factors such as the load form, surface roughness of reinforced material, soil temperature, number of layers of reinforcement, and spacing of reinforced material also significantly affect the distribution and evolution of the reinforcement influence zone (Bai et al., 2022). In the future, we can continue to expand the investigation of the influencing factors on the detailed mechanism of reinforced soil as well as increase the number of test samples. Due to the limitation of the observation range of this test equipment, in this study, only the 1–4 displacement gradient layers in the upper and lower interfaces of the reinforcement influence zone are observed and analyzed, but not the complete reinforcement influence zone. However, the overall test data can still fully reflect the fine observation characteristic law at the reinforced soil interface, which is consistent with the conclusion of most scholars (Jing et al., 2020; Prabhakara et al., 2020; b; Maleki A et al., 2021). A pullout box with a sufficient observation range can be designed later to obtain a more comprehensive understanding of the overall thickness and gradient distribution of the reinforcement influence zone. At present, direct shear and pullout tests are the two most effective methods to study the interface of reinforced soil. However, there are differences in the damage modes corresponding to the two tests in the actual engineering and in the test data (Kazem and Aref et al., 2021; Iman et al., 2022; Sun et al., 2022). A detailed experimental study of the direct shear test of reinforced soil under various influencing factors can be continued in the future.
5 Conclusion
Based on the geogrid pullout test, the fine-scale characteristics of the reinforced soil interface under different normal loads, geogrid types, coarse grain contents, and particle shapes were investigated by digital photographic measurement technology. The evolution, distribution, and soil particle displacement of the reinforcement influence zone were analyzed, the effects of various factors on the fine-scale characteristics of the reinforcement influence zone (forming speed, thickness of each gradient layer, and particle displacement) were explored, and the following conclusions were obtained.
(1) The complete development of the reinforcement influence zone precedes the peak pullout force. After complete development, the basic form and soil particle displacement direction do not change with the pullout displacement. The displacement layers in the influence zone are centered on the reinforced soil interface and are distributed in a diffusion gradient, the thickness of the gradient layer closer to the reinforcement is smaller, and the displacement of soil particles is more significant. The thickness of each gradient layer in the upper influence zone is greater than that in the lower influence zone. The larger the normal load is, the smaller the particle displacement and thickness of each gradient layer in the reinforcement influence zone, and the larger the pullout displacement required for the complete development of the reinforcement influence zone.
(2) Using higher strength geogrids and geogrids with nodes can increase the thickness and displacement of the 1–3 gradient layer at the upper interface more significantly and increase the forming speed of the reinforcement influence zone. The longitudinal ribs of the geogrid mainly affect the forming speed of the reinforcement influence zone. The horizontal ribs affect the number, displacement, and range of the scattered gradient diffusion layers on the reinforcement influence zone and play a significant role in the formation of the reinforcement influence zone.
(3) The higher the coarse grain content in the fill is, the smaller the particle displacement in each gradient layer of the reinforcement influence zone and the greater the thickness. When the coarse grain content increased from 20% to 30%, the pullout displacement required to fully develop the reinforcement influence zone decreased significantly. The reinforcement influence zone formation rate did not change significantly when the coarse grain content increased from 30% to 35%. All the fine characteristic indexes of the reinforcement influence zone in angular gravel soil are better than those in pebble soil, which indicates that the indirect reinforcement effect of the geogrid on the angular gravel soil is better.
Data availability statement
The original contributions presented in the study are included in the article/supplementary material, further inquiries can be directed to the corresponding author.
Author contributions
JL and HD contributed to analysis and manuscript preparation. HD, QB, and HY performed the data analyses and wrote the manuscript. BW, BG, and BZ helped perform the analysis through constructive discussions.
Funding
This study received funding from Xinjiang Transport Planning Survey and Design Institute Co., Ltd. (Grant Nos KY2020112301; KY2021100901). The funder was not involved in the study design, collection, analysis, interpretation of data, the writing of this article or the decision to submit it for publication.
Conflict of interest
JL, HY, and BW are employed by Xinjiang Traffic Planning Survey Design Research Institute Co., Ltd.
The remaining authors declare that the research was conducted in the absence of any commercial or financial relationships that could be construed as a potential conflict of interest.
Publisher’s note
All claims expressed in this article are solely those of the authors and do not necessarily represent those of their affiliated organizations, or those of the publisher, the editors and the reviewers. Any product that may be evaluated in this article, or claim that may be made by its manufacturer, is not guaranteed or endorsed by the publisher.
References
Abdi, M. R., and Mirzaeifar, H. (2017). Experimental and PIV evaluation of grain size and distribution on soil–geogrid interactions in pullout test. Soils Found. 57 (6), 1045–1058. doi:10.1016/j.sandf.2017.08.030
Bai, Qiyu, He, Guofeng, Wang, Yong, and Liu, Jie (2022). Experimental investigation on mechanical properties of geocell strips at low temperature. Materials 15, 5456. doi:10.3390/MA15155456
Baykal, G., and Dadasbilge, O. (2008). Experimental investigation of pull-out resistance of uniaxial geogrids,” in Geosynthetics in civil and environmental engineering (Berlin, Heidelberg: Springer), 174–178. doi:10.1007/978-3-540-69313-0_35
Chen, Cheng, Indraratna, Buddhima, McDowell, Glenn, and Rujikiatkamjorn, Cholachat (2015). Discrete element modelling of lateral displacement of a granular assembly under cyclic loading. Comput. Geotechnics 69, 474–484. doi:10.1016/j.compgeo.2015.06.006
Chen, Lu, Qiao, Lan, and Li, Qingwen (2019). Study on dynamic compaction characteristics of gravelly soils with crushing effect. Soil Dyn. Earthq. Eng. 120, 158–169. doi:10.1016/j.soildyn.2019.01.034
Christian, Kahl, Julius, Bagnucki, and JanChristoph, Zarges (2022). Demonstration of hybrid effect in single fiber pull-out tests for glass/cellulose-reinforced polypropylene with different fiber–matrix adhesions. Polymers 14 (13), 2517. doi:10.3390/POLYM14132517
Feng, Da-Kuo, Zhang, Jian-Min, and Hou, Wen-Jun (2018). An automated large-scale Apparatus for 3-D cyclic testing of soil-structure interfaces. Geotech. Test. J. 41 (3), 20170129. doi:10.1520/GTJ20170129
Ghasemi, Nezhad Mahdi, Alireza, Tabarsa, and Nima, Latifi (2021). Effect of natural and synthetic fibers reinforcement on California bearing ratio and tensile strength of clay. J. Rock Mech. Geotechnical Eng. 13 (3), 626–642. doi:10.1016/J.JRMGE.2021.01.004
Han, B., Ling, J., Shu, X., Gong, H., and Huang, B. (2018). Laboratory investigation of particle size effects on the shear behavior of aggregate-geogrid interface. Constr. Build. Mater. 158, 1015–1025. doi:10.1016/j.conbuildmat.2017.10.045
Highway Research Institute (2020). Ministry of Transport JTG 3430 2020 Highway geotechnical test regulations. Beijing: People’s Communications Press.
Hu, Y-c, Jin, S-w, Song, L., MAo, A-m., and Liu, J. (2017). Stability analysis of reinforced soil slopes based on observation of reinforcement-effected strip. Chin. J. Geotechnical Eng. 39 (02), 228–234. doi:10.11779/CJGE201702005
Iman, Amirhosseini, Vahid, Toufigh, and Emad, GhazaviBaghini (2022). Three-dimensional modeling of geogrid pullout test using finite-element method. Int. J. Geomech. 22 (3), 04021297. doi:10.1061/(ASCE)GM.1943-5622.0002218
Jayawickrama, Priyantha W., Lawson, William D., Wood, Timothy A., and Surles, James G. (2015). Pullout resistance factors for steel MSE reinforcements embedded in gravelly backfill. J. Geotech. Geoenviron. Eng. 141 (2). doi:10.1061/(ASCE)GT.1943-5606.0001192
Jing, Li, JiaFei, Ya, Chen, MiaoXi, and XieXing, Ming (2020). Discrete element analysis of the load transfer mechanism of geogrid-ballast interface under pull-out load. Adv. Civ. Eng. 2020 (5), 1–12. doi:10.1155/2020/8892922
Kazem, Fakharian, and Aref, Pilban (2021). Pullout tests on diagonally enhanced geocells embedded in sand to improve load-deformation response subjected to significant planar tensile loads. Geotext. Geomembranes 49 (5), 1229–1244. doi:10.1016/J.GEOTEXMEM.2021.04.002
Kim, Daehyeon, and Ha, Sungwoo (2014). Effects of particle size on the shear behavior of coarse grained soils reinforced with geogrid. Materials 7 (2), 963–979. doi:10.3390/ma7020963
Konstantin, Hauch, Kasem, Maryamh, Claudia, Redenbach, and Schnell, Jürgen (2022). Predicting the tensile behaviour of ultra-high performance fibre-reinforced concrete from single-fibre pull-out tests. Materials 15 (14), 5085. doi:10.3390/MA15145085
Li, Yunong, Li, Wei, and Xu, Shan (2022). Deformation analysis of geosynthetic-encased stone column-supported embankments using cavity expansion model. Eur. J. Environ. Civ. Eng. 26 (7), 2834–2854. doi:10.1080/19648189.2020.1775707
Liu, F. Y., Zhu, C., Yuan, G. H., Wang, J., Gao, Z. Y., and Ni, J. F. (2021). Behaviour evaluation of a gravelly soil-geogrid interface under normal cyclic loading. Geosynth. Int. 28 (5), 508–520. doi:10.1680/JGEIN.21.00011
Maleki, A., Lajevardi, S. H., Briançon, L., Nayeri, A., and Saba, H. (2021). Experimental study on the L-shaped anchorage capacity of the geogrid by the pullout test. Geotext. Geomembranes 49 (4), 1046–1057. doi:10.1016/J.GEOTEXMEM.2021.02.003
Miao, Chen-xi, Zheng, Jun-jie, Zhang, Rong-jun, Yin, Jian-hua, and Yin, J. h. (2017). Visualization of pullout behaviour of geogrid in sand with emphasis on size effect of protrusive junctions. J. Cent. South Univ. 24 (9), 2121–2133. doi:10.1007/s11771-017-3621-7
Mirzaalimohammadi, A., Ghazavi, M., Lajevardi, S. H., and Roustaei, M. (2021). Experimental investigation on pullout behavior of geosynthetics with varying dimension. Int. J. Geomech. 21 (6). doi:10.1061/(ASCE)GM.1943-5622.0002051
Nanjing Hydraulic Research Institute (2012). SL235 2012 Specification for test and measurement of geosynthetics[S]. Beijing: China Water and Power Press.
Prabhakara, Karnam, Kumar, Bhargav, Umashankar, Balunaini, and Arul, Arulrajah (2020). Development of a unique test apparatus to conduct axial and transverse pullout testing on geogrid reinforcements. J. Mat. Civ. Eng. 33 (1), 04020406. doi:10.1061/(ASCE)MT.1943-5533.0003497
Puttinger, S., and Saeedipour, M. (2022). Time-resolved PIV measurements of a deflected submerged jet interacting with liquid-gas and liquid-liquid interfaces. Exp. Comput. Multiph. Flow. 4 (2), 175–189. doi:10.1007/s42757-020-0103-1
Rehman, Zia ur, and Zhang, Ga (2019). Shear coupling effect of monotonic and cyclic behavior of the interface between steel and gravel. Can. Geotech. J. 56 (6), 876–884. doi:10.1139/cgj-2018-0262
Ren, Z. L., Cheng, Y. P., Xu, X., and Li, L. (2022). DEM investigation of shear mobilisation during tyre strip pull-out test. Geosynth. Int., 1–14. doi:10.1680/JGEIN.21.00100
Reza, Mahinroosta, and Vahid, Oshtaghi (2021). The effect of particle shape on the deformation and stress reduction of a gravel soil due to wetting. Sci. Rep. 11 (1), 16583. doi:10.1038/S41598-021-95731-Y
Riwaj, Dhakal, Misko, Cubrinovski, and Bray Jonathan, D. (2016). Evaluating the applicability of conventional CPT-based liquefaction assessment procedures to reclaimed gravelly soils. Soil Dyn. Earthq. Eng. 153, 107176. doi:10.1016/J.SOILDYN.2022.107176
Roodi, Gholam H., and Zornberg, Jorge G. (2017). Stiffness of soil-geosynthetic composite under small displacements. II: Experimental evaluation. J. Geotech. Geoenviron. Eng. 143 (10). doi:10.1061/(ASCE)GT.1943-5606.0001769
Sun, Yongshuai, Li, Xuefeng, and Wang, Guihe (2022). Influence of stone shape factor on the pull-out resistance of geogrid in the soil-rock mixture. Adv. Mater. Sci. Eng. 2022 (12), 1–14. doi:10.1155/2022/4975059
Tan, Xin, Hu, Zhengbo, Cao, Ming, and Chen, Changfu (2020). 3D discrete element simulation of a geotextile-encased stone column under uniaxial compression testing. Comput. Geotechnics 126, 103769. doi:10.1016/j.compgeo.2020.103769
Vangla, Prashanth, and Gali, Madhavi Latha (2016). Effect of particle size of sand and surface asperities of reinforcement on their interface shear behaviour. Geotext. Geomembranes 44 (3), 254–268. doi:10.1016/j.geotexmem.2015.11.002
Wang, Qingbiao, Hu, Zhongjing, You, Hongyue, Xu, Haolin, Bai, Lujie, Yang, Shanghuan, et al. (2022). Field pull-out test and analysis of fiberglass anchors in sanshandao gold mine. Geofluids 2022 (8), 1–8. doi:10.1155/2022/5160876
Wang, J., Liu, F. Y., Wang, P., and Cai, Y. Q. (2016). Particle size effects on coarse soil-geogrid interface response in cyclic and post-cyclic direct shear tests. Geotext. Geomembranes 44 (6), 854–861. doi:10.1016/j.geotexmem.2016.06.011
Wang, Yong, Wang, Yanli, Kong, Lingwei, and Sun, Zhiliang (2020). Post-liquefaction shearing behaviour of saturated gravelly soils: Experimental study and discrete element simulation. J. Rock Mech. Geotechnical Eng. 12 (5), 1119–1130. doi:10.1016/j.jrmge.2020.01.007
Wang, Zhijie, Jacobs, Felix, and Ziegler, Martin (2014). Visualization of load transfer behaviour between geogrid and sand using PFC 2D. Geotext. Geomembranes 42 (2), 83–90. doi:10.1016/j.geotexmem.2014.01.001
Wu, Yang, Shi, Kebin, and He, Jianxin (2022). Experimental study on interfacial friction characteristics of composite geomembranes. J. Asian Archit. Build. Eng. 21 (5), 1959–1967. doi:10.1080/13467581.2021.1964973
Zhang, Jiasheng, Chen, Xiaobin, and Jia, Yu (2018). Stress-strain response and dilation of geogrid-reinforced coarse-grained soils in large-scale direct shear tests. Geotech. Test. J. 41 (3), 20160089. doi:10.1520/GTJ20160089
Zhao, Xudong, Minhajur Rahman Mohammod, D'Antino Tommaso, Francesco, Focacci, and Christian, Carloni (2022). Effect of bonded length on the load response and failure mode of pull-out tests of GFRP bars embedded in concrete. Constr. Build. Mater. 347, 128425. doi:10.1016/J.CONBUILDMAT.2022.128425
Zhou, J., Chen, J.-F., Xue, J.-F., and Wang, J.-Q. (2012). Micro-mechanism of the interaction between sand and geogrid transverse ribs. Geosynth. Int. 19 (6), 426–437. doi:10.1680/gein.12.00028
Keywords: reinforcement influence zone, geogrid, pullout test, fine-scale characteristics, digital photographic measurement technology, gravelly soil
Citation: Liu J, Gao B, Du H, Bai Q, Yang H, Zhong B and Wang B (2023) Experimental study on the fine-scale characteristics of a geogrid-gravelly soil reinforcement influence zone. Front. Earth Sci. 10:1053728. doi: 10.3389/feart.2022.1053728
Received: 29 September 2022; Accepted: 31 October 2022;
Published: 16 January 2023.
Edited by:
Dawei Fan, Institute of Geochemistry (CAS), ChinaReviewed by:
Jiaquan Wang, Guangxi University of Science and Technology, ChinaNan Gui, Tsinghua University, China
Copyright © 2023 Liu, Gao, Du, Bai, Yang, Zhong and Wang. This is an open-access article distributed under the terms of the Creative Commons Attribution License (CC BY). The use, distribution or reproduction in other forums is permitted, provided the original author(s) and the copyright owner(s) are credited and that the original publication in this journal is cited, in accordance with accepted academic practice. No use, distribution or reproduction is permitted which does not comply with these terms.
*Correspondence: Bin Wang, d2FuZ2JpbjEzMjQ1QDEyNi5jb20=
†These authors have contributed equally to this work