Abstract
After the first impoundment of the reservoir, many landslides seriously threatened the safety of the reservoir. Accurate determination of the relationship between the landslide deformation characteristics and water-level fluctuations is crucial. However, with the increasing number of water-level fluctuation cycles, the deformation characteristics of the landslides were also changing, and long-term continuous monitoring to capture the failure process of reservoir landslides is necessary. A large reacted landslide in the Xiluodu reservoir was set as an example, using InSAR technology to seek its variations of deformation characteristics over nine years. The local deformation rate and annual maximum deformation area variation were analyzed by InSAR technology based on Sentinel-1 descending SAR data from October 2014 to June 2022. According to the regional deformation characteristics, the landslide was divided into three zones: Zone I above the elevation of 950 m; Zone II below it; the front edge of Zone II, where the collapse happened, was further divided into Zone III. In general, the accumulated deformation in Zone I was the largest, followed by Zone III, and Zone II was the smallest. The average deformation rate of Zone II was the smallest. Zone I of NLJL was mainly affected by the drawdown of reservoir water level, and the impacts of water-level rising and drawdown on Zone II and Zone III were similar. After analyzing a nine-year variation of the deformation area, the deformation mechanism of NLJL changed from a retrogressive type to a progressive one after the first impoundment and then changed back to a retrogressive one after 2017. The impact of reservoir impoundment on NLJL was most substantial in the first three years after the first impoundment.
1 Introduction
After the reservoir impoundment, the stability of the slope deteriorated, and many landslides seriously threatened the safety of the reservoir (Paronuzzi et al., 2013; Li et al., 2019; Wu et al., 2022). The Vajont landslide, the most typical disastrous landslide in the world, occurred in Italy in October 1963 and caused about 2,600 deaths (Müller-Salzburg, 1987; Paronuzzi et al., 2013). It is common sense that reservoir landslide deformations strongly correlate with water level fluctuations (Schuster, 1979). Some deformations increased mainly during the rising periods of water level, some increased mainly during the drawdown periods of water level, and some increased continuously (Jones et al., 1961; Nakamura, 1990; Yang et al., 2021). In the Grand Coulee reservoir, Washington, United States, from 1941 to 1953, 49% occurred during water fillings, 30% during drawdowns of water level, and the rest were more minor landslides that occurred at other times (Jones et al., 1961). The study on the reservoir landslides in Japan (Nakamura, 1990) also indicated that about 60% of the landslides occurred due to the water-level drawdown operations and 40% due to the water-level rising operations. The research on the 674 landslides in the Three Gorges Reservoir showed that 75.5% of landslides occurred during the water-level rising periods, and others occurred mainly during the drawdown periods (Yang et al., 2021).
It is essential to accurately determine the relationship between landslides and water-level fluctuations for landslide prevention in the reservoir area (Xiong et al., 2019). However, with the continuous increase of the operating time of the reservoir and the continuous increase of the water level fluctuation cycles, the dynamic characteristics of landslides gradually changed sometimes (Gu et al., 2017; Li et al., 2019). According to the dynamic characteristics, the International Association of Engineering Geology (IAEG) defined the two types of landslide as retrogressive and progressive (Mitchell and Klugman, 1979; Wang et al., 2016; Gschwind et al., 2019). For example, in the Baijiabao landslide in the Three Gorges reservoir area, retrogressive was the primary deformation mechanism in the early stage, and horizontal progressive was the primary deformation mechanism in the late stage during the 12 years after impoundment (Huang & Chen, 2007; Yao et al., 2019). Similarly, the deformation mechanism of the Woshaxi landslide in the Three Gorges reservoir area was mainly retrogressive in the early stage and was mainly progressive in the later stage, according to the GPS monitoring results from 2006 to 2009 (Lu et al., 2013; Wang et al., 2019). However, due to discontinuous monitoring data, it is impossible to judge when the landslide dynamic started to change accurately.
Therefore, to accurately capture the failure process of reservoir landslides, long-term continuous monitoring of landslide deformation is necessary (Di Maio et al., 2018; Doi et al., 2019). The main methods of landslide deformation monitoring methods are mainly divided into surface and deep deformation monitoring, but these methods have their limitations (Wasowski and Bovenga, 2014; Sun et al., 2015). Interferometric Synthetic Aperture Radar (InSAR) technology is one of the surface monitoring methods and has been widely used for landslide location detection and landslide deformation monitoring, which can overcome the limitations of the situ measurements (Strozzi et al., 2005; Colesanti and Wasowski, 2006; Li et al., 2019). However, the InSAR method also has its limitations, e.g., its measurement range is controlled by the wavelength, the monitoring accuracy is controlled by many factors such as atmosphere and vegetation, and depends on the experience of the person handling data (Zhao et al., 2012; Wasowski and Bovenga, 2014; Sun et al., 2015). To minimize decorrelation in SAR interferometry and obtain high-quality interpretation results, many researchers proposed a series of InSAR techniques, e. g., small baseline subset InSAR (SBAS-InSAR), Stacking-InSAR and persistent scatterer InSAR (PS-InSAR) (Hooper et al., 2004; Casu et al., 2006; Biggs et al., 2007; Sousa et al., 2011; Novellino et al., 2017). In recent years, with the continuous accumulation of SAR data from various satellites, InSAR has been a more effective method to continuously monitor a long-time surface deformation than other situ measurements (Shi et al., 2019; Pawluszek-Filipiak et al., 2021; Yi et al., 2022).
The Niulanjiang landslide is one of the large-scale old landslides in the Xiluodu reservoir area, on the Jinsha River, in China, and there is a village on the landslide. After the first impoundment of the reservoir, the landslide was revived, which seriously threatened the safety of the villagers and the reservoir area. Therefore, we used InSAR technology to study the long-term failure process of the Niulanjiang landslide from October 2014 to June 2022. This paper analyzed the relationship between landslide deformation and the reservoir water-level fluctuations and the changing of landslide dynamic characteristics eight years after the first impoundment to provide a reference for the study of the long-term activity mechanism of reservoir landslides.
2 Geological setting
2.1 Geological background of the Xiluodu reservoir
The Xiluodu Reservoir is located at the border between Leibo County of Sichuan Province and Yongshan County of Yunnan Province (Figure 1A). After the completion of the Xiluodu dam, the water level elevation in the Xiluodu Reservoir Area (XLDRA) rose from the initial level of 440 m–600 m in May 2013. The water level has fluctuated periodically between 540 and 600 m since May 2014. The XLDRA, covering the area from its dam site to the dam site of the Baihetan, is approximately 197.5 km long along the mainstream of the Jinsha River (Figure 1B). The elevation of the mountains generally ranges from 2000 to 3,500 m, with the highest elevation being 4,036 m (Figure 1B). The major tectonic structures in the area are mainly NE-trending faults and folds. In contrast, the minor structures are NW-trending faults (Figure 1B).
FIGURE 1
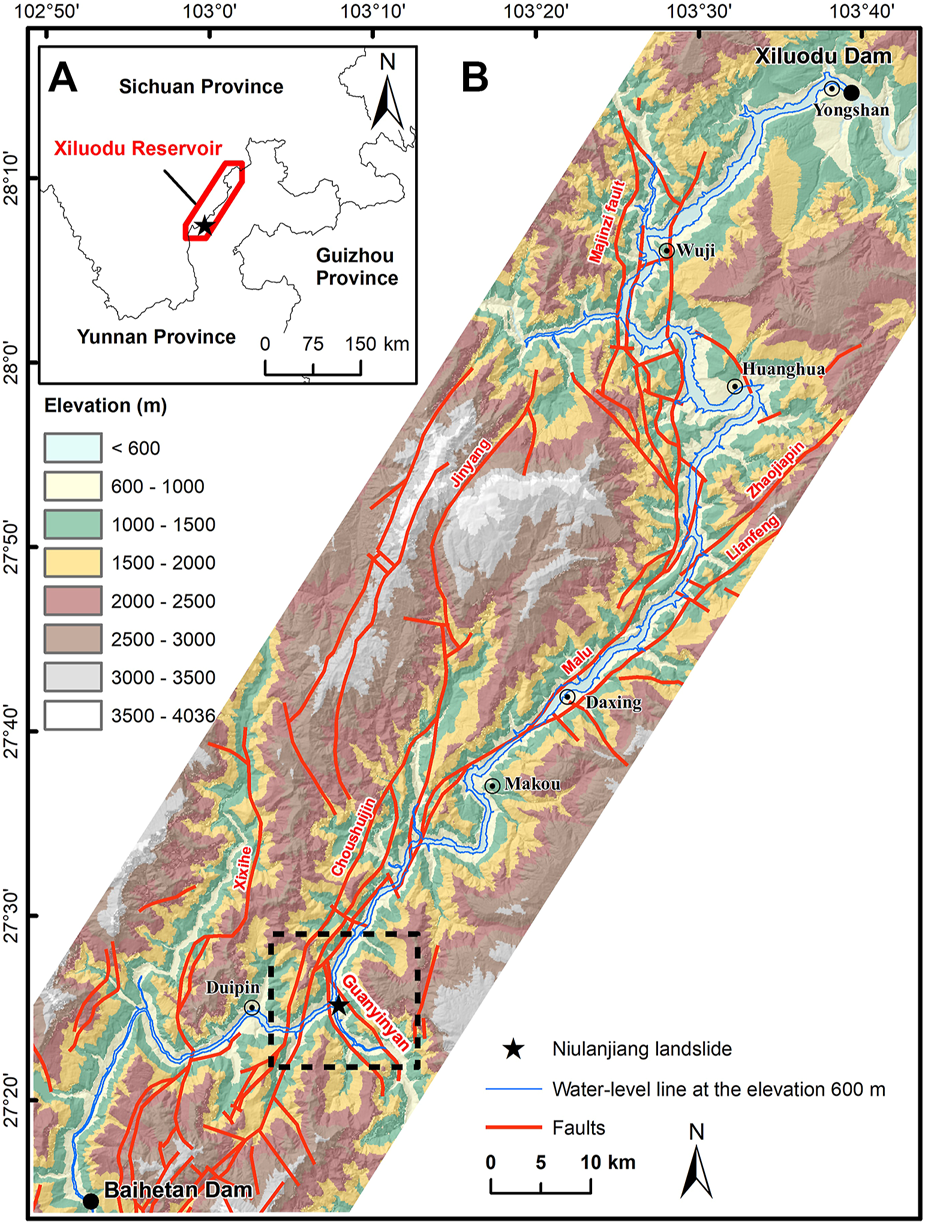
Geological Background of the XLDRA and the location of the Niulanjiang landslide. (A) The location of the XLDRA; (B) The location of the Niulanjiang landslide and elevation and faults distribution in XLDRA.
2.2 Niulanjiang landslide
Niulanjiang landslide (NLJL) is located in the south section of XLDRA, at the intersection of Jinsha River and Niulanjiang River. The “armchair” landform of NLJL is prominent (Figures 2A,B), and collapses had occurred in the area with steep accumulation at the front edge of the landslide (Figure 2C and Figure 3). The longitudinal length of the landslide is about 1,670 m, the horizontal width is 150–810 m, and its plane area is approximately 936,000 m2. The front edge elevation of the landslide is 530 m, and the rear edge elevation is 1,300 m (Figure 4). The slope above the 860 m elevation is about 35°; the slope of the Shigenao village platform is between 820 m and 860 m in the middle is less than 10°; the slope of 820–660 m in the lower part is about 25°, and the slope of the riverside section below is 38°. According to the exploration (Figure 4), the landslide accumulation is thin in the upper part and thick in the lower part. The thickness above the elevation of 850 m is 92.55 m, and the lower part is generally 140.25–240.64 m, with a volume of about 1.07×10⁸ m3. A fault passes through the back of the landslide near the elevation of 970–1,070 m, with occurrence N20 W/SW ∠ 80 (Figure 4). The footwall stratum of the fault is a cataclinal slope, and the hanging wall of the fault is the anaclinal slope (Figures 2D,4).
FIGURE 2
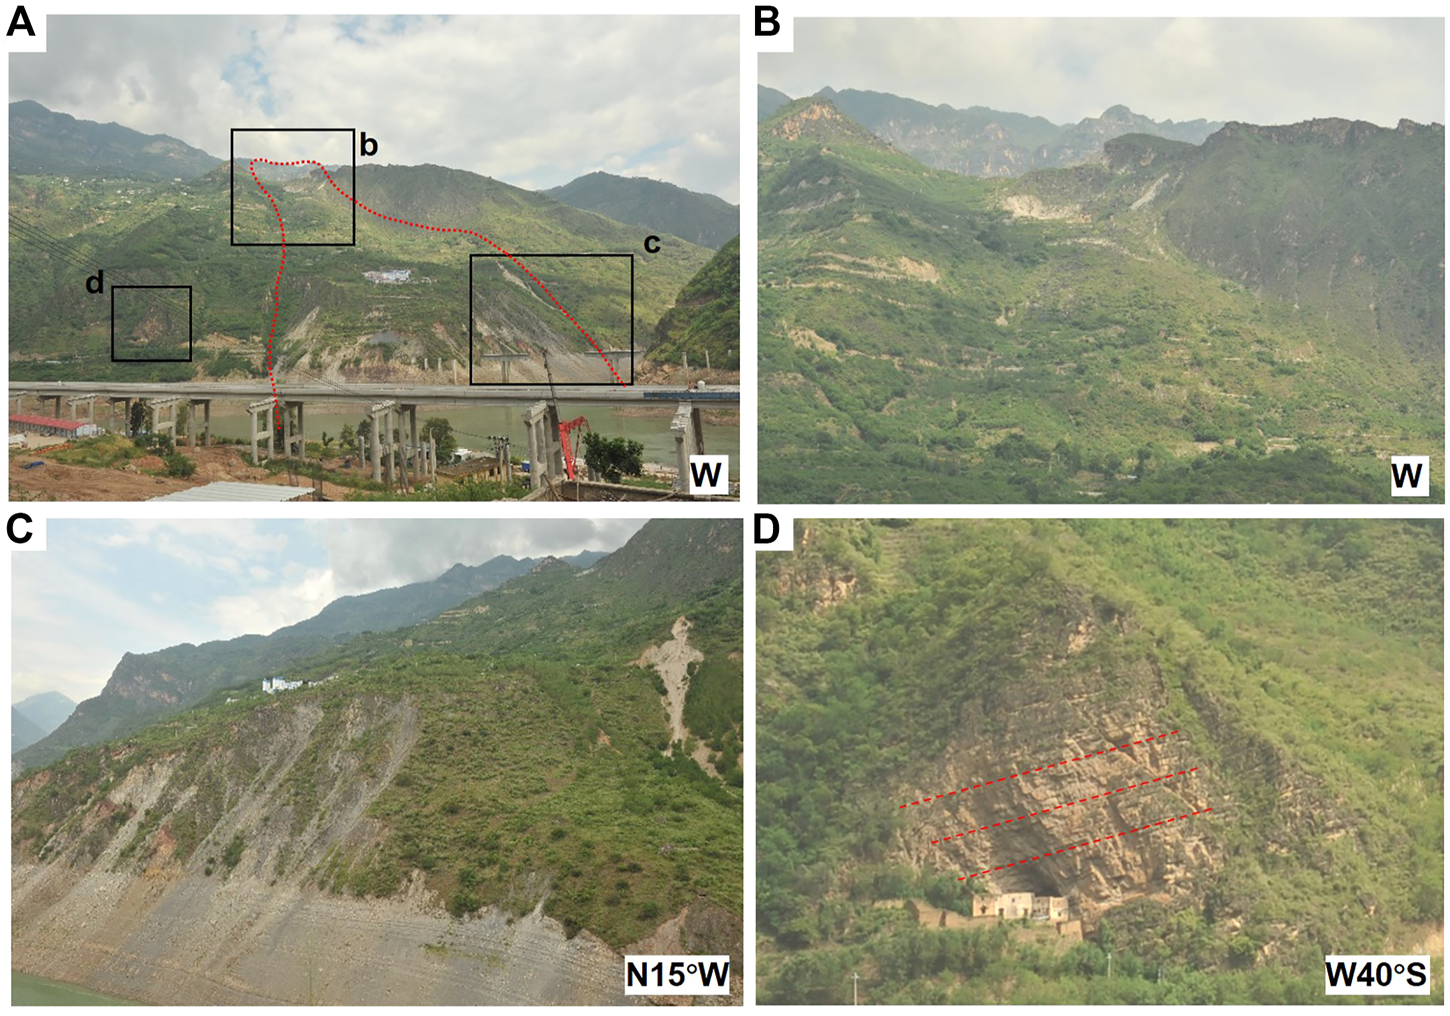
Site photos of the NLJL taken in April 2022. (A) Photo of the landslide and the locations of figures b, c, d; (B) Crown of the landslide; (C) Right foot of the landslide; (D) Anti-dip rock slope.: The camera’s direction was marked in the lower right corner.
FIGURE 3
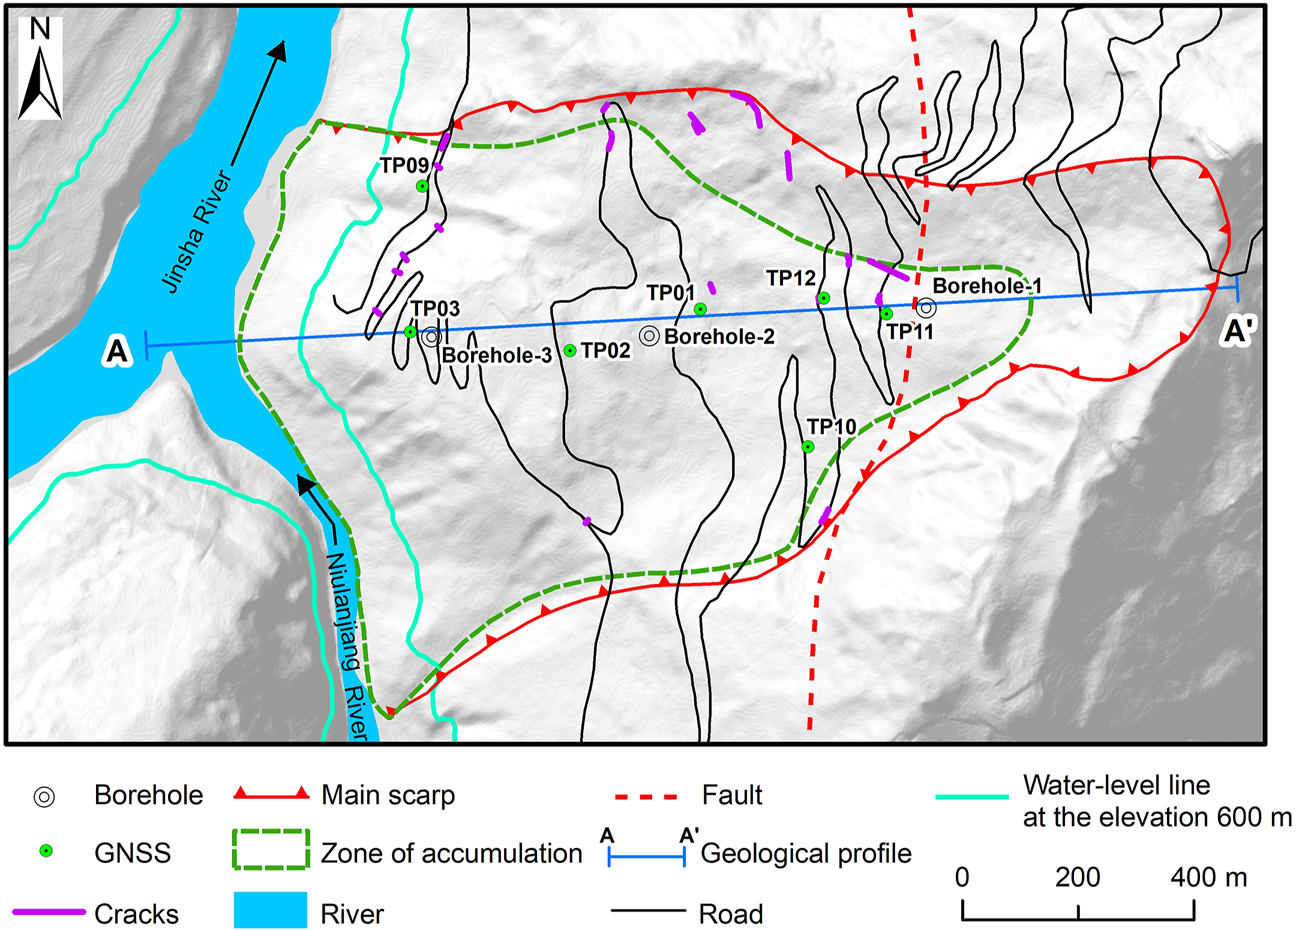
Plan of NLJL and locations of GNSS monitoring points, boreholes, cracks, and line of geological cross section (after CHIDI, 2021).
FIGURE 4
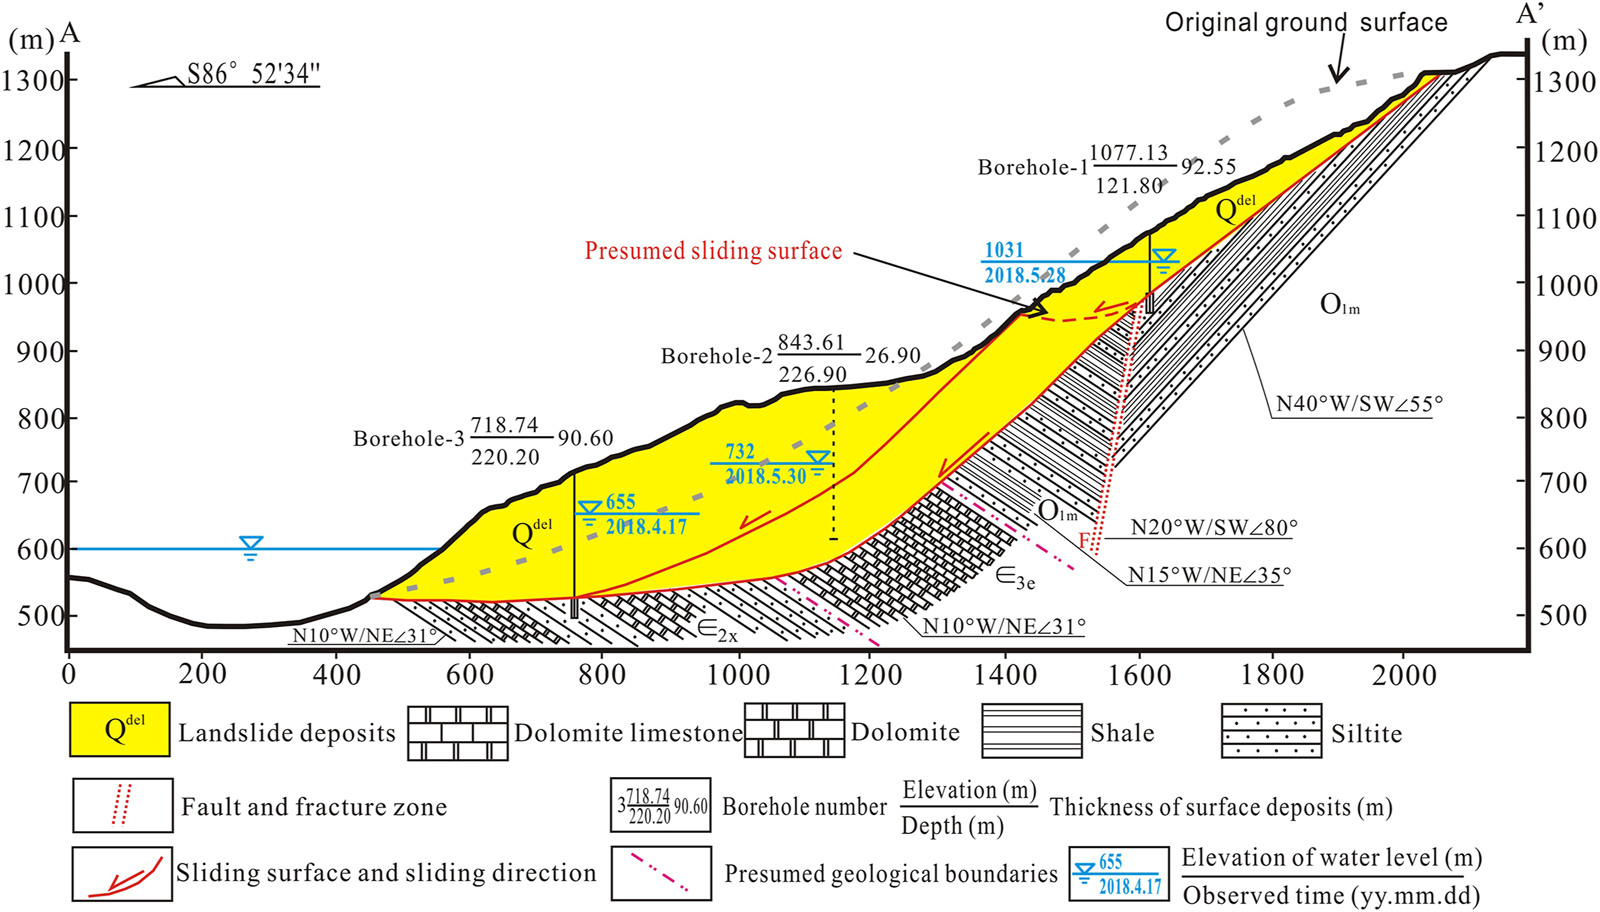
Geological cross-section A–A' of NLJL (modified after CHIDI, 2021).
After the first impoundment of the reservoir, NLJL showed signs of overall revival. According to site investigation and boreholes results provided by the Chengdu Engineering Corporation Limited (CHIDI) (2021), the landslide structure is very complex, with two sliding surfaces (solid line sliding surface) developed in the landslide (Figures 3,4). Furthermore, according to InSAR results, it is speculated that there could be one more sliding surface (dotted sliding surface) on the upper part of NLJL (Figures 3,4).
On 23 June 2013, the reservoir was impounded to the dead water level of 540 m, and the lower part of the landslide was immersed. In April and September 2014, field investigations showed many cracks in the landslide (Figure 3). On 29 June 2018, at the 940 m elevation, the highway pavement appeared to have a crack along the slope direction, which was about 25 m long and 0.2–3 cm wide. Two days later (1 July 2018), the crack width increased by about 1.0 cm. The above evidence indicated that after the reservoir impoundment, the landslide had undergone more significant deformation and damage (Figure 3).
3 Data and methods
According to the data for the research (Table 1), there was no available monitoring data before October 2014. After October 2014, the Sentinel-1 satellite in the region had synthetic aperture radar (SAR) data available. Fortunately, we also have collected some GNSS data from Three Gorges Corporation, which can be used for comprehensive analysis. Details of each type of data are described below.
TABLE 1
| Time (year) | 2013 | 2014 | 2015 | 2016 | 2017 | 2018 | 2019 | 2020 | 2021 | 2022 |
|---|---|---|---|---|---|---|---|---|---|---|
| Sentinel-1 SAR data | — | ○ | ○ | ○ | ○ | ○ | ○ | ○ | ○ | ○ |
| GNSS (TP01, TP02, TP03, TP09) | — | ○ | ○ | ○ | ○ | ○ | ○ | ○ | — | — |
| GNSS (TP10, TP11, TP12) | — | — | — | ○ | ○ | ○ | ○ | ○ | — | — |
Time axis of the SAR data, GNSS data, and deep deformation monitoring data.
Note: ○ represents the data in the time was available—represents no data in the time.
3.1 Synthetic aperture radar data
The Sentinel-1 is the European Space Agency (ESA) satellite, and the SAR data resolution, wavelength, and incident angle are 2.33 m × 13.99 m, 5.6 cm, and 37.7°, respectively. As the imaging direction of the satellite is in the line-of-sight direction, a better differential interference result can be obtained in descending orbit than ascending at the NLJL area. Therefore, Sentinel-1 SAR descending data (a total of 229 SAR data) from October 2014 to June 2022 was used in this research (Table 1; Figure 5).
FIGURE 5
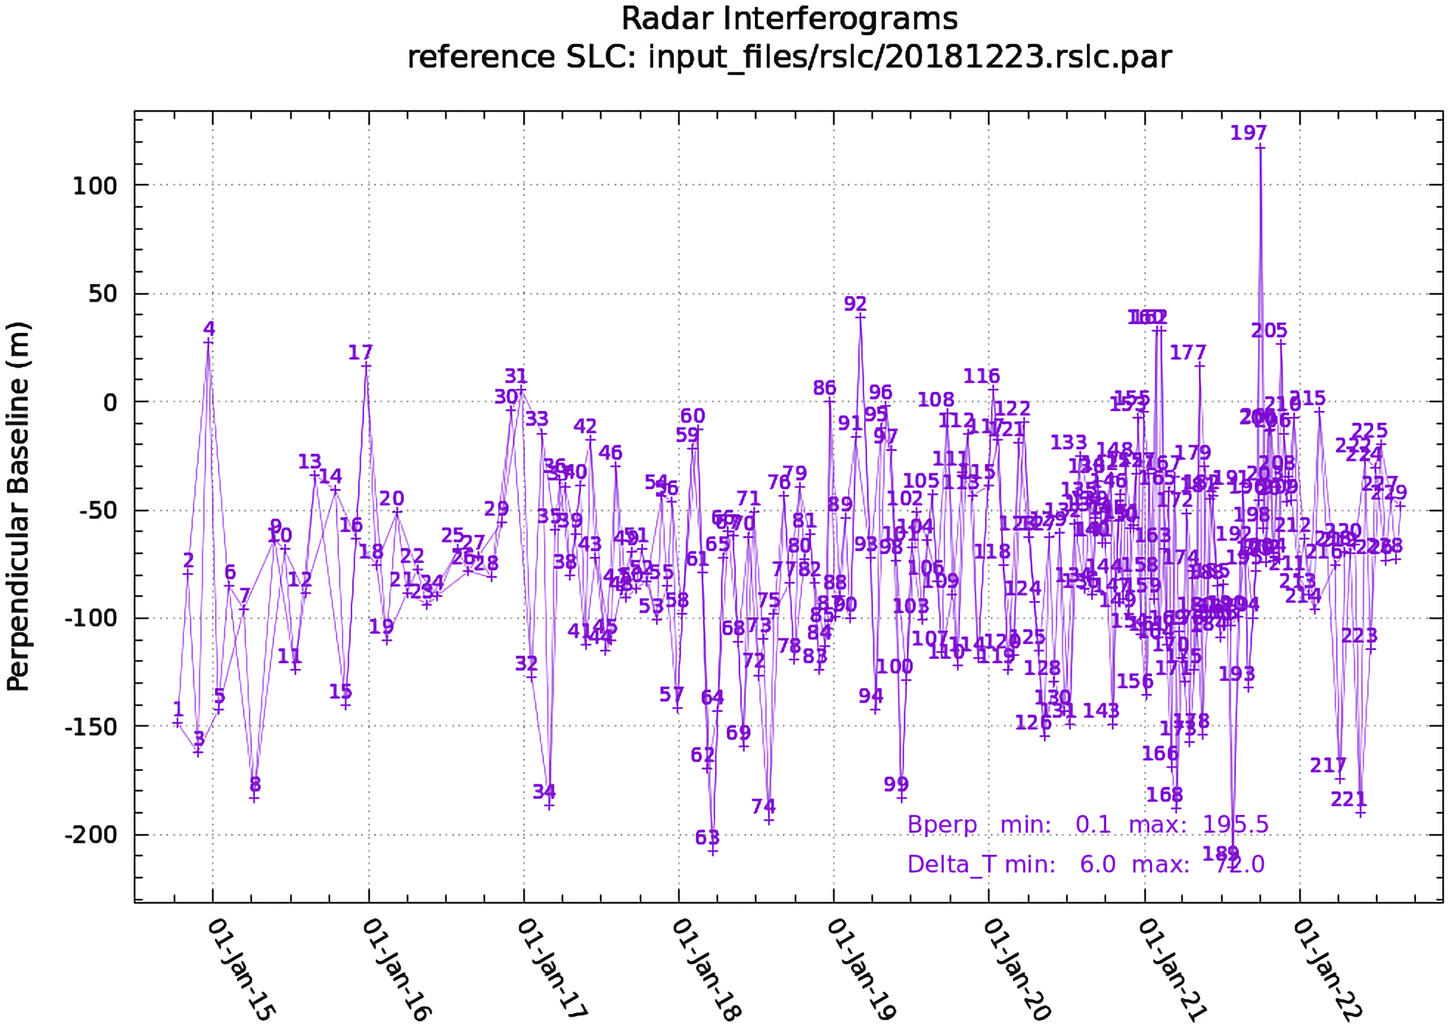
Perpendicular baseline of SAR images.
3.2 Other data
The water level, precipitation, and GNSS data (Figure 6) were collected from HydroChina Chengdu Engineering Corporation (CHIDI) (2021) for further analysis. The GNSS numbers are based on the original data numbers from CHIDI (2021). Due to the missing data from some GNSS base stations, the valid data numbers collected are TP01, TP02, TP03, TP09, TP10, TP11, and TP12 (Figures 3,6; Table 1).
FIGURE 6
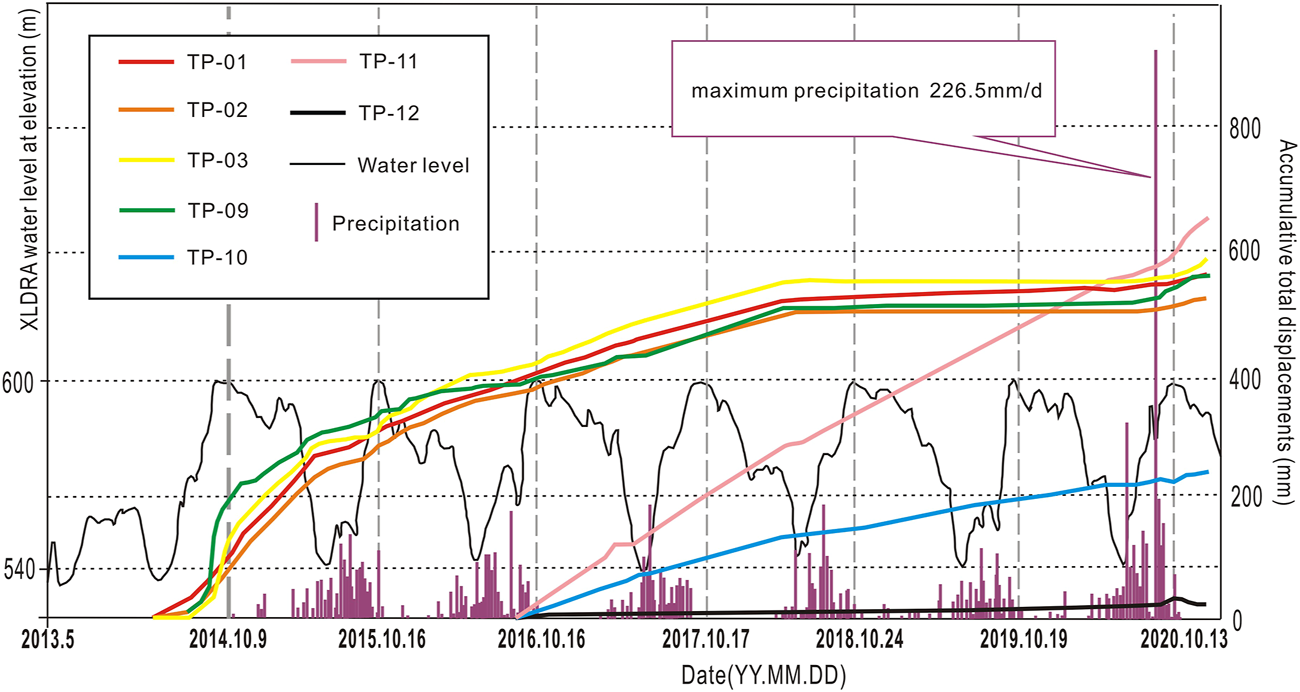
Water level, GNSS monitoring data (resultant displacements), and precipitations (after CHIDI, 2021).
3.3 Materials and methods
3.3.1 InSAR processing
InSAR exploits the phase differences of at least two complex-valued SAR images acquired from different orbit positions at different times. The information derived from these interferometric data sets can be used to measure several geophysical quantities (Bamler and Hartl, 1998). Differential InSAR (D-InSAR), phase resonance enhanced InSAR (PRE-InSAR), and small baseline subset InSAR (SBAS-InSAR) technologies (Fruneau et al., 1996; Novellino et al., 2017; Yao et al., 2020) were used in turn in this research. All the InSAR processing was performed on the GAMMA Software, and the terrain data used for InSAR processing were 6 m resolution SPOT-7 stereo pair digital surface model (DSM) in 2019.
The SAR data after registration was clipped with NLJL as the center and was performed with 9 × 1 in multi-looking processing. In the D-InSAR processing, the adaptive filtering algorithm was used to lower phase noise and improve measurement accuracy and phase unwrapping. In GAMMA software (Software version: 2021.12), the program “atm_mod2” was used to evaluate linear regression of the unwrapped phase concerning the height and calculate a model of the atmospheric phase. It should be noted that the PRE-InSAR technology (Yao et al., 2020) is a post-processing method. After D-InSAR processing, the multiple D-InSAR results were performed by an average calculation to enhance the interference phase and highlight the spatial characteristics of high-frequency deformed landslides. This method is more suitable for interpreting the boundary of the maximum deformation area. In the SBAS-InSAR processing, the selected time baseline was the period of six adjacent scenes.
3.3.2 Local deformation rate
It was evident that most landslides’ deformation areas and displacements varied with time. Therefore, the long-time failure processes of NLJL were thus introduced by variation of deformation area and local deformation rate with time in this study.
The SBAS-InSAR technology was used to obtain the local deformation rate of NLJL. The reference SAR data calculated by SBAS-InSAR was 23 December 2018, and the total number and the period of the SAR data used were 229 from October 2014 to June 2022, respectively.
Based on SBAS-InSAR results, a rate profile with the exact location of the geological cross-section and ten permanent scatter (PS) points were selected on the landslide for deformation rate analysis. The principle for selecting PS points was that they could cover areas with typical deformation characteristics of the landslide. Combined with the collected 7 GNSS data, the long-time series analysis of the local deformation of NLJL was carried out. It should be pointed out that since the InSAR measurement results are in the satellite line of sight direction (LOS), the only valuable data for the NLJL is the descending orbit data, which cannot be decomposed into three-dimensional displacements.
3.3.3 Deformation area
To obtain the maximum deformation area of NLJL each year, we divided the Sentinel-1 SAR data by year. Since the SAR data in 2014 and 2022 were archived for less than one year, only the SAR data from 2015 to 2021 were processed by annual PRE-InSAR to analyze the characteristics of NLJL deformation for each variation of maximum deformation area in the year. The methods were as follows: 1) D-InSAR processing was conducted by 207 descending orbiting Sentinel-1 SAR data from January 2015 to December 2021; 2) The D-InSAR results in 2015, 2016, 2017, 2018, 2019, 2020, and 2021 were selected, respectively for PRE-InSAR processing (Table 2); 3) According to the PRE-InSAR results of each year, the variations of maximum deformation area of NLJL from 2015 to 2021 can be analyzed. Due to the small amount of SAR data in 2015 and 2016, interferometric unwrapping may lose phase, resulting in more minor results than actual deformation.
TABLE 2
| Year | 2015 | 2016 | 2017 | 2018 | 2019 | 2020 | 2021 |
|---|---|---|---|---|---|---|---|
| Amount of the SAR data | 13 | 14 | 26 | 29 | 29 | 40 | 56 |
Amount of the SAR data used in PRE-InSAR each year.
4 Results
4.1 Relative deformation rate
According to Section 2, the landslide cracks were found for the first time in the field investigation in April 2014. Combined with the oral statements of residents, the actual deformation time of NLJL might be earlier. According to the SBAS-InSAR results of Sentinel-1, the mean velocity in the LOS of 7183 PS points was -15.04 mm/year, and the standard deviation was 25.84 mm/year. The nodes of -90.00, -60.00, -30.00, 10.00, and 40.00 mm/year were set by the standard deviation to divide the LOS velocities to show the landslide deformation gradient (Figure 7).
FIGURE 7
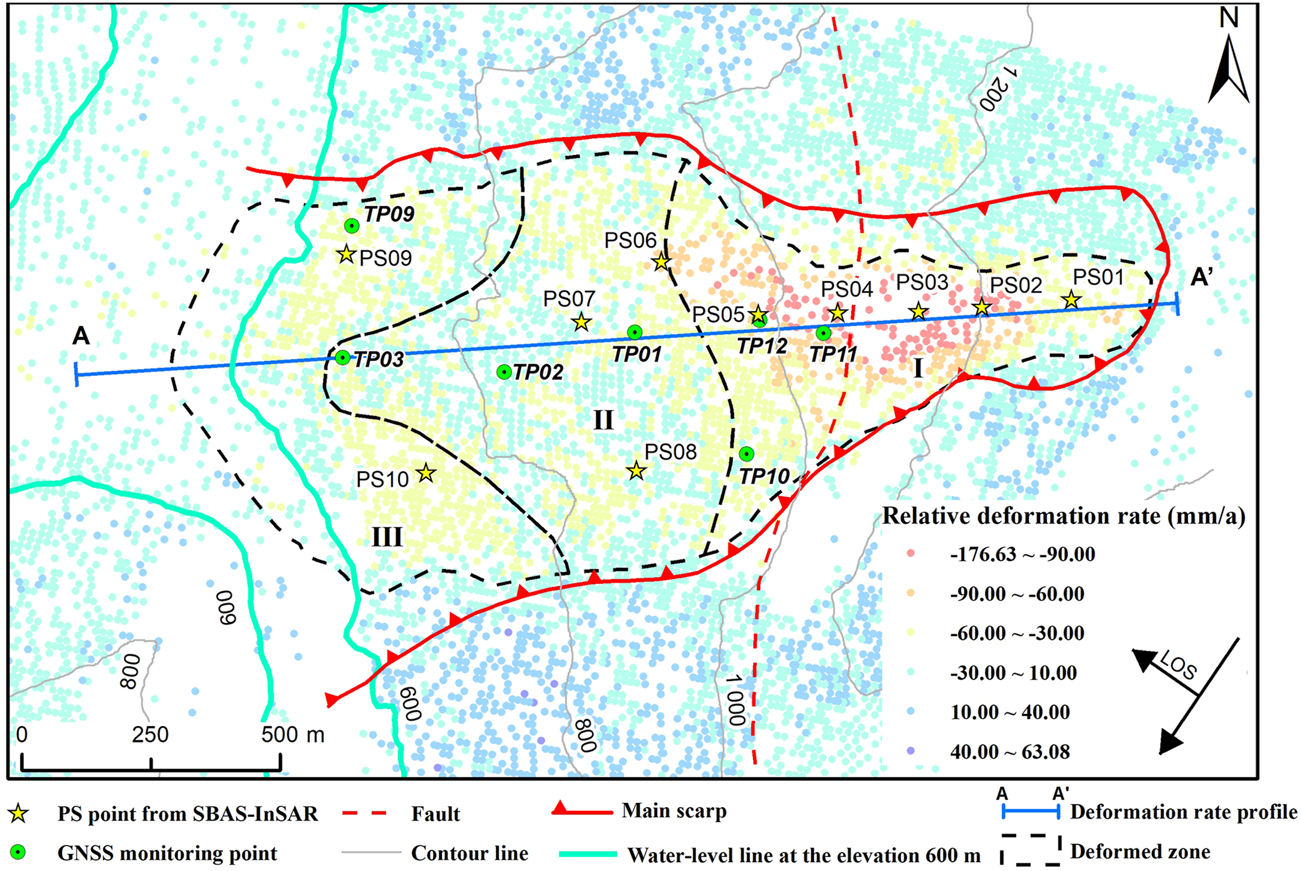
SBAS-InSAR results of the NLJL, the locations of the selected 10 PS points from SBAS-InSAR, and the locations of GNSS.
According to SBAS-InSAR and PRE-InSAR results from October 2014 to June 2022, combined with the accumulation body area (Figure 3), the NLJL was divided into three zones: Zone I was above the elevation of 950 m; Zone II was below it; the front edge of Zone II which collapse happened was further divided into Zone III (Figure 7). In general, the accumulated deformation in Zone I was the largest, followed by Zone III, and Zone II was the smallest (Figures 7,8).
FIGURE 8
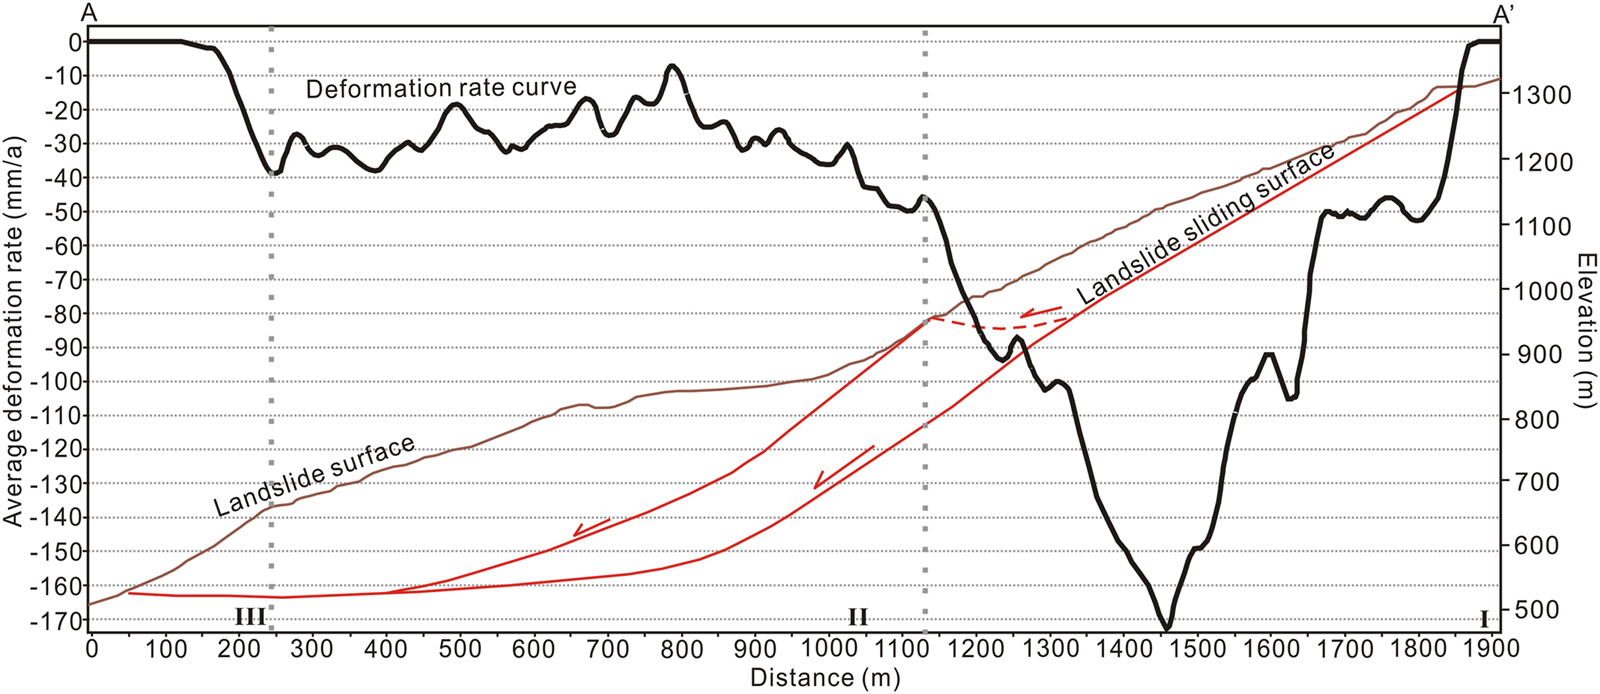
Deformation rate profile of A-A′ according to SBAS-InSAR results.
The cumulative deformation curves of 10 PS points were further analyzed (Figure 9): 1) According to the data of the same period of GNSS (Figure 6), the SBAS-InSAR results from 2014 to 2016 were smaller than the actual deformation; 2) The deformation rates of PS07 and PS08 in Zone II were smallest of those of all the selected PS points, which indicated that the average deformation rate of Zone II was the smallest; 3) According to the cumulative deformation curves of PS02, PS03, PS04, PS05 and PS06 after 2017, the slopes of curves in the water-level drawdown periods increased rapidly, and the slopes in the water-level rising periods was relatively stable (Figure 9). Therefore, it is speculated that Zone I of NLJL was mainly affected by the drawdown of reservoir water level, and the impacts of water-level rising and drawdown on Zone II and Zone III were similar.
FIGURE 9
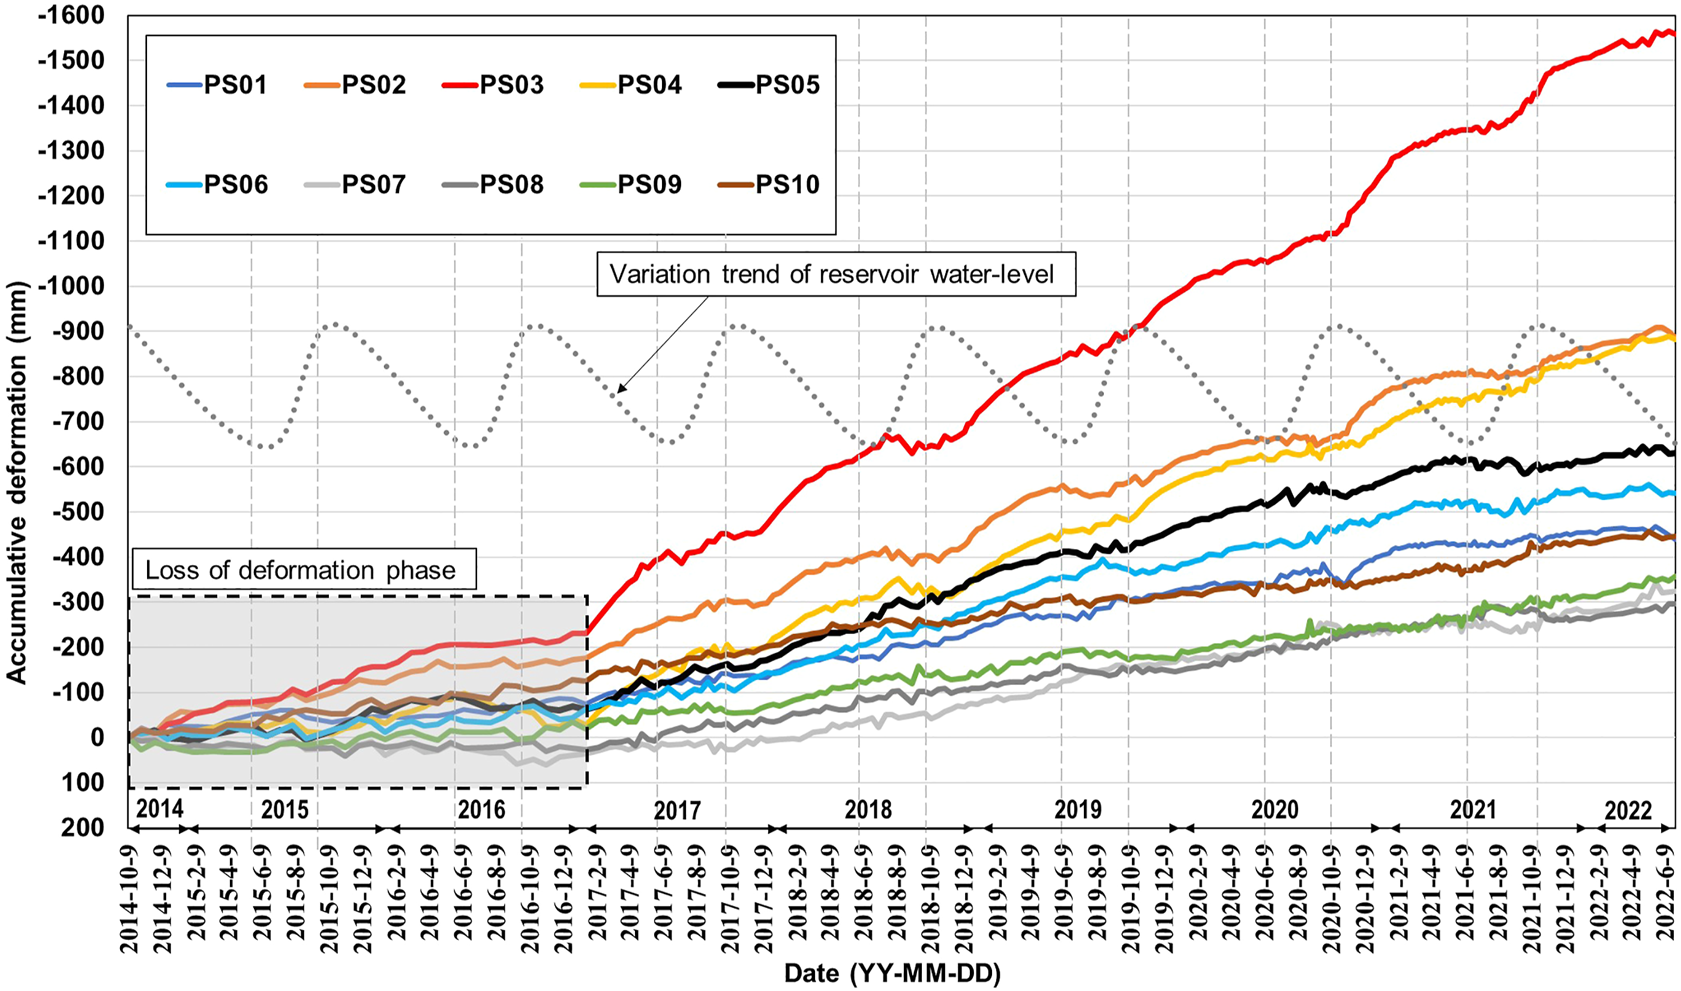
Cumulative displacement curves of 10 PS points monitored by SBAS-InSAR.
4.2 Annual deformation area
For the analysis of the deformation area (as described in Section 3.3.2), due to the SAR data in 2014 and 2022 being archived for less than one year, only results from 2015 to 2021 were under-analyzed. According to the PRE-InSAR results from 2015 to 2021 (Figure 10): 1) The deformation area in Zone I and Zone II was the largest in 2017, and the deformation area in Zone Ⅲ was most significant in 2016 (Figures 10B,C); 2) The three zones had been continuously deformed from 2015 to 2021; 3) The deformation area in Zone I was more significant than the other two zones in 2015, 2017, 2018, 2019, 2020, and 2021 (Figures 10A–G), and it was less than that in Zone Ⅲ in 2016 (Figure 10B).
FIGURE 10
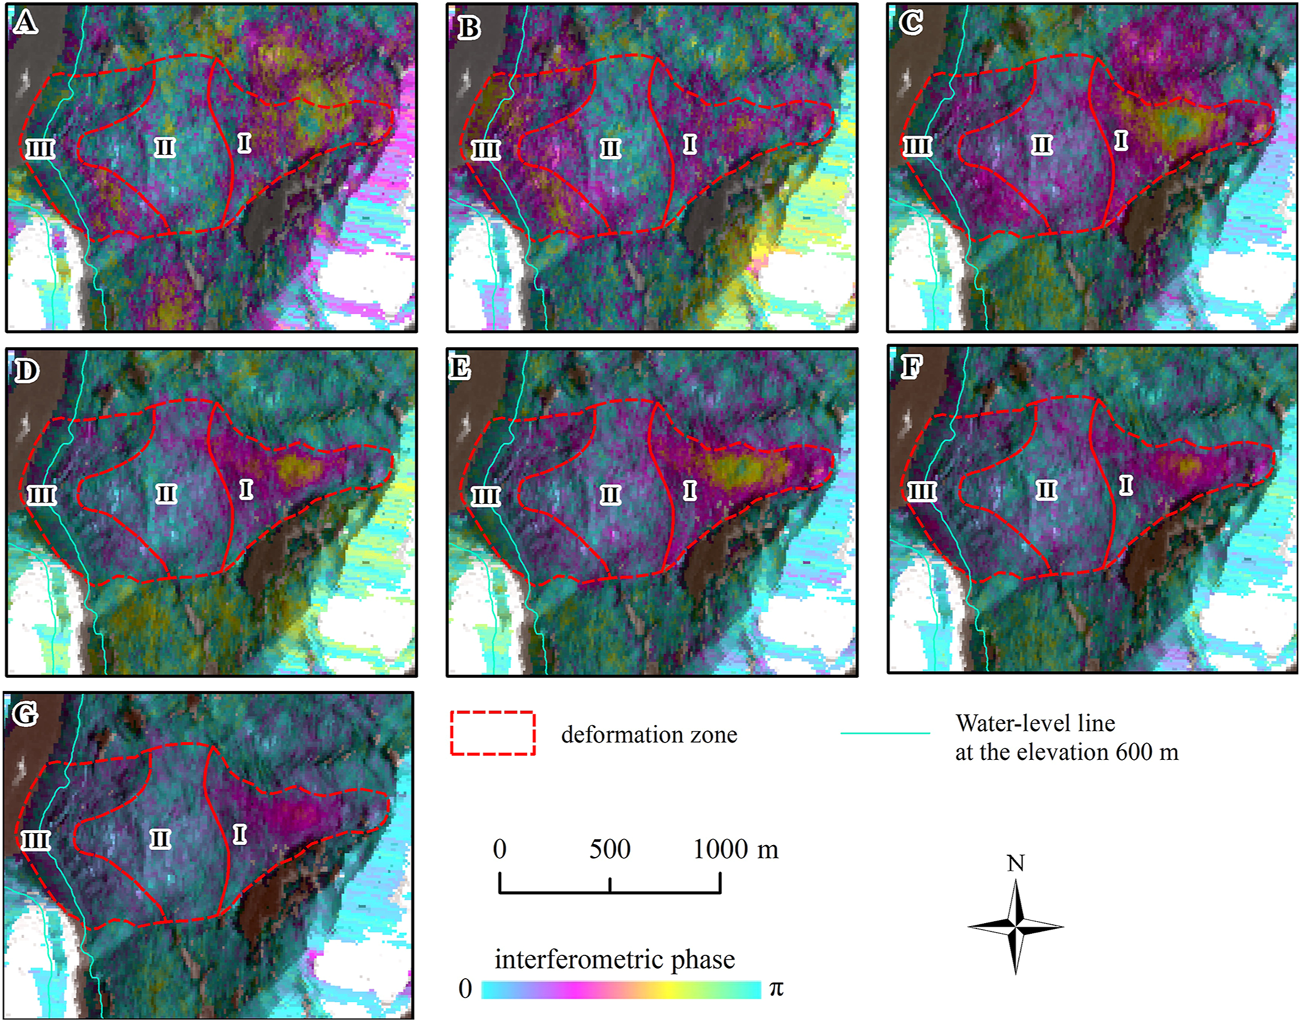
PRE-InSAR results of NLJL from different periods. (A) PRE-InSAR in 2015; (B) PRE-InSAR in 2016; (C) PRE-InSAR in 2017; (D) PRE-InSAR in 2018; (E) PRE-InSAR in 2019; (F) PRE-InSAR in 2020; (G) PRE-InSAR in 2021.
5 Discussions
5.1 Long-term failure processes of Niulanjiang landslide
According to the analysis of the deformed area and deformation rate, after a nine-year evolution, the deformation mechanism of NLJL changed from a retrogressive to a progressive type after the first impoundment in 2017 and then gradually changed back to a retrogressive type after 2017. The specific process is described as follows:
Firstly, according to the field survey before the impoundment, the NLJL was mainly deformed in the upper area (Figures 11A,B). After the reservoir impoundment, the maximum depth of the front edge of the landslide submerged underwater was nearly 70 m. The strength of the sliding face soil was reduced by the water below the reservoir water level, further deteriorating the stability of the landslide, resulting in collapses in the front edge of the landslide (Figure 11C).
FIGURE 11
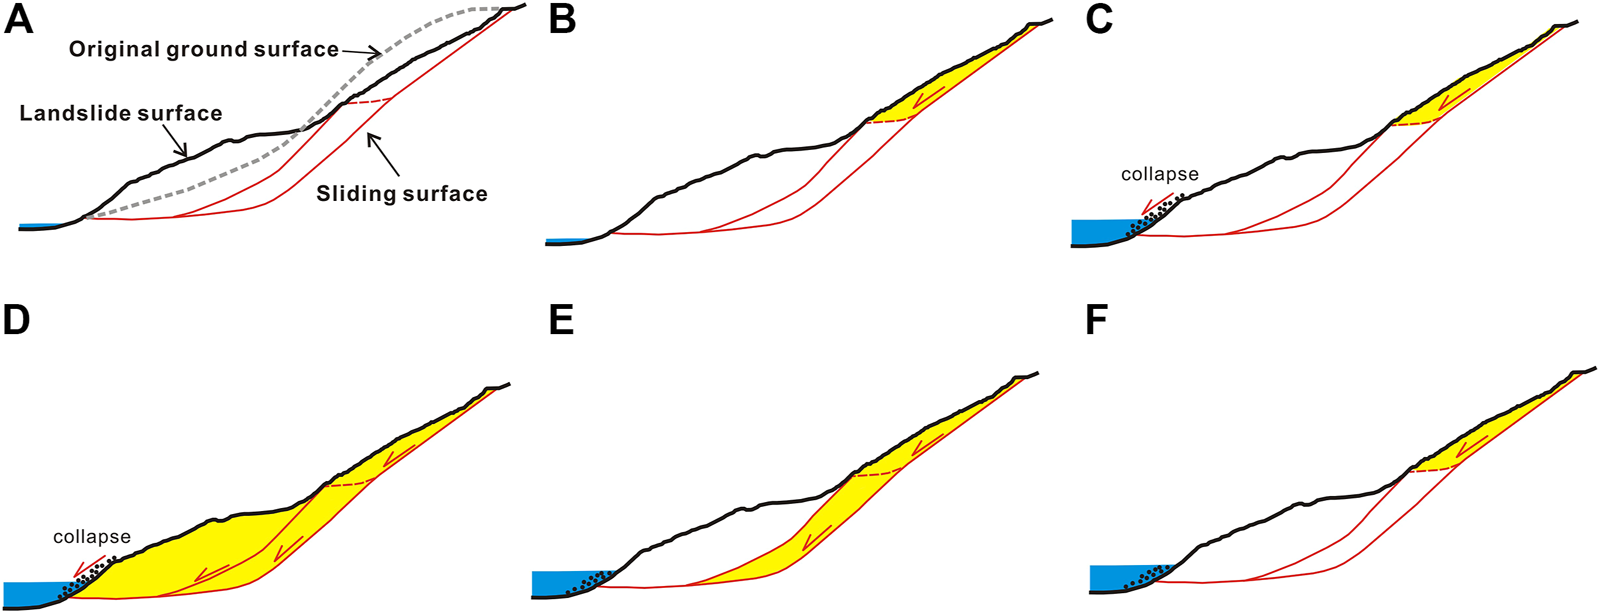
Schematic diagram of long-time failure processes of NLJL before and after impoundment. (A) Landforms before and after landslide sliding; (B) Landslide deformation part before reservoir impoundment; (C) Front edge collapse after reservoir impoundment; (D) After the collapse, the front edge traction caused overall deformation; (E) The stress of the leading edge gradually balanced and the deformation in the front and middle parts stopped; (F) As of 2022, the deformation mode reverted to that of upper deformation only.
Secondly, the collapses at the front edge of the landslide made the landslide lose support, and then the overall pull-push type sliding occurred. The acceleration process probably lasted until 2017 (Figures 10A–D).
Thirdly, by reducing the traction of the front edge of the landslide (Figures 10D–G), the deformation acceleration in Zone III and Zone II decreased and tended to be stable (Figure 11E).
Finally, Zone I began to push Zone II to slide, and the landslide body in Zone I was blocked by Zone II (Figure 11F). The analysis argues that the reason may be the influences of bedrock types and the slope gradient of sliding surfaces. The bedrock type of Zone I was cataclinal, and the type of Zone II was anaclinal (Figure 4). The sliding surface in Zone II was relatively horizontal, and in Zone I was steep (Figure 4).
The drawdown of the water level had a much stronger influence on the instabilities of the upper parts of NLJL. It has long been recognized that seepage force can produce when the rate of water-level drawdown is rapid enough or the permeability of slope-forming materials is lower enough (Terzaghi et al., 1996). The deformation increase of NLJL during the water-level drawdown periods in XLDRA should be attributed to the seepage force (Nakamura, 1990). The impact of XLDRA impoundment on NLJL was mainly in the first three years after the first impoundment.
5.2 Complementation and verification of GNSS and InSAR results
As the imaging direction of the satellite is in the LOS direction, and the InSAR results in NLJL were only available in descending orbit SAR data (Hu et al., 2014a), InSAR results and GNSS results cannot be compared with high accuracy. However, we can still judge the reliability of InSAR results by comparing the magnitude with GNSS. Figure 6 shows a step in GNSS data from 2014 to 2015. However, in Figure 9, there is no obvious step in the SBAS InSAR results from 2014 to 2015, and the maximum difference of cumulative measurement was 200 mm. The reason may be that before 2017, the time interval of SAR data was long, and the phase was lost in the process of InSAR unwrapping. This phenomenon often occurs in InSAR monitoring large surface deformation (Hu et al., 2014b). Therefore, the deformation measured by InSAR before 2017 is relatively small. Theoretically, when the deformation of more than half the wavelength along the radar line of sight occurs in a resolution unit of the differential interferogram, D-InSAR cannot detect the deformation (Massonnet and Feigl, 1998). The rate analysis before 2017 should refer to GNSS. After 2017, the results of GNSS and InSAR were consistent in order of magnitude, and the reliability of InSAR results increased.
The high point density of InSAR results complements GNSS. Although there are limitations in the magnitude of measurement, InSAR technology has significant advantages in detecting deformation areas. Therefore, in this paper, D-InSAR results in a year were used for union processing to obtain the annual deformation area. This method can reduce the impact of summer vegetation to a certain extent.
6 Conclusion
Based on the InSAR technology using Sentinel-1 SAR data from October 2014 to June 2022, the long-time failure processes of the Niulanjiang landslide after the reservoir’s first impoundment can be analyzed by its local deformation rates and variations of annual maximum deformation area. The results conclude that:
1) According to the deformation characteristics and the accumulation body area, the landslide was divided into three zones: Zone I was above the elevation of 950 m; Zone II was below it; the front edge of Zone II, where the collapse happened, was further divided into Zone III. In general, the accumulated deformation in Zone I was the largest, followed by Zone III, and Zone II was the smallest.
2) The deformation rates of PS07 and PS08 in Zone II were the smallest of all the selected PS points, indicating that the deformation rate of Zone II was the smallest.
3) According to the cumulative deformation curves of PS01, PS02, PS03, PS04, PS05, and PS06 after 2017, the slopes of curves in the water-level drawdown periods increased rapidly, and the slopes in the water-level rising periods were relatively stable. Therefore, it is speculated that Zone I of NLJL was mainly affected by the drawdown of reservoir water level, and the impacts of water-level rising and drawdown on Zone II and Zone III were similar.
4) After analyzing a nine-year variation of the deformation area, the deformation mechanism of NLJL changed from a retrogressive to a progressive type after the first impoundment and then changed back to a retrogressive type after 2017. The impact of XLDRA impoundment on NLJL was most substantial in the first three years after the first impoundment.
Statements
Data availability statement
The datasets presented in this article are not readily available because GAMMA software is a is commercial software. But Sentinel-1 SAR data can be downloaded for free and InSAR processing using some open-source software. Requests to access the datasets should be directed to Lingjing Li, lilingjing123_123@163.com or lilingjing@mail.cgs.gov.cn.
Author contributions
LL: Drafting the manuscript; InSAR processing; analysis and/or interpretation of data XY: Revising the manuscript critically for important content BW: Conception and design of study ZZ: Conducting a investigation process; evidence collection RL: acquisition of GNSS data.
Funding
This work was supported by the National Nature Science Foundation of China (Grant Nos. 41731287, 41772301, 41672359, and 41807299), the National Key Research and Development Program of China (2018YFC1505002), and the Three Gorges Corporation Project (YMJ (XLD)/(19) 110).
Conflict of interest
The authors declare that the research was conducted in the absence of any commercial or financial relationships that could be construed as a potential conflict of interest.
Publisher’s note
All claims expressed in this article are solely those of the authors and do not necessarily represent those of their affiliated organizations, or those of the publisher, the editors and the reviewers. Any product that may be evaluated in this article, or claim that may be made by its manufacturer, is not guaranteed or endorsed by the publisher.
References
1
Bamler R. Hartl P. (1998). Synthetic aperture radar interferometry. Inverse Probl.14, R1–R54. 10.1088/0266-5611/14/4/001
2
Biggs J. Wright T. Lu Z. Parsons B. (2007). Multi-interferogram method for measuring interseismic deformation: Denali Fault, Alaska. Geophys. J. Int.170, 1165–1179. 10.1111/j.1365-246X.2007.03415.x
3
Casu F. Manzo M. Lanari R. (2006). A quantitative assessment of the SBAS algorithm performance for surface deformation retrieval from DInSAR data. Remote Sens. Environ.102, 195–210. 10.1016/j.rse.2006.01.023
4
Chengdu Engineering Corporation Limited (Chidi) . (2021). Annual report of safety monitoring project in the reservoir affected area of the Xiluodu Hydropower Station. http://en.chidi.com.cn/.
5
Colesanti C. Wasowski J. (2006). Investigating landslides with space-borne synthetic aperture radar (SAR) interferometry. Eng. Geol.88, 173–199. 10.1016/j.enggeo.2006.09.013
6
Di Maio C. Fornaro G. Gioia D. Reale D. Schiattarella M. Vassallo R. (2018). In situ and satellite long-term monitoring of the latronico landslide, Italy: Displacement evolution, damage to buildings, and effectiveness of remedial works. Eng. Geol.245, 218–235. 10.1016/j.enggeo.2018.08.017
7
Doi I. Kamai T. Azuma R. Wang G. (2019). A landslide induced by the 2016 Kumamoto Earthquake adjacent to tectonic displacement - generation mechanism and long-term monitoring. Eng. Geol.248, 80–88. 10.1016/j.enggeo.2018.11.012
8
Fruneau B. Achache J. Delacourt C. (1996). Observation and modelling of the Saint-Etienne-de-Tinee landslide using SAR interferometry. Tectonophys.265, 181–190.
9
Gschwind S. Loew S. Wolter A. (2019). Multi-stage structural and kinematic analysis of a retrogressive rock slope instability complex (Preonzo, Switzerland). Eng. Geol.252, 27–42. 10.1016/j.enggeo.2019.02.018
10
Gu D. M. Huang D. Yang W. D. Zhu J. L. Fu G. Y. (2017). Understanding the triggering mechanism and possible kinematic evolution of a reactivated landslide in the Three Gorges Reservoir. Landslides14, 2073–2087. 10.1007/s10346-017-0845-4
11
Hooper A. Zebker H. Segall P. Kampes B. (2004). A new method for measuring deformation on volcanoes and other natural terrains using InSAR persistent scatterers. Geophys. Res. Lett.31. 10.1029/2004GL021737
12
Hu J. Li Z.-W. Li J. Zhang L. Ding X.-L. Zhu J.-J. et al (2014b). 3-D movement mapping of the alpine glacier in Qinghai-Tibetan Plateau by integrating D-InSAR, MAI and Offset-Tracking: Case study of the Dongkemadi Glacier. Glob. Planet. Change118, 62–68. 10.1016/j.gloplacha.2014.04.002
13
Hu J. Li Z. W. Ding X. L. Zhu J. J. Zhang L. Sun Q. (2014a). Resolving three-dimensional surface displacements from InSAR measurements: A review. Earth. Sci. Rev.133, 1–17. 10.1016/j.earscirev.2014.02.005
14
Huang B. Chen T. (2007). Deformation failure mechanism of Baijiabao landslide in xiangxi river valley. Chin. J. Geotechnical Eng.6, 938–942. 10.3321/j.issn:1000-4548.2007.06.026
15
Jones F. O. Embody D. R. Peterson W. L. Hazlewood R. M. (1961). Landslides along the Columbia River valley, northeastern Washington, with a section on seismic surveys. Available at: http://pubs.er.usgs.gov/publication/pp367 (Accessed November 16, 2022).
16
Li L. Yao X. Yao J. Zhou Z. Feng X. Liu X. (2019a). Analysis of deformation characteristics for a reservoir landslide before and after impoundment by multiple D-InSAR observations at Jinshajiang River, China. Nat. Hazards98, 719–733. 10.1007/s11069-019-03726-w
17
Li S. Xu Q. Tang M. Iqbal J. Liu J. Zhu X. et al (2019b). Characterizing the spatial distribution and fundamental controls of landslides in the three gorges reservoir area, China. Bull. Eng. Geol. Environ.78, 4275–4290. 10.1007/s10064-018-1404-5
18
Lu S. Yi Q. Yi W. Tian Z. Shi C. (2013). Analysis on deformation and failure mechanism of Woshaxi landslide in the three gorges reservoir area. Chin. J. Geol. Hazard Control24, 21–25. 10.16031/j.cnki.issn.1003-8035.2013.02.003
19
Massonnet D. Feigl K. L. (1998). Radar interferometry and its application to changes in the Earth's surface. Rev. Geophys.36, 441–500. 10.1029/97RG03139
20
Mitchell R. J. Klugman M. A. (1979). Mass instabilities in sensitive Canadian soils. Eng. Geol.14, 109–134. 10.1016/0013-7952(79)90080-2
21
Müller-Salzburg L. (1987). The Vajont slide. Eng. Geol.24, 513–523. 10.1016/0013-7952(87)90082-2
22
Nakamura K. (1990). On reservoir landslide. Bull. Soil Water Conserv.10, 53–64.
23
Novellino A. Cigna F. Sowter A. Ramondini M. Calcaterra D. (2017). Exploitation of the Intermittent SBAS (ISBAS) algorithm with COSMO-SkyMed data for landslide inventory mapping in north-western Sicily, Italy. Geomorphol. (Amst).280, 153–166. 10.1016/j.geomorph.2016.12.009
24
Paronuzzi P. Rigo E. Bolla A. (2013). Influence of filling–drawdown cycles of the Vajont reservoir on Mt. Toc slope stability. Geomorphology191, 75–93. 10.1016/j.geomorph.2013.03.004
25
Pawluszek-Filipiak K. Borkowski A. Motagh M. (2021). Multi-temporal landslide activity investigation by spaceborne SAR interferometry: The case study of the Polish Carpathians. Remote Sens. Appl. Soc. Environ.24, 100629. 10.1016/j.rsase.2021.100629
26
Schuster R. L. (1979). Reservoir-induced landslides. Bull. Int. Assoc. Eng. Geol.20, 8–15. 10.1007/BF02591233
27
Shi X. Xu Q. Zhang L. Zhao K. Dong J. Jiang H. et al (2019). Surface displacements of the Heifangtai terrace in Northwest China measured by X and C-band InSAR observations. Eng. Geol.259, 105181. 10.1016/j.enggeo.2019.105181
28
Sousa J. J. Hooper A. J. Hanssen R. F. Bastos L. C. Ruiz A. M. (2011). Persistent scatterer InSAR: A comparison of methodologies based on a model of temporal deformation vs. spatial correlation selection criteria. Remote Sens. Environ.115, 2652–2663. 10.1016/j.rse.2011.05.021
29
Strozzi T. Farina P. Corsini A. Ambrosi C. Thüring M. Zilger J. et al (2005). Survey and monitoring of landslide displacements by means of L-band satellite SAR interferometry. Landslides2, 193–201. 10.1007/s10346-005-0003-2
30
Sun Q. Zhang L. Ding X. L. Hu J. Li Z. W. Zhu J. J. (2015). Slope deformation prior to Zhouqu, China landslide from InSAR time series analysis. Remote Sens. Environ.156, 45–57. 10.1016/j.rse.2014.09.029
31
Terzaghi K. Peck R. B. Mesri G. (1996). Soil Mechanics in Engineering Practice. 3rd Edn. John Wiley & Sons Inc.
32
Wang B. Vardon P. J. Hicks M. A. (2016). Investigation of retrogressive and progressive slope failure mechanisms using the material point method. Comput. Geotech.78, 88–98. 10.1016/j.compgeo.2016.04.016
33
Wang H. Sun Y. Tan Y. Sui T. Sun G. (2019). Deformation characteristics and stability evolution behavior of Woshaxi landslide during the initial impoundment period of the Three Gorges reservoir. Environ. Earth Sci.78, 592. 10.1007/s12665-019-8592-6
34
Wasowski J. Bovenga F. (2014). Investigating landslides and unstable slopes with satellite Multi Temporal Interferometry: Current issues and future perspectives. Eng. Geol.174, 103–138. 10.1016/j.enggeo.2014.03.003
35
Wu S. Hu X. Zheng W. Zhang G. Liu C. Xu C. et al (2022). Displacement behaviour and potential impulse waves of the Gapa landslide subjected to the Jinping Reservoir fluctuations in Southwest China. Geomorphology397, 108013. 10.1016/j.geomorph.2021.108013
36
Xiong X. Shi Z. Xiong Y. Peng M. Ma X. Zhang F. (2019). Unsaturated slope stability around the Three Gorges Reservoir under various combinations of rainfall and water level fluctuation. Eng. Geol.261, 105231. 10.1016/j.enggeo.2019.105231
37
Yang H. Tang M. Xu Q. Qian J. Fu X. (2021). Research of statistical characteristics of deformation of landslides in the three gorges reservoir area of the yangtze river. J. Catastrophology36 (2), 37–42. 10.3969/j.issn.1000-811X.2021.02.007
38
Yao W. Li C. Zuo Q. Zhan H. Criss R. E. (2019). Spatiotemporal deformation characteristics and triggering factors of Baijiabao landslide in Three Gorges Reservoir region, China. Geomorphology343, 34–47. 10.1016/j.geomorph.2019.06.024
39
Yao X. Den J. Liu X. Zhou Z. Yao J. Dai F. et al (2020). Primary recognition of active landslides and development rule analysis for Pan three-river-parallel territory of tibet plateau. Adv. Eng. Sci.52, 16–37.
40
Yi X. Feng W. Wu M. Ye Z. Fang Y. Wang P. et al (2022). The initial impoundment of the baihetan reservoir region (China) exacerbated the deformation of the wangjiashan landslide: Characteristics and mechanism. Landslides19, 1897–1912. 10.1007/s10346-022-01898-4
41
Zhao C. Lu Z. Zhang Q. de la Fuente J. (2012). Large-area landslide detection and monitoring with ALOS/PALSAR imagery data over Northern California and Southern Oregon, USA. Remote Sens. Environ.124, 348–359. 10.1016/j.rse.2012.05.025
Summary
Keywords
landslide deformation, InSAR, the Xiluodu reservoir area, the long-time monitoring, retrogressive landslide, progressive landslide
Citation
Li L, Yao X, Wen B, Zhou Z and Li R (2023) The long-term failure processes of a large reactivated landslide in the Xiluodu reservoir area based on InSAR technology. Front. Earth Sci. 10:1055890. doi: 10.3389/feart.2022.1055890
Received
28 September 2022
Accepted
22 November 2022
Published
16 January 2023
Volume
10 - 2022
Edited by
Chao Zhou, China University of Geosciences Wuhan, China
Reviewed by
Jie Dong, Wuhan University, China
Yi Zhang, Lanzhou University, China
Updates
Copyright
© 2023 Li, Yao, Wen, Zhou and Li.
This is an open-access article distributed under the terms of the Creative Commons Attribution License (CC BY). The use, distribution or reproduction in other forums is permitted, provided the original author(s) and the copyright owner(s) are credited and that the original publication in this journal is cited, in accordance with accepted academic practice. No use, distribution or reproduction is permitted which does not comply with these terms.
*Correspondence: Lingjing Li, lilingjing123_123@163.com, lilingjing@mail.cgs.gov.cn
This article was submitted to Geohazards and Georisks, a section of the journal Frontiers in Earth Science
Disclaimer
All claims expressed in this article are solely those of the authors and do not necessarily represent those of their affiliated organizations, or those of the publisher, the editors and the reviewers. Any product that may be evaluated in this article or claim that may be made by its manufacturer is not guaranteed or endorsed by the publisher.