Abstract
Quantitative assessment of economic losses from disasters can benefit government decision-making as well as mitigation and adaptation strategies. Here, we identified significant rainstorm events in China in 2021 using an objective identification method and investigated the direct economic losses (DELs) from each event. Then, a loss assessment model was developed to estimate the indirect economic losses (IDELs) from rainstorm events. We found that, in 2021, China experienced 36 major rainstorm events, causing approximately 179.8 billion yuan in DELs. The north of China was severely affected by rainstorms and floods, with Henan, Hebei and Shaanxi being the main loss centers. The assessment of IDELs based on rainstorm events showed a non-linear relationship between direct and indirect losses. The socio-economic impact of the 2021 Henan flood (Event No. 15) was the most serious, with direct and indirect losses of 125.8 billion yuan and 269.1 billion yuan, respectively. The primary industry in Henan was seriously affected, and the impact also spread to Inner Mongolia and Guangdong, causing indirect losses of 23.9 billion and 13.1 billion yuan, respectively. We recommend that the indirect losses resulting from such interregional trade linkages should be considered in catastrophe risk management. Finally, the sensitivity analysis showed that moderate overproduction can reduce the indirect impacts caused by disasters. A more detailed study is required to explore how to determine the appropriate levels of disaster relief, as well as a rational funding allocation mechanism.
1 Introduction
More frequent and intense extreme weather and climate-related events are expected to damage ecosystems, infrastructure, and social systems (USGCRP, 2018). Floods are one of the most serious meteorological disasters affecting the socioeconomic system in China (Xu and Tang, 2021). Between 2001 and 2020, more than 100 million people were affected by floods in China each year, and the direct economic losses (DELs) was approximately 167.9 billion yuan (Li and Zhao, 2022a). The direct economic losses and deaths caused by floods accounted for approximately 44% and 63% of the total, respectively (Li et al., 2021). Loss reduction is the focus of flood risk management, which is premised on an accurate assessment of the socioeconomic impact of floods.
Many studies have assessed disaster losses, including both direct and indirect economic losses. DELs are defined as losses resulting from damage to fixed assets (e.g., housing, factories, and infrastructure). Indirect economic losses (IDELs) are further losses caused by production stoppages and supply–demand imbalances in the industrial chain (Wu et al., 2012; Li et al., 2017). However, the economic losses caused by disasters are not contained within the disaster area (Koks and Thissen, 2016). With the growth in economic relationships between regions and countries, the cost is expected to spread beyond the disaster area through trade networks, resulting in economic cascade effects (Okuyama and Santos, 2014). For example, during the Spring Festival in 2008, China was hit by a snowstorm that damaged most of road, railway, and air transport systems. The resulting disruption of supply chains for energy, food, and other vital commodities caused the Consumer Price Index (CPI) to rise 34% between December 2007 and February 2008 (Xie et al., 2014). The 2011 Thailand floods severely affected the local electronics industry, which produces approximately 43% of the world’s hard drives. While the floods had a devastating impact on the Thai economy, they also pushed up global hard drive prices by 80%–190% (Haraguchi and Lall, 2015). Thus, it is important to capture the IDELs caused by economic cascade effects in disaster loss assessment.
Most current studies use Multi-Regional Input–Output (MRIO) models to assess the economic cascade effects between regions, such as the assessment of the global impacts of the Great East Japan Earthquake in 2011 (Meng et al., 2015), and the assessment of economic losses from Typhoon Rammasunin in 2014 in countries along the “Belt and Road” (Zhou et al., 2018). However, the above studies did not comprehensively assess the impacts of post-disaster assistance and the disruption of supply chains, although multi-regional impacts were simulated. In addition, most of the current studies on IDELs are based on a single event. Owing to differences in assessment objects, scope, and data sources, the results are not comparable between studies.
In this paper, according to the theoretical framework of the MRIO model, we considered the role of demand and supply and constructed an Adaptive Multi-Regional Input–Output (AMRIO) model. The model included multi-regional trade-offs through trade linkages between regions and was able to capture indirect losses from economic cascade effects. Then, we identified the major rainstorm events in 2021 and the corresponding DELs based on major rainstorm event monitoring indicators, disaster datasets, and related socioeconomic indicators. Finally, we assessed provincial IDELs for major rainstorm events in 2021. The comparable results make an important contribution to testing the robustness of the Input–Output (IO) model. At the same time, the approach deepens our understanding of the meteorological disaster chain, which provides a reference for the formulation of post-disaster recovery and reconstruction plans.
2 Data sources
The daily precipitation dataset in 2021 was used to identify the major rainstorm events and its comprehensive intensity. The data were obtained from the National Meteorological Information Center and have been quality controlled and homogenized (Cao and Yan, 2011).
The DELs are an important input for the AMRIO model. The DELs for 2021 were derived from China Meteorological Administration. These data have been widely applied in meteorological disaster research in China (Wang et al., 2014; Zhao et al., 2017; Hu et al., 2021a). Because of incomplete data for Taiwan, Hong Kong, and Macao, only 31 provinces in mainland China were included.
The MRIO table is also a key element of the AMRIO model. In this study, we used the China MRIO table for 2017 released by the Carbon Emission Accounts and Datasets (CEADs), which was widely used in the fields of extreme weather economic impact assessment (Hu et al., 2021b), carbon footprint (Yuan et al., 2022) and climate change (Liu et al., 2021). On the basis of entropy theory and a gravity model, CEADs constructs a provincial input–output model compilation framework, including 31 provinces, 42 sectors, and five final consumptions in mainland China. The preprocessing of the MRIO table focused on two aspects: 1) we combined the industries in the MRIO table into primary, secondary, and tertiary industries, corresponding to the classification of DELs; and 2) because the MRIO table for 2021 was not available, we updated the China MRIO table for 2017 by a proportional growth based on the national accounts indicators in 2021 to approximate the input–output relationship between provinces and industries.
3 Materials and methods
3.1 Major rainstorm events
We used the objective identification method developed by Ye et al. (2019) to determine the major rainstorm events in China, based on the number of adjacent rainstorm stations and the distance from the location of the rainstorm center. Then, the comprehensive intensity of the major rainstorm events was calculated using the average intensity (average daily precipitation at rainstorm stations), duration, and average influence area of each event (average number of daily rainstorm stations). The intensity was classified into five levels: extremely low, low, medium, high, and extremely high.
3.2 Adaptive multi-regional input–output model
The traditional IO model is a static linear model (Koks et al., 2016), which cannot reflect the dynamic characteristics of the economic system, thus limiting the application of the traditional IO model. However, because the traditional IO model has lower data requirements and the advantage of being able to clearly reflect the economic linkages between regions and industries (Rose, 2004), it has also been widely developed and applied, especially in disaster loss assessment. The most representative models are the Adaptive Regional Input–Output (ARIO) model (Hallegatte, 2008; Hallegatte, 2014), the Multi-Regional Input–Output (MRIO) model (Xia et al., 2016; Zhou et al., 2018), the Multi-Regional Impact Assessment (MRIA) model (Koks and Thissen, 2016), and derivatives of these models. In the current study, the AMRIO model followed the dynamic and iterative model framework of the ARIO model and performed multi-regional trade-offs through the MRIO table, which were able to dynamically simulate the economic cascade effect and estimate the IDELs.
3.2.1 Model construction
Each industry in the economic system can be regarded as a producer, but each industry is also a consumer that needs the intermediate products of other industries. In the absence of disasters, total output meets intermediate demand and final consumer demand. However, this balance is disrupted by the impact of disasters on the economic system, further disrupting supply chains (Figure 1). The AMRIO model considers the following mechanisms of disaster impacts on the economic system: 1) industrial linkages—crop failure and road interruptions will limit the production capacity of some industries, resulting in insufficient supply capacity and constraining the production and consumption of other industries not directly affected by the disaster; 2) residual production capacity—the AMRIO model calculates the residual production capacity of various industries after disasters according to the DELs, and then gradually recovers until the DELs are fully reset; 3) production bottlenecks—when the output of some industries in the disaster area is insufficient, the goods or services produced by these industries are replaced by other regions according to the demand ratio; and 4) producer responses—producers expand or reduce production according to demand, or make up for the shortage of local goods or services through out-of-area trade, and then gradually return to the original supplier as production capacity recovers.
FIGURE 1
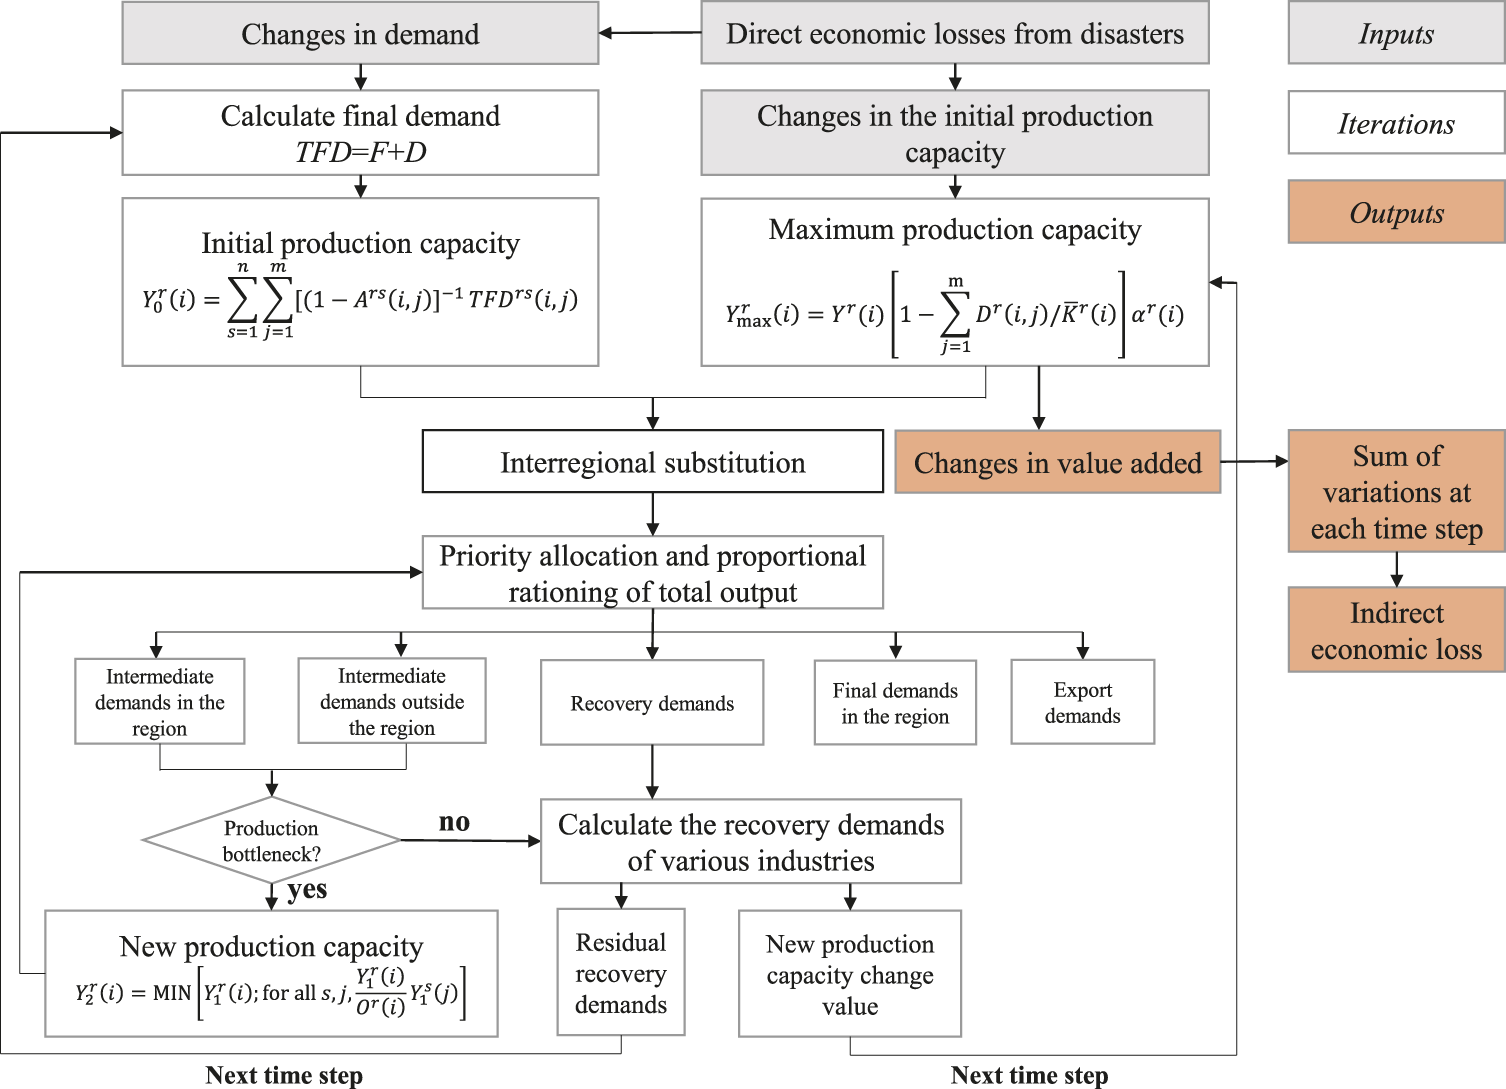
AMRIO model theoretical framework.
In the MRIO table, production and demand are linked through their relationship. Take region r industry i as an example:Where i, j = 1, …, m for all industries and r, s = 1, …, n for all regions in this study; Y is the total output vector; A is the MRIO table; F is the final demand matrices; and D is the total DELs of the meteorological disaster on regions and industries. Then the production and consumption of each sector in each region were calculated. In this study, the IDELs assessment did not consider the impacts between events, and each event was considered to have occurred independently.
3.2.2 Assumptions
Given the complexity of the economic system, the AMRIO model assumed that a region consisted of a large number of industries. These industries 1) only produced a specific product or service and required inputs from other regions and other industries; 2) exchanged intermediate products or services with industries within and between regions; 3) substituted products or services from the same industry in other regions; and 4) were not subject to import restrictions. In addition, the IDELs assessment in this paper did not consider the associated effects between events, that is, it was assumed that each rainstorm event occurred independently.
3.2.3 Parameters
Solving the AMRIO model required a large number of exogenous parameters that represented adjustments in the production or consumption behavior of the economic system to adapt to post-disaster supply and demand conditions. We set the following parameters regarding the data from the third press conference on accelerating post-disaster reconstruction in Henan Province held on 9 August 2021.
The initial production capacity represented the production capacity of each industry before the disaster and was assumed to be 100%. The overproduction capacity represented accelerated rebuilding of industries through investment post-disaster. Here we assumed that disaster relief funds were all used for production recovery. According to the report on disaster relief funds in the press conference (9.0 billion yuan), the initial overproduction capacity (100.3%) was set as the proportion of disaster relief funds in the value-added (VA) of the industry based on the input-output table. Simultaneously, the press conference pointed out that as of 8 August, the power supply interruption, transportation network stagnation, and communication base station damage caused by the extreme rainstorm event had almost recovered. Therefore, we set the time required to increase the post-disaster production capacity to the maximum (adaptation time) to 20 days. In addition, we set the initial value of the price coefficient and the demand elasticity coefficient to 0.1% per month and 0.9, referring to Hallegatte (2008) and Wu et al. (2012). Considering the effect of parameter changes on the simulation results, we performed sensitivity analysis on these parameters.
3.2.4 Uncertainty
The results of an AMRIO model are usually sensitive to the shocks introduced (DELs) and the model parameters. The range of changes in DELs was determined, and we put different percentiles (10th, 25th, median, 75th, and 90th) into the AMRIO model to determine the uncertainty of the results. In addition, we set the interval of the model parameters (up and down 30% based on the standard values) to determine the sensitivity of the AMRIO model to parameters (Mendoza-Tinoco et al., 2017). The uncertainties in the AMRIO model are shown in the shaded areas in Figures 3, 6.
4 Results and discussion
4.1 Major rainstorm events in 2021
According to the monitoring indicators of major rainstorm events (Ye et al., 2019), there were 36 major rainstorm events in China in 2021 (Li et al., 2022b), which was 2.6 times less than the annual average in 1991–2020, resulting in a total of 178.7 billion yuan of DELs. Figure 2 shows the DELs affected by major rainstorm events in 2021, where the abscissa is the event number, and the ordinate is the provinces arranged from south to north. In general, 23 provinces had DELs from rainstorms, except for Xinjiang, Tibet, Qinghai, Ningxia, Heilongjiang, Jilin, Shanghai, and Hainan. The DELs in Henan were the highest at 132.4 billion yuan, followed by Shanxi, Hubei, Sichuan, and Shaanxi with 4–10 billion yuan. Consistent with the rainbelt of the summer monsoon moving in a longitudinal direction, the DELs also showed a movement northward along with the rainbelt in the first half of the rainy season and then southward in the latter half. Most DELs occurred from late June to July, and four events (Events Nos. 13–16) accounted for 78% of the total. In the autumn of 2021, the southward movement of the rain belt slowed under the influence of the La Niña (Che et al., 2021) and the precipitation was 45% higher than in the same period of the base period (1991–2020), which led to floods in the upper reaches of the Yangtze River, the middle and lower reaches of the Yellow River, and the Haihe River. The DELs from four events during this period (Events Nos. 28–31) accounted for 12% of the total.
FIGURE 2
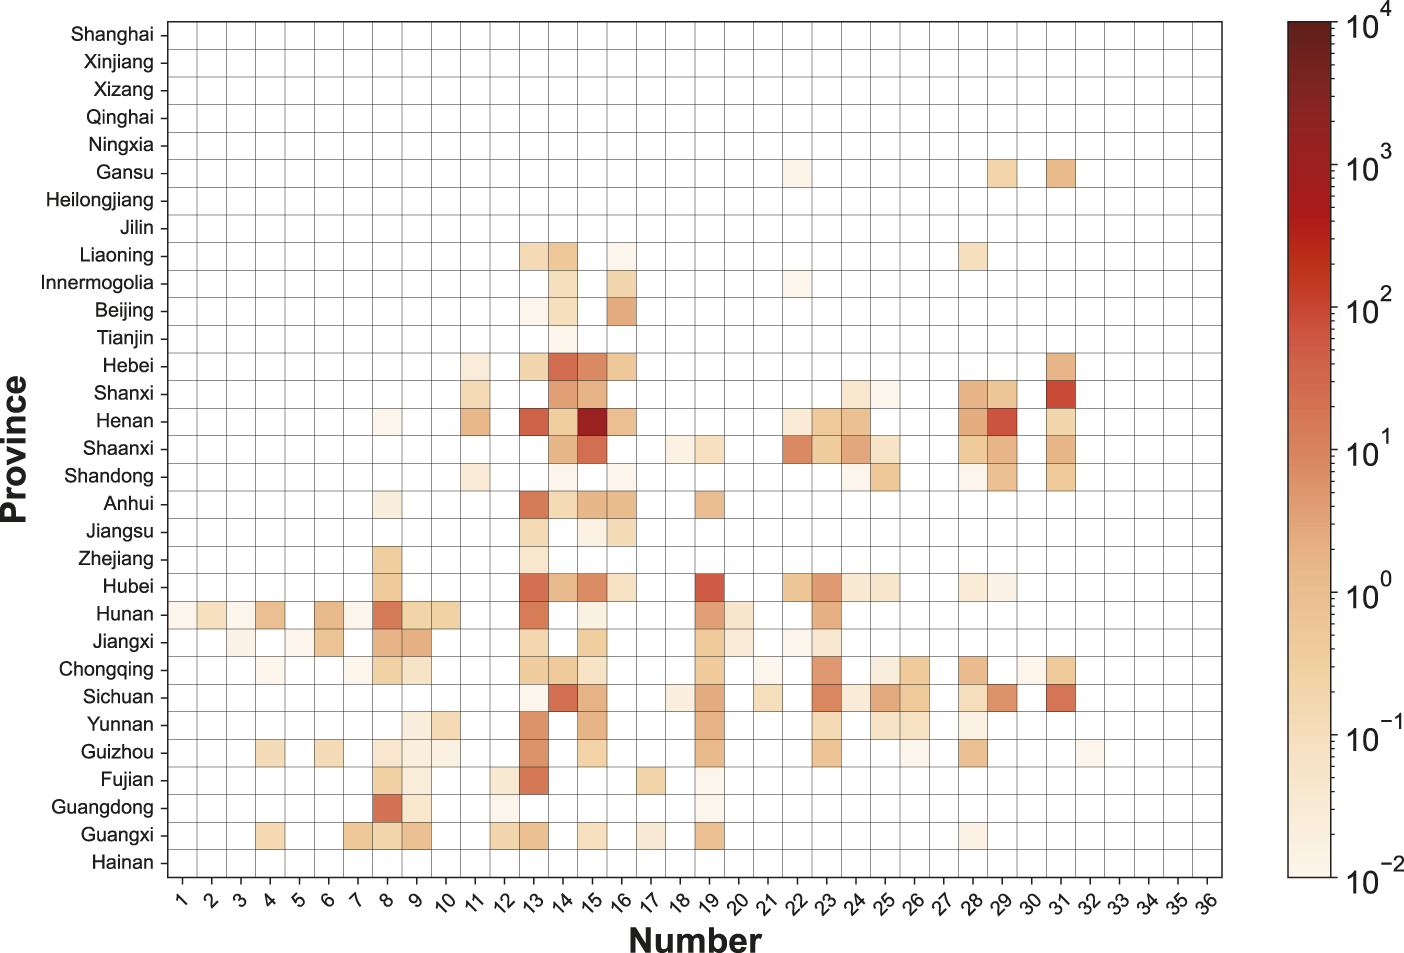
Distribution of provincial DELs for major rainstorm events in 2021 (Unit: 100 million yuan).
Table 1 shows the top ten rainstorm events for DELs in 2021. The DELs from the top ten events accounted for 98.7% of the total, which indicated a heavy-tailed distribution of the DELs from rainstorm events. According to the estimation of the comprehensive intensity of the rainstorm events, among the 36 events in 2021, five were ranked extremely high, four of which were within the top ten events; and five events were ranked high, of which three were within the top ten events, indicating that rainstorm intensity (hazard) was the primary cause of rainstorm-related disasters.
TABLE 1
| Rank | Event | Start date | End date | Affected provinces | Comprehensive intensity | DELs (billion Yuan) | IDELs (billion Yuan) | Ratios (IDELs/DELs) |
|---|---|---|---|---|---|---|---|---|
| 1 | No. 15 | 15 July | 22 July | Hebei, Shanxi, Henan, Shaanxi, Anhui, Jiangsu, Hubei, Hunan, Jiangxi, Chongqing, Sichuan, Yunnan, Guizhou, Guangxi | Extremely high | 125.8 | 269.1 | 2.14 |
| 2 | No. 13 | 27 July | 7 July | Liaoning, Beijing, Hebei, Henan, Anhui, Jiangsu, Zhejiang, Hubei, Hunan, Jiangxi, Chongqing, Sichuan, Yunnan, Guizhou, Fujian, Guangxi | Extremely high | 12.1 | 18.8 | 1.56 |
| 3 | No. 31 | 2 October | 7 October | Gansu, Hebei, Shanxi, Henan, Shaanxi, Shandong, Chongqing, Sichuan | Moderate | 11.2 | 15.2 | 1.35 |
| 4 | No. 14 | 10 July | 13 July | Inner Mongolia, Liaoning, Beijing, Tianjin, Hebei, Shanxi, Henan, Shaanxi, Shandong, Anhui, Hubei, Chongqing, Sichuan | High | 8.1 | 8.0 | 0.99 |
| 5 | No. 29 | 24 September | 26 September | Gansu, Shanxi, Henan, Shaanxi, Shandong, Hubei, Sichuan | Moderate | 7.6 | 6.9 | 0.91 |
| 6 | No. 19 | 8 August | 14 August | Shaanxi, Anhui, Hubei, Hunan, Jiangxi, Chongqing, Sichuan, Yunnan, Guizhou, Fujian, Guangdong, Guangxi | High | 6.5 | 4.0 | 0.62 |
| 7 | No. 8 | 15 May | 23 May | Henan, Anhui, Zhejiang, Hubei, Hunan, Jiangxi, Chongqing, Guizhou, Fujian, Guangdong, Guangxi | Extremely high | 3.8 | 2.4 | 0.64 |
| 8 | No. 23 | 22 August | 26 August | Henan, Shaanxi, Hubei, Hunan, Jiangxi, Chongqing, Sichuan, Yunnan, Guizhou | High | 2.6 | 2.1 | 0.81 |
| 9 | No. 28 | 16 September | 20 September | Liaoning, Shanxi, Henan, Shaanxi, Shandong, Hubei, Chongqing, Sichuan, Yunnan, Guizhou, Guangxi | Extremely high | 1.2 | 0.8 | 0.72 |
| 10 | No. 22 | 19 August | 20 August | Gansu, Inner Mongolia, Henan, Shaanxi, Hubei, Jiangxi | Extremely low | 0.9 | 0.6 | 0.69 |
The top ten rainstorm events for DELs in 2021.
4.2 Indirect economic losses
4.2.1 The top 10 rainstorm events assessment
Using the AMRIO model, we estimated the IDELs of the top ten rainstorm events for DELs in 2021 to comprehensively assess the economic impacts of rainstorms and floods. The results are shown in Table 1. The IDELs were positively correlated with DELs, and the two had a similar order. Event No. 15 had the most severe economic impact, with IDELs of nearly 269.1 billion yuan, approximately 2.14 times that of DELs, indicating that the event caused severe losses in local fixed assets and also caused serious cascading losses owing to inter-industrial and inter-regional relationships. The IDELs for Events Nos. 13, 31 were approximately 18.8 billion yuan and 15.2 billion yuan, respectively, exceeding the DELs. In Events Nos. 4–10, the IDELs are comparable with the DELs or lower.
The relationship between IDELs and DELs was nonlinear, and it could be fitted using a quadratic function (Figure 3A), indicating that, in the same economic system, IDELs did not increase proportionally with DELs, and as DELs increased, the increases in IDELs continue to accelerate. This is consistent with the results from Hallegatte (2008) and Wu et al. (2012) that showed a nonlinear relationship. Because the DELs and IDELs of Event No. 15 were excessively large, we show the other nine event points separately in Figure 3B to avoid overlapping points. When the DELs were less than eight billion yuan, the IDELs were approximately 62%–91% of the DELs; when the DELs were approximately eight billion yuan, the IDELs were roughly equal to the DELs; and when the DELs exceeded eight billion yuan, the IDELs gradually outweighed the DELs (Table 1).
FIGURE 3
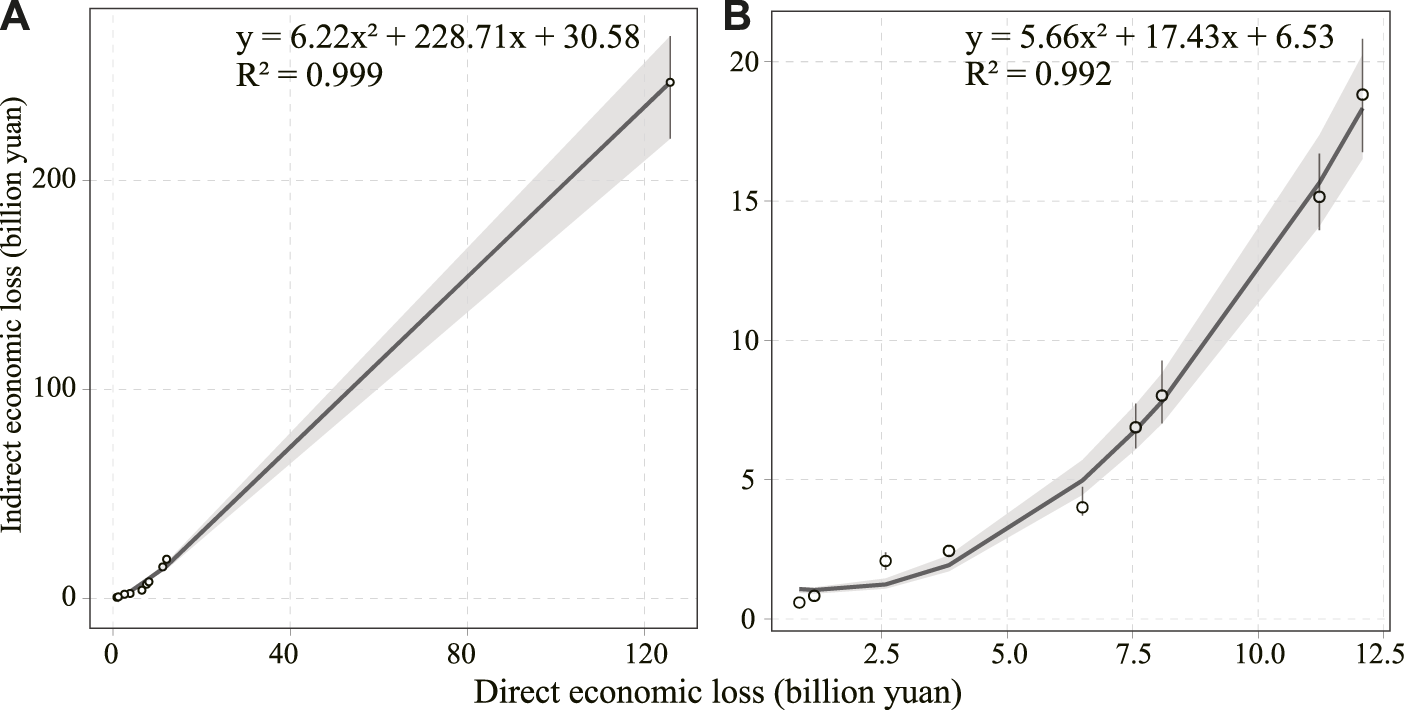
The relationship between DELs and IDELs. (A) The top ten rainstorm events. (B) The remaining nine events excluding Event No. 15.
However, it should be noted that this non-linear relationship was only based on the statistics of ten rainstorm events. The curve shown in Figure 3B was steeper than that shown in Figure 3A, that is, in the initial stage of an increase in the DELs, the growth rate of the IDELs was faster, and then the growth rate of the IDELs slowed. The relationship between DELs and IDELs may be more in line with a logistic growth model. Therefore, it is important to test the relationship based on additional rainstorm events.
4.2.2 2021 Henan flood assessment
We selected Event No. 15 which had the most serious economic losses, to further examine the relationship between DELs and IDELs. In this event, the total DELs reached 125.8 billion yuan. Nearly half of China suffered DELs, and IDELs were more than twice as high as DELs. The worst affected province was Henan, where 201.9 mm of rainfall per hour in Zhengzhou broke the historical record for mainland China.
Figure 4A shows that Event No. 15 was mainly located in central China. The accumulated precipitation of 66 stations in Henan exceeded 250 mm, out of which 9 stations exceeded 600 mm. The accumulated precipitation of 28.7% of the area was greater than 250 mm in Henan. In addition, the accumulated precipitation at 11 stations in Hebei, Shanxi, and Anhui exceeded 250 mm. The DELs in Henan were 120.1 billion yuan, and DELs in the other 13 provinces including Shaanxi, Hebei, and Shanxi were 5.7 billion yuan (Figure 4B). The distribution of DELs was generally consistent with the rainstorm pattern, centered on Henan, with relatively fewer DELs in Shaanxi, Hebei, and Hubei.
FIGURE 4
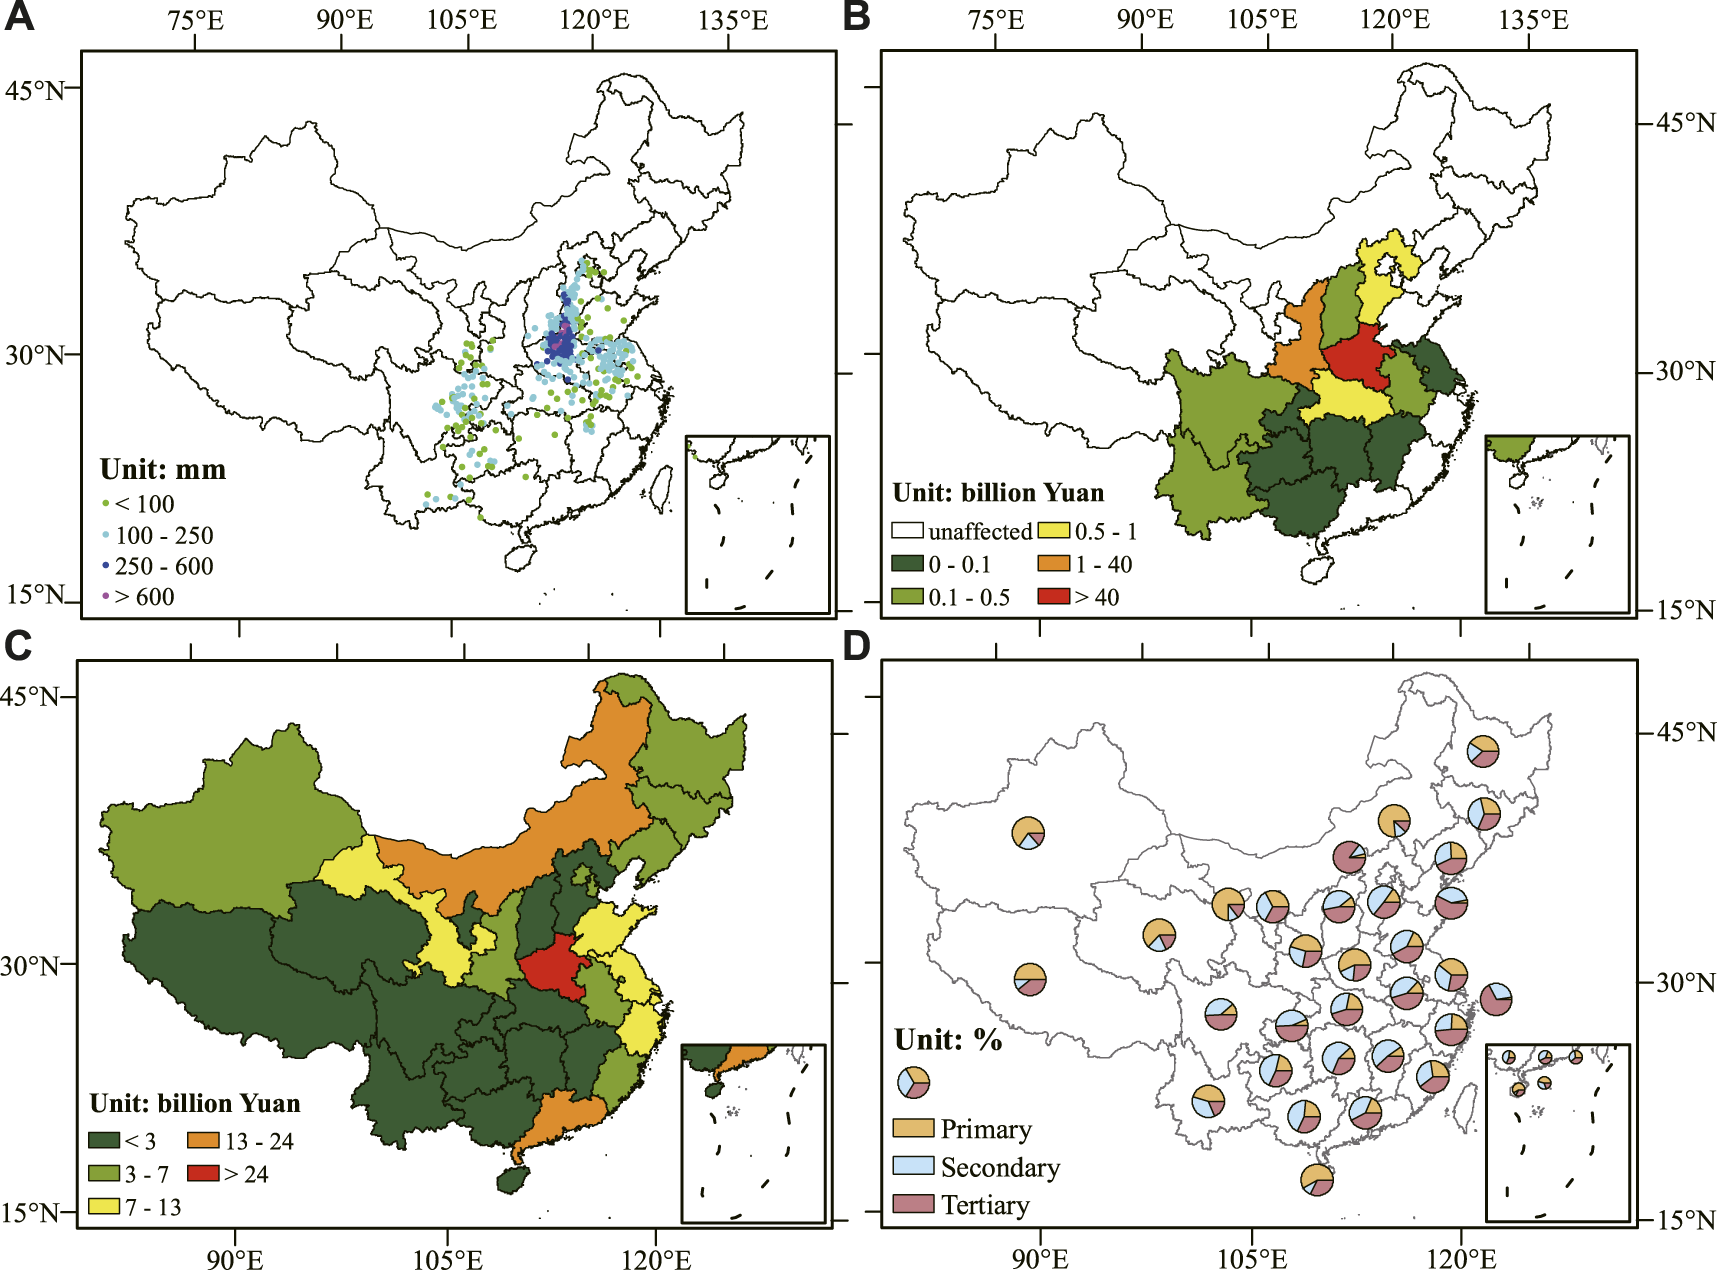
Spatial distributions of (A) accumulated precipitation, (B) DELs, (C) IDELs and (D) the industry distribution of IDELs for Event No. 15.
The distribution of provincial IDELs for Event No. 15 is shown in Figure 4C. Henan was the province with the largest IDELs, approximately 121.1 billion yuan, comparable with the DELs. Inner Mongolia ranked second, and Guangdong ranked third, with IDELs reaching 23.9 billion yuan and 13.1 billion yuan, respectively. In contrast to DELs, IDELs did not seem to spread from the worst-impacted areas to the surrounding areas. The IDELs in neighboring provinces like Shaanxi, Shanxi, Hebei, Hubei, Anhui, and Shandong were approximately 1.1 billion to 9.8 billion yuan, whereas Inner Mongolia, Guangdong, Gansu, and Zhejiang, which were located far from Henan, had greater IELs. The relationship between IDELs and spatial distance was not very close, and inter-regional trade links may be the reason for the high IDELs in the above provinces (Zhang et al., 2020).
Figure 4D shows the IDELs of three industries in each province. For the hardest hit—Henan—the proportion of IDELs in the primary, secondary, and tertiary industries reached 57%, 16%, and 27%, respectively, with primary industry being the most affected. The absolute value of IDELs (70.4 billion yuan) in primary industry was higher than that of DELs (45.5 billion yuan), indicating that the flood not only had a serious direct impact on local agriculture (for example, crop failure, waterlogging of cultivated land, and equipment damage), but that indirect losses because of road congestion, energy disruption or damage to downstream industries also severely affected local agricultural production. In general, the IDELs of coastal provinces were concentrated in secondary or tertiary industry. For example, the proportion of IDELs in the tertiary industry in Shanghai, Zhejiang, and Guangdong were 67%, 49%, and 42%, respectively. The indirect impacts on the northwestern inland provinces were concentrated in primary industry, such as Gansu, Xinjiang, and Qinghai, where the proportion was 75%, 65%, and 63%, respectively.
The spatial distribution of IDELs can be discussed in conjunction with industry linkages. For Inner Mongolia and Guangdong, which ranked second and third in IDELs, the high IDELs of Inner Mongolia were mainly concentrated in primary industry, while those of Guangdong were mainly concentrated in secondary and tertiary industry. This distribution is closely related to the industry linkages between the two provinces and Henan. Figure 5 shows the sources of intermediate consumption in Inner Mongolia and Guangdong, as reflected in the MRIO table. It can be seen that the intermediate inputs from Henan accounted for 11.4% of the total in the primary industry of Inner Mongolia and 15.5% of the total in the tertiary industry in Guangdong, both higher than that in other provinces. Therefore, when Henan’s output declined, Inner Mongolia, and Guangdong also suffered severe cascade effects. A similar situation also occurred in the primary industries in Gansu, Xinjiang, and Shaanxi, and the secondary and tertiary industries in Zhejiang, Shanghai, Shandong, and Jiangsu.
FIGURE 5
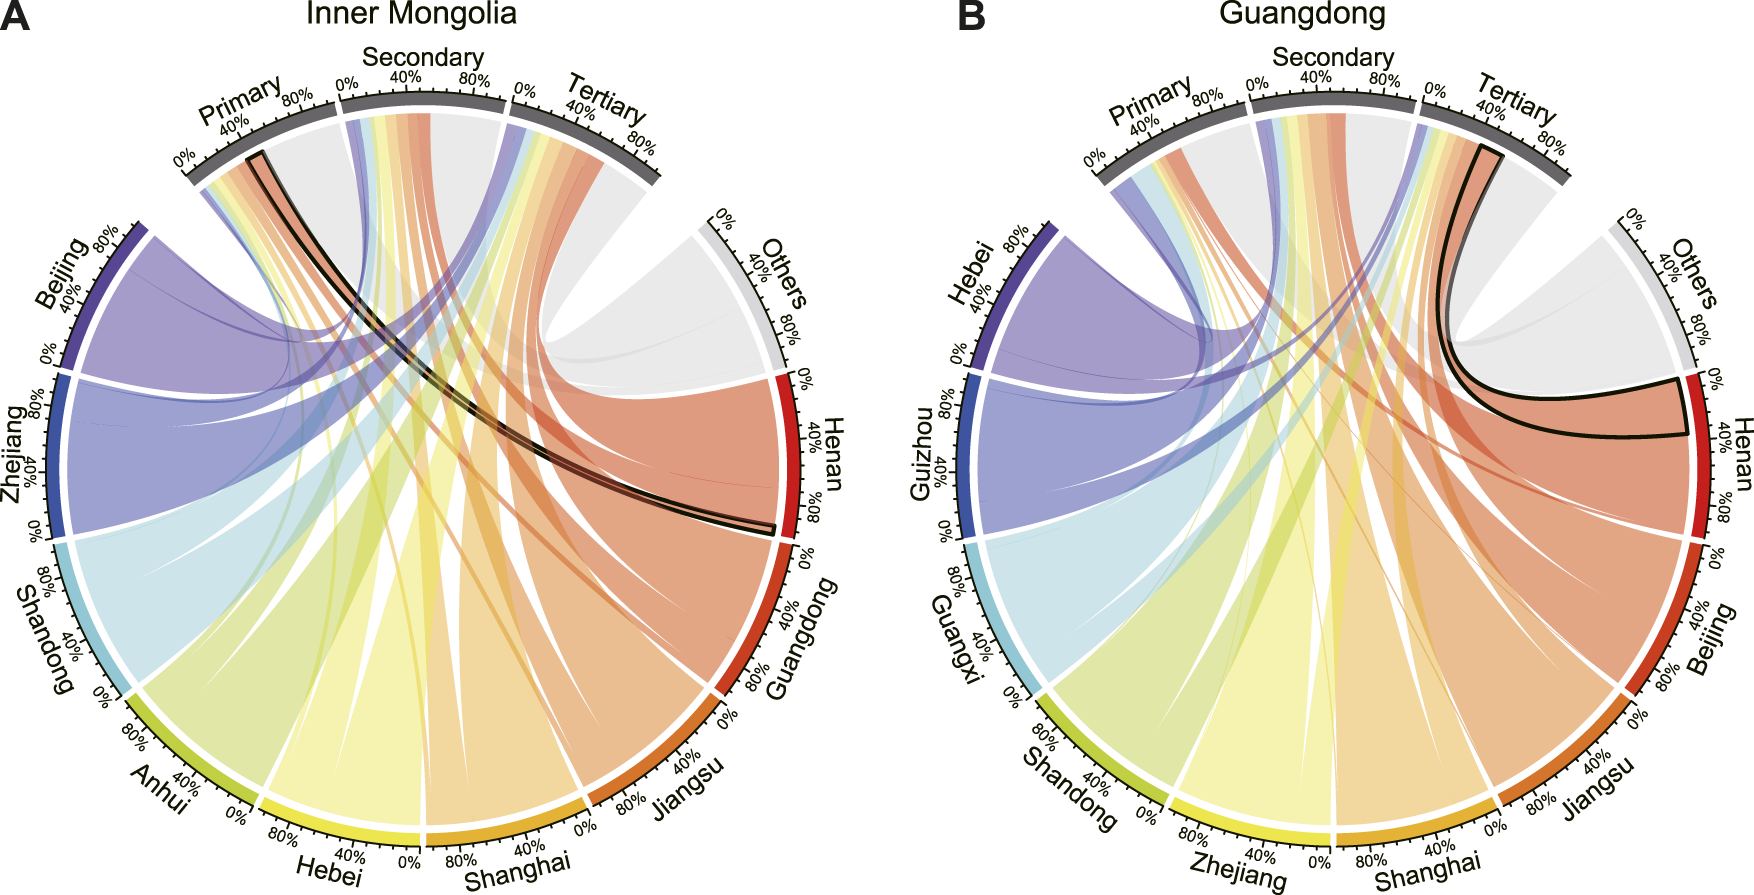
Intermediate sources of input for the primary, secondary, and tertiary industries in (A) Inner Mongolia and (B) Guangdong.
4.2.3 Sensitivity analysis
Owing to the limited data related to the reconstruction process of different industries after the disaster, we conducted a sensitivity analysis on various parameters to overcome the uncertainty caused by the parameter settings. Figure 6 shows the VA change in the three major industries in Henan, Guangdong, and Inner Mongolia relative to pre-disaster conditions under different overproduction capacities during reconstruction.
FIGURE 6
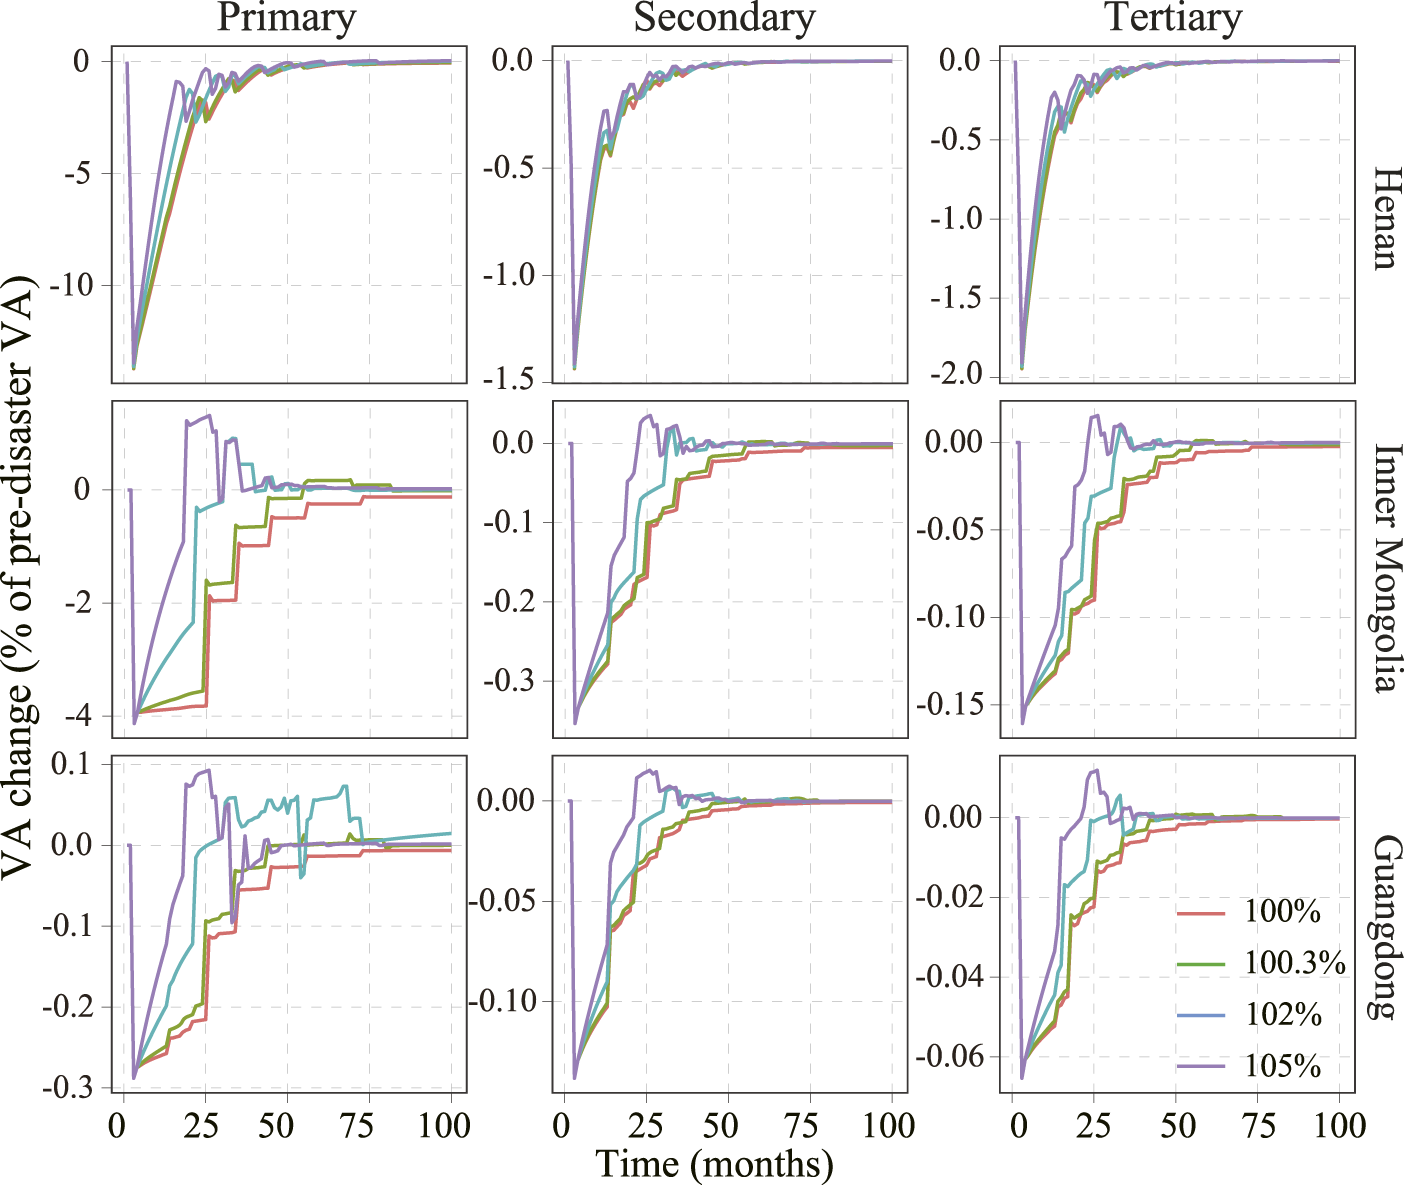
Variations in VA in the three major industries (% of the pre-disaster level) in Henan, Guangdong, and Inner Mongolia under different scenarios of overproduction capacity.
Research has shown that the overproduction capacity parameter significantly changed the IDELs and post-disaster reconstruction process. Compared with no overproduction capacity, the IDELs were reduced under the baseline disaster relief scenario (the overproduction capacity parameter was set as 100.3%). The IDELs of the whole industry in Henan, Inner Mongolia, and Guangdong was reduced by approximately 3.8, 4.4, and 1.5 billion yuan, respectively, and the reduction of IDELs in these three provinces (9.7 billion yuan) exceeded the total amount of disaster relief funds (9.0 billion yuan). However, the reconstruction period of primary industry in Inner Mongolia and Guangdong was shortened by 18 and 24 months, respectively. Then, we set up two scenarios with higher overproduction capacity (102% and 105%). The sensitivity analysis results showed that the IDELs decreased with an increase in the overproduction capacity parameter, especially outside Henan Province. The IDELs of the whole industry in Inner Mongolia and Guangdong decreased by approximately 12.3 and 5.3 billion yuan (when the overproduction capacity parameter was set as 102%) and 18.4 and 7.6 billion yuan (when the overproduction capacity parameter was set as 105%). The reconstruction period was also significantly shortened, and the production capacity of these two provinces recovered rapidly and exceeded the pre-disaster level. However, the disaster relief funds invested in the above two scenarios reached 60.2 billion yuan (102%) and 150.5 billion yuan (105%) respectively, exceeding the corresponding decrease in the IDELs. Therefore, from the perspective of the entire reconstruction process, moderate overproduction has a positive effect on alleviating IDELs caused by disasters, while excessive overproduction will lead to a waste of resources.
5 Conclusion
In this study, we identified and investigated all major rainstorm events and their DELs in China in 2021. Then, an AMRIO model was constructed to quantitatively evaluate and analyze the provincial IDELs of the top ten rainstorm events. Finally, we examined the inter-regional and inter-industry impact mechanisms of the 2021 Henan flood based on the assessment.
There were 36 rainstorm events in China in 2021, and we listed the DELs and IDELs for the top 10 rainstorm events. The comprehensive intensity of the top ten rainstorm events showed that the hazard was the main cause of the rainstorm-related disasters. A quantitative assessment of IDELs indicated that, owing to the complexity of economic activities, IDELs may exceed DELs for disaster events with high DELs. The IDELs of the top three rainstorm events in 2021 exceed the DELs, with ratios of 2.14, 1.56, and 1.35, respectively. There was a nonlinear relationship between DELs and IDELs. The current relationship was only based on the statistics of ten rainstorm events, and more events should be conducted in the future for verification.
The Event No. 15 rainstorm event, which occurred on 15–22 July 2021, had the most severe impact, with DELs and IDELs of 125.8 billion yuan and 269.1 billion yuan, respectively. Henan was located at the center of this event, with DELs and IDELs of 120.1 billion yuan and 121.1 billion yuan respectively; primary industry suffered the greatest direct and indirect impacts. Inner Mongolia, Guangdong, Gansu, and Zhejiang, located far from Henan, had greater IDELs than the surrounding area. Close trade links with Henan were one of the reasons for the high IDELs in these provinces.
Sensitivity analysis results demonstrated the robustness of the AMRIO model and showed that the overproduction capacity parameter significantly affected the simulation results. Higher overproduction capacity not only reduced IDELs, but also speeded up the reconstruction process. Further research is needed to explore the causal relationship between overproduction and disaster relief funds and a rational allocation mechanism.
The present study developed a methodology for assessing economic losses from disasters based on rainstorm events, ranking the top 10 rainstorm events for economic losses in China in 2021. The results help address the current lack of case studies in disaster economic loss assessment and provide a reference for catastrophe risk management. However, the following limitations of this study should be considered when discussing these results. First, we did not consider the associated effects between the 36 events. Second, given that only three aggregated industries were considered in the AMRIO modelling, IDELs might be underestimated. Third, the AMRIO model is an idealized simulation of the post-disaster reconstruction process, and it lacks consideration of factors such as insurance strategies, business inventories, and post-disaster labor productivity. In current disaster risk management, the comprehensive impact assessment of disasters and consideration of various non-engineering measures are particularly important. Using more accurate disaster data and adopting diverse assessment models would enhance accuracy and reduce uncertainty in evaluating economic losses. This will be the focus of further research.
Statements
Data availability statement
The original contributions presented in the study are included in the article/Supplementary Material, further inquiries can be directed to the corresponding author.
Author contributions
YiL and YuL conceived of the presented idea. YuL and YiL developed the theory, performed the computations and drafted the manuscript. GG verified the analytical methods. YC assisted with the computations. GW supervised the findings of this work. All authors discussed the results and contributed to the final manuscript.
Funding
This work was funded by the National Key Research and Development Program of China (2019YFC1510205), the National Climate Center Climate Research Open Project Youth Fund, and the China Meteorological Administration Special Foundation for Innovation and Development (CXFZ 2022J068) and the Research Program on Decision Services of China Meteorological Administration (JCZX2022021).
Conflict of interest
The authors declare that the research was conducted in the absence of any commercial or financial relationships that could be construed as a potential conflict of interest.
Publisher’s note
All claims expressed in this article are solely those of the authors and do not necessarily represent those of their affiliated organizations, or those of the publisher, the editors and the reviewers. Any product that may be evaluated in this article, or claim that may be made by its manufacturer, is not guaranteed or endorsed by the publisher.
References
1
Cao L. Yan Z. (2011). Progresses in research of homogenization of climate data. Adv. Clim. Change Res.7 (2), 129–135.
2
Che S. Li X. Ding T. (2021). Typical summer rainstorm occurred in mid-autumn: Analysis of a disastrous continuous rainstorm and its extreme water vapor transport in northern China in early october 2021. Trans. Atmos. Sci.44 (6), 825–834. 10.13878/j.cnki.dqkxxb.20211029001
3
Hallegatte S. (2008). An adaptive regional input‐output model and its application to the assessment of the economic cost of Katrina. Risk Anal.28 (3), 779–799. 10.1111/j.1539-6924.2008.01046.x
4
Hallegatte S. (2014). Modeling the role of inventories and heterogeneity in the assessment of the economic costs of natural disasters. Risk Anal.34 (1), 152–167. 10.1111/risa.12090
5
Haraguchi M. Lall U. (2015). Flood risks and impacts: A case study of Thailand’s floods in 2011 and research questions for supply chain decision making. Int. J. Disaster Risk Reduct.14, 256–272. 10.1016/j.ijdrr.2014.09.005
6
Hu P. Chen B. Shi P. (2021a). Spatiotemporal patterns and influencing factors of rainstorm-induced flood disasters in China. Acta Geogr. Sin.76 (5), 1148–1162.
7
Hu Y. Wang D. Huo J. (2021b). Assessing the economic impacts of a ‘perfect storm’of extreme weather, pandemic control and deglobalization: A methodological construct. Washington, DC, United States: World Bank Working Paper. World Bank.
8
Koks E. Carrera L. Jonkeren O. Aerts J. C. J. H. Husby T. G. Thissen M. et al (2016). Regional disaster impact analysis: Comparing input–output and computable general equilibrium models. Nat. Hazards Earth Syst. Sci.16 (8), 1911–1924. 10.5194/nhess-16-1911-2016
9
Koks E. Thissen M. (2016). A multiregional impact assessment model for disaster analysis. Econ. Syst. Res.28 (4), 429–449. 10.1080/09535314.2016.1232701
10
Li N. Zhang Z. Chen X. (2017). Importance of economic loss evaluation in natural hazard and disaster research. Prog. Geogr.36 (2), 256–263.
11
Li W. Zhao S. Chen Y. Wang L. Hou W. Jiang Y. et al (2022b). State of China's climate in 2021. Atmos. Ocean. Sci. Lett.15, 100211. 10.1016/j.aosl.2022.100211
12
Li Y. Zhao S. (2022a). Floods losses and hazards in China from 2001 to 2020. Adv. Clim. Change Res.18 (2), 154–165. 10.12006/j.issn.1673-1719.2021.196
13
Li Y. Zhao S. Wang G. (2021). Spatiotemporal Variations in meteorological disasters and vulnerability in China during 2001–2020. Front. Earth Sci. (Lausanne).9, 1194. 10.3389/feart.2021.789523
14
Liu Y. Zhang Z. Chen X. Huang C. Han F. Li N. (2021). Assessment of the regional and sectoral economic impacts of heat‐related changes in labor productivity under climate change in China. Earth's. Future9 (8), e2021EF002028. 10.1029/2021EF002028
15
Mendoza-Tinoco D. Guan D. Zeng Z. Xia Y. Serrano A. (2017). Flood footprint of the 2007 floods in the UK: The case of the Yorkshire and the Humber region. J. Clean. Prod.168, 655–667. 10.1016/j.jclepro.2017.09.016
16
Meng Y. Wang Z. Wu J. (2015). Global economic impacts of large-scale disasters case study of the great east Japan earthquake. J. Nat. Disasters24 (6), 1–8. 10.13577/j.jnd.2015.0601
17
Okuyama Y. Santos J. R. (2014). Disaster impact and input–output analysis. Econ. Syst. Res.26 (1), 1–12. 10.1080/09535314.2013.871505
18
USGCRP (2018). “Impacts, risks, and adaptation in the United States,” in Fourth national climate assessment ,Vol. II. Editors ReidmillerD. R.AveryC. W.EasterlingD. R.KunkelK. E.LewisK. L. M.MaycockT. K.et al (Washington, DC, United States: U.S. Global Change Research Program), 1515. 10.7930/NCA4.2018
19
Rose A. (2004). Defining and measuring economic resilience to disasters. Disaster Prev. Manag.13 (4), 307–314. 10.1108/09653560410556528
20
Wang Y. Gao C. Wang A. et al (2014). Temporal and spatial variation of exposure and vulnerability of flood disaster in China. Adv. Clim. Chang. Res.10 (6), 391–398. 10.3969/j.issn.1673-1719.2014.06.001
21
Wu J. Li N. Hallegatte S. Shi P. Liu X. (2012). Regional indirect economic impact evaluation of the 2008 Wenchuan Earthquake. Environ. Earth Sci.65 (1), 161–172. 10.1007/s12665-011-1078-9
22
Xia Y. Guan D. Jiang X. Peng L. Schroeder H. Zhang Q. (2016). Assessment of socioeconomic costs to China's air pollution. Atmos. Environ.139, 147–156. 10.1016/j.atmosenv.2016.05.036
23
Xie W. Li N. Li C. Wu J. d. Hu A. Hao X. (2014). Quantifying cascading effects triggered by disrupted transportation due to the great 2008 Chinese ice storm: Implications for disaster risk management. Nat. Hazards (Dordr).70 (1), 337–352. 10.1007/s11069-013-0813-9
24
Xu X. Tang Q. (2021). Meteorological disaster frequency at prefecture-level city scale and induced losses in mainland China during 2011–2019. Nat. Hazards109, 827–844. 10.1007/s11069-021-04858-8
25
Ye D. Wang Z. Gao R. (2019). Objective identification and climatic characters of the regional rainstorm event in China from 1961 to 2016. Clim. Change Res.15 (6), 575–583. 10.12006/j.issn.1673-1719.2018.172
26
Yuan X. Sheng X. Chen L. Tang Y. Li Y. Jia Y. et al (2022). Carbon footprint and embodied carbon transfer at the provincial level of the Yellow River Basin. Sci. Total Environ.803, 149993. 10.1016/j.scitotenv.2021.149993
27
Zhang Z. Cui P. Li N. (2020). Research on the assessment of the multi-regional economic ripple effect caused by disasters—A case study of a flood disaster in wuhan city on july 6, 2016. Adv. Clim. Change Res.16 (4), 433–441. 10.12006/j.issn.1673-1719.2019.259
28
Zhao S. Gao G. Huang D. (2017). Characteristics of meteorological disaster losses in China from 2004 to 2013. J. Meteorology Environ.33, 101–107.
29
Zhou L. Wu X. Gao G. (2018). Analysis of indirect economic loss of meteorological disasters among the belt and road typical countries based on the MRIO model: Taking the China’s typhoon rammasun in 2014 as an example. J. Nat. Disaster27 (5), 1–11. 10.13577/j.jnd.2018.0501
Summary
Keywords
rainstorm events, floods, 2021 Henan floods, direct economic losses, indirect economic losses, input-output model
Citation
Liu Y, Li Y, Wang G, Gao G and Chen Y (2023) Quantifying multi-regional indirect economic losses: An assessment based on the 2021 rainstorm events in China. Front. Earth Sci. 10:1057430. doi: 10.3389/feart.2022.1057430
Received
29 September 2022
Accepted
14 November 2022
Published
20 January 2023
Volume
10 - 2022
Edited by
Duanyang Liu, Chinese Academy of Meteorological Sciences, China
Reviewed by
Jidong Wu, Beijing Normal University, China
Wei-Bo Chen, National Science and Technology Center for Disaster Reduction (NCDR), Taiwan
Updates
Copyright
© 2023 Liu, Li, Wang, Gao and Chen.
This is an open-access article distributed under the terms of the Creative Commons Attribution License (CC BY). The use, distribution or reproduction in other forums is permitted, provided the original author(s) and the copyright owner(s) are credited and that the original publication in this journal is cited, in accordance with accepted academic practice. No use, distribution or reproduction is permitted which does not comply with these terms.
*Correspondence: Ying Li, yingli@cma.gov.cn
This article was submitted to Geohazards and Georisks, a section of the journal Frontiers in Earth Science
Disclaimer
All claims expressed in this article are solely those of the authors and do not necessarily represent those of their affiliated organizations, or those of the publisher, the editors and the reviewers. Any product that may be evaluated in this article or claim that may be made by its manufacturer is not guaranteed or endorsed by the publisher.