 Lucheng Zhang
 Qiming Zhong
 Meng Yang
 Ming Peng
 Jiaxin Liu
 Shengyao Mei1
- 1Department of Geotechnical Engineering, Nanjing Hydraulic Research Institute, Nanjing, China
- 2Key Laboratory of Reservoir and Dam Safety of the Ministry of Water Resources, Nanjing, China
- 3Department of Geotechnical Engineering, Tongji University, Shanghai, China
- 4College of Civil and Transportation Engineering, Hohai University, Nanjing, China
This study used the 400 g-ton geotechnical centrifuge model test system at the Nanjing Hydraulic Research Institute (NHRI) to investigate the breach evolution characteristics and hydrograph process of overtopping-induced breaching of landslide dams. It was achieved by taking advantage of the “time-space amplification” effect created by high-speed rotation using a centrifuge overweight force field. The effects of dam height, slope ratio, and soil gradation on the overtopping failure process of landslide dams were investigated by centrifugal model tests for the first time. In addition, a detailed physically-based dam breach model was developed to simulate the overtopping failure of landslide dams. Results show that the breach process of a landslide dam can be divided into four stages based on the measured breach morphology evolution process and the abrupt variations of breach flow discharge: initial scour on the downstream slope, retrogressive erosion to the dammed lake, erosion along the breach channel, and breach stabilization. Moreover, the peak breach flow is most sensitive to the dam height, followed by the average particle size; the time to peak is mainly affected by the slope ratio, and the relative residual dam height is primarily susceptible to the average particle size. In practice, the calculated results are consistent with the measured results. This study provides a scientific reference for the cognition of the overtopping-induced breach mechanism of landslide dams.
1 Introduction
Landslide dams are accumulations formed by blocking valleys or river channels as a result of landslides, debris flows, lava flows, and other mass-wasting events caused by earthquakes, rainfall, or volcanic eruptions under specific geological and geomorphological conditions (Costa and Schuster, 1988; Korup and Tweed, 2007; Hermanns, 2013; Fan et al., 2019). As a result of natural processes, landslide dams exhibit wide gradations, irregular shapes, and complex structures (Zhong et al., 2021). Landslide dams are widespread throughout the world. Extreme weather and geological disasters have occurred frequently in recent years, leading to increased landslide dams (Mei et al., 2021; Zheng et al., 2021). Unlike artificial dams, landslide dams are formed by a mixture of unconsolidated soil and rock in a naturally unstable state (Zhong et al., 2018). They lack channelized spillways or other protected outlets (Zhong et al., 2021). Therefore, once the upstream flow continues, the failure risk of landslide dams is much higher than that of artificial dams. Shen et al. (2020a) performed statistical analysis on 352 landslide dams with longevity information and found that 29.8% of the cases lasted for less than 1 day, 68.2% lasted for less than 1 month, and 84.4% lasted for less than 1 year. Other researchers presented similar statistics (Costa and Schuster, 1988; Peng and Zhang, 2012).
Landslide dams generally have a wide area of rainwater collection and a large volume of water storage. Once the dam fails, the breached flood can bring severe life, economic, and ecological losses to the downstream inundated area, causing profound social impact. For instance, the burst of the Diexi landslide dam in China in 1933 washed away numerous villages and massive farmland, causing over 9,000 deaths (Liu et al., 2016). On 25 April 1974, a massive landslide occurred on the Mantaro River in Peru, creating a huge dammed lake that burst 2 months later, and destroying roads, farms, and bridges (Lee and Duncan, 1975). Overtopping and seepage are the most common failure modes for landslide dams (Zheng et al., 2021). Almost 94% of landslide dams failed due to overtopping and 5% due to piping (Zhong et al., 2021). Hence, it is vital to investigate the dam breach process and breach mechanism of overtopping-induced failure of landslide dams to conduct emergency treatments efficiently to minimize losses.
The overtopping breach of landslide dams is a highly complex process involving water-soil coupling and structural failures. The current research methods for the overtopping failure of landslide dams are mainly divided into physical model tests and mathematical models (Zheng et al., 2021; Zhong et al., 2021). The physical model test is a common and indispensable technique for studying dam failure mechanisms. Recently, a series of landslide dam failure model tests were developed based on the artificial dam erosion models. The principal research methodologies include in situ tests (i.e., Chang and Zhang, 2010; Chang et al., 2011; Zhou et al., 2022) and laboratory model tests (i.e., Davies et al., 2007; Niu et al., 2012; Yang et al., 2015; Zhou et al., 2019; Peng et al., 2021; Zhu et al., 2021). The flume test is currently the primary method for the laboratory model test. It’s widely applied to study the breach morphology evolution and breach hydrograph during landslide dam overtopping failure, and the influence of various factors on the dam failure process. Due to the significant difference in stress levels between the model and the prototype, the test results often vary from reality, and the conclusions of different scholars regarding various influencing factors are also inconsistent. Although the results of the large-scale in situ tests are closer to the prototype dam, the test costs are high, the test period is long, and the risks are difficult to control.
In recent years, with the continuous advancement in the simulation theory of landslide dam failure and the rapid development of computer technology, more studies have been conducted on the mathematical models of overtopping-induced landslide dam breaching. Generally, these models can be classified as empirical models and physically based numerical models (Wahl, 1998; ASCE/EWRI Task Committee on Dam/Levee Breach, 2011; Zhong et al., 2016, 2021). Based on the statistical regression of the collected measured data of landslide dam breach cases, empirical models were developed to predict the breaching parameters, such as peak breach flow, final breach size, and failure time (Costa, 1985; Evans, 1986; Costa and Schuster, 1988; Walder and O’Connor, 1997; Peng and Zhang, 2012; Shan et al., 2022). The empirical models are easy to use, allowing for rapid prediction of the consequences due to landslide dam failure. In contrast, physically based numerical models have the advantage of reflecting the dam breach mechanisms and failure processes, and can provide the breach morphology evolution processes and the breach flow hydrographs (Zhong et al., 2018; Shen et al., 2020b; Mei et al., 2022). The physically based numerical models can be further divided into simplified and detailed physically based models. Simplified physically based numerical models consider the necessary physical processes and have high computational efficiency. In these models, the breach cross-section is often simplified as a trapezoid, and the overtopping flow through the breach is simulated using the broad-crested weir flow equation, and the erosion at the breach is determined using sediment transport models (Chang and Zhang, 2010; Chen et al., 2015; Zhong et al., 2018). Based on the Navier-Stokes equations and sediment transport models, detailed physically based numerical models can consider the complex flow characteristics and rapid breach topography evolution in the landslide dam breach process, thus effectively improving the accuracy of simulation results (Cao et al., 2011; Li et al., 2021).
In summary, the existing physical model tests and mathematical models for the overtopping-induced landslide dam breach process have apparent shortcomings. The stress levels of small-scale dam breach model tests differ significantly from those of the prototype, while the large-scale dam breach model tests are costly and time-consuming. An empirical model cannot consider the physical and mechanical properties of the wide-graded dam materials, and cannot provide the breach flow discharge process. In addition, the reliability of the empirical models depends on the accuracy of landslide dam information. The simplified physically based numerical models introduce significant simplifications and assumptions, so they cannot really consider the erosion characteristics of wide graded soil and the hydrodynamic conditions of high-velocity flow during landslide dam breaching. Furthermore, multidimensional, specifically 3D detailed physically based breach models, are still at the early stage of development.
Under the condition of high-speed rotation, the hypergravity field generated by a geotechnical centrifuge has the effect of “time-space amplification”. It can generate prototype-level effective stress in a small-scale model. At the same time, similar conditions, such as geometry, dam materials, and hydrodynamic conditions, can be satisfied. Therefore, the centrifugal model test can be regarded as a practical method for investigating the failure of landslide dams. They can reproduce the overtopping failure process of a landslide dam in a short period at a low cost. This is important and valuable for correctly revealing the breach mechanism and breach process of a landslide dam composed of wide-graded dam materials.
This study investigates the failure of a landslide dam due to overtopping using centrifugal model tests. It reveals the breach mechanism, breach evolution characteristics, and hydrograph during the dam failure. The effects of dam height, slope ratio, and gradation of dam materials on the dam failure process are addressed by centrifugal model tests for the first time. In addition, a 3D detailed physically based numerical model of overtopping-induced failure of landslide dams is developed, which can consider the complex hydrodynamic characteristics of turbulent flow, and the bedload and suspended load transportation during the landslide dam breach process with actual topography. Finally, the calculated results are compared with the measured data of the centrifugal model tests to verify the rationality of the proposed mathematical model.
2 Centrifugal model test system for landslide dam breaching
To conduct landslide dam breach model tests in a geotechnical centrifuge, three fundamental technical problems must be solved: 1) establish a similarity criterion for the centrifugal model test of landslide dam breaching, 2) continuously provide stable water flow to the high-speed rotating centrifuge, and 3) accurately record and measure the breach flow discharge. A centrifugal model test system for landslide dam breaching was developed based on the 400 g-ton geotechnical centrifuge at the Nanjing Hydraulic Research Institute (NHRI). The following is a description of the similarity criteria and centrifugal model test system.
2.1 Similarity criterion
The breach of a landslide dam is a typical water-soil coupling process. When a centrifuge is used to explore the dam breach process, it is necessary to establish similar criteria for the dam materials and the dam breach flow. The following briefly introduces the similar criteria used in the model tests.
2.1.1 Stress similarity criterion
The force of gravity endured by the prototype is consistent with the centrifugal force physical effects experienced by the model in the centrifuge, where the materials properties of the soil are hardly changed. The centrifugal model test simulates gravity using centrifugal force so that the dead weight of the model in the centrifuge is raised to match that of the prototype, and the stress state of the model and prototype are identical.
In the centrifuge, the model’s geometric size is reduced to 1/N of the prototype, and the model’s stress force corresponds to the stress force of the prototype. The physical relationship is as follows:
where subscript m represents model, p represents prototype, L = length, σ = stress, q = hydrostatic pressure, and N = model geometry scale.
In rock and soil mass, the force of gravity is the essential stress. For the gravity of the model to be equal to the prototype, when the model is identical to that of the prototype materials, the 1/N model must bear the centrifugal acceleration of Ng in the centrifuge:
where gm is the centrifugal acceleration of the model, gp is the prototype acceleration, and g is the acceleration of gravity.
2.1.2 Flow similarity criterion
The centrifugal model test of an overtopping dam breach involves the process of breach flow. The similarity criteria of flow velocity, flow rate, and time are derived from the Chezy formula and energy conservation law.
Using the Chezy formula and assuming that the flow at the breach of the dam is uniform and stable, the flow velocity v is:
where R = hydraulic radius, A = wetted cross-section area,
In the centrifugal model test, the water body conforms to the geometric similarity criterion whether the water is static or flowing.
Chezy coefficient can be expressed as:
where
Therefore, the flow velocity of the model is entirely equal to that of the prototype.
The cross-section in the model is 1/N2 times that of the prototype, and the breach flow Qm of the model is:
Time can be extrapolated according to the velocity and length of the model flow:
Table 1 details the similarity criteria of common physical quantities in centrifugal model tests.
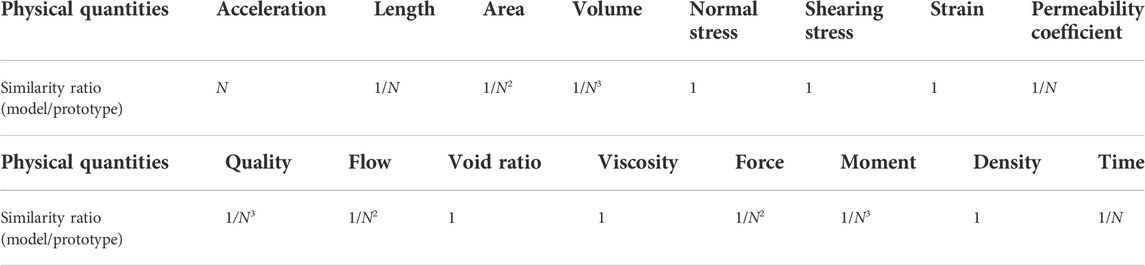
TABLE 1. The similarity criteria of common physical quantities in centrifugal model tests.
2.2 Centrifugal model test system
The centrifugal model test system mainly comprised a large geotechnical centrifuge, a special model box, a servo water valve flow control system, a data acquisition system, and image-recording devices.
2.2.1 Large geotechnical centrifuge
Figure 1A shows the large geotechnical centrifuge, while Table 2 lists the main technical parameters of the NHRI-400 g-ton geotechnical centrifuge.
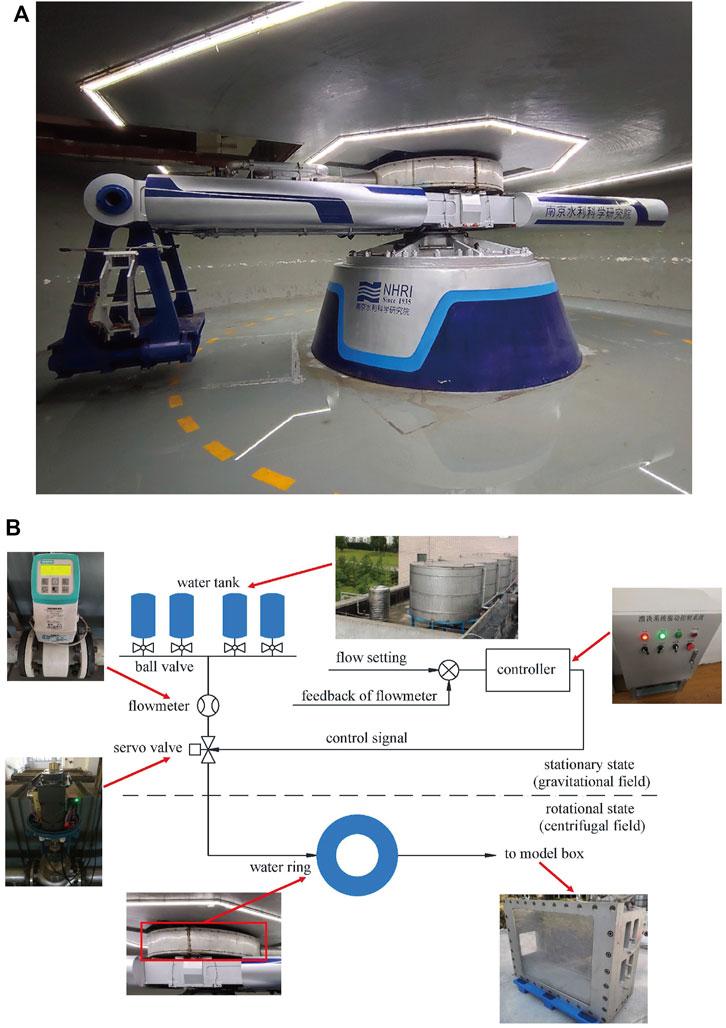
FIGURE 1. Centrifugal model test system. (A) NHRI-400 g ton large geotechnical centrifuge. (B) Schematic diagram of the servo water valve flow control system.
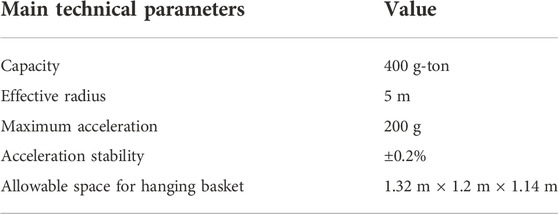
TABLE 2. The main technical parameters of NHRI-400 g-ton geotechnical centrifuge.
2.2.2 Model box
2.2.2.1 Appearance and size
A special box (Figure 2A) was developed to investigate the process of the dam breach. The effective size of the model box was 1.2 m × 0.4 m × 0.8 m (length × width × height). In order to easily observe and record the process of a dam breach, one side of the box was made of highly transparent tempered glass. The other side of the box, the head cover, and the bottom of the model box were high-strength aluminum alloy plates with a thickness of 65 mm.
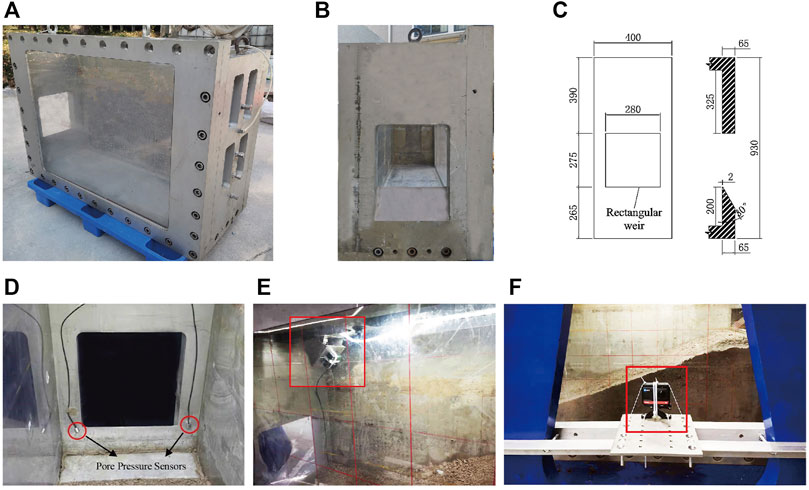
FIGURE 2. The special model box, layout of the pore pressure sensors and the image-recording devices. (A) Photograph of the model box (B) Photograph of the rectangular weir. (C) Schematic diagram of rectangular weir (unit: mm). (D) The pore pressure sensors. (E) Camera No. 1. (F) Camera No. 2.
2.2.2.2 Rectangular sharp-crested weir
To investigate the breach process and mechanism of landslide dams, a rectangular sharp-crested weir (Figures 2B,C) was embodied in the downstream end of the model box to obtain an accurate breach flow discharge process. Two pore pressure sensors were installed inside the box’s downstream end, as shown in Figure 2D. The sensor’s output signal is a voltage signal, which can be converted to water depth.
The breach flow discharge can be calculated based on the water depth using the following formula.
where Q is the breach flow discharge, m0 is the discharge coefficient which will be calibrated before the test, Bw is the width of the rectangular sharp-crested weir, Ng is the centrifuge acceleration, h is the depth of water, and t is the time.
2.2.2.3 Water tank
A 200 mm × 400 mm × 500 mm water tank was constructed to store water upstream and stabilize the upstream flow. The front of the water tank was a perfect fit for the model box and was covered with a 3 mm diameter unidirectional pore.
2.2.3 Servo water valve flow control system
Figure 1B demonstrates the servo water valve flow control system. Four 2.5 m3 water tanks were installed on top of the laboratory roof. The flowmeter monitored the water supply flow and generated a negative feedback signal, and then the controller drove the openness of the servo valve according to the PID (proportion integral differential) control algorithm based on the supply flow process set before the test. Water flowed through the servo valve into the water ring. There was no hardware contact between the water supply pipe and the water ring, which avoided wear and leakage of the hydraulic rotary head. Water flowed into the model box through a rotary arm, was discharged to the laboratory floor through a rectangular sharp-crested weir, and then recycled by a water collector.
2.2.4 Data acquisition system and image-recording devices
The data acquisition system consisted of the data acquisition module on the rotary arm and the industrial computer on the ground. The data acquisition module can synchronously record signals from 90 measuring channels, including 70 channels of the strain signal and 20 channels of the voltage signal. The flow control system recorded the flow process. The pore pressure sensors installed within the water tank and at the rectangular mouth were connected to the data acquisition module. The image-recording devices were two cameras, one on the top of the model box (Figure 2E) and the other on the side of the centrifuge hanging basket (Figure 2F).
3 Test setup and procedure
In this study, the centrifugal model test system was utilized to conduct the overtopping failure test of landslide dams under different conditions. The centrifugal acceleration was set to 50 g. The breach morphology evolution process, the breach flow discharge process, and the influence of various factors on the overtopping failure process were investigated to reveal the breach mechanism of landslide dams in greater detail. Based on the size of the model box, the water supply condition of the servo water valve flow control system, and the dam materials selected for the test, the three influencing factors of dam height, slope ratio, and gradation of dam materials were chosen for the test design. The reason for the choice of three influencing factors is that the dam height is known to be the determinant of the dammed lake volume and potential energy of water, the slope ratio determines the breach morphology in cross and longitudinal sections, and the gradation of dam materials determines the soil erosion rate under particular flow shear stress. Therefore, this paper selected four conditions for the centrifugal model test.
Because the rectangular sharp-crested weir was 200 mm away from the bottom of the model box, clay was placed at the bottom, followed by a cushion plate to make downstream flood and eroded dam materials discharge smoothly. The top surface of the cushion plate was 100 mm away from the bottom of the model box.
3.1 Design of parameters
3.1.1 Dam height
After arranging the clay layer and cushion plate inside the model box, the effective height was 700 mm. To make full use of the model box space, considering the slope ratio and the outlet height of the water tank, this study specified dam heights of 250 and 350 mm, with the corresponding actual dam heights of 12.5 and 17.5 m under the gravity acceleration of 50 g. The cushions under different dam heights were adjusted to cause the water tank outlet to be slightly higher than the top of the dam, and the height difference between the outlet and the top remained constant. When the model dam height was 250 mm, the water tank was placed at the bottom of the model box (Condition 1, Figure 3A). When the model dam height was 350 mm, the water tank was on the cushion (Condition 2, Figure 3B).
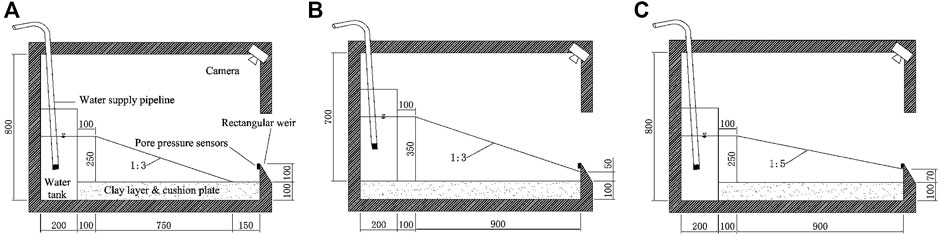
FIGURE 3. Schematic diagrams of each model (unit: mm). (A) Condition 1 and 4. (B) Condition 2. (C) Condition 3.
3.1.2 Slope ratio
The slope ratio of the downstream dam has an important influence on the breach process of landslide dams. Usually, the dam slope of a natural landslide dam is gentle, with a slope ratio between 1:2 and 1:5.5. Considering the length of the water tank was 200 mm, the effective length of the model box was 1,000 mm, and to make full use of the space of the model box, two slope ratios of 1:3 (Condition 1, Figure 3A) and 1:5 (Condition 3, Figure 3C) were selected.
3.1.3 Gradation
Due to the wide gradation characteristics of the dam materials of landslide dams, the gradation curve obtained from five boreholes of the Tangjiashan landslide dam (Liu et al., 2010) was used in this study. The maximum particle size of the model gradation was controlled to 40 mm by the average gradation as the prototype gradation and scaled down utilizing the mixed method. The mean particle size (d50) was used to characterize the different gradations. The mean particle size of Conditions 1 to 3 was controlled at 5 mm by a similar gradation method, and the particles larger than 40 mm were replaced with 40–5 mm. To investigate the effect of gradation on landslide dam failure, the d50 of Condition 4 was set to 1 mm, and Figure 4 depicts the gradation curves. The model size of Condition 4 was identical to that of Condition 1. Table 3 summarizes the parameter settings of the three influencing factors of the centrifugal model tests on the overtopping-induced breach processes of landslide dams.
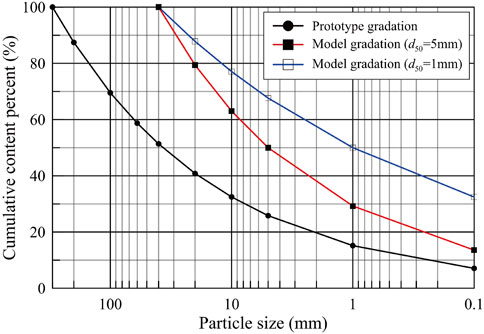
FIGURE 4. Gradation curves of prototype and model.
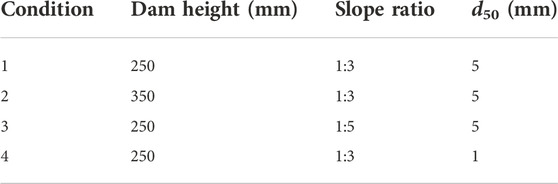
TABLE 3. Parameter settings of the three influencing factors for the four conditions.
Rockfill materials for dam construction were selected for the test. After drying and screening, the materials were divided into five particle size groups, 40–20, 20–10, 10–5, 5–1, and <1 mm, respectively, as shown in Figures 5A–E. The specific gravity of soil is 2.75. For the four conditions, the porosity of the sample was set to 28%, and the moisture content was set to 5%. Based on the specific gravity of the soil and the sample porosity, the dry density of the model was determined to be 1.98 g/cm3.
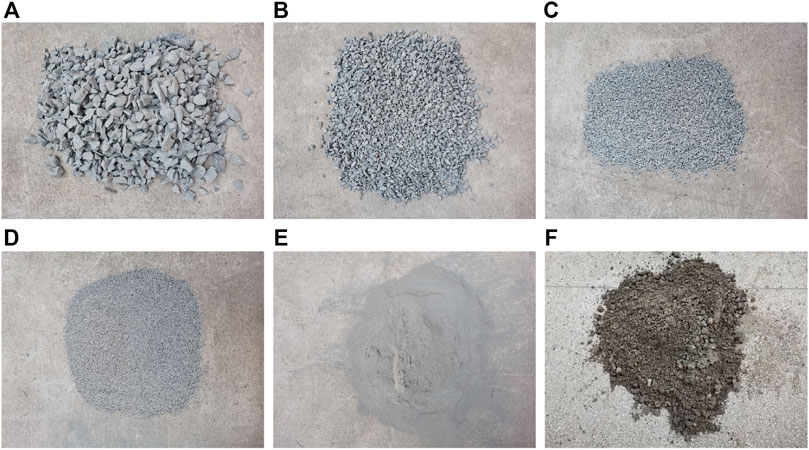
FIGURE 5. Particles in each particle size group and preparation of model dam materials. (A) 40–20 mm. (B) 20–10 mm. (C) 10–5 mm. (D) 5–1 mm. (E) <1 mm. (F) Dam materials after mixing evenly with water.
3.1.4 Initial breach location and size
The initial breach was opened on the tempered glass side of the model box to observe changes in the breach and erosion of the downstream slope. The breach shape was trapezoidal, with a top width of 70 mm, a bottom width of 30 mm, and a height of 40 mm (Figure 6A).
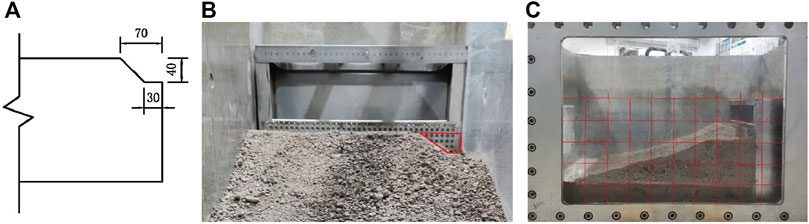
FIGURE 6. Excavation size of the initial breach and the model dam of Condition 1. (A) Schematic diagram of the initial breach (unit: mm). (B) Actual excavation of initial breach of Condition 1. (C) Photo of the side of the model dam of Condition 1.
3.2 Procedure of test
The test of each working condition was conducted according to the following steps.
4 Analysis of the centrifugal model test results
The following test results were converted into the physical quantities of the prototype dam according to the similarity criterion in Section 2.1. The breach process and mechanism of overtopping-induced failure of landslide dams were analyzed utilizing Condition 4 as an example. The effects of dam height, slope ratio, and gradation on the dam failure process were compared separately based on the findings of four conditions.
4.1 Breach evolution characteristics
Figure 7 illustrates the typical dam images captured during the breach process as a result of a thorough analysis of the two-camera-recorded video of the dam breach process of Condition 4. The overtopping-induced failure of landslide dams can be divided into the following four stages.
Stage 1: Initial scour on the downstream slope. In the initial stage of the dam breach, overtopping water overflowed from the initial breach and eroded the downstream slope. The fine particles on the dam surface were taken away by the water flow, forming a high-concentration sand-laden water flow. At this stage, surface erosion was dominant, and the breach gradually expanded.
Stage 2: Retrogressive erosion to the dammed lake. Compared to the breach, the flow velocity at the foot of the downstream slope was faster, and the erosion effect was more substantial, resulting in more extensive dam erosion and a gentler slope ratio. This process developed gradually upstream, which is known as retrogressive erosion. At this stage, the size of the breach grew rapidly with the speed of vertical cutting exceeding the rate of width expansion.
Stage 3: Erosion along the breach channel. After the end of the previous stage, the slope ratio of the downstream slope was significantly reduced. Due to insufficient hydrodynamic conditions, the breach cutting rate slowed down, and the longitudinal dimension of the breach gradually increased, accompanied by lateral broadening.
Stage 4: Breach stabilization. The upstream water level dropped, and the erosion ability of the water flow receded. For the landslide dam of wide gradation, the coarse particles remained on the downstream slope because the critical start-up condition was not reached, resulting in a coarsening of the slope. At this stage, the breach gradually stabilized and no longer developed.
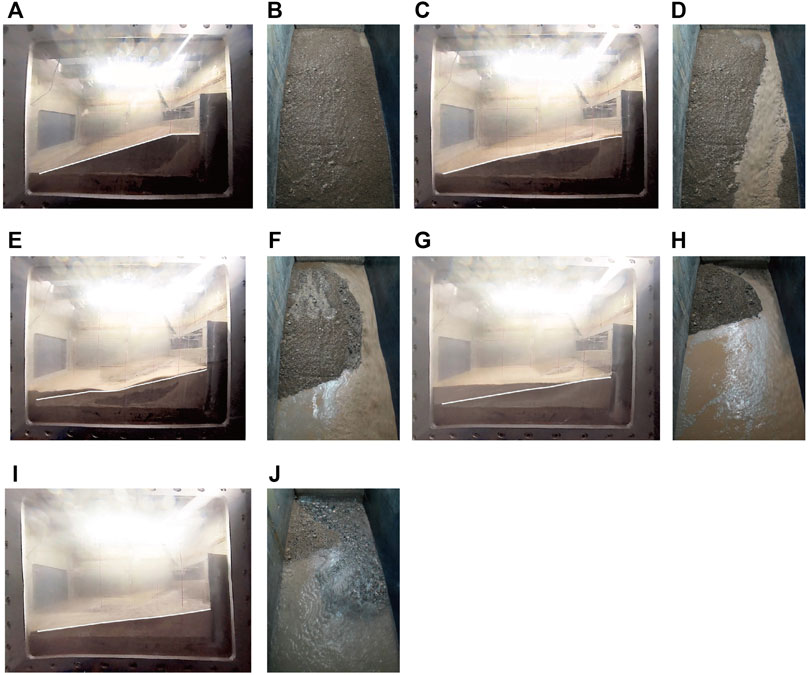
FIGURE 7. Typical dam images of breach process of Condition 4. (A) The initial moment of dam failure (Camera No. 1). (B) The initial moment of dam failure (Camera No. 2). (C) Stage 1 (Camera No. 1). (D) Stage 1 (Camera No. 2). (E) Stage 2 (Camera No. 1). (F) Stage 2 (Camera No. 2). (G) Stage 3 (Camera No. 1). (H) Stage 3 (Camera No. 2). (I) Stage 4 (Camera No. 1). (J) Stage 4 (Camera No. 2).
Meanwhile, Figure 8A depicts the longitudinal section of the prototype dam at the breach for the various stages of the dam failure shown in Figure 7. With the development of the dam breach, the downstream slope became gentler.
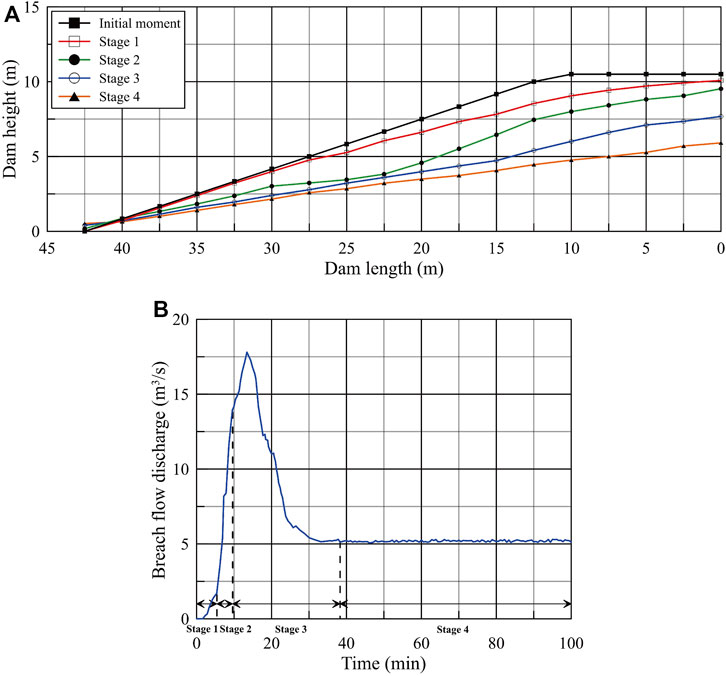
FIGURE 8. Breach morphology and breach hydrograph of Condition 4 (prototype dam). (A) Longitudinal section at the breach during dam breaching. (B). Breach flow discharge process.
4.2 Breach flow discharge process
Before the test, the discharge coefficient of the rectangular weir was measured to be 0.278. The breach flow discharge can be determined with Eq. 11, where h(t) can be obtained from the pore pressure sensor readings.
Figure 8B depicts the breach flow discharge process of the prototype dam in Condition 4. When time equalled zero, the overtopping water flow overflowed from the breach. It is simple to determine that the breach flow discharge process indicates the following features. First, in the first few minutes of the dam failure, the flow discharge increased slowly, corresponding to Stage 1. Second, the flow discharge rose rapidly and reached 14.0 m3/s at t = 9.6 min, corresponding to Stage 2. Subsequently, the increase in flow discharge rate slowed down slightly and reached the peak discharge of 17.8 m3/s at t = 13.4 min and then rapidly decreased, corresponding to Stage 3. Finally, when t = 38.3 min, the flow gradually stabilized, and the breach flow was the inflow, corresponding to Stage 4.
4.3 Influence of different factors on breach process
In this paper, the dam height, slope ratio, and gradation were changed respectively to research the influence of these factors on the dam break process with Condition 1 as the control test. By sorting the test results, three dam breach parameters, peak discharge, time to peak, and relative residual dam height (defined as the ratio of residual dam height to initial dam height), were selected for comparison and analysis. The test results are summarized in Table 4, where the percentage in brackets represents the increment of dam breach parameters compared to Condition 1.

TABLE 4. Breach parameters of prototype dams for the four conditions.
The influence of the three factors on the breach parameters is as follows. When the dam height increased or the average particle size of the dam materials decreased, the peak discharge grew significantly, the time to peak advanced, and the relative residual dam height decreased. The peak discharge decreased, the time to peak was observably delayed, and the relative residual dam height increased when the slope ratio became gentler. Further analysis found that the peak breach flow was most sensitive to the dam height, followed by the average particle size, the time to peak was most sensitive to the slope ratio, and the relative residual dam height was most susceptible to the average particle size.
These phenomena are because of various inner-physical mechanical mechanisms. By comparing Condition 1 and Condition 2, when the dam height of the landslide dam increases, the upstream water storage increases, so the peak discharge increases. The potential energy of the overtopping water flow increases, and the erosion effect on the downstream slope is stronger, accelerating the dam breach process and making the dam breach more sufficient. Therefore, the time to peak advances, and the relative residual dam height decreases. By comparing Condition 1 and Condition 3, when the downstream slope ratio of the landslide dam decreases, the dam body itself is more stable and not easily eroded. The process of releasing the potential energy of the overtopping water flow slows down, thus inhibiting the development of the dam breach and slowing down the dam breach process. Therefore, the peak discharge decreases, the time to peak delays, and the relative residual dam height increases. By comparing Condition 1 and Condition 4, under the same hydrodynamic conditions, when the mean particle size of the barrier dam decreases, that is, when the dam materials become finer, the number of particles satisfying the critical start-up condition increases. The dam body is easily eroded and the dam breach is more thorough. Therefore, the peak discharge increases, the time to peak advances, and the relative residual dam height decreases.
5 Numerical simulation test
To further study the breach process and mechanism, a detailed physically based numerical model was adopted to simulate the overtopping-induced failure of landslide dams.
5.1 Numerical simulation method and model
5.1.1 Governing equations
Based on the Cartesian coordinate system and assuming that water is an incompressible fluid, the continuity equation and momentum equations of the Reynolds-Averaged Navier-Stokes (RANS) equations are given by Eqs 12, 13, respectively (Kocaman et al., 2020).
where ρw is the water density, VF is the fractional volume open to flow, t is time, xi represents the coordinate along the three directions (subscript i traverses the three directions of x, y, and z, respectively, and so does j), ui, Ai, gi, and fi represent the components of velocity, flow passing area, mass acceleration and viscous acceleration in subscript direction, respectively, and p is pressure.
During the breach process of a landslide dam, the sediment movement modes can be converted between bedload and suspended load (Mei et al., 2022).
5.1.2 Discretization of governing equations and initial and boundary conditions
To solve the above governing equations, it is necessary to discretize the grid calculation region, which is divided into multiple continuous subregions using grid nodes. In this study, the finite volume method (FVM) was applied for discretization, and a three-dimensional rectangular staggered grid was used to decompose the whole calculation domain.
The calculation object of the numerical simulation is the prototype dam of Condition 4. The whole computational domain is covered by a 0.2 m three-dimensional uniform rectangular grid.
The initial upstream water level was identical to the bottom elevation of the breach. The upstream boundary adopted a constant inflow condition, and the inflow was constant at 5.2 m3/s. The boundary conditions were set based on the centrifugal model test.
5.2 Analysis of calculation results
5.2.1 Breach process
Figure 9 depicts the top views of the dam body shape at each stage. A comparison of the longitudinal section of the dam body at the breach in each stage of the two test methods is shown in Figure 10A, where the C and N in brackets represent the centrifugal model test and numerical simulation test, respectively. Similar to the centrifugal model test, the dam breach process can also be divided into four stages.
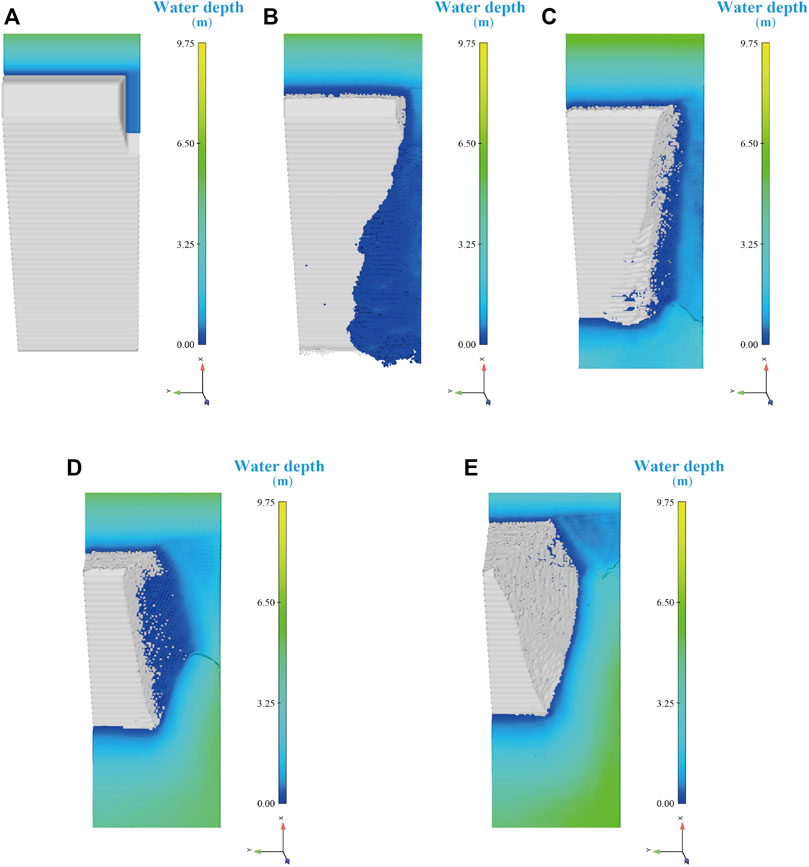
FIGURE 9. Typical top view of the dam body shape at each stage of the numerical model. (A) The initial moment of dam failure. (B) Stage 1. (C) Stage 2. (D) Stage 3. (E) Stage 4.
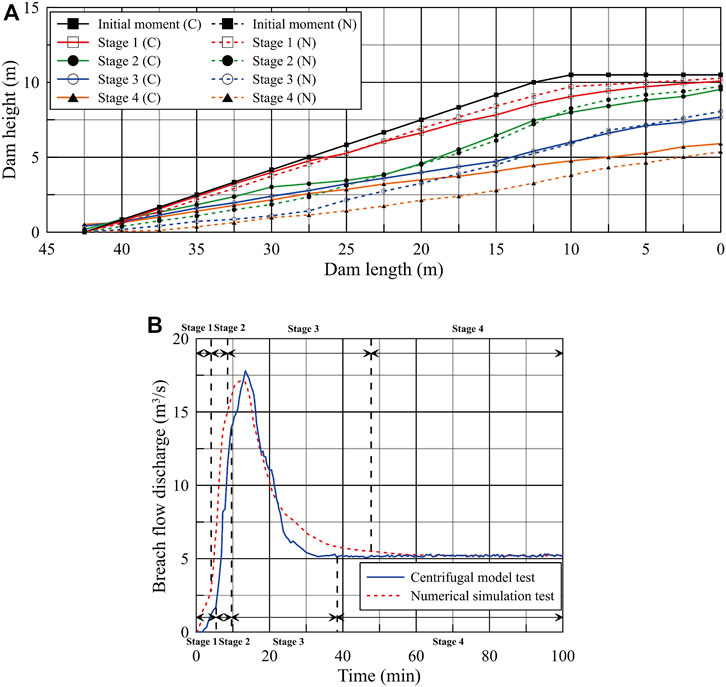
FIGURE 10. Breach morphology and breach hydrograph of Condition 4 (prototype dam). (A) Comparison of longitudinal section during dam breaching (prototype dam). (B) Comparison of breach flow discharge process of Condition 4 (prototype dam).
During Stage 1, the water level was low, and the water flow was slow, resulting primarily in surface erosion of the downstream dam surface and the slow development of the breach. During Stage 2, the hydrodynamic conditions were enhanced as the water level continued to rise, and the breach undercut rapidly. During Stage 3, the speed of the lateral breach expansion increased compared to the undercut. During Stage 4, the breach gradually stopped developing. Dam failure was complete when the breach flow was approximately equal to the inflow. The evolution of breach morphology played an essential part in the overtopping breach process of landslide dams. In Stages 2 and 3, the downstream dam was heavily eroded.
Compared to the centrifugal model test (Figure 7), the breach process of the numerical simulation test was slightly different.
Stage 1: For the centrifugal model test, the breach had a preliminary development, and the downstream slope toe near the left bank was not eroded. For the numerical simulation test, the breach almost did not develop, and the water flow scoured the downstream slope along the left bank boundary.
Stage 2: For the centrifugal model test, the breach had obvious transverse broadening and longitudinal development, and the downstream slope toe was eroded entirely. For the numerical simulation test, the breach had a preliminary transverse widening, the longitudinal development was obvious, and the downstream slope toe was partially eroded.
Stage 3: For the centrifugal model test, the breach was further widened horizontally, and the downstream slope was obviously eroded. For the numerical simulation test, the breach rapidly widened horizontally and developed vertically, and the downstream slope toe was slowly eroded.
Stage 4: For the centrifugal model test, the breach was fully widened, and the dam shape reached a stable state. For the numerical simulation test, the breach was almost completely widened and no longer developed, and the dam shape reached a stable state.
In general, the difference between the two tests was because in the high-speed rotating centrifuge, the water flow had a velocity component pointing to the right bank under the action of Coriolis force, which accelerated the transverse widening of the breach.
5.2.2 Breach hydrograph
Figure 10B compares the breach flow discharge process between the numerical simulation test and the centrifugal model test. The comparison shows that the calculated breach hydrograph was consistent with the measured hydrograph trend. For the numerical simulation of the dam breach process, predicting the peak breach flow and the time to peak was crucial. Table 5 indicates the results of these two breach parameters, with the percentage in brackets representing the relative error between the calculated and measured values. The calculated peak discharge was 17.1 m3/s, 3.9% less than the measured value. The time to peak was 12.3 min, 8.2% earlier than the measured value. The relative errors of the two breach parameters were within ±10%, indicating that the numerical simulation test breach hydrograph matched the results of the centrifugal model.
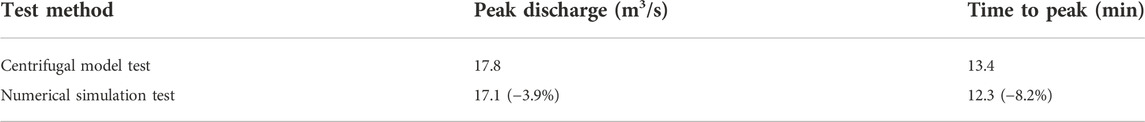
TABLE 5. Comparison of breach parameters (prototype dam).
Overall, the calculation results demonstrated that the numerical method adopted in this paper was feasible and able to simulate the overtopping failure process of landslide dams.
6 Conclusion
This study performed centrifugal model tests to study the mechanisms and processes of overtopping-induced failure of landslide dams to overcome the problems in existing physical model tests and mathematical models. It intuitively showed various stages during a landslide dam breach and revealed its breach mechanisms. Furthermore, this study investigated the effects of dam height, slope ratio, and gradation of dam materials on the dam failure process by centrifugal model tests for the first time. In addition, a 3D detailed physically based numerical model was adopted to simulate the overtopping breach of landslide dams. The results of the numerical simulation test and the centrifugal model test were compared and analyzed. The conclusions are as follows.
(1) Based on the abrupt change in erosional characteristics and the breach morphological evolutionary process in the centrifugal model tests of overtopping-induced failure of landslide dams, the breach process can be divided into four stages: 1) initial scour on the downstream slope, 2) retrogressive erosion to the dammed lake, 3) erosion along the breach channel, and 4) breach stabilization. Further, a detailed description of the development in each stage was elucidated. However, it is worth noting that, for the centrifugal model tests, the water flow deflected to the right bank under the action of Coriolis force, which accelerated the transverse widening of the breach.
(2) Dam height, slope ratio, and gradation of dam materials greatly influence the overtopping-induced breaching of landslide dams. The peak breach flow is mainly influenced by the dam height, followed by the average particle size. Furthermore, the time to peak is most sensitive to the slope ratio, and the relative residual dam height is mainly affected by the average particle size. The internal physical and mechanical mechanisms of the influence of various factors on the dam breach process were analyzed.
(3) A detailed 3D physically-based numerical model was developed to simulate the overtopping-induced breach process of the landslide dam based on the RANS equations, and bedload and suspended load transport formula. The comparison between the calculated and measured results showed that the proposed model is consistent with the experimental observation data, with relative errors within ±10% for the key breaching parameters. Overall, this model can be used to simulate the overtopping breach process of landslide dams.
Data availability statement
The raw data supporting the conclusion of this article will be made available by the authors, without undue reservation.
Author contributions
LZ: writing—original draft, and analysis. QZ: supervision, methodology, and funding acquisition. MY: writing—original draft. MP: methodology and funding acquisition. JL: data processing. SM: calculation. ZY and YS: methodology and advise. All authors contributed to the article and approved the submitted version.
Funding
The authors greatly acknowledge the financial support from the National Natural Science Foundation of China (Grant Nos. U2040221 and U22A20602), the Open Fund of the Key Laboratory of Earth-rock Dam Failure Mechanism and Prevention and Control Technology of the Ministry of Water Resources (Grant No. YK321001), and the Fundamental Research Funds for Central Public Research Institutes (Grant No. Y320005).
Conflict of interest
The authors declare that the research was conducted in the absence of any commercial or financial relationships that could be construed as a potential conflict of interest.
Publisher’s note
All claims expressed in this article are solely those of the authors and do not necessarily represent those of their affiliated organizations, or those of the publisher, the editors and the reviewers. Any product that may be evaluated in this article, or claim that may be made by its manufacturer, is not guaranteed or endorsed by the publisher.
References
ASCE/EWRI Task Committee on Dam/Levee Breach (2011). Earthen embankment breaching. J. Hydraul. Eng. 137 (12), 1549–1564. doi:10.1061/(ASCE)HY.1943-7900.0000498
Cao, Z. X., Yue, Z. Y., and Pender, G. (2011). Landslide dam failure and flood hydraulics. Part II: Coupled mathematical modelling. Nat. Hazards 59 (2), 1021–1045. doi:10.1007/s11069-011-9815-7
Chang, D. S., and Zhang, L. M. (2010). Simulation of the erosion process of landslide dams due to overtopping considering variations in soil erodibility along depth. Nat. Hazards Earth Syst. Sci. 10 (4), 933–946. doi:10.5194/nhess-10-933-2010
Chang, D. S., Zhang, L. M., Xu, Y., and Huang, R. Q. (2011). Field testing of erodibility of two landslide dams triggered by the 12 May Wenchuan earthquake. Landslides 8 (3), 321–332. doi:10.1007/s10346-011-0256-x
Chen, Z. Y., Ma, L. Q., Yu, S., Chen, S. J., Zhou, X. B., Sun, P., et al. (2015). Back analysis of the draining process of the Tangjiashan barrier lake. J. Hydraul. Eng. 141 (4), 05014011. doi:10.1061/(ASCE)HY.1943-7900.0000965
Costa, J. E. (1985). Floods from dam failures. Washington D C, USA: U.S. Geological Survey. Open-File Report 85-560.
Costa, J. E., and Schuster, R. L. (1988). The formation and failure of natural dams. Geol. Soc. Am. Bull. 100 (7), 1054–1068. doi:10.1130/0016-7606(1988)100<1054:tfafon>2.3.co;2
Davies, T. R., Manville, V., Kunz, M., and Donadini, L. (2007). Modeling landslide dambreak flood magnitudes: Case study. J. Hydraul. Eng. 133 (7), 713–720. doi:10.1061/(asce)0733-9429(2007)133:7(713)
Evans, S. G. (1986). The maximum discharge of outburst floods caused by the breaching of man-made and natural dams. Can. Geotech. J. 23 (3), 385–387. doi:10.1139/t86-053
Fan, X. M., Scaringi, G., Korup, O., West, A. J., van Westen, C. J., Tanyas, H., et al. (2019). Earthquake-induced chains of geologic hazards: Patterns, mechanisms, and impacts. Rev. Geophys. 57 (2), 421–503. doi:10.1029/2018RG000626
Hermanns, R. L. (2013). “Landslide dam” in encyclopedia of natural hazards. Editor P. Bobrowsky (Berlin: Springer), 602–606.
Kocaman, S., Güzel, H., Evangelista, S., Ozmen-Cagatay, H., and Viccione, G. (2020). Experimental and numerical analysis of a dam-break flow through different contraction geometries of the channel. Water 12 (4), 1124. doi:10.3390/w12041124
Korup, O., and Tweed, F. (2007). Ice, moraine, and landslide dams in mountainous terrain. Quat. Sci. Rev. 26, 3406–3422. doi:10.1016/j.quascirev.2007.10.012
Lee, K. L., and Duncan, J. M. (1975). Landslide of 25 April, 1974 on the Mantaro River, Peru. Washington, DC: National Academy of Sciences, 72.
Li, J., Cao, Z. X., Cui, Y. F., Fan, X. M., Yang, W. J., Huang, W., et al. (2021). Hydro-sediment-morphodynamic processes of the baige landslide-induced barrier lake, Jinsha River, China. J. Hydrology 596, 126134. doi:10.1016/j.jhydrol.2021.126134
Liu, N., Chen, Z. Y., Zhang, J. X., Lin, W., Chen, W. Y., and Xu, W. J. (2010). Draining the Tangjiashan barrier lake. J. Hydraul. Eng. 136 (11), 914–923. doi:10.1061/(ASCE)HY.1943-7900.0000241
Liu, N., Yang, Q. G., and Chen, Z. Y. (2016). Hazard mitigation for barrier lakes. Wuhan, China: Changjiang Press. (in Chinese).
Mei, S. Y., Chen, S. S., Zhong, Q. M., and Shan, Y. B. (2022). Detailed numerical modeling for breach hydrograph and morphology evolution during landslide dam breaching. Landslides 19, 2925–2949. doi:10.1007/s10346-022-01952-1
Mei, S. Y., Chen, S. S., Zhong, Q. M., and Shan, Y. B. (2021). Effects of grain size distribution on landslide dam breaching-insights from recent cases in China. Front. Earth Sci. 9, 658578. doi:10.3389/feart.2021.658578
Niu, Z. P., Xu, W. L., Li, N. W., Xue, Y., and Chen, H. y. (2012). Experimental investigation of the failure of cascade landslide dams. J. Hydrodyn. 24 (3), 430–441. doi:10.1016/S1001-6058(11)60264-3
Peng, M., Ma, C. Y., Chen, H. X., Zhang, P., Zhang, L. M., Jiang, M. Z., et al. (2021). Experimental study on breaching mechanisms of landslide dams composed of different materials under surge waves. Eng. Geol. 291, 106242. doi:10.1016/j.enggeo.2021.106242
Peng, M., and Zhang, L. M. (2012). Breaching parameters of landslide dams. Landslides 9 (1), 13–31. doi:10.1007/s10346-011-0271-y
Shan, Y. B., Chen, S. S., Zhong, Q. M., Mei, S. Y., and Yang, M. (2022). Development of an empirical model for predicting peak breach flow of landslide dams considering material composition. Landslides 19 (6), 1491–1518. doi:10.1007/s10346-022-01863-1
Shen, D. Y., Shi, Z. M., Peng, M., Zhang, L. M., and Jiang, M. Z. (2020a). Longevity analysis of landslide dams. Landslides 17 (3), 1797–1821. doi:10.1007/s10346-020-01386-7
Shen, G. Z., Sheng, J. B., Xiang, Y., Zhong, Q. M., and Yang, D. W. (2020b). Numerical modeling of overtopping-induced breach of landslide dams. Nat. Hazards Rev. 21 (2), 04020002. doi:10.1061/(ASCE)NH.1527-6996.0000362
Wahl, T. L. (1998). Prediction of embankment dam breach parameters: A literature review and needs assessment. Denver, USA: U. S. Dept. of the Interior. Dam Safety Rep. No. DSO-98-004Bureau of Reclamation.
Walder, J. S., and O’Connor, J. E. (1997). Methods for predicting peak discharge of floods caused by failure of natural and constructed earthen dams. Water Resour. Res. 33 (10), 2337–2348. doi:10.1029/97WR01616
Yang, Y., Cao, S. Y., Yang, K. J., and Li, W. P. (2015). Experimental study of breach process of landslide dams by overtopping and its initiation mechanisms. J. Hydrodyn. 27 (6), 872–883. doi:10.1016/S1001-6058(15)60550-9
Zheng, H. C., Shi, Z. M., Shen, D. Y., Peng, M., Hanley, K. J., Ma, C. Y., et al. (2021). Recent advances in stability and failure mechanisms of landslide dams. Front. Earth Sci. 9, 659935. doi:10.3389/feart.2021.659935
Zhong, Q. M., Chen, S. S., Mei, S. A., and Cao, W. (2018). Numerical simulation of landslide dam breaching due to overtopping. Landslides 15 (6), 1183–1192. doi:10.1007/s10346-017-0935-3
Zhong, Q. M., Wang, L., Chen, S. S., Chen, Z. Y., Shan, Y. B., Zhang, Q., et al. (2021). Breaches of embankment and landslide dams-State of the art review. Earth-Science Rev. 216, 103597. doi:10.1016/j.earscirev.2021.103597
Zhong, Q. M., Wu, W. M., Chen, S. S., and Wang, M. (2016). Comparison of simplified physically based dam breach models. Nat. Hazards 84 (2), 1385–1418. doi:10.1007/s11069-016-2492-9
Zhou, G. G. D., Zhou, M., Shrestha, M. S., Song, D., Choi, C. E., Cui, K. F. E., et al. (2019). Experimental investigation on the longitudinal evolution of landslide dam breaching and outburst floods. Geomorphology 334, 29–43. doi:10.1016/j.geomorph.2019.02.035
Zhou, G. G., Li, S., Lu, X., and Tang, H. (2022). Large-scale landslide dam breach experiments: Overtopping and “overtopping and seepage” failures. Eng. Geol. 304, 106680. doi:10.1016/j.enggeo.2022.106680
Keywords: landslide dam, overtopping, breach process, breach mechanism, centrifugal model test, numerical simulation
Citation: Zhang L, Zhong Q, Yang M, Peng M, Liu J, Mei S, Yan Z and Shan Y (2023) Centrifugal model tests and numerical modeling on overtopping-induced breach processes of landslide dams. Front. Earth Sci. 10:1062981. doi: 10.3389/feart.2022.1062981
Received: 06 October 2022; Accepted: 23 November 2022;
Published: 19 January 2023.
Edited by:
Biswajeet Pradhan, University of Technology Sydney, AustraliaReviewed by:
Li Wang, China Three Gorges University, ChinaKun He, Southwest Jiaotong University, China
Copyright © 2023 Zhang, Zhong, Yang, Peng, Liu, Mei, Yan and Shan. This is an open-access article distributed under the terms of the Creative Commons Attribution License (CC BY). The use, distribution or reproduction in other forums is permitted, provided the original author(s) and the copyright owner(s) are credited and that the original publication in this journal is cited, in accordance with accepted academic practice. No use, distribution or reproduction is permitted which does not comply with these terms.
*Correspondence: Qiming Zhong, cW16aG9uZ0BuaHJpLmNu