 Meibao Chen1
 Xiaofei Jing
 Xiaohua Liu
- 1Chongqing Safety Science and Technology Co., Ltd., Chongqing University of Science and Technology, Chongqing, China
- 2School of Safety Engineering, Chongqing University of Science and Technology, Chongqing, China
- 3Chongqing 107 Municipal Construction Engineering Co., Ltd., Chongqing, China
- 4School of Civil Engineering, Shaoxing University, Shaoxing, China
Overtopping dam break is a frequent accident in tailings reservoirs. However, little attention has been paid to the study of overtopping hydraulic erosion damage characteristics of tailings dam after adding reinforcement. Nowadays, there were few people have researched the prediction of the overtopping failure process of the reinforced tailings dam. It is important significance to establish a prediction model for the overtopping of reinforced tailings dam which aims at the problem of overtopping erosion of reinforced tailings. For the anti-erosion and anti-collapse effects of the reinforced tailings dam, a mathematical model for the development of the overtopping breach of the reinforced tailings dam is established. The formula of reinforced erosion rate derived from water flow shear stress theory, simulation of breach erosion development by time iteration method in the mathematical model. Secondly, the limit equilibrium method is used to analyze the stability of the reinforced breach slope. Then, the physical test is used to reproduce the dam failure process of the tailings dam. In addition, the development process of the breach and discharge are monitored. Ultimately, the maximum depth and width of the breach are in brilliant agreement with the calculated values.
1 Introduction
The failure of the tailings dam poses a threat to the safety of downstream residents and the natural environment, making it a crucial topic of research for the prevention of accidents involving tailings dam (Sun et al., 2012; Clarkson et al., 2021). Numerous variables impact geotechnical properties, resulting in tailings dam failure (Li et al., 2022). The following failure modes have been identified for tailings dam reservoirs: foundation destruction (Psarropoulos et al., 2008; Meng et al., 2021), pipe surge (Van Niekerk et al., 2005), overtopping failure (Zhang et al., 2016), seepage (Mittal, 1976; Lottermoser et al., 2005), earthquake (Villavicencio et al., 2014; Agurto-Detzel et al., 2015), and slope instability (Silva et al., 2008). In 2000, strong rains and snowmelt caused the tailings dam at the Baiaborsa gold mine in Romania to burst, discharging 100,000 m³ of tailings into Tisa River tributaries, causing aquatic heavy metal toxicity and broad ecological degradation (Michnea et al., 2001). The Fundo dam failure in Brazil was severe, with 806 buildings in 10 districts of five cities directly affected by tailings, along with 21.1 km of country roads, 12 bridges, and a minor hydroelectric facility. The tailings clog the Doce River downstream, spreading 548 km to the Atlantic Ocean, impacting forty communities downstream, and denying hundreds of thousands of people access to clean water (Carmo et al., 2017).
In the 1960’s, European and American researchers began studying the overtopping failure prediction model, which was based on the overtopping failure mechanism and utilized hydraulics and sediment transport theory. This model was a rather complex mathematical model for overtopping failure with speedy computation features. Cristofano (1973) developed the first mathematical model of homogeneous dam overtopping based on sediment erosion in 1965. Later, researchers presented a set of mathematical models to simulate dam overtopping. Fread (1981) developed the NWS BREACH model considering the collapse effect. At present, this kind of model is also applied in the tailings reservoir. Wu and Qin (2018) used the proposed river embankment stability analysis method in the simplified overtopping failure model. Petkovek et al. (2021) proposed that tailings slurry exhibits a stratification phenomenon, whereby the upper layer is the flow, the lower layer is the tailings bed load, and the erosion of tailings slurry is distinct from that of clear water. Consequently, this double-layer fluid erosion model was utilized to incorporate and modify the DAMBRK (Mohamed et al., 2002) overtopping failure model, and a new calculation model of tailings overtopping failure was developed. This model uses different flow calculation formulas and erosion formulas to simulate the erosion of dam materials by assuming the shape of the breach, as well as other simulation methods to analyze the longitudinal undercutting and lateral expansion of the breach.
The majority of prediction models simulate the overtopping failure process using the numerical calculation methodology of time step iteration, which can provide the overtopping failure parameters for each time step (such as flow rate, size, reservoir water level, etc.). In recent years, with the improvement of computer performance and the advancement of sedimentology and computational fluid dynamics, there have been a number of exemplary calculation models (Kesserwani et al., 2014; Abderrezzak et al., 2015; Marsooli et al., 2015; Cantero-Chinchilla et al., 2016; Di Cristo et al., 2018), which were based on the continuous flow equation, momentum equation and energy equation, coupled with the process of sediment motion equation. The governing equations were resolved using finite volume and other numerical simulation techniques. This model was capable of producing an accurate simulation of the overtopping failure process. The model introduced above has the advantage of quick analysis and wide applicability.
The selected tailings particles become finer and finer as mineral processing technology advances, and the secondary reinforcement belt is widely used in fine-grained tailings as a reinforcement material. This resulted in an increase in the storage height of fine-grained tailings dams and a steady rise in the number of reinforced high-pile fine-grained tailings dams. However, most overtopping failure prediction models do not consider the influence of the reinforcement belt, resulting in the inaccurate prediction of the consequences of the overtopping failure disaster and unnecessary economic losses (Jing et al., 2019). Therefore, based on the mechanism of overtopping failure, the prediction model of overtopping breach development of reinforced tailings is established, which provides particular guiding significance for the risk prediction of overtopping failure of reinforced tailings.
2 Prediction model of overtopping burst development of reinforced tailings dam
It was found in the overtopping dam failure test of reinforced fine-grained tailings that the reinforcement belt has a significant positive effect on the collapse constraints on both sides, a contributor to a smaller degree of collapse, and the reinforcement can improve the anti-erosion effect of tailings. Therefore, with reference to the improved water flow model of Chen et al. (2015, 2019), the reinforced erosion rate, start-up conditions, and reinforced slope stability calculation are introduced to establish the reinforced fine-grained tailings dam burst development prediction model.
2.1 Water flow model
The hydraulic characteristics of the dam crest cross-section of the gully are similar to the broad crest weir flow after the flow overtopping. Therefore, the burst of the cross-section of the dam crest can be regarded as the broad-crested weir section, and the overflow flow from the dam crest can be calculated by the broad-crested weir formula (Chen et al., 2019). The formula is as follows:
Fread et al. (1981) considered the flow at the burst to be uniform and constant, with a water depth of h after the flow passes through the dam crest burst; Chen et al. (2015) adopted a simplified treatment scheme, assuming a drop coefficient m to calculate the water depth of the burst, the m is 0.6–0.8, as follows:
The instantaneous flow velocity V of the burst section can be determined by:
Among them, through parameter sensitivity analysis, the m impact on the peak flow rate is small, and the assumed drop coefficient of 0.8–0.6 empirical value can be used to simplify the model calculation.
2.2 Reinforced erosion models
The incorporation of reinforcement can effectively enhance the mechanical occlusion between the tailings particles, thereby enhancing the anti-erosion performance of tailings and increasing their water shear strength. Chen et al. (2021) carried out the erosion test of reinforced tailings. The test results show that the addition of reinforcement can enhance the erosion resistance of particles, but with the increase of the spacing of reinforcement, the critical velocity of tailings erosion decreases, and the erosion rate will gradually increase. Since the conventional non-reinforced erosion equation can no longer reasonably show the erosion results. Referring to other overtopping dam burst development prediction models, assuming that the overall erosion resistance of the burst at the top of the tailings dam is the same, the erosion equation summarized by the tailings erosion test with different reinforcement spacing is adopted. The equation is as follows:
The resulting critical start rate
Among them,
When the water flow velocity is greater
In the stop condition of dam burst erosion, one part adopts a time setting to calculate the rock stratum at the bottom of the dam, and the other part adopts a particle starting condition. When the water flow shear force is less than the particle starting shear force, the erosion stops. Due to the large capacity of the dam, the dam body is easy to erode the rock layer at the bottom of the dam, which can be calculated by setting time. However, for the small capacity of the dam, it is easy to produce incomplete dam break and not easy to erode to the bottom of the dam. The preset fixed time is not practical, so the shear force starting method is more suitable. When the water flow rate is less than
2.3 Reinforced fender lateral extension model
With the continuous scour of the water flow, high-risk slopes are formed on both sides of the burst, and it is known from the test that the lateral expansion of the burst is largely from the burst collapse. The behavior of burst collapse has certain randomness, and it is difficult to express the collapse behavior through pure empirical formula. Zhong et al. (2016) and Singh et al. (1988) used the wedge analysis method to simulate the lateral expansion of the burst caused by the sudden collapse of the bank slope. However, it is found through experiments that the reinforcement belt can curb the collapse of the bank slopes on both sides of the burst. Therefore, in order to describe the lateral expansion of the burst of the reinforced tailings overtopping dam, based on the limit equilibrium method, the lateral expansion model of the reinforced burst is established as shown in Figures 1, 2. When the erosion of the burst does not develop to the reinforcement belt, the limit equilibrium calculation is adopted, and the tension of the reinforcement belt is added on this basis.
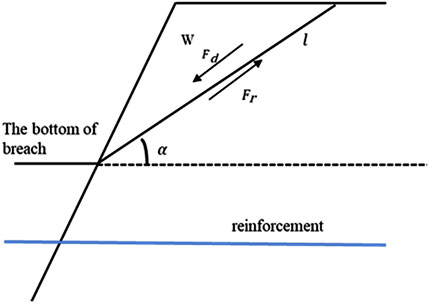
FIGURE 1. Schematic diagram of reinforcement not yet eroded.
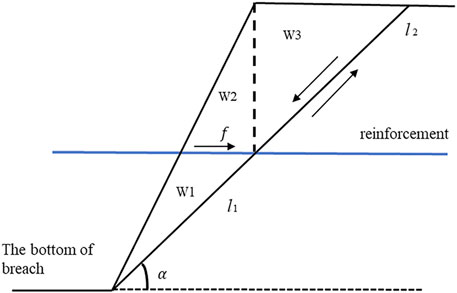
FIGURE 2. Schematic diagram of erosion to reinforcement.
The pressure on the reinforced overtopping slope is analyzed and deformed by limit balance, and the safety factor obtained is:
The distance of the dam is x, if it has not eroded into the reinforcement:
Erosion to a layer of reinforcement:
Further erosion, then:
N takes the integer.
2.4 Calculation process
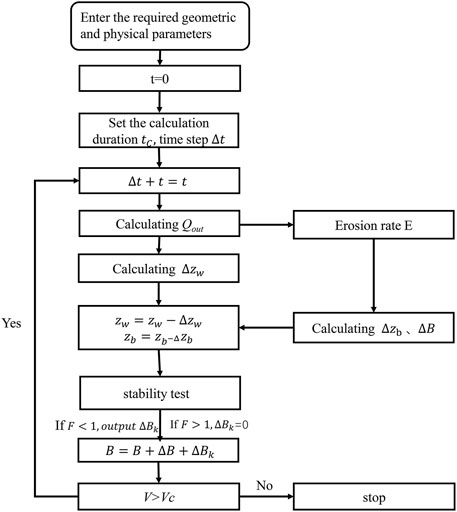
FIGURE 3. Calculation flow chart.
3 Model validation
Due to further verify the reliability of the model, the above theory is verified by physical experiments (Coleman et al., 2002; Hanson et al., 2013). Cause the overtopping accident of tailings dam has certain suddenness and high risk, there are few field observation data, and reinforced overtopping cases are scarce. As a result that the overtopping test of the reinforced tailings dam is carried out to obtain the depth, width, and discharge flow of the breach, which is compared with the model calculation results.
3.1 Physical model experiment
3.1.1 Test scheme
The test material is red mud, taken from a red mud tailings dam in Chongqing, which is a fine-grained tailing. The fundamental properties of fine-grained tailings were examined independently by following the “Geotechnical Test Method Standard” (GB/T50123-2019, the Natural Standard of China). The physical properties of the tailings material were measured as follows: in-situ moisture content at 23% and dry density at 1.61 g/cm3. The particle size distribution of fine-grained tailings is shown in Figure 4. The test water supply is tap water for Chongqing city, China.
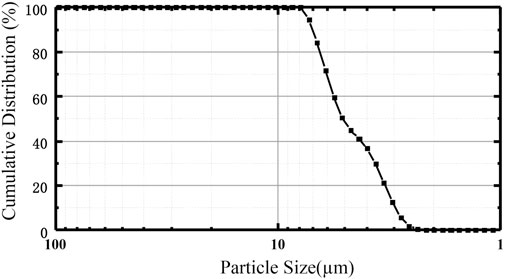
FIGURE 4. The particle size distribution of fine-grained tailings.
The experimental equipment adopts the self-made overtopping dam break system of the tailings dam, which is composed of a test tank, water supply system, and monitoring system. The test tank is used to store the tailings dam model and is the test site for physical model stacking and molding. The second water injection system is mainly composed of a water storage system, water pump, frequency converter, and water supply pipeline, which is used to simulate the upstream confluence flow of the tailings dam. The water storage system is composed of a glass transparent water tank as the water supply tank. The water pump is connected to the frequency converter, and the speed of the water pump is controlled by adjusting the frequency of the frequency converter to achieve the purpose of controlling the flow rate. Finally, the water supply pipeline is connected to the dam of the pump and the tailings dam model, and the confluence in the dam is simulated by the pipeline injection flow. During this process, the water supply pool remains filled to prevent the water pressure change of the water supply pool from affecting the pump. The recording camera (provided by SONY in settings of the resolution of 1,920 × 1,080 and 50 frames per second, Beijing city, the People’s Republic of China) was selected as the visual recording equipment for this dam damage monitoring system (DDMS). The vertical and horizontal dimensions of the modeled tailing dam with specific locations of pre-embedded reinforcements in geogrid are schematically depicted in Figure 5.
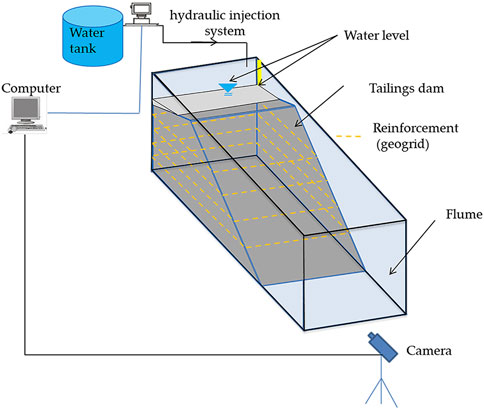
FIGURE 5. Tailing dam overtopping failure test system (TDOFTS).
The slope monitoring of the tailings dam is used to monitor the change of gully caused by overtopping overflow and record the whole process of overtopping dam break. The breach change monitoring is to measure the breach change of the dam section, which is measured by inserting the vertical steel wire into the gully surface, and the length of the measured steel wire is the gully depth. The size of the test model is length × width × height (260 cm × 60 cm × 140 cm), and reinforcement spacing is 30 cm, as shown in Figure 6.
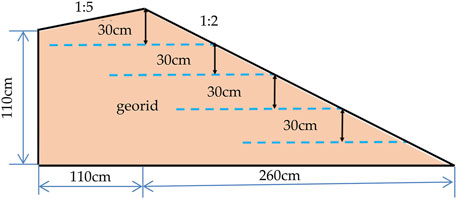
FIGURE 6. The schematic diagram of the geogrid.
3.1.2 Procedure of test
1. The original tailings are crushed into powder by a crusher, and the water content is 20% according to the “Geotechnical Test Method Standard” (GB/T50123-2019, the Natural Standard of China), and the polyethylene film is sealed and treated for 24 h leading to the water content of the material is evenly distributed.
2. Tailings dam model length × width × height: 260 cm × 60 cm × 140 cm, in the stacking model using the layered compaction method, the use of compaction hammer layered compaction, in order to ensure that the degree of compaction is more uniform, in the soil above the board to make the compaction force uniform. After each layer of compaction is completed should also be for the surface of the roughening, to prevent the model stratification.
3. In the process of piling up, according to the designed test scheme, the reinforcement belt is laid horizontally inside the tailings dam. The method of laying the reinforcement belt is as follows: First, the compacted soil is cut in with a ring knife, and the mass of the ring knife is weighed after it is taken out. If the mass is close, it is subjected to roughening treatment, and then the reinforcement belt is placed horizontally. After the reinforcement belt is laid, a thin layer of soil is added to the upper layer of the reinforcement belt, and then compaction and roughening are performed to prevent the influence of stratification.
4. After the completion of the heap, set the water level mark in the reservoir, and install the high-resolution camera, respectively, to monitor and record the water level changes and the erosion process of the tailings dam surface.
5. After the installation and commissioning of the monitoring equipment are completed, it is assumed that the drainage system in the reservoir fails, and the water injection system is opened to inject water into the reservoir.
6. After the end of the test, repeat the above operation for the next set of tests.
As shown in Figure 7, after the water flow overflows the dam crest, a rectangular-like erosion surface is formed on the slope, and then a breach is formed, and the downstream erosion surface gradually increases in a fan shape. As the water flow continues to scour, the breach gradually develops, forming gullies in the upper and lower reaches until the water flow no longer erodes and the breach no longer develops, it is considered that the overtopping failure is over.

FIGURE 7. The overtopping process of reinforced tailings. (A) Overflow of water; (B) Formation of breaches; (C) Formation of gullies; (D) Development of gullies; (E) Stabilization of dam bodies.
According to the results of the overtopping test of reinforced tailings in each group, the test results did not cause erosion to the dam foundation, which was an incomplete dam break. This was because the water capacity in the tailings dam was small, and no erosion occurred after scouring to a certain position, that is, the overtopping stopped. According to the test phenomenon, the overtopping dam-break process of tailings under the condition of reinforcement-soil-water coupling is divided into five stages: water overflow stage, breach formation stage, gully formation stage, breach development stage, and dam stability stage. In the water overflow stage, the water injection system continues to inject water into the reservoir, resulting in a continuous rise in the water level. When the water level in the reservoir is higher than the dam crest, the water flow will begin to overflow from the dam crest. The water flow scours downstream along the dam’s surface. At this stage, the scour surface of each group of tests is basically close to a long strip, and no strong erosion damage is carried out.
3.2 Model validation
The input test parameters are shown below in Tables 1, 2, 3.

TABLE 1. Tailings reservoir characteristic parameter setting table.

TABLE 2. Hydraulic parameter setting table.

TABLE 3. Tailings parameter setting table.
Using Python scientific calculation, through time iteration calculation, the flow calculation is shown in Figure 8. The curve first indicates a rapid increase trend and then slowly decreases. When the analysis collapses, the flow rate increases instantaneously and then decreases rapidly, and finally tends to be flat and close to the inflow flow. The overall trend is similar to the test flow trend.
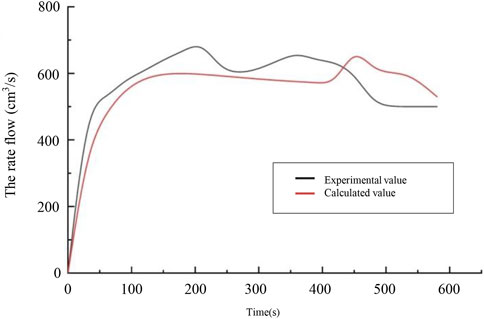
FIGURE 8. Comparison of flow rate.
Calculated the final width of the diffuse roof breach dam is 20.52 cm, the last breach depth is 38 cm, and the maximum peak flow rate is 0.00078 m³/s. As shown in Table 4, the maximum breach depth and width calculation are more consistent, and the error is 5.5% and 1.75%, respectively, and the calculated peak discharge flow rate and the test value error are 18%.
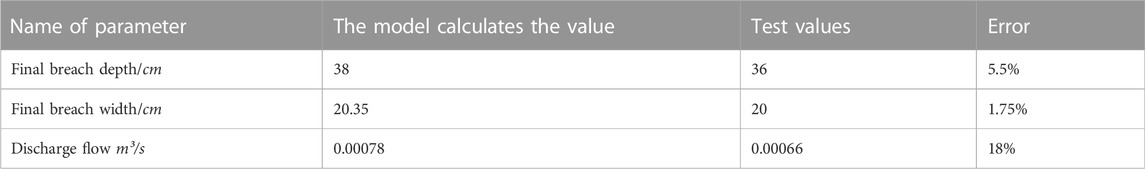
TABLE 4. Comparison of calculated values.
The computational model fits well with the experimental values, but the discharge flow error is significant. The model assumption regards the reinforced tailings dam as a uniform whole, ignoring the blocking movement of the reinforcement belt and the water flow, which needs further improvement.
4 Conclusion
The findings of this paper provided insights for the overtopping erosion of the reinforced fine-grained tailings dam overtopping failure. A prediction model for reinforced tailings breach development was established by inserting the erosion model derived from the reinforced tailings erosion test and the reinforced slope stability analysis. The erosion rate, breach depth, and width could all be predicted using the created formulas. The research presented in this paper resulted in the following findings:
1. The mathematical model of the breach development predicting of the reinforced fine-grained tailings dam overtopping is established. In the model, the formula of supported erosion rate is obtained by using the principle of water flow shear stress, the development of breach erosion is simulated by the time iterative calculation method, and the stability of reinforced breach slope is analyzed by the limit equilibrium method.
2. A physical model is established to simulate the breach development process of the reinforced tailings dam, and the final breach depth, width, and discharge flow are obtained. Comparing the data measured by the reinforced tailings physical model test with the calculated values by the mathematical model, the depth and width errors are 5.5% and 1.75% respectively, and the calculated peak discharge flow rate and the test value error are 18%. The mathematical model had a good prediction effect on the evolution of the breach.
3. The model still has significant uncertainty, and it is essential to consider the heterogeneity of dam materials. There is an urgent need for field cases to verify the existing models further.
Data availability statement
The original contributions presented in the study are included in the article/Supplementary Material, further inquiries can be directed to the corresponding author.
Author contributions
Conceptualization, MC and XL; methodology, XJ and XL; validation, MC; supervision, MC; writing—original draft preparation, XJ and DX; writing—review and editing, YZ, XL, and DX.
Funding
This research is funded by the National Natural Science Foundation of China (No. 51974051), China Occupational Safety and Health Association (CXCY-2021-19), the Self-made Equipment Foundation of Chongqing University of Science and Technology (No. ZZSB2019013), the Graduate Innovation Program Project of Chongqing University of Science and Technology (Grants No. YKJCX2120702, YKJCX2120719, and YKJCX2120721).
Conflict of interest
Author MC was employed by the company Chongqing Safety Science and Technology Co., Ltd., and Author DX was employed by the company Chongqing 107 Municipal Construction Engineering Co., Ltd.
The remaining authors declare that the research was conducted in the absence of any commercial or financial relationships that could be construed as a potential conflict of interest.
Publisher’s note
All claims expressed in this article are solely those of the authors and do not necessarily represent those of their affiliated organizations, or those of the publisher, the editors and the reviewers. Any product that may be evaluated in this article, or claim that may be made by its manufacturer, is not guaranteed or endorsed by the publisher.
References
Abderrezzak, K. E. K., Moran, A. D., Tassi, P., Ata, R., and Hervouet, J. M. (2016). Modelling river bank erosion using a 2D depth-averaged numerical model of flow and non-cohesive, non-uniform sediment transport. Adv. Water Resour. 93, 75–88. doi:10.1016/j.advwatres.2015.11.004
Agurto-Detzel, H., Bianchi, M., Assumpção, M., Schimmel, M., Collaco, B., Ciardelli, C., et al. (2016). The tailings dam failure of 5 November 2015 in SE Brazil and its preceding seismic sequence. Geophys. Res. Lett. 43 (10), 4929–4936. doi:10.1002/2016gl069257
Cantero-Chinchilla, F. N., Castro-Orgaz, O., Dey, S., and Ayuso-Muñoz, J. L. (2016). Nonhydrostatic dam break flows. II: One-dimensional depth-averaged modeling for movable bed flows. J. Hydraul. Eng. 142 (12), 04016069. doi:10.1061/(asce)hy.1943-7900.0001206
Carmo, F. F. D., Kamino, L. H. Y., Junior, R. T., de Campos, I. C., do Carmo, F. F., Silvino, G., et al. (2017). Fundão tailings dam failures: The environment tragedy of the largest technological disaster of Brazilian mining in global context. Perspect. Ecol. Conserv. 15, 145–151. doi:10.1016/j.pecon.2017.06.002
Chen, X., Jing, X., Cai, H., Wang, Y., and Ye, L. (2021). Hydraulic erosion rate of reinforced tailings: Laboratory investigation and prediction model. Adv. Mater. Sci. Eng. 2021, 1–13. doi:10.1155/2021/8764862
Chen, Z. Y., Chen, S., Wang, L., and Zhang, Q. (2019). Analysis of Earth-rock dam break flood: Theory and calculation program. Hydro Sci. Cold Zone Eng. 2 (2), 12–19.
Chen, Z. Y., Ma, L., Yu, S., Chen, S., Zhou, X., Sun, P., et al. (2015). Back analysis of the draining process of the Tangjiashan barrier lake. J. Hydraul. Eng. 141, 05014011. doi:10.1061/(asce)hy.1943-7900.0000965
Clarkson, L., and Williams, D. (2021). An overview of conventional tailings dam geotechnical failure mechanisms. Min. Metallurgy Explor. 38 (3), 1305–1328. doi:10.1007/s42461-021-00381-3
Coleman, S. E., Andrews, D. P., and Webby, M. G. (2002). Overtopping breaching of non-cohesive homogeneous embankments. J. Hydraul. Eng. 128 (9), 829–838. doi:10.1061/(asce)0733-9429(2002)128:9(829)
Cristofano, E. A. (1973). Method of computing erosion rate for failure of earthfill dams. Denver: US Department of the Interior, Bureau of Reclamation, Engineering and Research Center.
Di Cristo, C., Evangelista, S., Greco, M., Iervolino, M., Leopardi, A., and Vacca, A. (2018). Dam-break waves over an erodible embankment: Experiments and simulations. J. Hydraulic Res. 56 (2), 196–210. doi:10.1080/00221686.2017.1313322
Fread, D. L. (1981). The NWS simplified dam-break flood forecasting model. Silver Spring, Maryland: National Weather Service, 164–197.
Hanson, G. J., Cook, K. R., and Hunt, S. L. (2005). Physical modeling of overtopping erosion and breach formation of cohesive embankments. Trans. ASAE 48 (5), 1783–1794. doi:10.13031/2013.20012
Jing, X. F., Chen, Y. L., Williams, D. J., Serna, M. L., and Zheng, H. (2019). Overtopping failure of a reinforced tailings dam: Laboratory investigation and forecasting model of dam failure. Water 11, 315. doi:10.3390/w11020315
Kesserwani, G., Shamkhalchian, A., and Zadeh, M. J. (2014). Fully coupled discontinuous Galerkin modeling of dam-break flows over movable bed with sediment transport. J. Hydraul. Eng. 140 (4). doi:10.1061/(asce)hy.1943-7900.0000860
Li, X. S., Peng, J., Xie, Y. L., Li, Q., Zhou, T., Wang, J., et al. (2022). Influence of high-temperature treatment on strength and failure behaviors of a quartz-rich sandstone under true triaxial condition. Lithosphere 2022, 3086647. doi:10.2113/2022/3086647
Lottermoser, B. G., and Ashley, P. M. (2005). Tailings dam seepage at the rehabilitated Mary Kathleen uranium mine, Australia. J. Geochem. Explor. 85 (3), 119–137. doi:10.1016/j.gexplo.2005.01.001
Marsooli, R., and Wu, W. (2015). Three-dimensional numerical modeling of dam-break flows with sediment transport over movable beds. J. Hydraul. Eng. 10, 1061. doi:10.1061/(asce)hy.1943-7900.0000947
Meng, Q. X., Wang, J., Tao, Z., Ren, D., Zhang, G., Li, X., et al. (2021). 3D nonlinear analysis of stilling basin in complex fractured dam foundation. Lithosphere 2021, 2738130. doi:10.2113/2022/2738130
Michnea, A., and Gherhes, I. (2001). Impact of metals on the environment due to technical accident at Aurul Baia Mare, Romania. Int. J. Occup. Med. Environ. Health 14 (3), 255–259.
Mittal, H. K., and Morgenstern, N. R. (1976). Seepage control in tailings dams. Can. Geotech. J. 13 (3), 277–293. doi:10.1139/t76-030
Mohamed, M. A., Samuels, P. G., Morris, M. W., and Ghataora, G. S. (2002). Improving the accuracy of prediction of breach formation through embankment dams and flood embankments. Proceedings of the River Flow 2002 - International Conference on Fluvial Hydraulics September 2002, Ottignies-Louvain-la-Neuve, Belgium.
Petkovšek, G., Hassan, M. A. A. M., Lumbroso, D., and Roca Collell, M. (2021). A two-fluid simulation of tailings dam breaching. Mine Water Environ. 40 (1), 151–165. doi:10.1007/s10230-020-00717-3
Psarropoulos, P. N., and Tsompanakis, Y. (2008). Stability of tailings dams under static and seismic loading. Can. Geotech. J. 45 (5), 663–675. doi:10.1139/t08-014
Silva, F., Lambe, T. W., and Marr, W. A. (2008). Probability and risk of slope failure. J. Geotech. Geoenviron. Eng. 34 (12), 1691–1699. doi:10.1061/(asce)1090-0241(2008)134:12(1691)
Singh, V. P., Scarlatos, P. D., Collins, J. G., and Jourdan, M. R. (1988). Breach erosion of Earth fill dams (BEED) model. Nat. Hazards (Dordr). 1 (2), 161–180. doi:10.1007/bf00126613
Sun, E. J., Zhang, X. K., Li, Z. X., and Wang, Y. H. (2012). Tailings dam flood overtopping failure evolution pattern. Procedia Eng. 28, 356–362. doi:10.1016/j.proeng.2012.01.733
Van Niekerk, H. J., and Viljoen, M. J. (2005). Causes and consequences of the Merriespruit and other tailings-dam failures. Land Degrad. Dev. 16 (2), 201–212. doi:10.1002/ldr.681
Villavicencio, G., Espinace, R., Palma, J., Fourie, A., and Valenzuela, P. (2014). Failures of sand tailings dams in a highly seismic country. Can. Geotech. J. 51 (4), 449–464. doi:10.1139/cgj-2013-0142
Wu, T., and Qin, J. (2018). Experimental study of a tailings impoundment dam failure due to overtopping. Mine Water Environ. 37 (2), 272–280. doi:10.1007/s10230-018-0529-x
Zhang, L., Peng, M., Chang, D., and Xu, Y. (2016). Dam failure mechanism sand risk assessment. 1st. Singapore: John Wiley & Sons.
Keywords: reinforced tailings dam, overtopping failure, erosion, prediction model, model experiment
Citation: Chen M, Jing X, Xie D, Li X, Zhang Y and Liu X (2023) Prediction model investigations of the reinforced fine-grained tailings dam overtopping failure. Front. Earth Sci. 10:1075588. doi: 10.3389/feart.2022.1075588
Received: 20 October 2022; Accepted: 02 December 2022;
Published: 30 January 2023.
Edited by:
Lijie Guo, Beijing Mining and Metallurgy Technology Group Co., Ltd., ChinaReviewed by:
Guangjin Wang, Kunming University of Science and Technology, ChinaZhihong Zhang, Beijing University of Technology, China
Copyright © 2023 Chen, Jing, Xie, Li, Zhang and Liu. This is an open-access article distributed under the terms of the Creative Commons Attribution License (CC BY). The use, distribution or reproduction in other forums is permitted, provided the original author(s) and the copyright owner(s) are credited and that the original publication in this journal is cited, in accordance with accepted academic practice. No use, distribution or reproduction is permitted which does not comply with these terms.
*Correspondence: Xiaofei Jing, eGZqaW5nQGNxdXN0LmVkdS5jbg==