 Wubamlak Nigussie1*
 Kevin Mickus2
 Derek Keir3,4
 Abera Alemu5
 Yoseph Muhabaw1
 Ameha A. Muluneh5,6
 Esubalew Yehualaw7
 Zelalem Demissie8
- 1School of Earth Sciences, Bahir Dar University, Bahir Dar, Ethiopia
- 2Department of Geosciences, Missouri State University, Springfield, MO, United States
- 3School of Ocean and Earth Science, University of Southampton, Southampton, United Kingdom
- 4Dipartimento di Scienze della Terra, Università degli Studi di Firenze, Firenze, Italy
- 5School of Earth Sciences, Addis Ababa University, Addis Ababa, Ethiopia
- 6Helmholtz Centre Potsdam, GFZ German Research Centre for Geosciences, Potsdam, Germany
- 7Department of Petroleum and Geothermal Energy, Ethiopian Ministry of Mines, Addis Ababa, Ethiopia
- 8Department of Geology, Wichita State University, Wichita, KS, United States
In magma-rich continental rifts, extension is commonly localized as dike injection in discrete magmatic segments which appear from surface geology to mimic the along-axis segmentation of ocean ridges. However, the subsurface morphology of these zones of localized magma injection is unclear, and whether and at what depth range they remain with discrete subvolcanic plumbing systems is not fully understood. In addition, the relationship between zones of magma injection and tectonic faulting is also debated. The Main Ethiopian Rift (MER) provides a unique opportunity to examine the spatial scale, locus, and subsurface geometries of magmatic localization in active continental rifts. We examined spatial variations in the structure of the crust in the MER using gravity data to better understand the subsurface pattern of magma injection. Results of our study reveal discrete Bouguer gravity highs in the centers of the distinct right-stepping magmatic segments of the MER (Aluto, Gedemsa, and Boseti), and interpreted as the locus of mafic intrusions. The gravity data show that the boundary between each magmatic segment is observed down to depths of ∼20 km, suggesting that magmatic segments have discrete subvolcanic plumbing systems at least down to the mid-crust. Additionally, incorporating the fault network shows that the densest faulting occurs at the tips of the zones of densest magma injection shown by Bouguer gravity highs. This is similar to the axial segmentation observed at slow and ultra-slow spreading ridges and suggests strong along-axis variations in deformation mechanism, with magma injection accommodating extension at the segment centers and faulting dominating towards the segment ends. In addition, rift margin volcanic zones (Siltie Debrezeit, Yerer Tulu, and Galema) are also inferred from bandpass gravity anomaly maps, supported by petrologic evidence, which implies that extension by dike injection has also occurred near the rift flanks.
1 Introduction
During continental rifting, extension is generally thought to initiate on rift border faults in the brittle crust, and ductile stretching and thinning in the lower crust and mantle lithosphere (McKenzie 1978; Hayward and Ebinger, 1996). As extension increases through time, extension commonly focuses into the rift due to several processes such as strain softening, and lithosphere heating and thinning (Hayward and Ebinger, 1996; Corti, 2009). In magma-rich rifts, the within-rift strain localization can also occur by magma intrusion, with diking being an efficient and effective way of accommodating extension (Ebinger and Casey, 2001; Wright et al., 2016). The magma intrusion commonly localizes to ∼50–100 km long, tens of kilometer-wide magmatic segments with surface volcanic and fault morphology that mimics the segments of mid-ocean ridges (Ebinger and Casey, 2001; Acocella, 2014). As such the magmatic segments in magma-rich continental rifts are potentially thought to persist through a continental breakup and define the along-axis segmentation of the subsequent ocean ridge (Ebinger and Casey, 2001). However, the subsurface manifestation of magmatic segments in continental rifts is poorly understood and therefore it remains debated how magmatism varies along rift and to what depth in the lithosphere they have discrete plumbing systems.
The East Africa Rift System (EARS) is the Earth’s longest continental divergent plate boundary and forms the Afar triple junction together with the two ocean ridges in the Red Sea and Gulf of Aden (Ebinger, 2005). The northern end of this newly formed tectonic boundary, the Main Ethiopian Rift (MER), is an ideal natural laboratory to study the ongoing process of continental breakup in an advanced stage of evolution (Ebinger and Casey, 2001; Wolfenden, et al., 2004; Kurz et al., 2007). The rift is flanked by ∼60 km-long, NE-striking Miocene age border faults that separate the rift floor from the adjacent plateaus (Corti, 2009). Geological records show that strain has subsequently shifted in the rift since the Quaternary and has been localized to a series of right stepping en echelon magmatic segments (Ebinger and Casey, 2001; Casey et al., 2006). The surface morphology of the magmatic segments is dominated by Quaternary to Recent volcanic centers, NNE aligned cone fields, lava flows, and cut by a dense network of small offset but active faults (Wonji Fault Belt) (Mohr, 1968; Ebinger and Casey, 2001; Corti, 2009). Furthermore, crustal seismic tomography shows that the magmatic segments are underlain by high seismic velocity crust (interpreted as mafic intrusion) in the upper crust (Keranen et al., 2004; Daly et al., 2008). Although the axial part of the MER is accepted to be the locus of strain in existing rift models (Ebinger and Casey, 2001; Wolfenden, et al., 2004; Casey et al., 2006; Kurz et al., 2007; Corti, 2009; Beutel et al., 2010), the presence of young magmatic systems near the rift margin suggests a potentially more complex distribution of extension (Rooney et al., 2007; Chiasera et al., 2018).
The evolution of the MER has been a region of focused investigation (Ebinger and Casey, 2001; Keranen et al., 2004; Wolfenden, et al., 2004; Casey et al., 2006; Keir et al., 2006; Maguire et al., 2006; Kurz et al., 2007; Corti, 2009; Beutel et al., 2010). However, the significance of the tectonic geometries and magmatic localization is still widely debated (Kurz et al., 2007). Consequently, long-standing questions including to what depth the magmatic segments maintain discrete magmatic plumbing systems, and whether magma intrusion and faulting vary along discrete segments, have remained unanswered. To address these issues, we used gravity data to image and model the subsurface characteristics of the magmatic segments in the MER. This was accomplished by creating a variety of gravity anomaly maps by using wavelength filtering and upward continuation in conjunction with two-dimensional forward modeling constrained by existing seismic models (Keranen et al., 2004; Maguire et al., 2006) and geologic information (Corti et al., 2020 and references therein). Although our study focused on the Aluto-Gedemsa-Boseti portion of the rift (Figure 1), which is the most magmatically productive middle Pleistocene to Holocene parts of the MER (Acocella et al., 2002; Abebe et al., 2007; Nicotra et al., 2021), implications are relevant to the entire EARS and other rift systems on Earth.
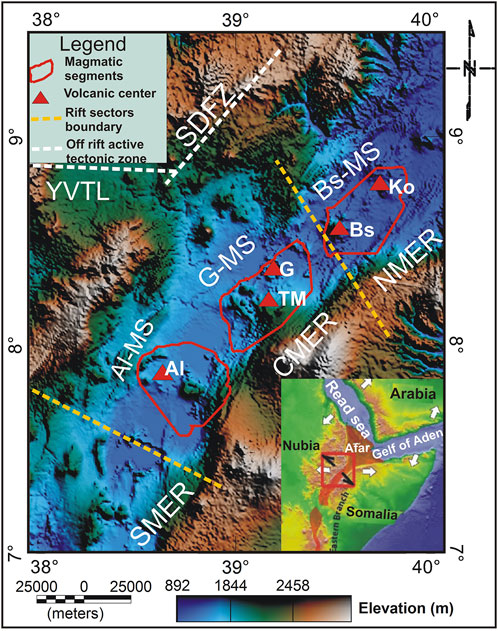
FIGURE 1. Evolution of the MER within the frame of the East African Rift System (right bottom panel): a change in Nubia-Somalia kinematics from orthogonal (white arrows) to oblique extension (black arrows) (Boccaletti et al., 1998; Wolfenden et al., 2004). The main map shows the en echelon arrangements of magmatic segments in the MER (Ebinger and Casey, 2001; Kurz et al., 2007): the rectangle in the red line is the MER (the study area) and abbreviations: SMER, Southern MER; CMER, Central MER; NMER, Northern MER; MS, magmatic segment; Al-MS, Aluto magmatic segments; G-magmatic segments, Gedemsa magmatic segments; Bs-MS, Boseti magmatic segments.
2 Geological and geophysical background of the MER
2.1 Geology and tectonic setting
Ethiopia’s pre-rift geology comprises highly folded and foliated Proterozoic basement rocks. Overlain by Mesozoic sediments, these rocks are exposed in the southern MER, northern Afar, and western rift escarpment of the Central MER (Woldegabriel et al., 1990; Wolfenden et al., 2004; Abebe et al., 2005; Corti, 2009 and references therein). With the eruption of the Ethiopia–Yemen flood-basalt province, Ethiopian volcanism began during the Eocene-Late Oligocene (Mohr and Zanettin, 1988). Tholeiitic to alkaline lava flows (Kieffer et al., 2004) and felsic lavas with pyroclastic rocks of rhyolitic compositions inter-bedded with flood basalts characterize this volcanic phase (Mohr and Zanettin, 1988). In the Miocene period, a second stage of volcanism is marked by the development of massive basaltic shield volcanoes (Kieffer et al., 2004), whereas the third stage in the Pliocene-Quaternary is intimately tied to the opening of the MER and Afar (Wolfenden et al., 2004; Nicotra et al., 2021).
The volcanic rocks of the MER are dominated by a bimodal composition with a basalt-rhyolite association (Peccerillo et al., 2003). Basalts are associated with monogenetic vents or fissures on the side of the main central volcano (Ebinger and Casey, 2001; Acocella, 2014 and references therein), while rhyolites are associated with central volcanoes, which are usually characterized by a summit caldera (Ebinger and Casey, 2001; Acocella, 2014 and references therein). Several basaltic fields, silicic domes, and calderas are interlayered with lacustrine deposits on the rift floor (Woldegabriel et al., 1990).
From embryonic continental rifting in the south to incipient oceanic spreading in the north, the MER encompasses many phases of rift sector evolution (e.g., Hayward and Ebinger, 1996; Corti, 2009; Ebinger et al., 2017; Chiasera et al., 2021). Based on the onset of rifting and the age of volcanism (Corti, 2009; Corti et al., 2020), the MER has commonly been divided into three sectors: Southern Main Ethiopian Rift (SMER), Central Main Ethiopian Rift (CMER) and Northern Main Ethiopian Rift (NMER) (Figure 1). This division of the MER into several sectors which varies in rift architecture, melt production, and strain accommodation processes have been attributed to be affected by the Pan-African suture zone (Muluneh et al., 2017). Structurally, the MER is dominated by E-W oriented pre-existing faults, NE-SW oriented Miocene border faults and NNE-SSW oriented Quaternary-Recent rift floor faults (Korme et al., 2004; Corti, 2009 and references therein). Deformation in the central to northern MER shifted from the NE trending border faults to the rift floor over the last 2 Ma, focusing along ∼20 km wide, ∼60 km long, NNE striking magmatic segments aligned in a right stepping en echelon pattern (Boccaletti et al., 1998, 1999; Ebinger and Casey, 2001).
2.2 Previous geophysical studies
A variety of geophysical techniques (seismic, gravity, and magnetotellurics) have been used to investigate the lithospheric structure and the process of continental rifting in Ethiopia. The Ethiopian Afar Geoscientific Lithospheric Experiment (EAGLE) yielded a wealth of data on the lithospheric structure (Keranen et al., 2004; Bastow et al., 2005; Cornwell et al., 2006; Maguire et al., 2006; Whaler and Hautot, 2006; Mickus et al., 2007). The main geophysical results on the lithospheric structure of the MER, which are used in constraining the interpretation of our gravity data, are discussed in Sections 2.2.1, 2.2.2.
2.2.1 Upper mantle structure of the Main Ethiopian Rift
The upper mantle properties have been imaged by receiver functions, surface waves and seismic tomography (e.g., Bastow et al., 2005, 2008; Dugda et al., 2007; Rychert et al., 2012; Lavayssière et al., 2018; Chambers et al., 2022). The deeper portions of the lithosphere beneath the Ethiopian plateau has been imaged using receiver functions and surface wave tomography (Keranen et al., 2009; Rychert et al., 2012; Gallacher et al., 2016; Lavayssière et al., 2018). More specifically, Lavayssière et al., 2018 used S-p receiver functions and identified a negative phase, a decrease in velocity with depth (at 67 ± 3 km depth) beneath the Ethiopian plateau, likely associated with the lithosphere-asthenosphere boundary (LAB). This is broadly consistent with previous studies estimating lithospheric thickness at 60–90 km beneath the Ethiopian plateau (e.g., Dugda et al., 2007). Estimates of lithospheric thickness beneath the MER generally yield lower values than for the plateau. For example, a joint inversion of teleseismic receiver functions and surfaces waves by Dugda et al. (2007) showed evidence beneath the MER for a ∼50 km thick high seismic velocity lid commonly interpreted as the lithosphere. Further constraints on the nature of the mantle lithosphere come from S-p receiver functions (Rychert et al., 2012; Lavayssière et al., 2018). These studies have struggled to image a discontinuity likely associated with the LAB beneath the MER. Instead, either there is no discontinuity, or a weak discontinuity at ∼50–70 km depth with the poor definition of the boundary having been interpreted to be due to melt infiltration masking the seismic contrast between lithosphere and asthenosphere (Lavayssière et al., 2018). A 3D gravity inversion by Mammo (2013) also argues for the absence of a lithospheric mantle beneath the rift.
2.2.2 Crustal structure of the Main Ethiopian Rift
The regional crustal structure beneath the MER and the adjacent plateaus has been modified during extension and magmatism as revealed by seismic and gravity modeling (Maguire et al., 2003; Keranen et al., 2004; Dugda et al., 2005; Mackenzie et al., 2005; Maguire et al., 2006; Stuart et al., 2006; Mickus et al., 2007; Figures 2B, C). The crust beneath the adjacent plateaus is considerably thicker than the MER, with values for the Ethiopian plateau ranging between 35–45 km and the Somalia plateau ranging between 30–35 km (Mackenzie et al., 2005; Stuart et al., 2006; Chambers et al., 2022). However, the Ethiopian plateau can be divided into two regions (eastern and western) with the crust of the eastern Ethiopian plateau being thicker (40–45 km) likely due to magmatic additions to the lower crust (Mackenzie et al., 2005; Stuart et al., 2006; Mammo, 2013).

FIGURE 2. Previous seismic studies in the MER. (A) horizontal slice of VP at 10 km underlying TMSs (Dashed lines) and eruptive centers (Diamonds where Sh, Shala; Al, Aluto; TM, Tulu Moye; G, Gedemsa; B, Boseti; K, Kone; F, Fentale; D, Dofan; LHF, Liyado-Hayk field; H, Hertale), A-A′ and B-B′ are velocity profiles (Keranen et al., 2004). (B) Moho depth over the MER and adjacent plateaus with the dashed gray lines show the rift outlines, solid black lines are the rift border faults (Keranen et al., 2009) and the white triangles represent seismic stations. (C) Topographic profile (top) and p wave velocity model (bottom): Labels, u. c., upper crust; l. c., lower crust; M, Mohorovic discontinuity; and L, mid-Lithospheric reflector. Stars, shot point location and black dots, Earthquake hypocenters (Maguire et al., 2006).
In contrast, the thickness of the crust within the MER ranges between 25 and 38 km (Mackenzie et al., 2005; Mickus et al., 2007; Keranen et al., 2009; Hammond et al., 2011; Figures 2B, C). In general, the thickness decreases towards the Afar rift and the thickness is less than the adjacent plateaus except in the SMER where it is of similar thickness to beneath the Somalia plateau (Mackenzie et al., 2005; Hammond et al., 2011). The crust has been broken into several distinct layers. These are an upper and lower crust, and then also a seismically faster and denser layer at the bottom of the lower crust which has been interpreted to be a mafic magmatic addition (underplating) (Mackenzie et al., 2005; Tiberi et al., 2005; Stuart et al., 2006; Mammo, 2013). Within the upper and lower crust, both gravity and seismic models have imaged seismically faster (P-wave) and denser regions beneath the magmatic segments in the NMER and CMER (Keranen et al., 2004; Mackenzie et al., 2005; Mickus et al., 2007). Three-dimensional seismic models (Keranen et al., 2004; Daly et al., 2008) imaged 20 km wide and 50 km-long high-velocity regions at depths between 5–15 km beneath both the SDFZ and WFB and interpreted them as segmentation of the rift with distinct magmatic segments (Figures 1, 2A). Daly et al. (2008) interpreted these high P-wave velocities (6.5 km s−1) and high Vp/Vs ratios (1.81–1.84) at the same depth range to be cooled mafic intrusions. S-wave velocities (Vs) from surface wave studies and Vp/Vs from receiver functions have imaged slower crustal Vs. and high Vp/Vs in portions of the MER which have been interpreted to be caused by a fluid component, such as partial melt, under the magmatic segments (Dugda et al., 2005; Keranen et al., 2009; Chambers et al., 2019). These fluid components have also been imaged as high conductivity regions by magnetotelluric modeling under the magmatic segments in the northern CMER and southern NMER (Whaler and Hautot, 2006; Hübert et al., 2018; Samrock et al., 2018).
3 Data and methods
3.1 The gravity data
The gravity data used in this study are from the Global Gravity Model Plus (GGMplus 2013) model, which is a mixture of ground, satellite, and topographic effect gravity data. These data have a resolution of 200 m
3.2 Methods
3.2.1 Gravity data reduction
The GGMplus2013 data are observed gravity values and the theoretical gravity values at each observation station were computed using the Geodetic Reference System 1967 (GRS67). Using a Free-Air gradient of 0.3086 mGal/m, a Bouguer reduction density of 2.67 g/cm3, and mean sea level as an elevation reference, the data were corrected for Free-Air and Bouguer gravity anomalies. To obtain complete Bouguer anomalies (CBA), terrain corrections are made using a 1-km digital elevation model and a terrain density of 2.67 g/cm3. To create a CBA map, the entire Bouguer gravity anomaly (CBA) data were gridded at a 1 km interval (Figure 3).
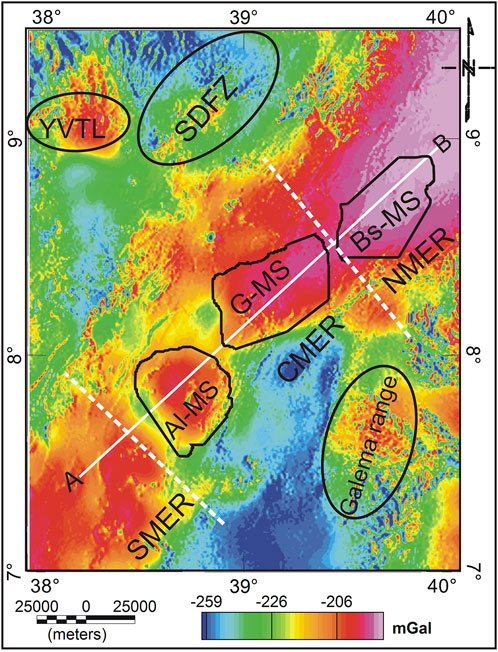
FIGURE 3. Complete Bouguer anomaly map of the MER. Labels: Al, Aluto; TM, Tulumoye; G, Gedemsa; Bs, Boseti; SDFZ, Silte Debrezeyit fault Zone; YVTZ, Yerer Tulu volcano-tectonic zone. The white broken line shows the expected boundary of the Southern, Central, and Northern MER. The curved solid lines represent the off-rift volcanic zones and the irregular polygons represent the magmatic segments along with the MER. The white line along AB is the model (Figure 9) profile line.
3.2.2 Determination of regional-residual gravity anomalies
Gravity data can be enhanced to investigate different anomaly sizes and to isolate anomalies of certain wavelengths before one performs more quantitative modeling (Mammo, 2010). There are various methods to accomplish this enhancement including wavelength filtering, upward continuation, and isostatic residual anomalies (Abera, 2020). We used wavelength filtering on the CBA data (Figure 3) to isolate anomalies that occur within the crust. A high pass filter (HPF) with a cutoff wavelength of 130 km was applied to investigate sources of up to 35 km in depth as Abera (2020) showed that an approximate maximum depth of the density sources is one-quarter of the wavelength (Figure 4). To enhance longer wavelength anomalies which are usually due to deeper density variations, band-pass filters (BPF) with wavelengths between 20–130 km, 40–130 km, and 40–200 km were applied to the CBA data to produce three BPF gravity anomaly maps (Figures 5–7, respectively). The BPF gravity anomaly maps are used to investigate the density structure between different depths and the subsurface segmentation of magmatic features beneath the MER.
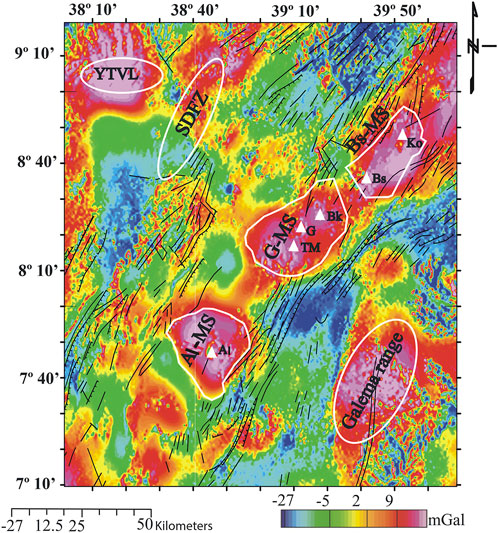
FIGURE 4. The residual gravity anomaly map of the MER was compiled using a high pass filter with a cutoff wavelength of 130 km. The elliptical-shaped solid black lines are the off-rift volcanic regions (YVTZ, SDFZ, and Galema range) and the polygons with white lines are magmatic segments. Labels: Al-MS, G-MS, and Bs-MS represent Aluto, Gedemsa, and Boseti magmatic segments respectively. The overlaid black lines represent faults (where hachured lines are border faults) within the MER.
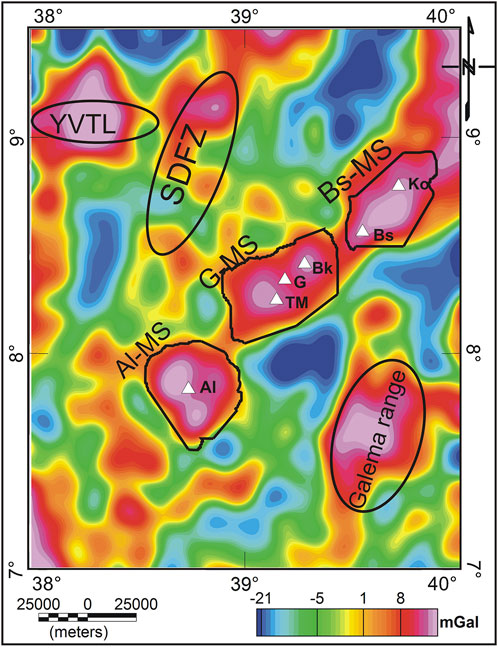
FIGURE 5. Bandpass filtered regional gravity anomaly map of the MER where wavelengths between 20 and 130 km are passed. The elliptical-shaped solid black lines are the off-rift volcanic regions (YVTZ, SDFZ, and Galema range). Labels: Al-MS, G-MS, and Bs-MS represent Aluto, Gedemsa, and Boseti magmatic segments respectively.
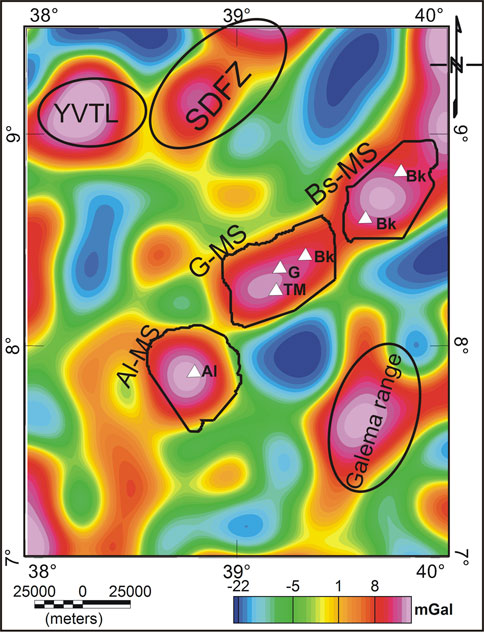
FIGURE 6. Bandpass filtered regional gravity anomaly map of the MER where wavelengths between 40 and 130 km are passed. The elliptical-shaped solid black lines are the off-rift volcanic regions (YVTZ, SDFZ, and Galema range). Labels: Al-MS, G-MS, and Bs-MS represent Aluto, Gedemsa, and Boseti magmatic segments respectively.
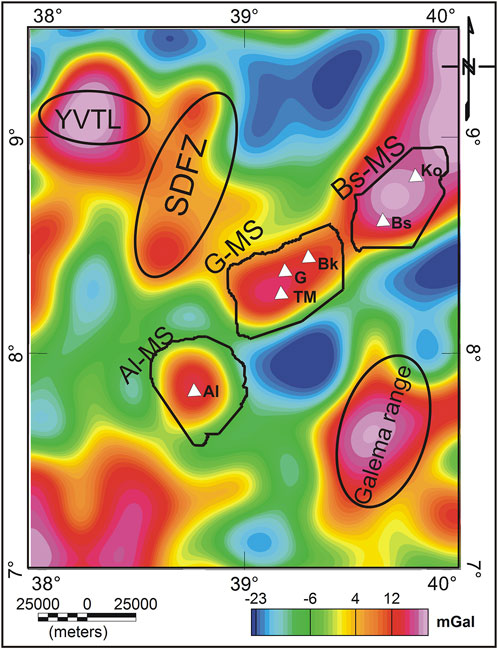
FIGURE 7. Bandpass filtered regional gravity anomaly map of the MER where wavelengths between 40 and 200 km are passed. The elliptical-shaped solid black lines are the off-rift volcanic regions (YVTZ, SDFZ, and Galema range). Labels: Al-MS, G-MS, and Bs-MS represent Aluto, Gedemsa, and Boseti magmatic segments respectively.
The HPF anomaly map is thought to show the gravity field response of the entire crust. To further examine the source of geologic bodies at different depth scales, we used upward continuation with continuation distances of 5, 10, 20 and 30 km (Figures 8A–D as a filtering method. Upward continuation involves mathematically projecting a gravity field from one vertical datum to another (Jacobsen, 1987) and smoothes the gravity field or removes high-frequency gravity signals. As a result, the resultant gravity field usually represents deeper and/or broader density variations as one continues to higher elevations. Jacobsen (1987) showed that the upward continuation height is related to the depth of the anomaly sources and that the density sources are at or deeper than one-half of the continuation height. Therefore, this method can also provide a rough estimate of the depth of the density sources.
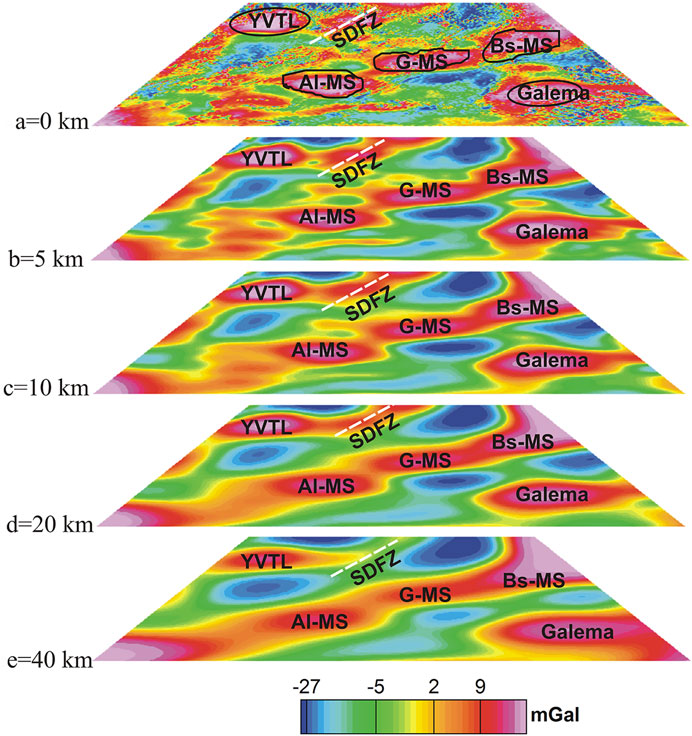
FIGURE 8. Upward continuation of the residual gravity anomaly map (Figure 8) to heights of (A) 0 km, (B) 5 km, (C)10 km, (D)20 km, and (E)30 km.
3.2.2 Two-dimensional forward modeling
The non-uniqueness of modeling gravity data dictates independent constraints from seismic models, borehole data, geological mapping, and other geophysical data in order to obtain meaningful geological models. In our study, we used the available geophysical and geological constraints to obtain a quantitative model of the upper mantle and crustal structure of the MER through a 2D forward model (Figure 9) along profile AB (Figure 3) following the rift axis. Geometries, depths, and density constraints on the upper mantle and crustal bodies were obtained from 2D reflection/refraction models and 3D tomographic models of the EAGLE project (Keranen et al., 2004; Mackenzie et al., 2005; Maguire et al., 2006). We converted the P-wave velocities determined beneath the magmatic segments to densities using an empirical relationship between P-wave velocity and density (Christensen and Mooney, 1995). The final densities of the bodies are shown in Table 1. The CBA data were modeled using the GM-SYS forward modeling program where the modeling was performed by a trial and error process, by changing the geometries, depths, and densities, until the error (in our case 2%) between the observed and calculated gravity anomalies was acceptable.
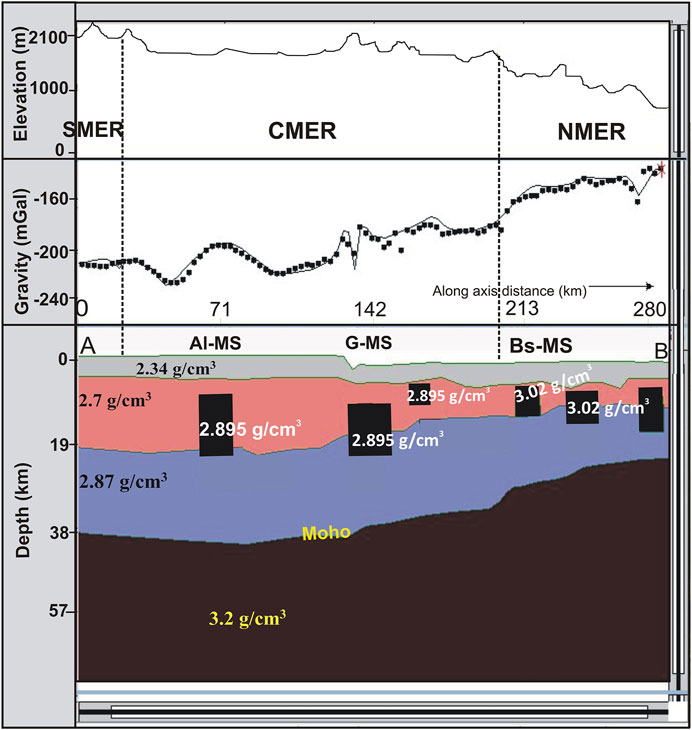
FIGURE 9. The two-dimensional gravity model of the crust and upper mantle, shows mafic intrusions, crustal thickness modification, and Moho depth undulation. The solid line of the gravity profile shows the calculated gravity and the black dots are the observed gravity values and abbreviations: SMER, Southern MER; CMER, Central MER; NMER, Northern MER; Al-MS, Aluto magmatic segments; G-magmatic segments, Gedemsa magmatic segments; Bs-MS, Boseti magmatic segments.
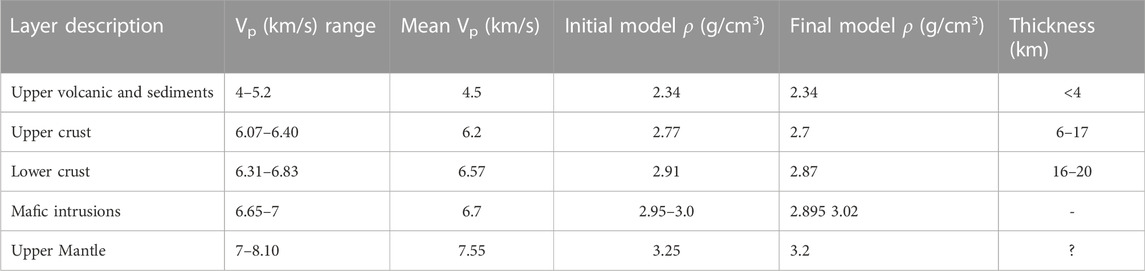
TABLE 1. P-wave velocities (Vp) (Maguire et al., 2006), densities (ρ), and thickness of each body in the gravity modeling.
4 Results
4.1 Gravity field of the MER
The reduced gravity data have been processed to compile the CBA map (Figure 3) and its enhanced components (Figures 4–8) aiming at examining the subsurface nature and structure of the magmatic segments within the MER. Furthermore, a 2D gravity model (Figure 9) has been constructed along profile AB running along the rift axis (Figure 3) by sampling the entire crust and upper mantle.
4.1.1 Complete Bouguer anomalies
Figure 3 shows the CBA map of the MER where its axial portion is characterized by gravity maxima, and an increase in gravity value (>−210 mGa l) is observed after the northern termination of the Gedemsa magmatic segment. South of the Gedemsa magmatic segment, the Aluto magmatic segment is exhibited a positive gravity anomaly (>−210 mGal). The elevated platforms corresponding to the western and eastern flanks of the rift are characterized by negative gravity anomalies (<−234 mGal). The rift margin is generally not characterized by an anomalous signal, except for specific volcano-tectonic zones, Silte Debrezeyit fault zone (SDFZ), Yerer Volcano-Tectonic zone (YVTZ), and the Galema range, which are also characterized by gravity maxima. Since the CBA map (Figure 3) is the response of lithospheric scale materials existing beneath the MER and the adjacent plateaus, it does not readily provide information on the depth of the individual source bodies without some type of map transformation or modeling. Consequently, high pass filtering (Figure 4), bandpass filtering (Figures 5–7), and upward continuation (Figure 8) were applied to the CBA data (Figure 3) to obtain the anomaly components that can be used to get information regarding the depths of the individual causative bodies.
4.1.2 High pass filtered gravity anomalies
The high pass filtered gravity anomaly map (Figure 4) reveals a gravity maximum along the magmatic segments of the MER and the rift margin volcanic zones occurring at a crustal level, above 30 km in depth on the wavelength of 130 km (Abera, 2020). The magmatic segments (Figure 4) are associated with one or more Quaternary rift volcanoes. The Gedemsa magmatic segment is associated with five rift volcanoes (Bora, Bericha, Tulu Moye, Gedemsa, and Boku) (Ebinger and Casey, 2001; Nigussie et al., 2022a). The rift margin volcanic zones identified in our study are the SDFZ and YVTL on the western rift flank and the Galema range on the southeastern rift flank, characterized by elongated gravity maxima.
4.1.3 Bandpass filtered gravity anomalies
The 20–130 km bandpass filtered gravity anomaly map (Figure 5) reveals information on density sources occurring between depths of 5–32.5 km. Figure 5 shows a trend of gravity maxima over the magmatic segments which consists of the rift floor volcanic complexes (Aluto, Gedemsa, Boku, and Boseti) and rift margin volcanic regions (YVTZ, SDFZ, and Galema range). Figure 6 is a 40–130 km bandpass filtered gravity anomaly which corresponds to density sources between 10 and 32.5 km. Figure 6 reveals a circular gravity maxima occurring over the above-mentioned rift volcanoes and the southwestern part of the Aluto magmatic segment is also reflected by a positive gravity response.
Figure 7 is a 40–200 km bandpass gravity anomaly map to determine if there are density sources between the mid-crust to the upper mantle. The resultant map reveals a gravity maximum that occurs along the MER axis diverted towards the northeast, toward the NMER. This anomaly has been shown by Mickus et al. (2007) to be caused by a thinning crust toward the Afar depression. Additionally, there is a positive gravity anomaly that trends toward the northwest toward YVTL and SDFZ that might be related to lower crustal bodies or undulations in the Moho surface. Gravity minima are observed northeast of SDFZ, south of the Gedemsa magmatic segment, and between the Gedemsa magmatic segment and Aluto magmatic segment and these anomalies may be related to crustal thickening. In addition, a gravity maximum is observed after the southern termination of the Aluto magmatic segment, towards the SMER, suggesting that the density source under the Aluto magmatic segment is larger than was previously known (Mickus et al., 2007).
4.1.4 Upward continuation of gravity anomalies
The high-pass filtered gravity anomaly map (Figure 4) shows the average gravity field response of density sources at a crustal scale. To further investigate the nature and approximate depth ranges of the density sources which may include magmatic intrusions at a crustal-scale, the high-pass filtered gravity anomaly data (Figure 4) were further processed through upward continuation (Figures 8A–D). A 5 km continuation (Figure 8B) indicates the removal of shallow density sources (<2.5 km) with a gravity maximum along the MER axis (Figures 4, 8A) and gravity maxima over the magmatic segments (Aluto, Gedemsa, and Boseti). In addition, rift margin volcanic zones (e.g., SDFZ, YVTL, and Galema range) (Figure 8B) are also characterized by gravity maxima.
The upward continued 10 km and 20 km gravity maps (Figures 8C, D), images density sources below 5 km and 10 km, respectively, reveal a gradual disappearance of the gravity anomalies (Figure 8B). In the 40 km upward continued residual gravity map (Figure 8E), the lenticular shaped gravity maxima responses over the SMER and CMER disappeared (e.g., Aluto and Gedemsa magmatic segments), except for a general positive gravity anomaly trend over the rift axis.
4.2 Interpretation and gravity modeling
The gravity maximum over the MER floor and the sudden increase in the gravity anomalies (>−210 mGa l) after the northern termination of the Gedemsa magmatic segment (Figure 3) are attributed to the cumulative response of the addition of magmatic underplated intrusions and northward crustal thinning (Tiberi et al., 2005; Mickus et al., 2007). The gravity maxima over rift margin volcanic zones (SDZFZ, YVTZ, and Galema range) are interpreted to be magmatic intrusions into the crust in the form of dike swarms (Chiasera et al., 2021). The gravity maxima over the magmatic segments and the rift margin volcanic zones on the rift flanks occur at a crustal level (
The isolated density sources along the MER axis in the bandpass filtered gravity maps (Figures 5–7) are interpreted as the subsurface continuation of the surface magmatic segments. Sampling the crust with an increasing depth in the bandpass filtered maps show a change in anomaly nature over magmatic segments as well as a diversion in gravity anomaly towards the YTVT and SDFZ (Figure 7) starting from the Gedemsa magmatic segment. This anomaly pattern is interpreted as a pre-existing NW-SE trending structure (Corti, 2009) with magmatic intrusions along it which may control the southward propagation of the MER from Afar. The upward continuation maps show similar results as the bandpass filtered gravity anomaly maps (Figures 5, 6) except it revealed more detailed depth wise information.
To characterize the nature of the magmatic segments in the crust beneath the MER quantitatively, a gravity model was constructed that estimates the subsurface density sources along the rift axis and crosses the major magmatic segments of the MER [Aluto, Gedemsa, and Boseti (Figures 3, 9)]. The gravity model along profile AB (Figure 9) has a top layer of upper volcanic and sediments (ρ=2.34 g/cm3) covering the rift floor and its thickness is less than 4 km (Figure 9; Table 1). The second layer is the upper crust (ρ=2.7 g/cm3) along the rift axis with its thickness varying from 17 km at the southern tip of the model (a portion of the CMER) to 6 km at the northern end of the model profile (a portion of the NMER).
The lower crust was given a density of 2.87 g/cm3 and a thickness varying from 16 km at the NMER to 20 km at the SMER (Figure 9; Table 1). A decrease in thickness of the upper and lower crust is observed north of the Boseti magmatic segment (Figure 9). The upper mantle has a density of 3.2 g/cm3 where the Moho depth shows a decrease in depth of 38 km–28 km from south to north. In addition, higher density bodies which are interpreted to be mafic intrusions are included in the upper and lower crust to model the short wavelength gravity maxima (Figure 9). Unlike previous studies which modeled the axial mafic intrusions under the magmatic segments of the MER with a similar density (e.g., Mickus et al., 2007; Nigussie et al., 2022b) based on crustal scale seismic model (Maguire et al., 2006), we modeled the mafic intrusions with varying densities, 2.895 g/cm3 at the Aluto magmatic segment to 3.02 g/cm3 at the Boseti magmatic segment, from south to north (Figure 9). This density variations of the zones of intrusions along the 280 km axial zone of the MER are based on the observed variations in the upper crust, controlled-source seismic velocity study of Keranen et al. (2004) (Figure 2A).
5 Discussion
In this section, we discuss the implications of our study for understanding the along-axis segmentation of magma intrusion and its relationship with faulting (Section 5.1). Moreover, the subsurface nature and structure of each magmatic segment with the MER (Section 5.1) and broadly distributed strain accommodation, rift margin extension of the MER (Section 5.2) are also clearly mentioned. To support our discussion, we include interpretations of our results in comparison with other previous geophysical and geological studies that focused on the fault-dominated and magma-enhanced rifting cases of the MER.
5.1 Along-axis segmentation of the rift
Geodetic constraints and seismicity indicate that more than 80% of current extension in the upper crust is localized to the magmatic segments (Bilham et al., 1999; Kogan et al., 2012; Daniels et al., 2014; Birhanu et al., 2016). Geological records suggest that this has been the case since the Quaternary (Ebinger and Casey, 2001; Casey et al., 2006). The geological expression of the magmatic segments is localized volcanic centers, and NNE striking aligned cones and small offset fault systems oriented to the orientation of the Miocene border faults (Ebinger and Casey, 2001; Kurz et al., 2007). The spatial position of the gravity maxima we observe in the upper crust shows a clear along-rift segmented pattern (Figures 4–9). However, it does not always exactly match with the geologically mapped location of the magmatic segments and appears to be shorter and more spatially separated (e.g., Figure 9). For example, we image two discrete gravity maxima that we define as the Aluto magmatic segment and Gedemsa magmatic segment, whereas these two segments are harder to distinguish from the surface geology (Ebinger and Casey, 2001; Casey et al., 2006). The subsurface separation between these two segments is also supported by a recent gravity data analysis (Nigussie et al., 2022b) which showed that the Aluto and Gedemsa magmatic segments represent two distinct features and no linkage between the two occurs in the upper crust. An elongated NW trending gravity maxima associated with the Gedemsa magmatic segment led Nigussie et al. (2022b) to suggest that the formation of Gedemsa magmatic segment could be linked to and controlled by transversal structures within the rift. In this regard, the local gravity minimum superimposed on a larger gravity maximum over the Gedemsa magmatic segment (Figure 9) could possibly reflect the associated transversal structures, although it needs more analysis at a smaller scale, since low density bodies may cause the same response.
Closer inspection of the position of the gravity maxima shows that they are localized to major volcanic centers (e.g., Figure 4): The gravity maxima are centered on the Aluto volcanic center within the Aluto magmatic segment, on the Tulu Moye volcanic center within the Gedemsa magmatic segment, and the Boseti volcanic center within the Boseti magmatic segment. This observation suggests that the major volcanic centers are the locus of magma intrusion and that there is limited magmatism in-between the segments. Furthermore, this interpretation may also suggest that the dikes feeding the monogenic volcanoes propagate laterally in the upper crust from a magmatic center, and not vertically from deeper depths. The shorter length scale of the gravity maxima (∼30 km), compared to the surface expression (∼60-km) of the magmatic segments suggests that the amount of magma intrusion may vary along the rift in each segment. To explore this hypothesis further, we combined the gravity maps with the surface fault data (Figure 4). The discrete gravity maxima do not correlate to where the fault density is highest, but instead reveal that the densest fault swarms occur at the lateral tips and between the gravity maxima. This result may suggest that tectonic extension by faulting and magmatic extension by intrusion vary along the rift in a regular pattern, with faulting becoming more important away from zones of focused intrusion. A similar interpretation has been reached from surface structural geology studies of along rift variation in faulting and volcanism (Kurz et al., 2007; Siegburg et al., 2020), with magmatism being interpreted to be focused on the segment centers with faulting increasing in importance at the segment tips, and to link the segments (Illsley-Kemp et al., 2018; La Rosa et al., 2022).
The along-axis pattern and scale of gravity maxima (Figures 4–9) and their spatial relationship to volcanic centers and zones of increased faulting (Figure 4) are similar to what is observed at slow and ultra-slow spreading ridges. In the oceans, gravity maxima defining a “bulls’ eye” pattern are positioned in the center of the third order segments (∼50–100 km-long) of the ridge, and interpreted as zones of localized magma intrusion and magma supply (Phipps Morgan & Chen, 1993; Liu & Buck, 2020). At the surface, the axial volcanic highs of up to a few hundred meters are observed at the segment centers (Phipps Morgan & Chen, 1993; Liu & Buck, 2018). In contrast, where magma supply is lower towards the segment tips, an axial graben develops (Phipps Morgan & Chen, 1993; Liu & Buck, 2018). Therefore, we interpret the along rift variation in gravity signature (Figures 4–9) and faulting (Figure 4) in the MER to be similar to that observed at ocean spreading centers. This suggests that the mode of crustal extension seen at ocean ridges can initiate in magma-rich rifts long before continental breakup.
Previous crustal seismic imaging studies that have the resolution to image high P-wave velocities beneath discrete segments only have good resolution in the upper crust (Keranen et al., 2004; Daly et al., 2008), and that the subsurface extent and geometry of localized intrusion zones beneath segments is debated. This can be elaborated by closely examining the subsurface extent of the separation between magmatic segments by sampling the entire crust at different depths (Figures 4–9). The results indicate that discrete gravity maxima can be inferred to a mid-crust depth of 20 km. This suggests that the subvolcanic plumbing systems beneath the centers of magmatic segments remain discrete down to at least mid-crustal depths (Figure 9). Constraining their separation into the lower crust with certainity is difficult to achieve with geophysical studies, since the lower continental crust shares similar densities and seismic velocities to mafic rock (Maguire et al., 2006). However, the observation of the gravity highs at the centre of the magmatic segments and similarity to that seen at slow spreading oceanic ridges leads us to speculate that segment centres share a connection to magma supply from depth. The centres of magmatic segments may therefore represent regions where magma has risen from the upper mantle and resides in the middle crust, where it starts to undergo fractional crystallization (Siegburg et al., 2018).
5.2 Rift margin extension by magma intrusion
The mode of strain accommodation in the central MER is much more complex than in the northern MER (Rooney et al., 2005; Rooney, 2006) where focused magmatism is observed only along the axial zone of the rift. A seismic analysis of the MER and gravity modeling indicates that there are regions of higher P-wave velocities and densities in the crust at 10 km beneath the surface expressions of the WFB, SDFZ, YVTL, and the Galema range (Keranen et al., 2004; Mickus et al., 2007; Nigussie et al., 2022b; Figure 2A). High-pass filtered (Figure 4) and bandpass filtered (Figures 5–7) gravity anomaly maps also show gravity maxima over these rift margin volcanic zones (WFB, SDFZ, YVTL, and the Galema range). Specifically, the occurrence of higher P-wave velocities in the crust at depths of approximately 10 km beneath these zones (Keranen et al., 2004; Figure 2A) is consistent with the bandpass filtered gravity anomaly map (Figure 6) which represents depths between ∼10–32.5 km and is comparable to the seismic models. This correlation together with petrologic and geochemical evidence (Rooney et al., 2005; Chiasera et al., 2018) may be evidence of cooled mafic material at these depths.
The bandpass filtered gravity maps (Figures 5–7) displays an en echelon arrangement of the magmatic segments (Aluto, Gedemsa, and Boseti) and rift margin volcanic ranges (Galema range, YVTL and SDFZ) reflected by gravity maxima. This shows a process of magmatic addition to the crust not only on the rift axis but also on the margin and flanks of the rift. Although the axial part of the MER is the locus of strain in existing rift models, there is increasing evidence of ongoing rift margin and off-rift extension from petrologic studies and the gravity data analysis in this study (Rooney et al., 2007; Chiasera et al., 2018; 2021 Nigussie et al., 2022b; Figures 4–6). The occurrence of rift margin volcanic ranges (e.g., SDFZ and Galema) implies a broad distribution of strain and complex geodynamic setting of the MER.
Most of the rift magmatic segments reflect SW-NE trending gravity maxima (Mehatsente et al., 1999; Tiberi et al., 2005; Mickus et al., 2007) and high seismic velocities (Keranen et., 2004) within the WFB. However, the Gedemsa magmatic segment has an anomaly with a perturbation/shift of high velocity beneath the SDFZ (Figure 1, Keranen et., 2004) which is not seen on the gravity anomaly maps (Figures 4–6). Despite the seismic evidence (Figure 2A, Keranen et., 2004) which shows a shift in velocity highs towards the SDFZ in the vicinity of Gedemsa, subsurface evidence from gravity anomalies shows that the maxima are consistent with the surface location of the magmatic segments (Figures 4–6). There is a diversion of gravity maxima towards the SDFZ from the Gedemsa magmatic segment (not perturbation) at greater depth (Figure 7) which may reflect the existence of pre-existing weak zones. However, this dilemma needs further geochemical and geophysical investigation. The presence of this NW trending gravity maxima associated with some of the segments (e.g., Gedemsa magmatic segment) may imply that the formation of magmatic segments in the MER could be linked to and controlled by transversal structures in the rift.
6 Conclusion
Our contribution from interpreting gravity data in conjunction with previous data is to understand better the spatial distribution of magma intrusion in a magma-rich continental rift. We have used 61,717 datasets to produce higher resolution gravity anomaly maps on a large spatial scale in the MER than previously achieved. Our gravity data analysis includes creating a variety of gravity anomaly maps by using wavelength filtering and upward continuation in conjunction with two-dimensional forward modeling constrained by existing seismic models. The following conclusions have been forwarded based on the observations and interpretations made:
The along-axis gravity model combined with high pass and bandpass filtered gravity anomaly maps shows distinct 30–60 km long gravity highs in the upper crust that we interpret as focused zones of magma intrusion beneath the centers of magmatic segments. These gravity highs are shorter than the surface expression of the magmatic segments, suggesting along-rift variations in magma intrusion at the segment scale. Furthermore, our integration of our gravity maps with fault maps suggests that the fault density is highest at the tips and in between the gravity highs, supporting an interpretation that tectonic extension becomes increasingly important away from the centers of the magmatic segments. This along-segment variation in magmatism and faulting is similar to what is observed at slow and ultra-slow ocean ridges.
The presence of NW trending gravity maxima associated with some magmatic segments (e.g., Gedemsa) may imply that the formation of the magmatic segments in the MER could be linked to and controlled by transversal structures in the rift. The occurrence of rift margin volcanic zones within the CMER (e.g. SDFZ and Galema) evidenced from previous geological mapping and petrological data reinforced by the gravity data in this study show that extension via magma intrusion also occurs in places at the rift margin. These results suggest that the central MER is still in a relatively immature stage of continental rifting where strain is accommodated by border faults, axial magmatic segments, and off-rift magmatic zones.
Data availability statement
The datasets presented in this study can be found in online repositories. The names of the repository/repositories and accession number(s) can be found below: https://bgi.obs-mip.fr/data-products/grids-and-models/modele-global-ggmplus2013/.
Author contributions
All authors listed have made a substantial, direct, and intellectual contribution to the work and approved it for publication.
Acknowledgments
We are thankful to the International Gravimetric Bureau for providing the gravity data which is freely available to the public (http://ddfe.curtin.edu.au/gravitymodels/GGMplus/data/).
Conflict of interest
The authors declare that the research was conducted in the absence of any commercial or financial relationships that could be construed as a potential conflict of interest.
Publisher’s note
All claims expressed in this article are solely those of the authors and do not necessarily represent those of their affiliated organizations, or those of the publisher, the editors and the reviewers. Any product that may be evaluated in this article, or claim that may be made by its manufacturer, is not guaranteed or endorsed by the publisher.
References
Abebe, B., Acocella, V., Korme, T., and Ayalew, D. (2007). Quaternary faulting and volcanism in the main Ethiopian rift. J. Afr. Earth Sci. 48 (2-3), 115–124. doi:10.1016/j.jafrearsci.2006.10.005
Abebe, T., Manetti, P., Bonini, M., Corti, G., Innocenti, F., Mazzarini, F., et al. (2005). Geological map (scale 1: 200, 000) of the northern main Ethiopian rift and its implication for the volcano-tectonic evolution of the rift. Geol. Soc. Am. Map Chart Ser., MCH094.
Acocella, V., Korme, T., and Salvini, F. (2002). Formation of normal faults along the axial zone of the Ethiopian Rift. J. Struct. Geol. 25 (4), 503–513. doi:10.1016/s0191-8141(02)00047-0
Acocella, V. (2014). Structural control on magmatism along divergent and convergent plate boundaries: Overview, model, problems. Earth-Science Rev. 136, 226–288. doi:10.1016/j.earscirev.2014.05.006
Alemu, A. (2020). Geophysics: Principles, practices, and applications of geophysical methods to resource exploration and geohazard studies. Addis Ababa: Aster Nega Publishing Enterprise, 500.
Bastow, I. D., Nyblade, A. A., Stuart, G. W., Rooney, T. O., and Benoit, M. H. (2008). Upper mantle seismic structure beneath the Ethiopian hot spot: Rifting at the edge of the African low-velocity anomaly. Geochem. Geophys. Geosystems 9 (12). doi:10.1029/2008gc002107
Bastow, I. D., Stuart, G. W., Kendall, J. M., and Ebinger, C. J. (2005). Upper-mantle seismic structure in a region of incipient continental breakup: Northern Ethiopian rift. Geophys. J. Int. 162 (2), 479–493. doi:10.1111/j.1365-246x.2005.02666.x
Beutel, E., van Wijk, J., Ebinger, C., Keir, D., and Agostini, A. (2010). Formation and stability of magmatic segments in the Main Ethiopian and Afar rifts. Earth Planet. Sci. Lett. 293, 225–235. doi:10.1016/j.epsl.2010.02.006
Bilham, R., Bendick, R., Larson, K., Mohr, P., Braun, J., Tesfaye, S., et al. (1999). Secular and tidal strain across the main Ethiopian rift. Geophys. Res. Lett. 26 (18), 2789–2792. doi:10.1029/1998gl005315
Birhanu, Y., Bendick, R., Fisseha, S., Lewi, E., Floyd, M., King, R., et al. (2016). GPS constraints on broad scale extension in the Ethiopian Highlands and Main Ethiopian Rift. Geophys. Res. Lett. 43 (13), 6844–6851. doi:10.1002/2016gl069890
Boccaletti, M., Bonini, M., Mazzuoli, R., Abebe, B., Piccardi, L., and Tortorici, L. (1998). Quaternary oblique extensional tectonics in the Ethiopian rift (horn of Africa). Tectonophysics 287 (1-4), 97–116. doi:10.1016/s0040-1951(98)80063-2
Boccaletti, M., Mazzuoli, R., Bonini, M., Trua, T., and Abebe, B. (1999). Plio-quaternary volcano-tectonic activity in the northern sector of the main Ethiopian rift: Relationships with oblique rifting. J. Afr. Earth Sci. 29 (4), 679–698. doi:10.1016/s0899-5362(99)00124-4
Casey, M. C. D. R. F. G., Ebinger, C., Keir, D., Gloaguen, R., and Mohamed, F. (2006). Strain accommodation in transitional rifts: Extension by magma intrusion and faulting in Ethiopian Rift magmatic segments. Geol. Soc. Lond. Spec. Publ. 259 (1), 143–163. doi:10.1144/gsl.sp.2006.259.01.13
Chambers, E., Harmon, N., Keir, D., and Rychert, C. (2019). Using ambient noise to image the northern East African rift. Geochem. Geophys. Geosystems 20, 2091–2109. doi:10.1029/2018gc008129
Chambers, E. L., Harmon, N., Rychert, C. A., Gallacher, R. J., and Keir, D. (2022). Imaging the seismic velocity structure of the crust and upper mantle in the northern East African Rift using Rayleigh wave tomography. Geophys. J. Int. 230 (3), 2036–2055. doi:10.1093/gji/ggac156
Chiasera, B., Rooney, T. O., Bastow, I. D., Yirgu, G., Grosfils, E. B., Ayalew, D., et al. (2021). Magmatic rifting in the Main Ethiopian Rift began in thick continental lithosphere; the case of the Galema Range. Lithos 406, 106494. doi:10.1016/j.lithos.2021.106494
Chiasera, B., Rooney, T. O., Girard, G., Yirgu, G., Grosfils, E., Ayalew, D., et al. (2018). Magmatically assisted off-rift extension—the case for broadly distributed strain accommodation. Geosphere 14 (4), 1544–1563. doi:10.1130/ges01615.1
Christensen, N. I., and Mooney, W. D. (1995). Seismic velocity structure and composition of the continental crust: A global view. J. Geophys. Res. Solid Earth 100 (B6), 9761–9788. doi:10.1029/95jb00259
Cornwell, D. G., Mackenzie, G. D., England, R. W., Maguire, P. K. H., Asfaw, L. M., and Oluma, B. (2006). Northern Main Ethiopian Rift crustal structure from new high-precision gravity data. Geol. Soc. Lond. Spec. Publ. 259 (1), 307–321. doi:10.1144/gsl.sp.2006.259.01.23
Corti, G. (2009). Continental rift evolution: From rift initiation to incipient break-up in the main Ethiopian rift, East Africa. Earth-Science Rev. 96 (1-2), 1–53. doi:10.1016/j.earscirev.2009.06.005
Corti, G., Sani, F., Florio, A. A., Greenfield, T., Keir, D., Erbello, A., et al. (2020). Tectonics of the asela-langano margin, main Ethiopian rift (East Africa). Tectonics 39 (8), e2020TC006075. doi:10.1029/2020tc006075
Daly, E., Keir, D., Ebinger, C. J., Stuart, G. W., Bastow, I. D., and Ayele, A. (2008). Crustal tomographic imaging of a transitional continental rift: The Ethiopian Rift. Geophys. J. Int. 172 (3), 1033–1048. doi:10.1111/j.1365-246x.2007.03682.x
Daniels, K. A., Bastow, I. D., Keir, D., Sparks, R. S. J., and Menand, T. (2014). Thermal models of dyke intrusion during development of continent–ocean transition. Earth Planet. Sci. Lett. 385, 145–153. doi:10.1016/j.epsl.2013.09.018
Dugda, M. T., Nyblade, A. A., Julia, J., Langston, C. A., Ammon, C. J., and Simiyu, S. (2005). Crustal structure in Ethiopia and Kenya from receiver function analysis: Implications for rift development in eastern Africa. J. Geophys. Res. Solid Earth 110 (B1), B01303. doi:10.1029/2004jb003065
Dugda, M. T., Nyblade, A. A., and Julia, J. (2007). Thin lithosphere beneath the Ethiopian Plateau revealed by a joint inversion of Rayleigh wave group velocities and receiver functions. J. Geophys. Res. Solid Earth 112 (B8), B08305. doi:10.1029/2006jb004918
Ebinger, C. (2005). Continental break-up: The East African perspective. Astronomy Geophys. 46 (2), 2.16–2.21. doi:10.1111/j.1468-4004.2005.46216.x
Ebinger, C. J., and Casey, M. (2001). Continental breakup in magmatic provinces: An Ethiopian example. Geology 29 (6), 527–530. doi:10.1130/0091-7613(2001)029<0527:cbimpa>2.0.co;2
Ebinger, C. J., Keir, D., Bastow, I. D., Whaler, K., Hammond, J. O., Ayele, A., et al. (2017). Crustal structure of active deformation zones in Africa: Implications for global crustal processes. Tectonics 36 (12), 3298–3332. doi:10.1002/2017tc004526
Gallacher, R. J., Keir, D., Harmon, N., Stuart, G. W., Leroy, S., Hammond, J. O. S., et al. (2016). The initiation of segmented buoyancy-driven melting during continental breakup. Nat. Commun. 7 (1), 13110–13119. doi:10.1038/ncomms13110
Hammond, J., Kendall, J., Stuart, G., Keir, D., Ebinger, C., Ayele, A., et al. (2011). The nature of the crust beneath the Afar triple junction. Geochemistry. Geophys. Geosystems 121, 1–24.
Hayward, N. J., and Ebinger, C. J. (1996). Variations in the along-axis segmentation of the Afar Rift system. Tectonics 15 (2), 244–257. doi:10.1029/95tc02292
Hirt, C., Claessens, S., Fecher, T., Kuhn, M., Pail, R., and Rexer, M. (2013). New ultrahigh-resolution picture of Earth's gravity field. Geophys. Res. Lett. 40 (16), 4279–4283. doi:10.1002/grl.50838
Hübert, J., Whaler, K., and Fisseha, S. (2018). The electrical structure of the central main Ethiopian rift as imaged by magnetotellurics: Implications for magma storage and pathways. J. Geophys. Res. Solid Earth 123 (7), 6019–6032. doi:10.1029/2017jb015160
Illsley-Kemp, F., Bull, J., Keir, D., Gerya, T., Pagli, C., Gernon, T., et al. (2018). Initiation of a proto-transform fault prior to seafloor spreading. Geochem. Geophys. Geosystems 19 (12), 4744–4756.
Jacobsen, B. H. (1987). A case for upward continuation as a standard separation filter for potential-field mapsfilter for potential-field maps. Geophysics 52, 1138–1148. doi:10.1190/1.1442378
Keir, D., Ebinger, C. J., Stuart, G. W., Daly, E., and Ayele, A. (2006). Strain accommodation by magmatism and faulting as rifting proceeds to breakup: Seismicity of the northern Ethiopian Rift. J. Geophys. Res. Solid Earth 111 (5). doi:10.1029/2005jb003748
Keranen, K., Klemperer, S. L., Gloaguen, R., and Group, E. W. (2004). Three-dimensional seismic imaging of a protoridge axis in the Main Ethiopian Rift. Geology 32 (11), 949–952. doi:10.1130/g20737.1
Keranen, K. M., Klemperer, S. L., Julia, J., Lawrence, J. F., and Nyblade, A. A. (2009). Low lower crustal velocity across Ethiopia: Is the Main Ethiopian Rift a narrow rift in a hot craton? Geochem. Geophys. Geosystems 10 (5). doi:10.1029/2008gc002293
Kieffer, B., Arndt, N., Lapierre, H., Bastien, F., Bosch, D., Pecher, A., et al. (2004). Flood and shield basalts from Ethiopia: Magmas from the african superswell. J. Petrology 45 (4), 793–834. doi:10.1093/petrology/egg112
Kogan, L., Fisseha, S., Bendick, R., Reilinger, R., McClusky, S., King, R., et al. (2012). Lithospheric strength and strain localization in continental extension from observations of the East African Rift. J. Geophys. Res. Solid Earth 117 (B3). doi:10.1029/2011jb008516
Kurz, T., Gloaguen, R., Ebinger, C., Casey, M., and Abebe, B. (2007). Deformation distribution and type in the main Ethiopian rift (MER): A remote sensing study. J. Afr. Earth Sci. 48 (2-3), 100–114. doi:10.1016/j.jafrearsci.2006.10.008
La Rosa, A., Pagli, C., Hurman, G. L., and Keir, D. (2022). Strain accommodation by intrusion and faulting in a rift linkage zone: Evidences from high-resolution topography data of the afrera plain (Afar, East Africa). Tectonics 41 (6). doi:10.1029/2021TC007115
Lavayssière, A., Rychert, C., Harmon, N., Keir, D., Hammond, J. O., Kendall, J. M., et al. (2018). Imaging lithospheric discontinuities beneath the Northern East African Rift using S-to-P receiver functions. Geochem. Geophys. Geosystems 19 (10), 4048–4062. doi:10.1029/2018gc007463
Liu, Z., and Buck, W. R. (2020). Global trends of axial relief and faulting at plate spreading centers imply discrete magmatic events. J. Geophys. Res. Solid Earth 125 (8), e2020JB019465. doi:10.1029/2020jb019465
Liu, Z., and Buck, W. R. (2018). Magmatic controls on axial relief and faulting at mid-ocean ridges. Earth Planet. Sci. Lett. 491, 226–237. doi:10.1016/j.epsl.2018.03.045
Mackenzie, G. D., Thybo, H., and Maguire, P. K. H. (2005). Crustal velocity structure across the main Ethiopian rift: Results from two-dimensional wide-angle seismic modelling. Geophys. J. Int. 162 (3), 994–1006. doi:10.1111/j.1365-246x.2005.02710.x
Maguire, P. K. H., Ebinger, C. J., Stuart, G. W., Mackenzie, G. D., Whaler, K. A., Kendall, J. M., et al. (2003). Geophysical project in Ethiopia studies continental breakup. EOS, Trans. Am. Geophys. Union 84 (35), 337–343. doi:10.1029/2003eo350002
Maguire, P. K. H., Keller, G. R., Klemperer, S. L., Mackenzie, G. D., Keranen, K., Harder, S., et al. (2006). Crustal structure of the northern Main Ethiopian Rift from the EAGLE controlled-source survey; a snapshot of incipient lithospheric break-up. Geol. Soc. Lond. Spec. Publ. 259 (1), 269–292. doi:10.1144/gsl.sp.2006.259.01.21
Mammo, T. (2013). Crustal structure of the flood basalt province of Ethiopia from constrained 3-D gravity inversion. Pure Appl. Geophys. 170 (12), 2185–2206. doi:10.1007/s00024-013-0663-0
Mammo, T. (2010). Delineation of sub-basalt sedimentary basins in hydrocarbon exploration in North Ethiopia. Mar. petroleum Geol. 27 (4), 895–908. doi:10.1016/j.marpetgeo.2009.12.009
McKenzie, D. (1978). Some remarks on the development of sedimentary basins. Earth Planet. Sci. Lett. 40, 25–32. doi:10.1016/0012-821x(78)90071-7
Mehatsente, R., Jentzsch, G., and Jahr, T. (1999). Crustal structure of the main Ethiopian rift from gravity data: 3-dimensional modeling. Tectonophysics 313 (4), 363–382. doi:10.1016/s0040-1951(99)00213-9
Mickus, K., Tadesse, K., Keller, G. R., and Oluma, B. (2007). Gravity analysis of the main Ethiopian rift. J. Afr. Earth Sci. 48 (2-3), 59–69. doi:10.1016/j.jafrearsci.2007.02.008
Mohr, P. A. (1968). Transcurrent faulting in the Ethiopian rift system. Nature 218 (5145), 938–941. doi:10.1038/218938a0
Mohr, P., and Zanettin, B. (1988). The Ethiopian flood basalt province. Kluwer Academic Publishers, 4, 63–110.
Muluneh, A. A., Cuffaro, M., and Kidane, T. (2017). Along-strike variation in deformation style inferred from kinematic reconstruction and strain rate analysis: A case study of the Ethiopian rift. Phys. Earth Planet. Interiors 270, 176–182. doi:10.1016/j.pepi.2017.07.009
Nicotra, E., Viccaro, M., Donato, P., Acocella, V., and De Rosa, R. (2021). Catching the Main Ethiopian Rift evolving towards plate divergence. Sci. Rep. 11 (1), 21821–21916. doi:10.1038/s41598-021-01259-6
Nigussie, W., Alemu, A., Mickus, K., and Muluneh, A. (2022a). Structure of the upper crust at the axis segmentation stage of rift evolution as revealed by gravity data: Case study of the Gedemsa magmatic segment, Main Ethiopian Rift. J. Afri. Earth Sci. 190, 104523–104611. doi:10.1016/j.jafrearsci.2022.104523
Nigussie, W., Alemu, A., Muluneh, A., Mickus, K., Muhabaw, Y., and Ballay, M. (2022b). formation of magmatic segments within the aluto-gedemsa area, main Ethiopian rift. Italian J. Geosciences, Special volume rifts 142, 1–14. doi:10.3301/IJG.2023.02
Peccerillo, A., Barberio, M. R., Yirgu, G., Ayalew, D., Barbieri, M. W. U. T. W., and Wu, T. W. (2003). Relationships between mafic and peralkaline silicic magmatism in continental rift settings: A petrological, geochemical and isotopic study of the Gedemsa volcano, central Ethiopian rift. J. Petrology 44 (11), 2003–2032. doi:10.1093/petrology/egg068
Phipps Morgan, J., and Chen, Y. J. (1993). Dependence of ridge-axis morphology on magma supply and spreading rate. Nature 364, 706–708. doi:10.1038/364706a0
Rooney, T., Furman, T., Bastow, I., Ayalew, D., and Yirgu, G. (2007). Lithospheric modification during crustal extension in the Main Ethiopian Rift. J. Geophys. Res. Solid Earth 112 (B10), B10201. doi:10.1029/2006jb004916
Rooney, T. O. (2006). “Continental rifting in central Ethiopia: Geochemical and isotopic constraints from lavas and xenoliths,” (the Pennsylvania State University). PhD thesis.
Rooney, T. O., Furman, T., Yirgu, G., and Ayelew, D. (2005). Structure of the Ethiopian lithosphere: Xenolith evidence in the main Ethiopian rift. Geochimica Cosmochimica Acta 69 (15), 3889–3910. doi:10.1016/j.gca.2005.03.043
Rychert, C. A., Hammond, J. O., Harmon, N., Michael Kendall, J., Keir, D., Ebinger, C., et al. (2012). Volcanism in the Afar Rift sustained by decompression melting with minimal plume influence. Nat. Geosci. 5 (6), 406–409. doi:10.1038/ngeo1455
Samrock, F., Grayver, A. V., Eysteinsson, H., and Saar, M. O. (2018). Magnetotelluric image of transcrustal magmatic system beneath the Tulu Moye geothermal prospect in the Ethiopian Rift. Geophys. Res. Lett. 45 (23), 12–847. doi:10.1029/2018gl080333
Siegburg, M., Bull, J. M., Nixon, C. W., Keir, D., Gernon, T. M., Corti, G., et al. (2020). Quantitative constraints on faulting and fault slip rates in the northern Main Ethiopian Rift. Tectonics 39 (8), e2019TC006046. doi:10.1029/2019tc006046
Siegburg, M., Gernon, T. M., Bull, J. M., Keir, D., Barfod, D. N., Taylor, R. N., et al. (2018). Geological evolution of the boset-bericha volcanic complex, main Ethiopian rift: 40Ar/39Ar evidence for episodic Pleistocene to Holocene volcanism. J. Volcanol. Geotherm. Res. 351, 115–133. doi:10.1016/j.jvolgeores.2017.12.014
Stuart, G. W., Bastow, I. D., and Ebinger, C. J. (2006). Crustal structure of the northern Main Ethiopian Rift from receiver function studies. Geol. Soc. Lond. Spec. Publ. 259 (1), 253–267. doi:10.1144/gsl.sp.2006.259.01.20
Tiberi, C., Ebinger, C., Ballu, V., Stuart, G., and Oluma, B. (2005). Inverse models of gravity data from the Red Sea-Aden-East African rifts triple junction zone. Geophys. J. Int. 163 (2), 775–787. doi:10.1111/j.1365-246x.2005.02736.x
Whaler, K. A., and Hautot, S. (2006). The electrical resistivity structure of the crust beneath the northern Main Ethiopian Rift. Geol. Soc. Lond. Spec. Publ. 259 (1), 293–305. doi:10.1144/gsl.sp.2006.259.01.22
Woldegabriel, G., Aronson, J. L., and Walter, R. C. (1990). Geology, geochronology, and rift basin development in the central sector of the Main Ethiopia Rift. Geol. Soc. Am. Bull. 102 (4), 439–458. doi:10.1130/0016-7606(1990)102<0439:ggarbd>2.3.co;2
Wolfenden, E., Ebinger, C., Yirgu, G., Deino, A., and Ayalew, D. (2004). Evolution of the northern main Ethiopian rift: Birth of a triple junction. Earth Planet. Sci. Lett. 224 (1-2), 213–228. doi:10.1016/j.epsl.2004.04.022
Keywords: magmatic segment, gravity anomaly, rift-margin magmatism, Main Ethiopian Rift, continental breakup
Citation: Nigussie W, Mickus K, Keir D, Alemu A, Muhabaw Y, Muluneh AA, Yehualaw E and Demissie Z (2023) Subsurface structure of magmatic segments during continental breakup: Perspectives from a gravity data analysis along the Main Ethiopian Rift. Front. Earth Sci. 10:1092759. doi: 10.3389/feart.2022.1092759
Received: 08 November 2022; Accepted: 12 December 2022;
Published: 04 January 2023.
Edited by:
Filippo Greco, Istituto Nazionale di Geofisica e Vulcanologia (INGV), ItalyReviewed by:
Valerio Acocella, Roma Tre University, ItalyCatherine A. Meriaux, University of Rwanda, Rwanda
Copyright © 2023 Nigussie, Mickus, Keir, Alemu, Muhabaw, Muluneh, Yehualaw and Demissie. This is an open-access article distributed under the terms of the Creative Commons Attribution License (CC BY). The use, distribution or reproduction in other forums is permitted, provided the original author(s) and the copyright owner(s) are credited and that the original publication in this journal is cited, in accordance with accepted academic practice. No use, distribution or reproduction is permitted which does not comply with these terms.
*Correspondence: Wubamlak Nigussie, d3VibXVsbmlnMTJAZ21haWwuY29t