Abstract
Rock avalanches are a significant threat to transportation or hydraulic infrastructure, as they can also cause catastrophic secondary destruction in large practical engineering or to nearby residents. Earthquake-induced rock avalanches have been the most common and prominent natural hazard phenomena among geological hazards in recent years. Earthquake-induced rock avalanche events usually begin when a massive rock mass or multiple rock masses separate from a rock slope, progressively fragmenting and transforming into fast-moving, cohesionless rock falls. Earthquake-induced sequential collapse often occurs on weathered and fractured rock cliffs in horizontal strata, and its kinematic dynamics and destabilization mechanism are significantly different from those of isolated collapse due to weathering. In this study, the failure characteristics of the initiation and movement process of the avalanche are revealed in detail, through physical model experiments and analytical solutions, thereby obtaining an earthquake-controlled mechanical model equation. Our methods use the inflection points of the displacement time curve at the top of the rock wall and the digital images acquired by the shaking test bench to quantify the critical damage time point and to characterize the critical morphology of continuous collapse. A mathematical model of analytical solution is proposed, which aims to address the kinematic mechanics mechanism of sequential collapse under translational and rotational motion models. The comparative analysis results of the experiment and analytical solutions reveal that the transformed motion pattern is controlled by the ratio between the model stacking height, the rock block size, and the seismic acceleration. Whereas the rotational motion pattern is mainly influenced by the nodal dip angle, model stacking height, and seismic acceleration. The results of the study are of great scientific importance to elucidate the destruction mechanism of the earthquake-induced sequential collapse of rock avalanches and to determine the evolution characteristic of subsequent rockfalls motion of dangerous rocks. The proposed framework for the analysis of rock avalanches can be applied to understand the critical topographic features and mechanical mechanism behavior of analogous geological hazards.
1 Introduction
Rock avalanches are usually triggered by strong earthquakes and cause large rock falls or long-distance debris flows that threaten the safety of inhabitants, highways, and other constructions (Erismann et al., 2001; Gong et al., 2022; Gong et al., 2020; Zhang et al., 2022). In the 60,104 landslides triggered by the 2008 Wenchuan earthquake (Ms=8.0) in China (Gorum et al., 2011; Fan et al., 2018; Fan et al., 2019), the major failure mode of rock avalanche along the highways is sequential collapse induced by earthquakes that occurred at weathered and fractured rock cliffs with horizontal strata. This is different from previous phenomena regarding the weather-induced collapse of individual blocks or continuous collapse caused by groundwater effects. Investigating the critical morphological characteristics of sequential collapse key issues to clarify the failure mechanisms of earthquake-induced sequential collapse and to determine the initial state of the movement dynamic in the subsequent rockfall.
Most research interest in earthquake-induced rock avalanches has focused on the trigger mechanisms, the initiation failure characteristics, the movement dynamics, and the material properties of rock avalanches (Yin et al., 2021; Guo et al., 2020a; Liu et al., 2020; Liu et al., 2022). In particular, larger geological hazards derived from the process of rockfall occurrence or dynamic propagation, such as rock falls or debris flows, have attracted the attention of many researchers (Matasci et al., 2018; Zhang et al., 2018; Singeisen et al., 2020; Mitchell et al., 2022). However, both the analysis of dynamic propagation (Chen et al., 2006; Baggio et al., 2021; Liu et al., 2022; Zhao et al., 2022) and the assessment of the rockfall movement distance (Chen et al., 2010; Zhu et al., 2020; Donati et al., 2021; Ma et al., 2021) were closely related to the influence of initiating damage factors on the triggering mechanism in rockfalls. There are Some other studies on earthquake-induced rock avalanches focus on other damage modes, such as spatial slip mode, compression shear-slip mode, tensile-tipping mode, and rarely on earthquake-induced sequential collapse damage mode (Togo et al., 2014; Zeng et al., 2019; Guo et al., 2020b; Guo et al., 2020c; Do et al., 2020; Yang et al., 2022). Sequential collapse is an initial damage situation of earthquake-induced rock avalanche, which often occurs on weathered and fractured rock cliffs near the horizontal strata, where the triggering mechanism is different from the isolated rock fall mode caused by differential weathering or improper excavation (Singeisen et al., 2020; Aaron et al., 2016; Aaron et al., 2019; Dufresne et al., 2016; Hilger et al., 2019).
Weathered and fractured rock cliffs with horizontal stratigraphic levels are highly common topographic features along mountainous highway areas and roadways in the earthquake-stricken areas of Wenchuan, Sichuan Province, China. High-intensity earthquakes usually lead to the collapse of dangerous rocks on steeper cliffs and simultaneously trigger a chain of rock collapse damage in the near-horizontal strata and adjacent dangerous rock masses along the roadside, followed by sequential rock falling disasters (Sanders et al., 2021; Zhao et al., 2022). As shown in Figure 1, the dangerous rock mass consists of multiple groups of irregular rock layers, steeply inclined rock joints, and blocks cut by vertical tensile fractures. Those dangerous rocks that have separated from the stable rock mass have the distinctive characteristics of being upright, cascading, overhanging, and pillar-shaped. These dangerous rocks are more upright and have relatively weak horizontal stability, so weathering, earthquakes, rainfall, and freezing are most likely to trigger chain collapse damage of the critical rocks (Gorum et al., 2011; Marc, Hovius, & Meunier, 2016; Fan, et al., 2018).
FIGURE 1

Examples of dangerous rock mass on rock cliffs. (A) Potential unstable rock mass. (B) Dangerous rock mass.
The previous studies were published in which failure mechanisms and modes of the rock avalanche include bulging-slip failure, bulging-toppling, overall slip shear, seismic cracking-slip collapse, block avalanche-slip failure, overall shear dislocation failure, compression-drawing-slip failure (Zhang et al., 2013; Moretti et al., 2015; Zhang et al., 2020b; Moretti et al., 2020; An et al., 2021; Guo et al., 2021; Zhang Y. W. et al., 2022). Regarding the scale of the rock avalanche, researchers suggested that the scale can be divided into individual block collapse or sequential collapse (Paguican et al., 2014; Ouyang et al., 2019). The individual block collapse occurs in a whole rock mass, and the falling rock undergoes consistent motion during the rock avalanche processing. Sequential collapse, however, consists of a cascade of multiple rock blocks, therefore, the rock collapse of multiple dangerous rock blocks and its associated mechanical mechanism is similar to retrogressive effect failure. The key to the sequential rockfalls feature is the variation in the spatial topological relationship among multiple dangerous rock masses.
In this paper, geologic analysis, model tests, and analytical solutions are employed to investigate the critical morphological characteristics of rockfall cascading collapse at cliffs induced by earthquakes. Based on the spatial topological relationships among multiple rockfalls, especially displacement velocity, critical failure time, and damage morphology, the damage characteristics of group occurrence of collapse are identified. In addition, a theoretical analytical solution is proposed to calculate the critical failure state of cascading collapse according to the analyses of the morphological characteristic of the rock avalanche. These analyses allow explaining the propagation process of sequential rock avalanches, providing additional insights into the rock avalanche problem.
2 Rock avalanches susceptibility assessment
The governing factors of earthquake-induced rock avalanches mainly include the lithology, geological structures, and topographic and geomorphic characteristics of the rock cliffs. The representative topographic and geomorphic characteristics of the dangerous rocks are shown in Figure 2. Although the rock orientation of the three mountain belts strongly differs, the topographic characteristics of the rockfall for the three terrane zones are almost consistent, such as, the gradient of the rock cliff is greater than 70° or nearly upright. However, the undersurface of the rock cliff is a gentle incline where residual sediment damage has accumulated. The geomorphic characteristics of dangerous rocks are usually cliffs formed by almost horizontal or low-angle sedimentary strata. The release of high-ground stress leads to several vertical tension fractures or steeply dipping joints cutting into some dangerous block of cascading rock at the top of the rock cliff.
FIGURE 2
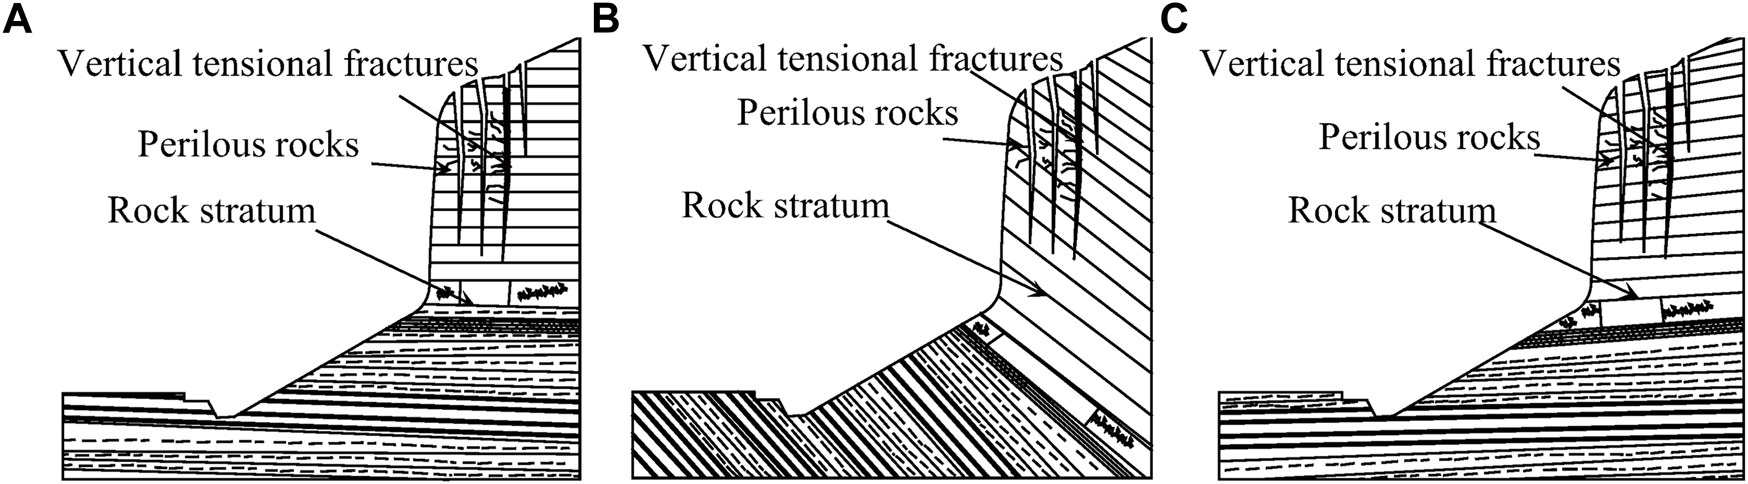
Geologic environment of dangerous rocks on cliffs. (A) Level layer. (B) Inverse layer. (C) Bedding layer.
Based on the field geologic survey of rock avalanches, the heights of the rock cliffs are generally between 50 m and 140 m, with an average height of 86 m (Bergillos et al., 2022; Flor-Blanco et al., 2022; Zhang Y. et al., 2022). The gradient of the rock cliff is in the range of about 70° to 90°. The investigation of unstable and dangerous rock masses revealed that representative rock formations weathered into many layers, with tension fractures and fracture joints at the top of the rock cliffs. According to the size of the rock block, the dangerous rocks are classified into boulders (>1,000 m3), large (100–1,000 m3), medium (10–100 m3), small (1–10 m3), and fallen rocks (<1 m3) (Yin et al., 2021; Qin et al., 2023).
It is important to determine the causes of the formation of such topography and the factors that lead to earthquake-induced rock avalanches to assess the risk of rock falls, develop measures to prevent and control dangerous rocks, in addition, to determine the mechanism of rock avalanches in plateau areas. Numerous lateral spreading phenomena have been observed in the topography of earthquake-induced rock avalanches. The vertical and overhanging top of the rock cliff is very likely to promote lateral spreading, which could trigger another rock fall of the former rock pillar.
The vertical tensile fractures or steeply inclined joints on the cliff are re-expanded and developed downward under high-ground stress, whereby the gently inclined sedimentary layers are subject to shear breakdown at the base of the cliff due to the pressure of the dangerous rock at the top of the rock cliff. The creep deformation of soft and weak rock layers in the fracture-hazardous rock mass or due to differential weathering of soft and hard rocks will lead to the formation of cavities in soft rocks, and subsequently, stress weathering accelerates the development of cavities. With the expansion of the cave, the dangerous rock lost the support of the rock stratum at the base of the rock cliff, and then a chain reaction occurred. To assess the risk of dangerous rockfalls, develop measures to prevent rockfalls, and determine the mechanical mechanisms of earthquake-induced rockfalls in the southwestern plateau region, it is important to determine the causes of the formation of such topographic characteristics and the critical factors leading to rock avalanches.
3 Physical model experiments
3.1 Apparatus of model experiments
In this paper, the experimental apparatus includes a unidirectional and horizontal shaking table system. The dangerous rock accumulation test shaking test table and high-speed camera device are shown in Figure 3. The unidirectional and horizontal shaking table system is manufactured by Nanjing Tech University and is composed of a power system, control system, and support and guidance systems (Chen et al., 2016; Hushmand et al., 2016; Xu et al., 2021; Yang et al., 2021). The power system is equipped with a pneumatic pressure source. The control system is refitted from an IPO controller in WFI and CDAS. The support and guidance systems are composed of a shaking table-board, connecting device, a guide rail, and inhibiting device.
FIGURE 3
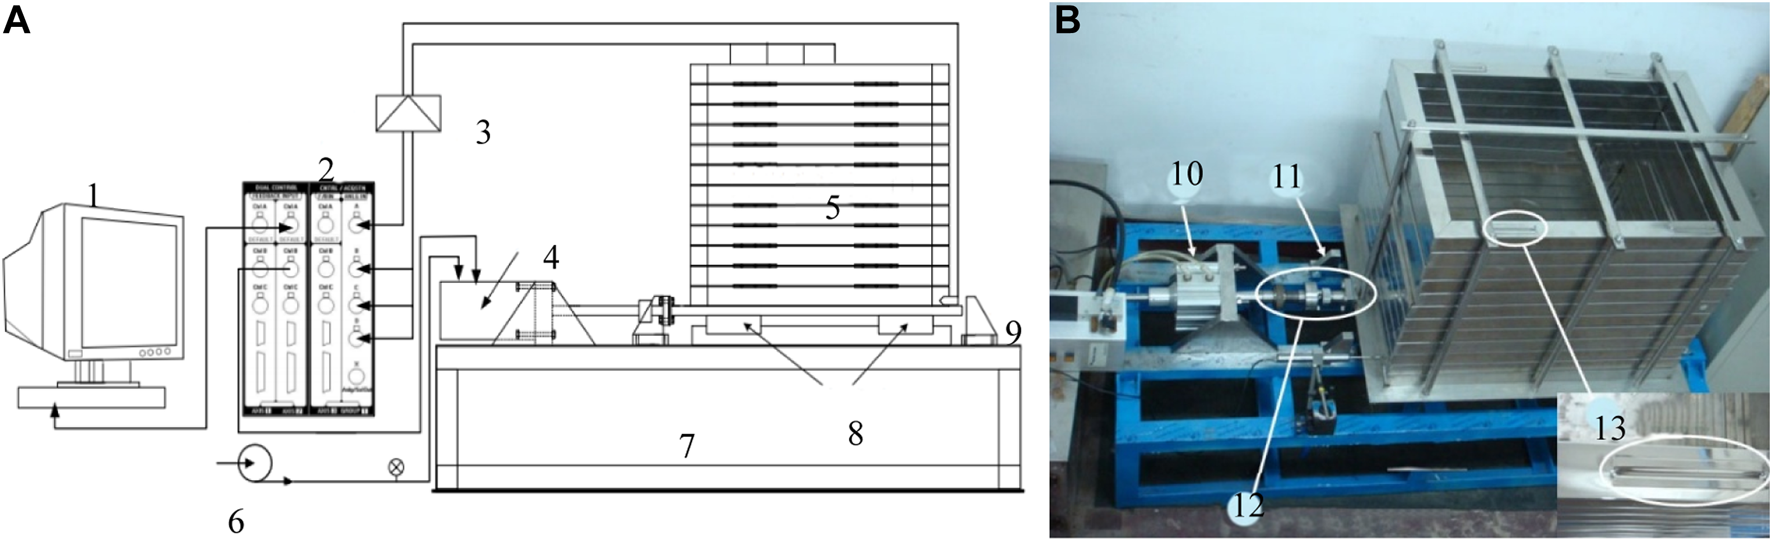
Schema of the experimental setup for shaking table and laminar container. (A) Schematic diagram of the shaking table system. (B) The shaking table and laminar shear soil box. 1-control table; 2-CDAS; 3-signal converter, 4-pneumatic power equipment; 5-model box; 6-air pressure supply system; 7-bearing platform; 8-guide rail; 9-limiting device; 10-WFI Pneumatic power equipment; 11-limiting device; 12-connecting device; 13-V shape of groove.
In the operation of the shaking table system, the maximum displacement of the table is ±13 mm, the maximum acceleration is 1 g, the frequency of shaking is between 4 and 50 Hz, the maximum load capacity is 240 kg, and the maximum overturning moment is 800 Nm. The model framework is shown in Figure 4. The size of the shaking table-board is enlarged to 1 m×1 m. The seismic force transferred from the bedrock to the rock at risk is applied by the support plate, which is made of a Plexiglas plate with dimensions of 300 x 600 mm and a thickness of 20 mm. The support plate is fixed to the shaker plate by two hinges and two support members. The angle between the support plate and the shaker plate is changed by moving the position of the two support members. The operation process of the shaker in this paper is referred to as the reference (Srilatha et al., 2013; Yang et al., 2017; Yang et al., 2020; Panah et al., 2021; Dong et al., 2022; Kuo et al., 2015; Yin et al., 2021
FIGURE 4
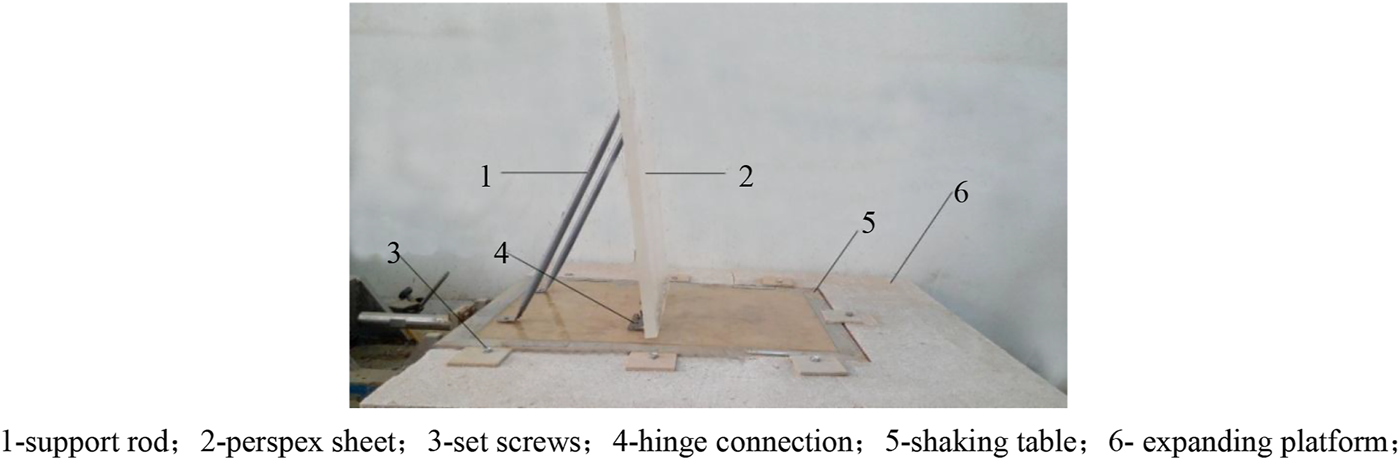
Model frame of the shaking table.
3.2 Shaking table test design and modification
The seismic waves for these model experiments were imposed by sinusoidal waves with accelerations of 0.05 g, 0.1 g, and 0.2 g, corresponding to seismic intensities of 6, 7, and 8°, respectively. The relationship between modulation frequency, modulation amplitude, and acceleration in a shaker system is as follows:where is the modulation amplitude, is the modulation frequency, and is the seismic acceleration. The detailed values and waveforms of the relationships among earthquake intensity, seismic acceleration, wave frequency, and wave amplitude are shown in Table 1 and Figure 5.
TABLE 1
| Intensity (degrees) | Acceleration (g) | Frequency/Hz | Amplitude/mm |
|---|---|---|---|
| 8 | 0.2 | 3 | 5.5 |
| 3.5 | 4 | ||
| 7 | 0.1 | 3 | 2.76 |
| 2 | 6.2 | ||
| 6 | 0.05 | 2 | 3.1 |
| 1.5 | 5.5 |
Frequency and amplitude of the sine wave.
FIGURE 5
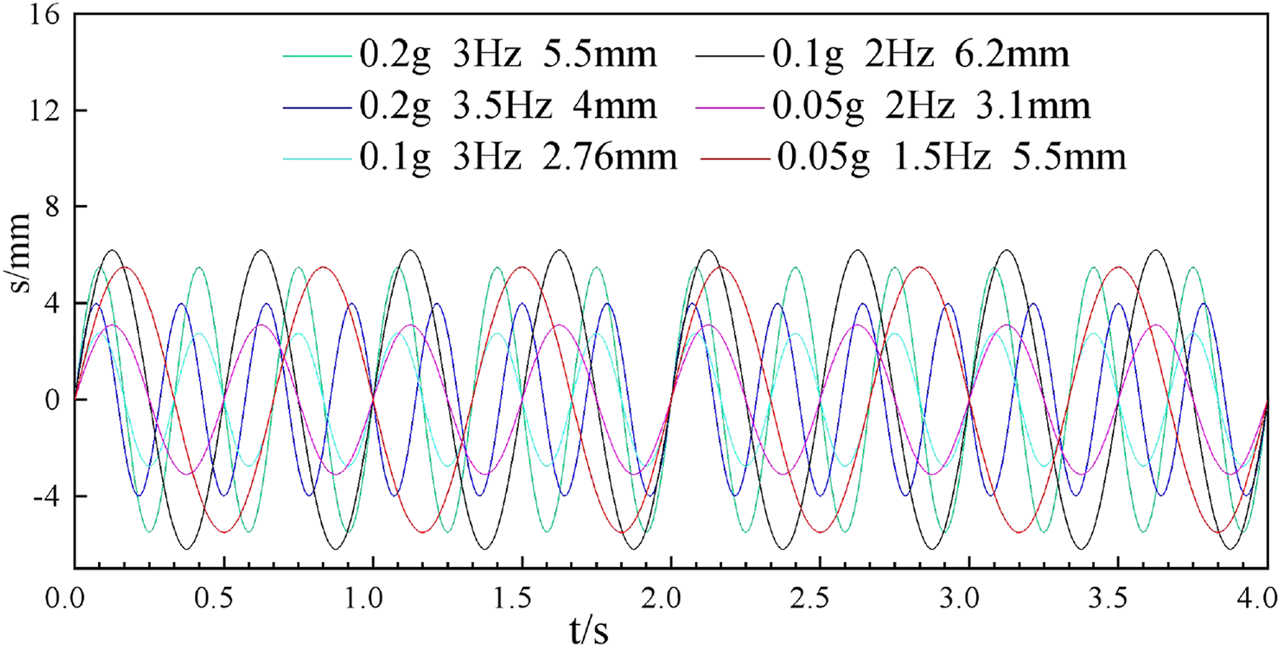
Sine form and time-history curve of the seismic wave.
3.3 Model materials
According to the similarity ratio of geometry, different sizes of molds were used to produce simulated critical rocks, as shown in Figure 6. The simulated rock blocks consisted of three cubic bricks with dimensions of 1.5×1.5×1.5 cm, 3×3×3 cm, and 5×5×5 cm which were made by mixing cement, sand, water, barite powder, and liquid laundry detergent in a similar ratio rule. The mixing ratio is adopted as:Three sizes of simulated rock blocks represent different degrees of fragmentation. Four joint dips (60°, 70°, 80°, and 90°) and four heights (27 cm, 30 cm, 33 cm, and 36 cm) are used for the stacking of rock blocks. The stacking pattern of the blocks is shown in Figure 6B.
FIGURE 6
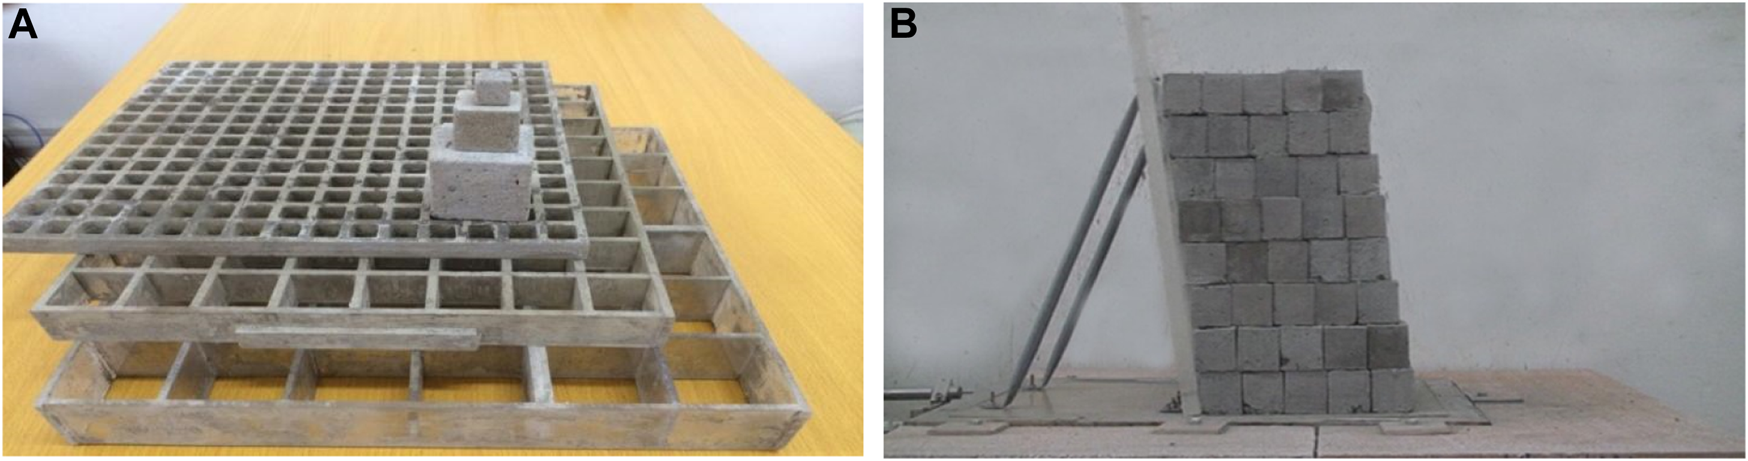
Physical model design of the shaking experiments facility. (A) Mold of block stone. (B) Stacking pattern.
3.4 scheme of physical model experiments
In this study, eleven model experiments are performed to investigate the failure patterns and the critical failure state of sequential collapse of the dangerous rocks at a cliff under varying conditions, including block sizes, stacking heights, joint dips, and seismic accelerations, as shown in Table 2.
TABLE 2
| Number | Block size (cm) | Stack height (cm) | Joint dip (°) | Acceleration(g) |
|---|---|---|---|---|
| 1 | 1.5 | 30 | 90 | 0.1 |
| 2 | 3 | 30 | 90 | 0.1 |
| 3 | 5 | 30 | 90 | 0.1 |
| 4 | 3 | 27 | 90 | 0.1 |
| 5 | 3 | 33 | 90 | 0.1 |
| 6 | 3 | 36 | 90 | 0.1 |
| 7 | 3 | 30 | 80 | 0.1 |
| 8 | 3 | 30 | 70 | 0.1 |
| 9 | 3 | 30 | 60 | 0.1 |
| 10 | 3 | 30 | 90 | 0.05 |
| 11 | 3 | 30 | 90 | 0.2 |
Experimental conditions and scheme of the model experiments.
3.5 Seismic response of rock blocks
The model experiments aim to describe the damage mode and critical damage state of sequential collapse by observing the relative displacement and relative rotation between rock blocks. Since conventional strain sensors and deformation sensors cannot measure relative displacement and relative rotation, image, and video digital measurements have been proposed as the primary method for measuring rock mass displacement in model experiments. The detailed sequence of operations is as follows.
1) The shaking process and displacement of stacked blocks over time are recorded by the high-speed camera.
2) A digital image time series recording the rock displacement is extracted from the digital video using Adobe Premiere and Windows Media Player software packages, as presented in Figure 7.
3) The displacements of rock blocks on the digital image are measured by the inquiry distance tools with AutoCAD. The connection point between the shaker plate and the Plexiglas plate is considered the origin of the workplace coordinate system.
4) The size of the rock masses on the digital image is also measured by the above method and compared to the known size of the rock masses. Therefore, the actual displacement of the rock block can be calculated according to the dimensional scale of the rock block size. The measurement precision of this method is controlled by the pixel size of the image and satisfies the requirement of the model experiments.
FIGURE 7
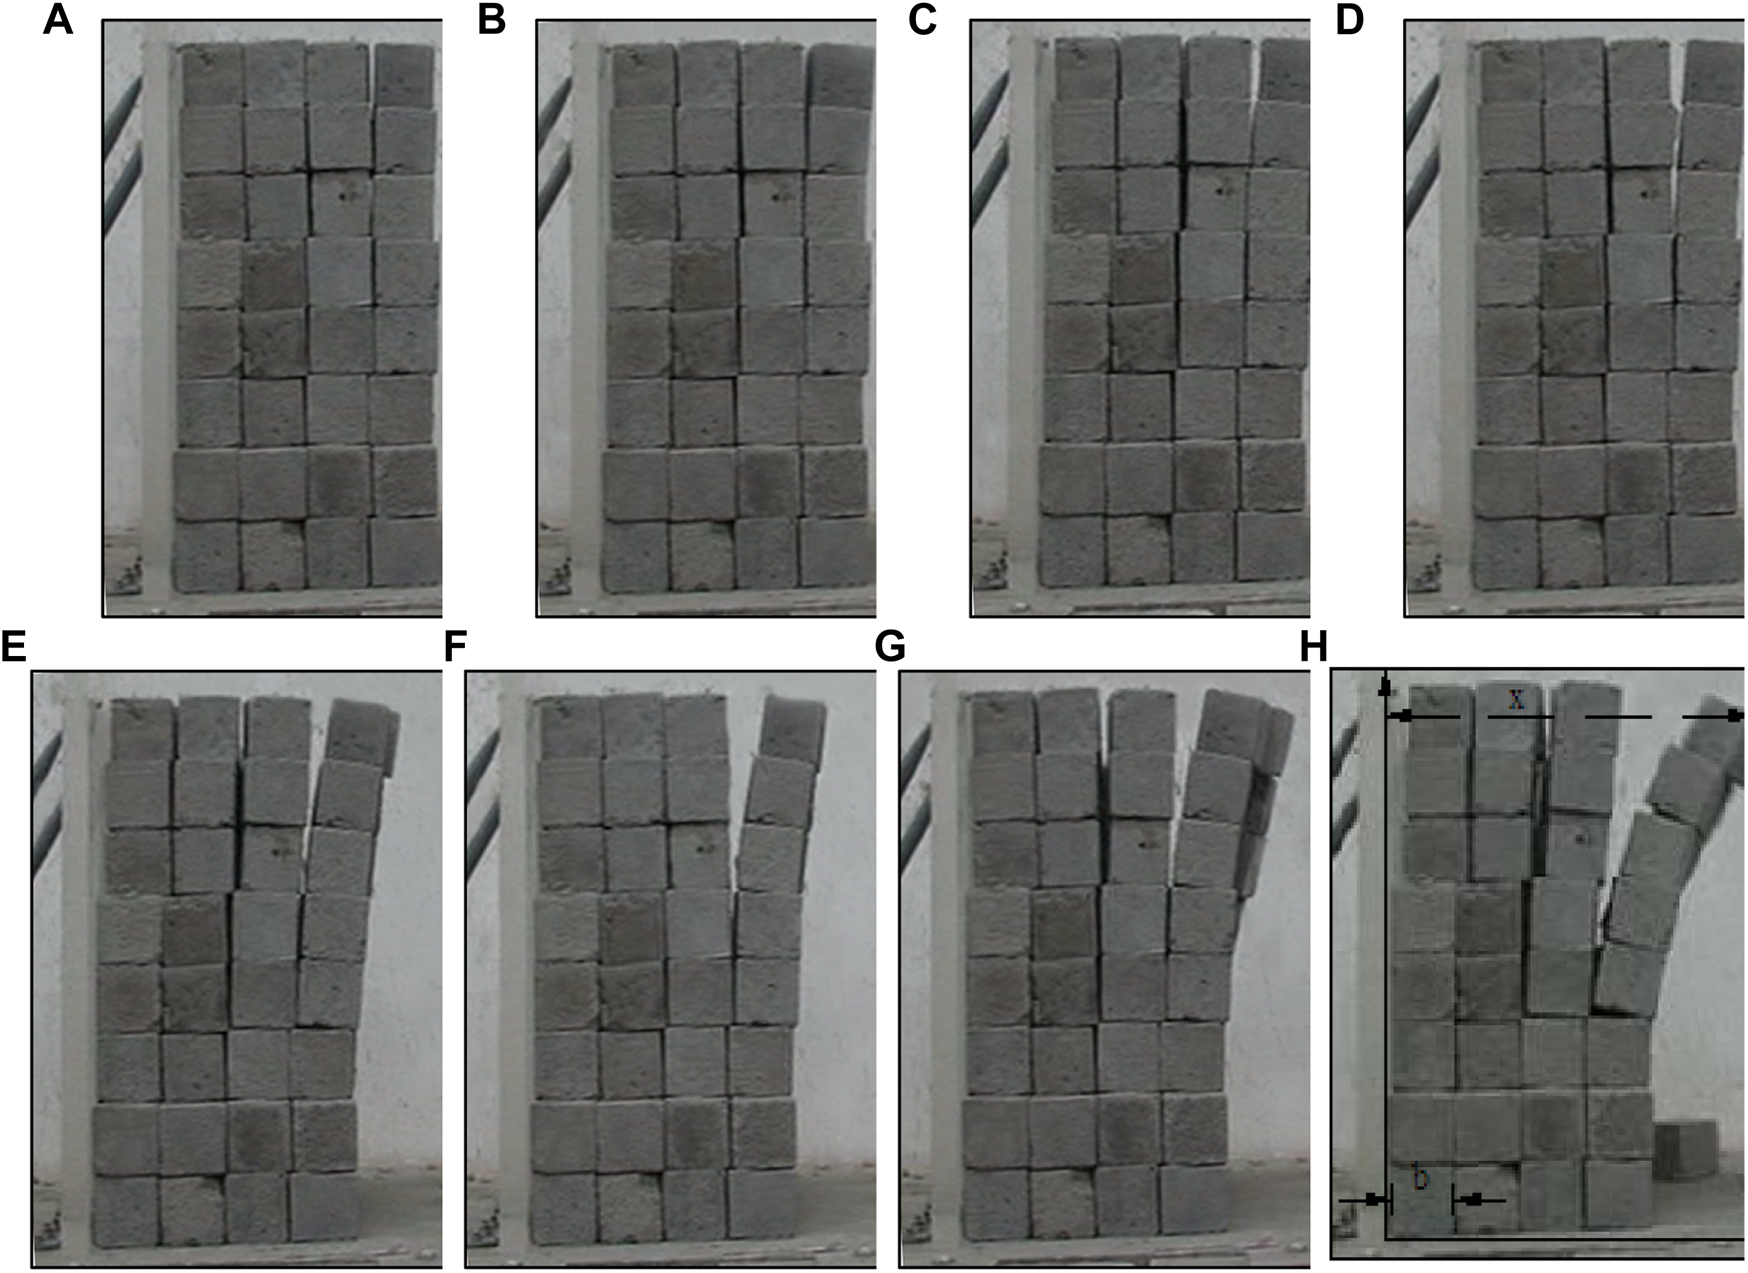
Failure forms at different times of the dangerous rock block. (A)t = 0.2 s. (B)t = 0.4 s. (C)t = 0.8 s. (D)t = 1.2 s. (E)t = 1.6 s. (F)t = 1.8 s. (G)t = 2.0 s. (H)t = 2.2 s.
4 Results of model experiments
4.1 Failure modes of rock blocks
Under different experimental conditions, the destabilization damage modes of rock masses induced by various factors including block size, stacking height, joint dip and dynamic load acceleration, and dynamic load intensity are displayed in Figure 8. It can be seen that there are two main failure modes of the rock blocks, including sequential collapse and sequence rolling rockfall. There are three alternative modes of continuous collapse: rotational motion, translational motion, and a combination of rotational and translational motion Figure 8A shows that the rotational motion of sequential collapse occurred under conditions that the joint dips are greater than 70° or 80° and the dynamic load acceleration is 0.2. It can be seen that the translational motion of sequential collapse occurred under the conditions that the joint dips are greater than 70° or 80° and the acceleration of dynamic load is 0.05, as shown in Figure 8B. For the combination of rotational and translational motion mode, the dynamic load acceleration is 0.1 (Figure 8C), and the precondition of the above three modes is that the joint dips are greater than 70°, Otherwise, the failure mode transitions from sequential collapse to sliding or exfoliation failure as shown in Figure 8D. When the joint dips are greater than 70°, the sensitivity of the sequential collapse stability increases with the increased vertical tensile crack inclination. Different seismic wave accelerations affect not only the damage time but also the displacement in the critical damage state. The conversion conditions among the three failure modes are based on the acceleration of the dynamic load (frequency and amplitude of the seismic wave) and the ratio between the stack height and the mass size. When the ratio is large (i.e., greater than 6–8) and the seismic wave frequency is low and the amplitude is large, the damage mode of sequential collapse is mainly rotational motion mode. Alternatively, it is the translational motion mode. The hybrid mode is the transition between the rotational motion mode and the translational motion mode.
FIGURE 8
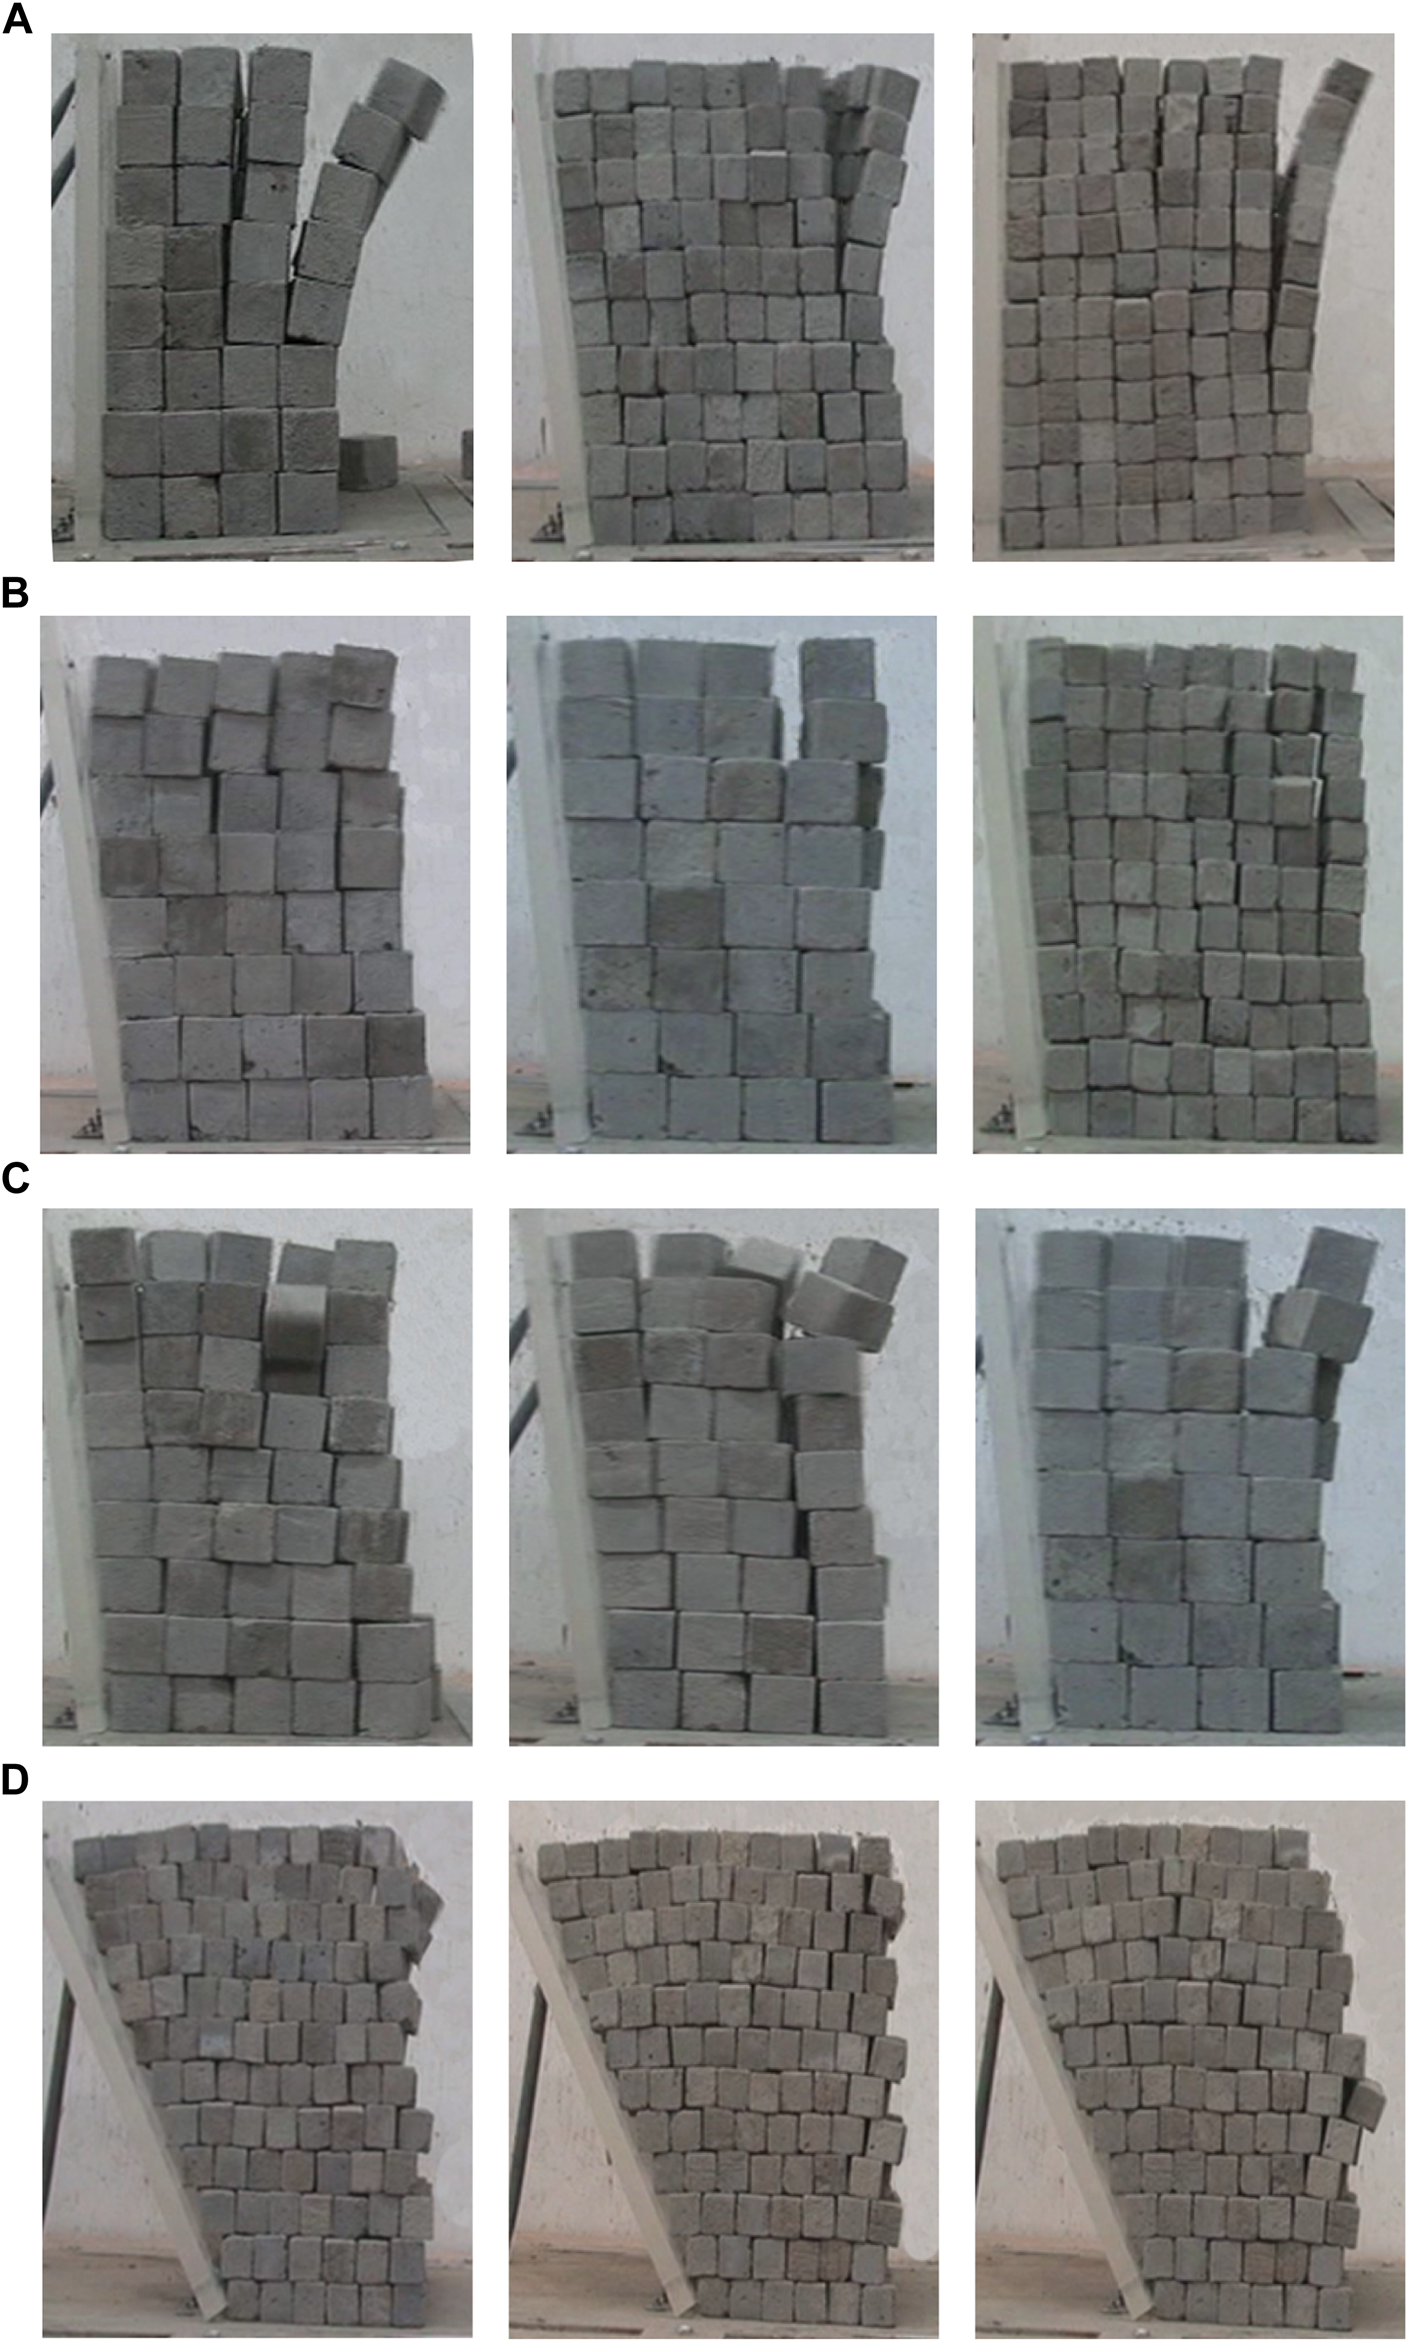
Failure motion patterns of dangerous rock block during shaking table experiments. (A) Rotational motion pattern of sequential collapse. (B) Translational motion pattern of sequential collapse. (C) Hybrid motion pattern of sequential collapse. (D) Sliding and exfoliation failure pattern.
4.2 Displacement time-history analysis
The displacement time-history curve of the top blocks of the outermost stack is represented as the failure process of sequential collapse. The displacement-time curves in the model experiments of different schemes, including block size, stack height, joint dip, and seismic wave acceleration, are plotted in Figures 9–12. From these plots, it can be found that the horizontal displacement of the rock mass is greater than the vertical displacement and the failure characteristics indicate collapse damage rather than sliding damage. Meanwhile, the trend of displacement varies with the experimental conditions. Here, the moment of accelerated displacement is defined as the critical failure state of the sequential collapse. The black-filled points in these plots are defined as the moments of critical failure states, as the trend of displacement changes into a linear acceleration period after passing through these points.
FIGURE 9
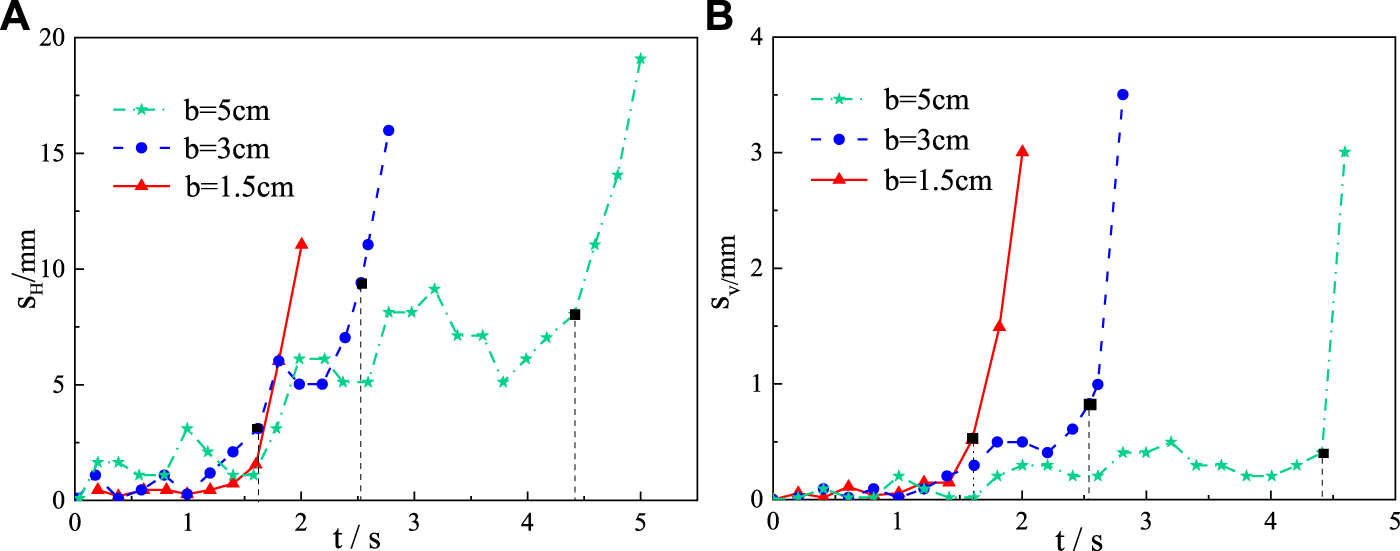
Displacement time-history curves under different rock block sizes. (A) Horizontal displacement. (B) Vertical displacement.
Figure 9 shows the displacement time-history curves of the top rock blocks of the outermost stack for the block size (b) of 1.5, 3, or 5 cm, respectively, a stacking height of 30 cm, the joint dips of 90°, and seismic wave acceleration of 0.1 g. In the critical failure state, the unstable time of the block of size 5.0 cm is relatively longer than that of the block of 1.5 cm. However, the time when the block of size 3 cm reaches the critical instability state is between 5.0 cm and 1.5 cm. The vertical displacements at critical failure state are essentially the same for different block sizes. The horizontal displacement at the critical failure state increases with the increase of the block size. The ratios between height and block for the model tests were 6, 10, and 20, respectively. When the ratio of stack height to block size increased, the test results indicated that the overall stability of the model was lower.
Figure 10 displays the displacement time-history curves of the rock masses at the top outermost edge of the model at the 90°, with joint inclinations of 80°, 70°, and 60°, when the block size is 3 cm, while the model stacking height is 30 cm with a seismic wave acceleration of 0.1 g. In the critical failure state, the time to approach the critical failure state is shorter as the joints are inclined at larger angles. For the experiments with different joint angles, the changing pattern of vertical displacements in the critical failure state is similar. The calculation results demonstrate that when the joint inclination is 90°, the dangerous rock mass is in an upright state, and the stability of the test model is the worst, in which the rock blocks at the top of the stacked layer are extremely susceptible to rockfall. When the joint dip angle is greater than 80°, the sensitivity of the stacked layer stability is higher, which is easily influenced by external induced factors.
FIGURE 10
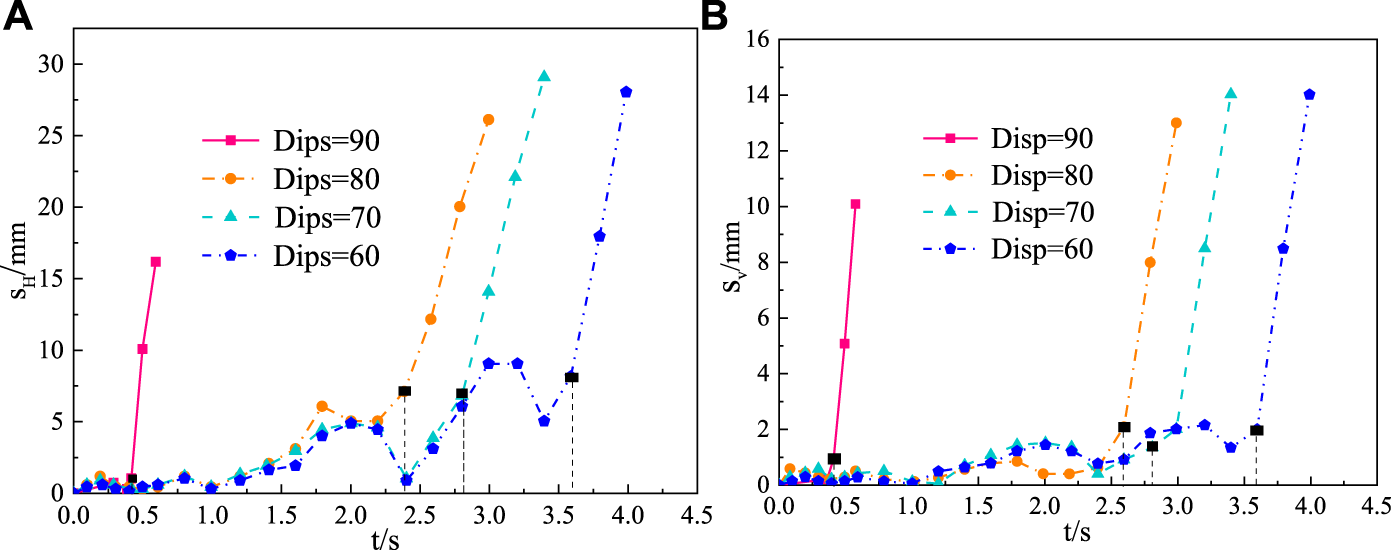
Displacement time-history curves for different joint dips. (A) Horizontal displacement. (B) Vertical displacement.
Figure 11 presents the displacement time-history curves of rock blocks of the outermost top of the stack with heights of 27 cm, 30 cm, 33 cm, and 36 cm when the block size is 3 cm, the joint inclination is 90°, and the seismic wave acceleration is 0.1 g. The critical instability time at different model stacking heights decreases with increasing stacking height, and it can also be noticed that the trends of horizontal and vertical displacements in the critical failure state are also basically the same. Therefore, the failure time is significantly affected by the model stacking height, but not by the displacement values. Based on the calculated results in Figure 11, the ratios between model stack height and rock block size are 9, 10, 11, and 12, respectively. In comparison with the results for the effect of rock block size, that is, comparing the differences between Figures 9A, 11A, it is clear that the stability of the model stack is relatively less affected by the ratio between height and rock block size.
FIGURE 11
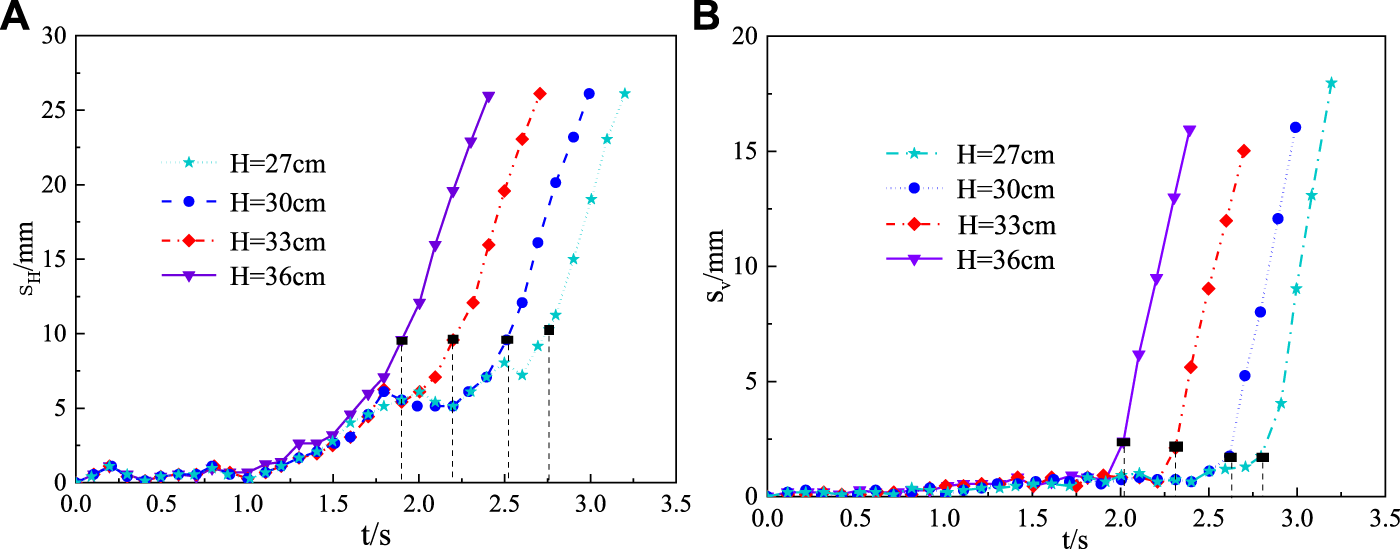
Displacement time-history curves under different stacking heights. (A) Horizontal displacement. (B) Vertical displacement.
The seismic accelerations are set to 0.05 g, 0.1 g, and 0.2 g, respectively, and the rock block size is given as 3 cm, the joint inclination as 90, and the stack height as 30 cm. At this time, the displacement-time variation curve of the outermost top block of the model stack is plotted in Figure 12. At the critical failure state, the failure time decreases with increasing seismic wave acceleration. The horizontal and vertical displacements are essentially similar change patterns for experiments with different seismic accelerations. It is indicated that varying seismic accelerations affect not only the critical failure time but also the displacement value at the critical failure state.
FIGURE 12
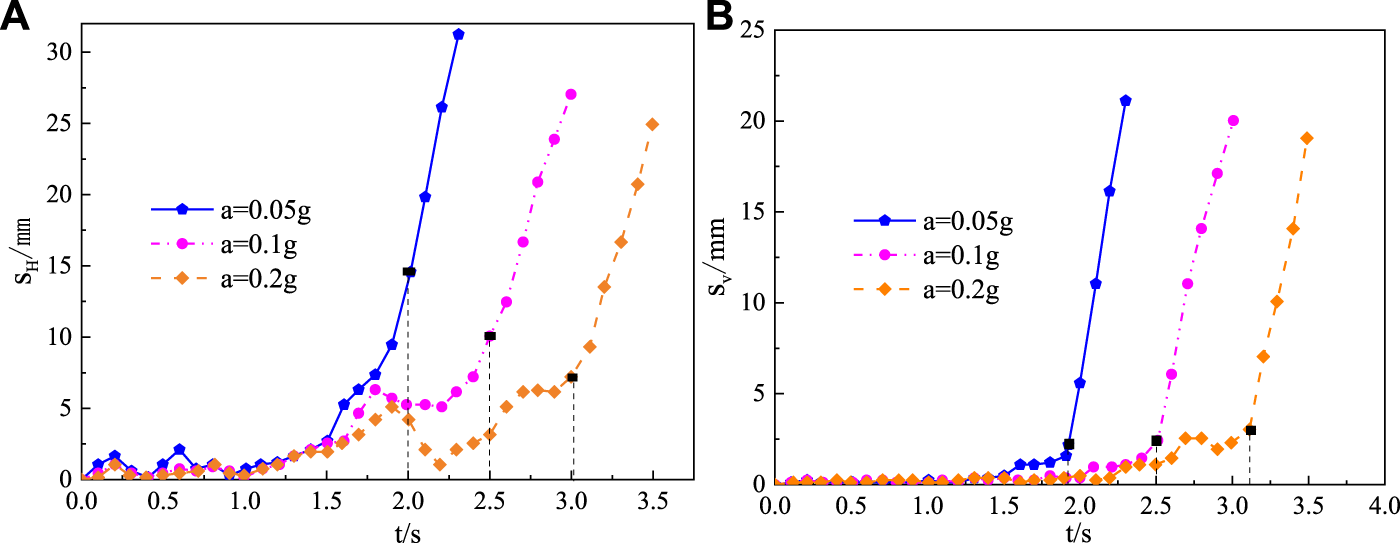
Displacement time-history curves under different seismic accelerations. (A) Horizontal displacement. (B) Vertical displacement.
4.3 Displacement and failure form analysis
According to the failure time corresponding to the critical failure state, the horizontal displacements as a function of the outermost model stacking height represent the failure form at the critical failure state (Figure 13). In Figure 13A, the failure form varies gradually with increasing stacking height, and the ratio of model stacking height to rock block size affects the maximum displacement of the topmost rock block of the stacking. Given the model stack height, seismic acceleration, and steepest joint inclination, the rockfall of the dangerous rock mass at the top of the model became more and more obvious as the rock block size increased. When the value of b is 5 cm, the horizontal deformation reaches up to 65 mm, and the rock avalanches phenomenon occurs, as indicated in Figure 13B. It can be seen from Figure 13C, the difference of different seismic accelerations on the form of failure is relatively small, but the influence of earthquakes on the horizontal displacement of rock blocks and falling rocks is comparatively large, which is a highly sensitive influence factor in rock avalanche damage. Due to the gradual increase of the joint inclination, the failure mode of the model changes from cascading collapse to sliding or exfoliation failure, which can be seen in Figure 13D, when the joint inclination increases to 90°, the experimental model is about to have rock avalanche and falling block phenomenon.
FIGURE 13
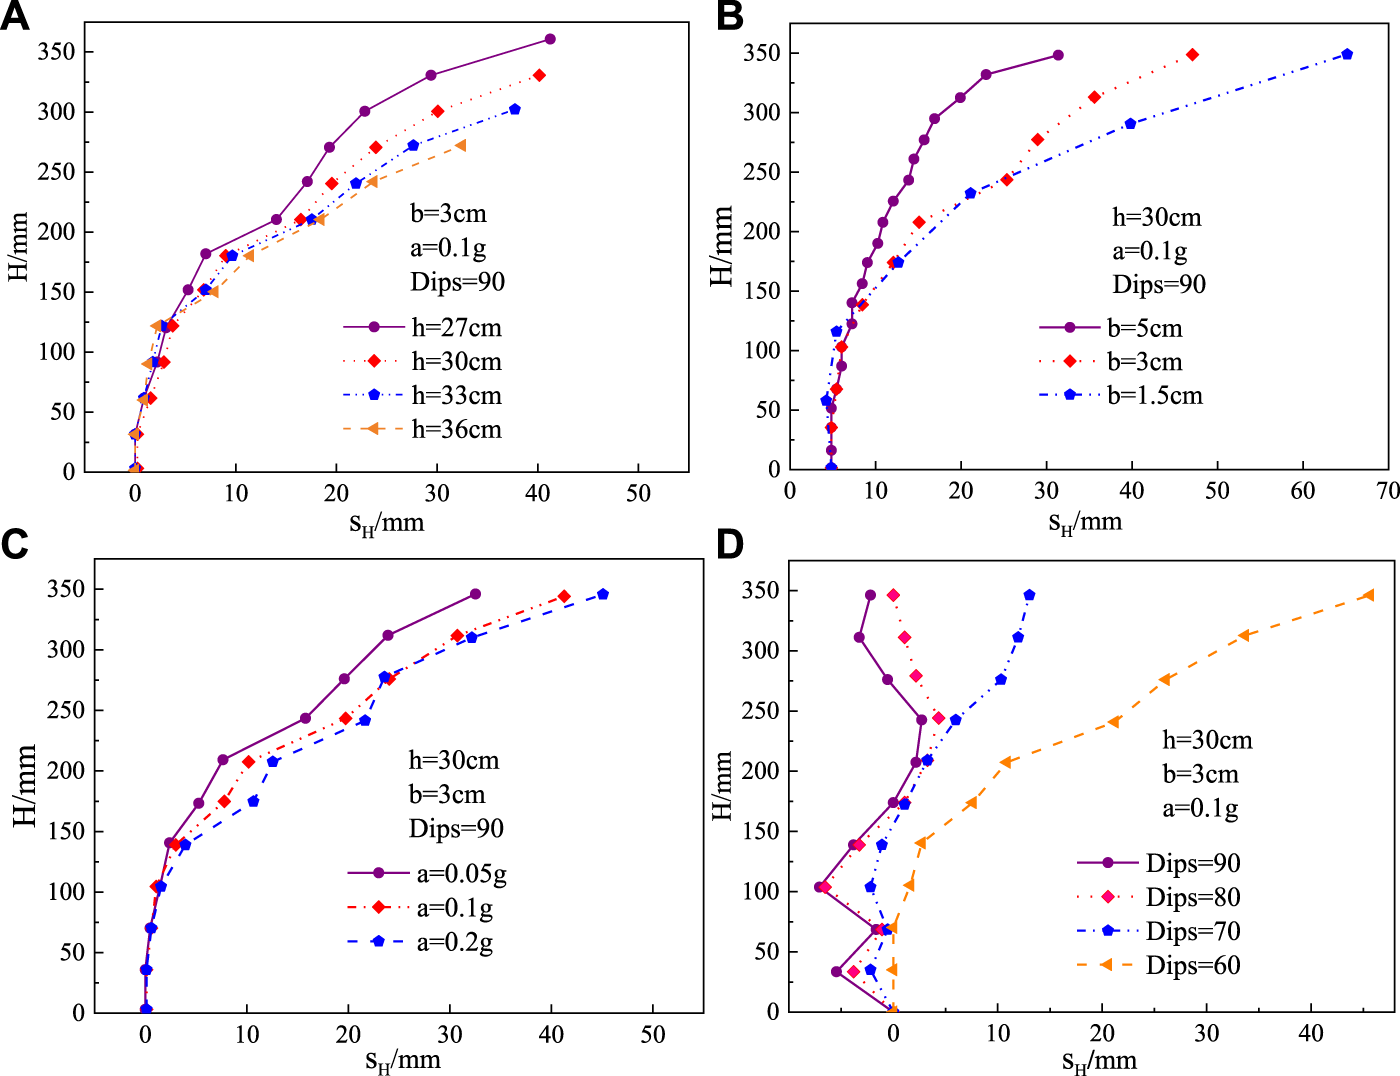
Displacement forms at critical failure state. (A) Different stacking heights. (B) Different block sizes. (C) Different seismic accelerations. (D) Different joint dips.
5 Analytical solutions of the sequential collapse
Growth in the undercutting of the cliff toe eventually causes rock avalanche failure, which is caused by earthquake load, and the secondary failure modes may the cascading collapses and sliding or exfoliation failure. The motion patterns observed in these destabilization damages are mainly translational motion and rotational motion and the translational and rotational motion destabilization patterns. Therefore, based on the limit equilibrium state, the mechanical mechanisms of the maximum translational and rotational motion patterns of the test model are established, as presented in Figure 14.
FIGURE 14
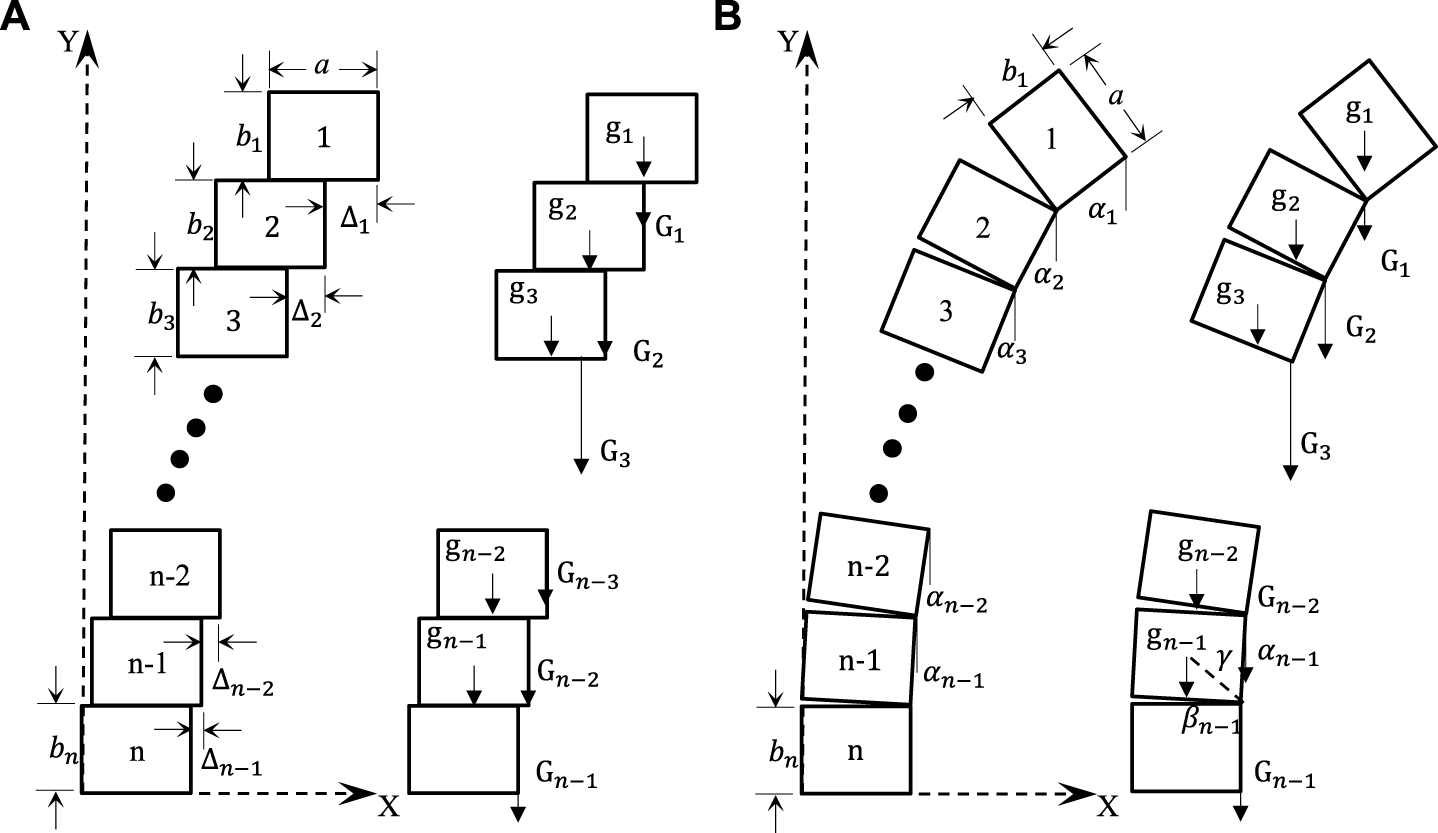
Translational and rotational motion patterns of the mechanical mechanisms. (A) Translational motion pattern. (B) Rotational motion pattern.
5.1 The translational motion pattern
From Figure 14A, the mechanical equations for the translational motion mode are deduced from the translational motion limit equilibrium state and its corresponding mechanical motion relations. It is assumed that the distance between the slope surface and the joint is , the thickness of rock strata are , where, indicate the numbering of rock blocks from top to bottom, and are relative displacements between -th and -1-th rock block, are the gravitational forces corresponding to rock blocks numbering from top to bottom, and are the resultant force of the corresponding rock blocks.
The limit equilibrium state of translational motion between the first and second blocks is that the center of gravity of the first block is not beyond the edge of the second block. Then, the limit of motion equilibrium relationship between the second and third blocks is that the direction of gravity of the first two blocks will not exceed the edge of the third block. By that analogy, the limit equilibrium relationship of translational motion between the (n-1)-th and the nth block is that the final direction of gravity from the first block to the (n-1)-th block extends no further than the outermost side of the nth block. This implies that the resultant force of the experimental model is consistently located at the edge of the next block. Consequently, the expression of is as follows.
Therefore,
It is supposed that and are the horizontal and vertical displacements of the first block on the top of the rock cliff in the translation motion pattern. is the number of rock blocks from the top to the bottom of the rock cliffs. The formulas of and can be derived as follows.When unit weights of the rock blocks are identical, and , Eqs 6, 7 can be deduced as below.
5.2 The rotational motion pattern
From Figure 14B, the mechanical equations for the rotation motion mode are deduced from the translational motion limit equilibrium state and its corresponding mechanical motion relations. Assuming that the physical definitions of , , , and have the same meaning as those of the translational motion pattern in Figure 14A. Where are the relative rotation angles between the ith and i-1-th blocks.
The limit equilibrium relationship of rotational motion between the first and second block is that the extension of the direction of gravity of the first rock block must cross the upper right corner of the second one. The limit equilibrium relationship of rotational motion between the second and third blocks is that the extension line of the direction of the resultant force of the first two rock blocks should pass through the upper right corner of the third one. Concurrently, the limit equilibrium relationship of rotational motion between the (n-1)-th and nth rock blocks is that the extension of the direction of the resultant force from the first block to the (n-1)-th block would have to pass through the upper right corner of the nth rock block. This indicates that the extension of the direction of the resultant force of gravity must cross the upper right corner of the next adjacent rock block. From the law of conservation of energy, the equation of is typicallyThen,
The horizontal and vertical displacements ( and ) of the first rock block at the top of the cliff relative to the nth block at the cliff bottom in the rotational motion mode can be attained by averaging the relative rotation angles surrounding the selected nth rock blocks in the selected experimental model. is the number of blocks from the block on the top of the cliff to the bottom of the cliff. The formula of and are expressed as follows:
Hence, when the rock avalanche develops with the combined effect of gravity and seismic forces, and accordingly, Eqs 13–15 can be summarized as follow:
In conclusion, the distance between the joints and the slope surface, the thickness of the rock stratum and the number of rock blocks are the three influencing factors that have the greatest impact on horizontal and vertical displacements in rock avalanche damage.
6 Validation of analytical solutions using seismic-induced rockfall experiments
Physical experiments play a significant role in gaining a better understanding of the propagation mechanisms and factors influencing the topography and failure characteristics of rock avalanches. The results of these physical experiments and analytical solutions have revealed the failure mechanisms of rock avalanches. Assuming that all the thicknesses of rock strata are identical, and the distance between the joint and slope surfaces equals the stratum thickness. Therefore, . When , Eqs 9, 16 read as follow:
Eqs 19, 20 are substituted into Eqs 10, 17, 18, the expressions for , and then can be summarized:When , Eqs 21–23 read as follow:
Equations 25–27 represent the horizontal and vertical displacements of the rock block in the limit equilibrium state of translational and rotational motions. In the comparative verification, when there are translation and rotation motion modes in rock avalanche failure, the size of the rock mass and the stacking height of the model are selected as the verification objects for analysis in the physical experimental model. Based on the parameters of the corresponding experiments and given b=3cm, the displacements of the rock blocks for the translational and rotational motion patterns under the limit equilibrium state are deduced from the analytical solutions as illustrated in Figures 15, 16.
FIGURE 15

Displacement variation of rock blocks of the translational motion in the limit equilibrium state. (A) Different stacking heights of rock blocks. (B) Different rock block sizes.
FIGURE 16
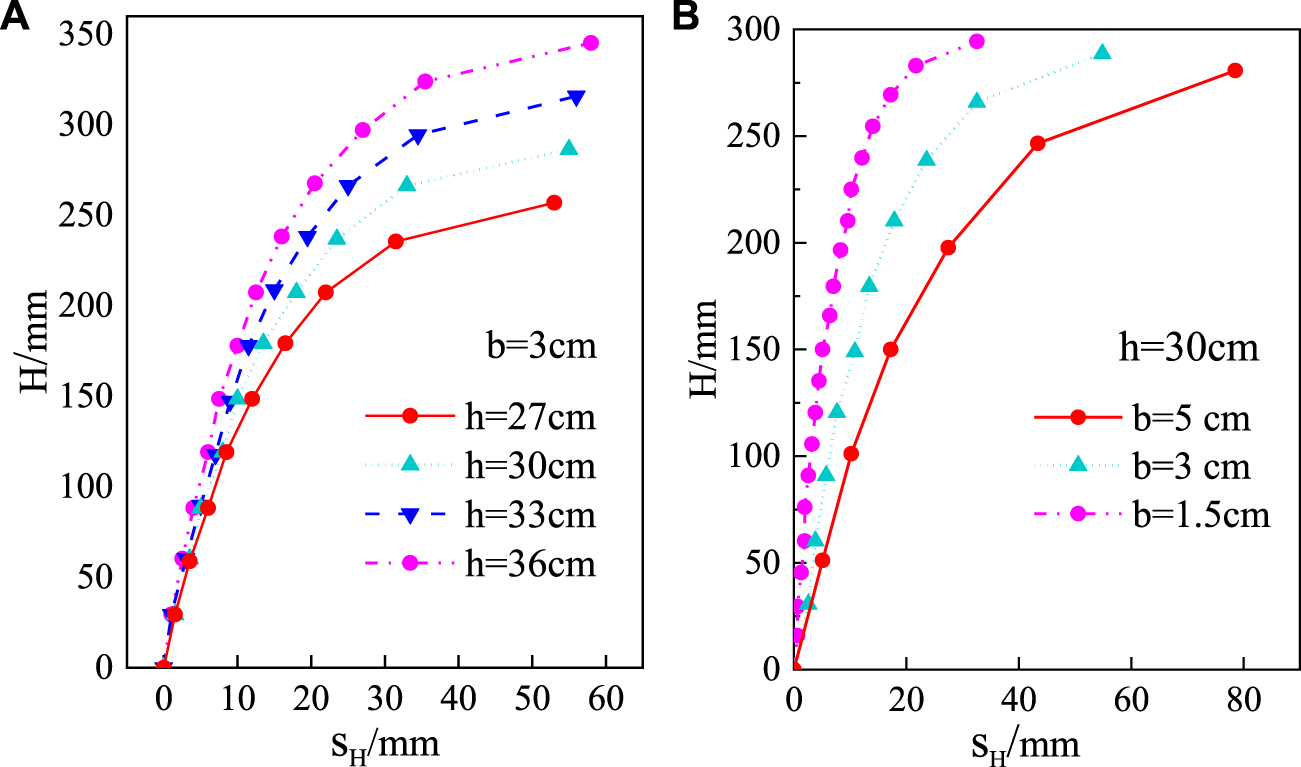
Displacement variation of rock blocks of the rotation motion in the limit equilibrium state. (A) Different stacking heights of rock blocks. (B) Different sizes of blocks.
It can be seen that the horizontal displacement value of the rock blocks in the horizontal motion pattern is about 40 mm, whereas the horizontal displacement of the rock blocks in the rotational motion pattern is significantly larger than the horizontal motion, and the variation range of its value is about 28 mm–58 mm, and the maximum value is not more than 60 mm. For different rock block stacking heights, the displacements of the rock block at the top of the rock cliff increase slightly with increasing block stacking height, while the displacement for the same block stacking height decreases significantly with increasing block height. In both horizontal and rotational motion modes, the displacement of the cliff top block increases significantly with increasing block size, as shown in Figures 15, 16.
Figure 17 shows the comparison results between the measured displacements of the model experiments and the predicted displacements of the analytical solutions in translational and rotational motion patterns. The results of the comparison between the analytical solution and the model experiments include simultaneously the translational motion pattern, the rotational motion pattern, or the mixed pattern of rotation and translation and rotation for the cascade collapse. At the same given scale and test conditions, the rock block displacements for rotational motion are usually larger than those for translational motion. The differences in displacement between translational and rotational motion become progressively smaller as the size of the rock blocks decreases. When and , the trend curves of the translational and rotational motion patterns begin to gradually overlap. From Figure 17, all experimental displacement curves in the critical damage state exist near or between the displacement curves in the limit equilibrium state of translational and rotational motions. This result implies that the analytical solution can effectively solve the critical failure state of the critical rock cascade reaction at the rock cliff. There are several rock blocks in the experiment whose displacements exceed the corresponding displacements in the analytical solutions, indicating partial damage to the corresponding rock blocks.
FIGURE 17
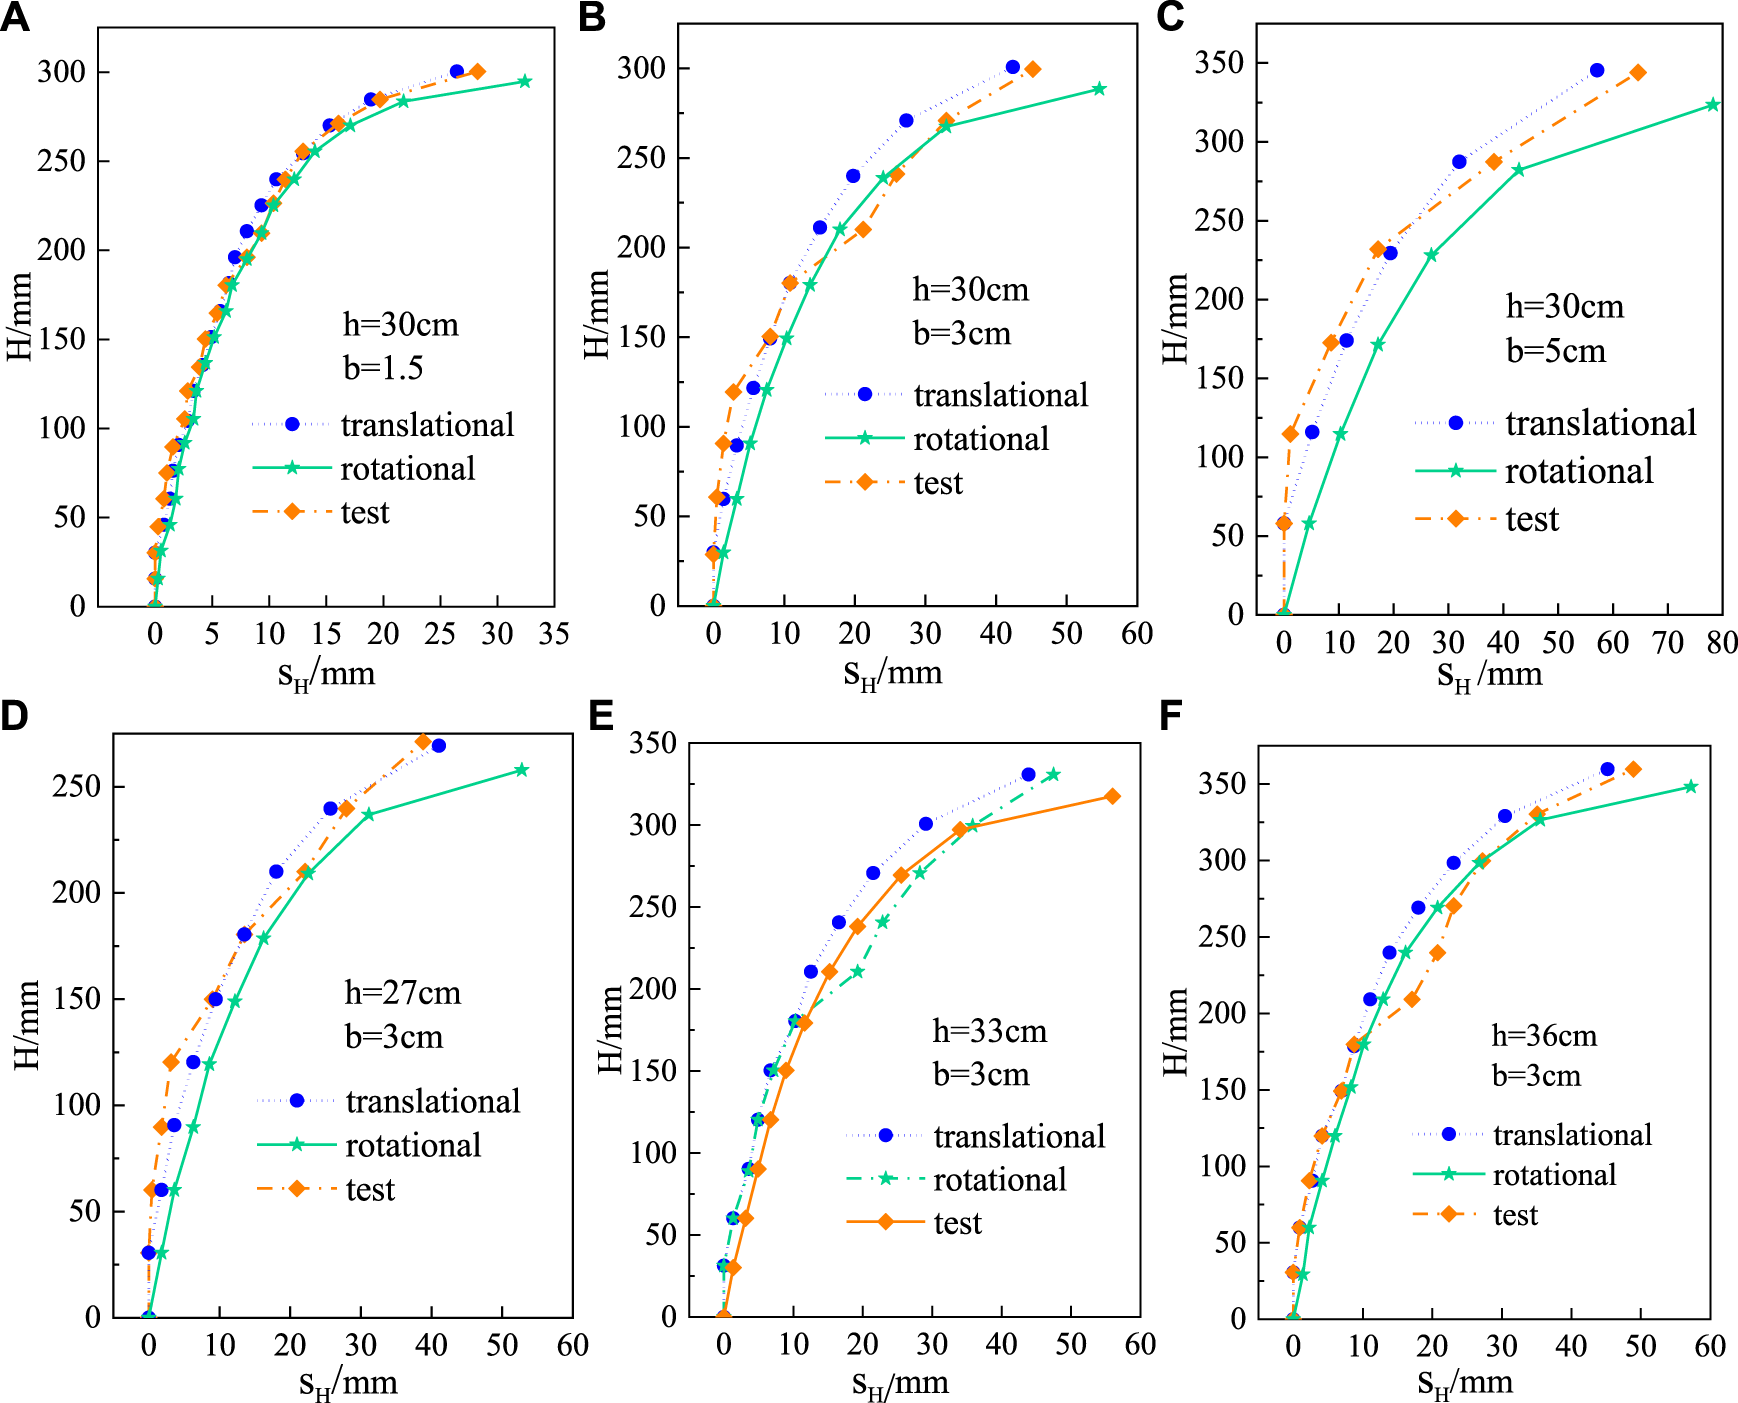
Comparison results of between model experimental and analytical solutions. (A)h = 30 cm; b = 1.5 cm. (B)h = 30 cm; b = 3 cm. (C)h = 30 cm; b = 5 cm. (D)h = 27 cm; b = 3 cm. (E)h = 33 cm; b = 3 cm. (F)h = 36 cm; b = 3 cm.
7 Conclusion
The physical model experiment and analytical solutions are conducted to investigate the critical failure characteristics of the earthquake-induced sequential rock avalanche of the dangerous rocks at cliffs, and in particular the failure motion mechanisms of the cascading collapse. Several conclusions have been drawn as follows:
1) This paper conducts a laboratory analog experiment illustrating the characteristic processes of sequential collapse for the rock avalanche with the seismic load in the laboratory, which indicated that the variable seismic accelerations affect not only the critical failure time but also the sequential displacement behaviors at the critical failure state.
2) The earthquake-induced rock avalanche had several topographical features and structural damages, with significant variation in spatial distribution: cascading collapses, sliding, or exfoliation failure.
3) The physical experiments and analytical solution analyses show that from the kinematic perspective, the main rock blocks that fail during the cascading collapses are characterized by translational and rotational motion patterns or mixed motion of translational and rotational.
4) The significant influence factors of an earthquake-induced rock avalanche on the failure mechanism and movement mode are highlighted. The most important influencing factor that elucidate the different motion patterns leading to avalanche development are presented. The transformed motion pattern is controlled by the ratio between the model stacking height and the rock block size and the seismic acceleration. Whereas the rotational motion pattern is mainly influenced by the nodal dip angle, model stacking height, and seismic acceleration.
5) In this paper, the limit equilibrium mechanical states of translational and rotational motion are proposed, and the limit equilibrium formulas for these two motion patterns in the destabilization damage process are derived. Comparing the analytical solution with the results of physical experiments, it is demonstrated that the proposed analytical solution can accurately solve the critical failure state of sequential collapse of dangerous rocks at cliffs in a rock avalanche.
Statements
Data availability statement
The original contributions presented in the study are included in the article/Supplementary Material, further inquiries can be directed to the corresponding author.
Author contributions
SG: Methodology, software, writing-original draft, visualization. YL: Investigation, data curation, software, writing-original draft. PZ: Supervision, conceptualization, methodology, funding acquisition. RZ: Visualization, Writing-review and editing. YQ: Formal analysis, data curation.
Funding
The authors gratefully acknowledge the support of the National Nature Science Foundation of China (NSFC NO. 41372295 and NO. 41102178); the Fellowship of China Postdoctoral Science Foundation (NO. 2021M701688); outstanding Postdoctoral Fellowship of Jiangsu Foundation (NO. 283762); Science and Technology Planning Project of Jiangsu Province (Grant No. BE2022605).
Conflict of interest
The authors declare that the research was conducted in the absence of any commercial or financial relationships that could be construed as a potential conflict of interest.
Publisher’s note
All claims expressed in this article are solely those of the authors and do not necessarily represent those of their affiliated organizations, or those of the publisher, the editors and the reviewers. Any product that may be evaluated in this article, or claim that may be made by its manufacturer, is not guaranteed or endorsed by the publisher.
References
1
Aaron J. Hungr O. (2016). Dynamic analysis of an extraordinarily mobile rock avalanche in the Northwest Territories, Canada. Can. Geotech. J.53, 899–908. 10.1139/cgj-2015-0371
2
Aaron J. McDougall S. (2019). Rock avalanche mobility: The role of path material. Eng. Geol.257 (6), 105126. 10.1016/jenggeo.2019.05.003
3
An H. C. Ouyang C. J. Zhou S. (2021). Dynamic process analysis of the Baige landslide by the combination of DEM and long-period seismic waves. Landslides18 (5), 1625–1639. 10.1007/s10346-020-01595-0
4
Baggio T. Mergili M. D'Agostino V. (2021). Advances in the simulation of debris flow erosion: The case study of the Rio Gere (Italy) event of the 4th August 2017. Geomorphology381, 107664. 10.1016/j.geomorph.2021.107664
5
Bergillos R. J. Rodriguez-Delgado C. Medina L. Fernandez-Ruiz J. Rodriguez-Ortiz J. M. Iglesias D. (2022). A combined approach to cliff characterization: Cliff Stability index. Mar. Geol.444, 106706. 10.1016/j.margeo.2021.106706
6
Chen G. Zen K. Zheng L. Jiang Z. (2010). A new model for long-distance movement of earthquake induced landslide. The 44th U.S. Symposium on Rock Mechanics, Salt Lake City, UT, USA. June 27, 2010
7
Chen H. Crosta G. B. Lee C. F. (2006). Erosional effects on runout of fast landslides, debris flows and avalanches: A numerical investigation. Geotechnique56 (5), 305–322. 10.1680/geot.2006.56.5.305
8
Chen Z. Y. Chen W. Li Y. Y. Yuan Y. (2016). Shaking table test of a multi-story subway station under pulse-like ground motions. Soil Dyn. Earthq. Eng.82, 111–122. 10.1016/j.soildyn.2015.12.002
9
Do T. N. Wu J. (2020). Simulating a mining-triggered rock avalanche using dda: A case study in nattai north, Australia. Eng. Geol.264, 105386. 10.1016/j.enggeo.2019.105386
10
Donati D. Stead D. Brideau M. A. Ghirotti M. (2021). Using pre-failure and post-failure remote sensing data to constrain the three-dimensional numerical model of a large rock slope failure. Landslides18, 827–847. 10.1007/s10346-020-01552-x
11
Dong J. Y. Wang C. Huang Z. Q. Yang J. H. Xue L. (2022). Shaking table model test to determine dynamic response characteristics and failure modes of steep bedding rock slope. Rock Mech. Rock Eng.55, 3645–3658. 10.1007/s00603-022-02822-x
12
Dufresne A. Prager C. Bösmeier A. (2016). Insights into rock avalanche emplacement processes from detailed morpho-lithological studies of the Tschirgant deposit (Tyrol, Austria). Earth Surf. Process. Landf.41, 587–602. 10.1002/esp.3847
13
Erismann T. H. Abele G. Glade T. (2001). Dynamics of rock slides and rockfalls. Z Geomorphol.54 (2), 268–269. 10.1007/978-3-662-04639-5
14
Fan X. M. Domènech G. Scaringi G. Huang R. Q. Xu Q. Hales T. C. et al (2018). Spatio-temporal evolution of mass wasting after the 2008 Mw 7.9 Wenchuan earthquake revealed by a detailed multi-temporal inventory. Landslides15 (12), 2325–2341. 10.1007/s10346-018-1054-5
15
Fan X. M. Scaringi G. Korup O. West A. J. van Westen C. J. Tanyas H. et al (2019). Earthquake-induced chains of geologic hazards: Patterns, mechanisms, and impacts. Rev. Geophys.57 (2), 421–503. 10.1029/2018RG000626
16
Fan X. M. Scaringi G. Xu Q. Zhan W. W. Dai L. X. Li Y. S. et al (2018). Coseismic landslides triggered by the 8th August 2017 M s 7.0 Jiuzhaigou earthquake (Sichuan, China): Factors controlling their spatial distribution and implications for the seismogenic blind fault identification. Landslides15, 967–983. 10.1007/s10346-018-0960-x
17
Flor-Blanco G. Bruschi V. Adrados L. Domínguez-Cuesta M. J. Gracia-Prieto F. J. Llana-Fúnez S. et al (2022). Geomorphological evolution of the calcareous coastal cliffs in North Iberia (Asturias and Cantabria regions). Estuar. Coast. Shelf Sci.273, 107913. 10.1016/j.ecss.2022.107913
18
Gao G. Meguid M. A. Chouinard L. E. Xu C. (2020). Insights into the transport and fragmentation characteristics of earthquake-induced rock avalanche: Numerical study. Int. J. Geomech.20 (9), 04020157. 10.1061/(ASCE)GM.1943-5622.0001800
19
Gong Y. F. Yao A. J. Li Y. L. Tian T. (2022). Classification and distribution of large-scale high-position landslides in southeastern edge of the Qinghai-Tibet Plateau, China. Environ. Earth Sci.81, 311. 10.1007/s12665-022-10433-6
20
Gorum T. Fan X. M. van Western C. J. Huang R. Q. Xu Q. Tang C. et al (2011). Distribution pattern of earthquake-induced landslides triggered by the 12 May 2008 Wenchuan earthquake. Geomorphology133, 152–167. 10.1016/j.geomorph.2010.12.030
21
Gorum T. Fan X. van Westen C. J. Huang R. Xu Q. Tang C. et al (2011). Distribution pattern of earthquake-induced landslides triggered by the 12 May 2008 Wenchuan earthquake. Geomorphology133 (3-4), 152–167. 10.1016/j.geomorph.2010.12.030
22
Guo S. F. Griffiths D. V. (2020a). Failure mechanisms in two-layer undrained slopes. Can. Geotech. J.57 (10), 1617–1621. 10.1139/cgj-2019-0642
23
Guo S. F. Li N. Liu C. Liu N. F. Liu W. P. (2020b). Unraveling the progressive failure behaviors and mechanisms of the slope with a local dynamic method based on the double strength reduction. Int. J. Geomech.20 (6), 04020069–04020111. 10.1061/(ASCE)GM.1943-5622.0001693
24
Guo S. F. Li N. Liu W. P. Ma Z. Y. Lv G. (2020c). Influence of both soil properties and geometric parameters on failure mechanisms and stability of two-layer undrained slopes. Adv. Mater. Sci. Eng.2020 (3), 1–13. 10.1155/2020/4253026
25
Guo S. F. Xu P. W. Zhang P. Wang S. N. (2021). Numerical investigation of the anti-infiltration and anti-erosion performance of composite layers mixed with polyacrylamide and basalt fibre for the protection of silt subgrade slopes. Front. Earth Sci. (Lausanne).10, 815602. 10.3389/feart.2022.815602
26
Hilger P. Gosse J. C. Hermanns R. L. (2019). How significant is inheritance when dating rockslide boulders with terrestrial cosmogenic nuclide dating?—A case study of an historic event. Landslides16, 729–738. 10.1007/s10346-018-01132-0
27
Hushmand A. Dashti S. Davis C. McCartney J. S. Hushmand B. (2016). A centrifuge study of the influence of site response, relative stiffness, and kinematic constraints on the seismic performance of buried reservoir structures. Soil Dyn. Earthq. Eng.88, 427–438. 10.1016/j.soildyn.2016.06.011
28
Kuo C. Chang K. Tsai P. Wei S. Chen R. Dong J. et al (2015). Identification of co-seismic ground motion due to fracturing and impact of the Tsaoling landslide, Taiwan. Eng. Geol.196, 268–279. 10.1016/j.enggeo.2015.07.013
29
Liu N. F. Li N. Li G. F. Song Z. P. Wang S. J. (2022). Method for evaluating the equivalent thermal conductivity of a freezing rock mass containing systematic fractures. Rock Mech. Rock Eng.55, 7333–7355. 10.1007/s00603-022-03038-9
30
Liu N. F. Li N. Wang S. J. Li G. F. Song Z. P. (2022). A fully coupled thermo-hydro-mechanical model for fractured rock masses in cold regions. Cold Reg. Sci. Technol.205 (7), 103707–103713. 10.1016/j.coldregions.2022.103707
31
Liu N. F. Li N. Xu C. B. Li G. F. Song Z. P. Yang M. (2020). Mechanism of secondary lining cracking and its simulation for the dugongling tunnel. Rock Mech. Rock Eng.53, 4539–4558. 10.1007/s00603-020-02183-3
32
Ma K. Liu G. Xu N. Zhang Z. Feng B. (2021). Motion characteristics of rockfall by combining field experiments and 3D discontinuous deformation analysis. Int. J. Rock Mech. Min. Sci. (1997).138, 104591. 10.1016/j.ijrmms.2020.104591
33
Marc O. Hovius N. Meunier P. (2016). The mass balance of earthquakes and earthquake sequences. Geophys. Res. Lett.43, 3708–3716. 10.1002/2016GL068333
34
Matasci B. Stock G. M. Jaboyedoff M. Carrea D. Collions B. D. Guérin A. et al (2018). Assessing rockfall susceptibility in steep and overhanging slopes using three-dimensional analysis of failure mechanisms. Landslides15, 859–878. 10.1007/s10346-017-0911-y
35
Mitchell A. Allstadt K. E. George D. Aaron J. McDougall S. Moore J. et al (2022). Insights on multistage rock avalanche behavior from runout modeling constrained by seismic inversions. JGR. Solid Earth127 (10). 10.1029/2021JB023444
36
Moretti L. Allstadt K. Mangeney A. Capdeville Y. Stutzmann E. Bouchut F. (2015). Numerical modeling of the Mount Meager landslide constrained by its force history derived from seismic data. J. Geophys. Res. Solid Earth120 (4), 2579–2599. 10.1002/2014JB011426
37
Moretti L. Mangeney A. Walter F. Capdeville Y. Bodin T. Stutzmann E. et al (2020). Constraining landslide characteristics with Bayesian inversion of field and seismic data. Geophys. J. Int.221 (2), 1341–1348. 10.1093/gji/ggaa056
38
Ouyang C. J. An H. C. Zhou S. Wang Z. W. Su P. C. Wang D. P. et al (2019). Insights from the failure and dynamic characteristics of two sequential landslides at Baige village along the Jinsha River, China. Landslides16, 1397–1414. 10.1007/s10346-019-01177-9
39
Paguican E. M. R. Vries W. Lagmay A. M. F. (2014). Hummocks: How they form and how they evolve in rockslide-debris avalanches. Landslides11, 67–80. 10.1007/s10346-012-0368-y
40
Panah A. K. Eftekhari Z. (2021). Shaking table tests on polymeric-strip reinforced-soil walls adjacent to a rock slope. Geotext. Geomembranes49 (3), 737–756. 10.1016/j.geotexmem.2020.12.005
41
Qin Y. W. Chen Y. H. Lai J. X. Qiu J. L. Yang T. Liu T. (2023). Loess landslide-tunnel system: A systematic review of its failure characteristics, interaction mechanism and countermeasures. Eng. Geol.
42
Sanders D. Wallner M. Pomella H. (2021). Medieval age determined for the hitherto undescribed/undated rock avalanche of Münster (Inn valley, Eastern Alps). Geomorphology389, 107802. 10.1016/j.geomorph.2021.107802
43
Singeisen C. Ivy-Ochs S. Wolter A. Steinemann O. Akcar N. Yesilyurt S. et al (2020). The kandersteg rock avalanche (Switzerland): Integrated analysis of a late holocene catastrophic event. Landslides17, 1297–1317. 10.1007/s10346-020-01365-y
44
Srilatha N. Latha G. M. Puttappa C. G . (2013). Effect of frequency on seismic response of reinforced soil slopes in shaking table tests. Geotext. Geomembranes36, 27–32. 10.1016/j.geotexmem.2012.10.004
45
Togo T. Shimamoto T. Dong J. J. Lee C. T. Yang C. M. (2014). Triggering and runaway processes of catastrophic Tsaoling landslide induced by the 1999 Taiwan Chi-Chi earthquake, as revealed by high-velocity friction experiments. Geophys. Res. Lett.41, 1907–1915. 10.1002/2013GL059169
46
Xu C. S. Jiang Z. W. Du X. L. Shen Y. Y. Chen S. (2021). 1-g shaking table tests of precast horseshoe segmental tunnel: Experimental design, dynamic properties, deformation mode and damage pattern. Tunn. Undergr. Space Technol.113 (7), 103976. 10.1016/j.tust.2021.103976
47
Yang G. X. Qi S. W. Wu F. Q. Zhan Z. F. (2017). Seismic amplification of the anti-dip rock slope and deformation characteristics: A large-scale shaking table test. Soil Dyn. Earthq. Eng.115 (3), 907–916. 10.1016/j.soildyn.2017.09.010
48
Yang H. F. Xing B. K. He J. K. Jiang H. Cheng Q. (2022). The formation mechanism and failure mode of a talus slope induced by rockfalls in Nayong County, Southwest China. Front. Earth Sci. (Lausanne).25. 10.3389/feart.2022.973528
49
Yang Y. S. Yu H. T. Yuan Y. Sun J. (2021). 1 g Shaking table test of segmental tunnel in sand under near-fault motions. Tunn. Undergr. Space Technol.115 (9), 104080. 10.1016/j.tust.2021.104080
50
Yang Z. P. Tian X. Jiang Y. W. Liu X. R. Hu Y. X. Lai Y. L. (2020). Experimental study on dynamic characteristics and dynamic responses of accumulation slopes under frequent microseisms. Arab. J. Geosci.13, 770. 10.1007/s12517-020-05781-1
51
Yin X. M. Zhang A. M. Wang L. A. Chen L. (2021). Instability modes and stability analysis of perilous rock groups with control fissures under the conditions of excavation and rainfall. Geotech. Geol. Eng. (Dordr).39, 2799–2821. 10.1007/s10706-020-01657-z
52
Yin X. M. Zhang X. Lei Y. J. Wang L. N. (2021). Effect of loading direction on the critical characteristic strength and energy evolution of quartz mica schist and microscale mechanisms. Bull. Eng. Geol. Environ.80, 8693–8710. 10.1007/s10064-021-02455-4
53
Zhao K. Wang Q. Z. Zhuang H. Y. Li Z. Y. Chen G. X. (2022). A fully coupled flow deformation model for seismic site response analyses of liquefiable marine sediments. Ocean. Eng.251 (4), 111144. 10.1016/j.oceaneng.2022.111144
54
Zeng Q. Zhang L. Davies T. Yuan G. Xue X. Wei R. et al (2019). Morphology and inner structure of Luanshibao rock avalanche in Litang, China and its implications for long-runout mechanisms. Eng. Geol.260, 105216. 10.1016/j.enggeo.2019.105216
55
Zhang D. F. Wang J. D. Qi L. R. Zhang Y. S. Ma J. F. Lu G. Y. (2022). Initiation and movement of a rock avalanche in the Tibetan plateau, China: Insights from field observations and numerical simulations. Landslides19, 2569–2591. 10.1007/s10346-022-01917-4
56
Zhang M. McSaveney M. Shao H. Zhang C. (2018). The 2009 Jiweishan rock avalanche, Wulong, China: Precursor conditions and factors leading to failure. Eng. Geol.233, 225–230. 10.1016/j.enggeo.2017.12.010
57
Zhang M. Yin Y. P. (2013). Dynamics, mobility-controlling factors and transport mechanisms of rapid long-runout rock avalanches in China. Eng. Geol.167, 37–58. 10.1016/j.enggeo.2013.10.010
58
Zhang Y. W. Song Z. P. Weng X. L. (2022b). A constitutive model for loess considering the characteristics of structurality and anisotropy. Soil Mech. Found. Eng.59, 32–43. 10.1007/s11204-022-09781-z
59
Zhang Y. B. Xing A. G. Jin K. P. Zhuang Y. Bilal M. Xu S. et al (2020b). Investigation and dynamic analyses of rockslide-induced debris avalanche in Shuicheng, Guizhou, China. Landslides17 (9), 2189–2203. 10.1007/s10346-020-01436-0
60
Zhang Y. W. Fan S. Y. Yang D. H. Zhou F. (2022a). Investigation about variation law of frost heave force of seasonal cold region tunnels: A case study. Front. Earth Sci.9, 806843. 10.3389/feart.2021.806843
61
Zhao T. Crosta G. B. Liu Y. (2022). Analysis of slope fracturing under transient earthquake loading by random discrete element method. Int. J. Rock Mech. Min. Sci. (1997).157, 105171. 10.1016/j.ijrmms.2022.105171
62
Zhu C. Huang Y. Sun J. (2020). Solid-like and liquid-like granular flows on inclined surfaces under vibration-Implications for earthquake-induced landslides. Comput. Geotech.123, 103598. 10.1016/j.compgeo.2020.103598
Summary
Keywords
earthquake-induced landslide, rock avalanches, critical morphological features, sequential collapse, rockfall, translation motion, rotation motion
Citation
Guo S, Liu Y, Zhang P, Zhu R and Qian Y (2023) Insight into the critical morphological characteristics of earthquake-induced sequential rock avalanches in weathered-fractured rock cliffs. Front. Earth Sci. 10:1101246. doi: 10.3389/feart.2022.1101246
Received
17 November 2022
Accepted
06 December 2022
Published
25 January 2023
Volume
10 - 2022
Edited by
Yuwei Zhang, Xi’an University of Architecture and Technology, China
Reviewed by
Jingmin Xu, Southeast University, China
Nan Zhang, Shandong University, China
Updates
Copyright
© 2023 Guo, Liu, Zhang, Zhu and Qian.
This is an open-access article distributed under the terms of the Creative Commons Attribution License (CC BY). The use, distribution or reproduction in other forums is permitted, provided the original author(s) and the copyright owner(s) are credited and that the original publication in this journal is cited, in accordance with accepted academic practice. No use, distribution or reproduction is permitted which does not comply with these terms.
*Correspondence: Peng Zhang, zhangpeng-mail@njtech.edu.cn
This article was submitted to Environmental Informatics and Remote Sensing, a section of the journal Frontiers in Earth Science
Disclaimer
All claims expressed in this article are solely those of the authors and do not necessarily represent those of their affiliated organizations, or those of the publisher, the editors and the reviewers. Any product that may be evaluated in this article or claim that may be made by its manufacturer is not guaranteed or endorsed by the publisher.