 Hongyan Li
 Xuege Wang
 Hongxu Wei
 Tingting Xia
 Mengnan Liu
 Shengshu Ai1,2
- 1School of Water Conservancy and Environment Engineering, Changchun Institute of Technology, Changchun, China
- 2Jilin Provincial Key Laboratory of Municipal Wastewater Treatment, Changchun Institute of Technology, Changchun, China
- 3Key Laboratory of Wetland Ecology and Environment, Research Group of Urban Forest and Wetland, Northeast Institute of Geography and Agroecology, Chinese Academy of Sciences, Changchun, China
- 4University of Chinese Academy of Sciences, Beijing, China
Interacting with aquatic environments in blue spaces is believed to benefit mental well-being. Relevant understanding is limited to regional pilot studies using self-reported emotions on questionnaires. We assessed emotional response by rating facial expressions on a large geographical scale with the purpose of detecting a relationship to microclimates. A total of 920 facial photographs were collected from Sina Weibo from 20 wetland parks in 14 eastern cities of China during 2020. Daily average air temperature, rainfall, average relative humidity (RH), and wind velocity were also recorded from the days when photographs were posted online. We found that happy expressions were higher in wetlands of eastern cities than in northern and inland cities. Sad expressions varied statistically among wetland locations. Weather records differed between temperate and subtropical climatic zones and were highly varied among cities. Happy and sad scores were driven by the change in average air temperature. Combined multivariable regression and binomial correlation suggested that increasing air temperature would not evoke positive emotions unless higher than 11.5°C, and an air temperature range of 17.5–22.3°C will be optimum to induce the presentation of a smiling face. Air humidity generally imposed a negative effect on expressions of positive emotions. Further verification of our findings is suggested on a larger geographical scale using more powerful big-data to obtain more robust conclusions.
Introduction
Ongoing urbanization is associated with mental health risks (Ventimiglia and Seedat, 2019; He et al., 2020). Mental health has been listed as one of the greatest issues for citizens and can reduce physical and psychological well-being and cause chronic disease (American Psychological Association, 2021). Anxiety and stress arise from the perceived living environment, neighborhood safety, improper use of medicine, and living in a city (Chen and Chen, 2015; Adli and Schondorf, 2020). These conditions cannot be avoided by city dwellers. Therefore, citizens need a way to cope up with these issues without a significant cost.
Contact with nature can help by promoting attention restoration (Kaplan, 1995) and reducing stress and anxiety (Ulrich et al., 1991). In general, when people mention “nature,” they mean “areas containing elements of living systems including plants and nonhuman animals across a range of scales and degrees of human management, from small urban parks to relatively pristine wilderness” (Bratman et al., 2015). Experiences in urban green space have been well documented to counter anxiety and stress (Guan et al., 2017; Van den Berg, 2017; An et al., 2019; Zhou et al., 2019). Evidence exists showing that contact with blue space (freshwater ecosystems such as sea, watershed, river, lake, and coast) can also elicit positive mental responses (White et al., 2016; White et al., 2017). As a type of coastal ecosystem, wetlands attract attention due to their role in stress reduction (Sandifer et al., 2015; Sutton-Grier and Sandifer, 2019).
Mental restoration by visiting wetlands can be recognized as a positive response explained by ‘attention restoration theory (ART)’ (Kaplan and Kaplan, 1989) and ‘stress reduction theory (SRT)’ (Ulrich et al., 1991). ART asserts that people can concentrate better following an experience with nature, even merely viewing a nature scene (Kaplan and Kaplan, 1989). SRT claims that exposure to nature can improve well-being by alleviating and reducing physiological and psychological stresses (Ulrich et al., 1991). According to these two theories, the perception of biodiversity in urban wetland parks can improve emotion and generate restoration (Fuller et al., 2007; Dallimer et al., 2012; Carrus et al., 2015). According to the ‘blue gym’ theory, positive emotions can also be associated with the distance to a waterbody in a wetland ecosystem (White et al., 2016). Interacting with water was considered to be the most crucial factor in making a blue space restorative (Volker and Kistemann, 2011). Environmental factors in an urban green space have been found to be major drivers of improved emotions and moods (Wei et al., 2020b; Liu et al., 2021b). Considering highly similar effects between green and blue spaces on mental health (Voelker and Kistemann, 2015), aquatic environments in wetland ecosystems may also be a key driver to improving mental well-being. Relative information is scarce, and relevant evidence is greatly needed.
Continuous urbanization has reduced the frequency of human contact with nature (Roberts and Foehr, 2008). Human beings have greatly impacted regional environments over the past 10,000 years (Torrey, 2004). Cities are the most populated areas in the world (United Nations, 2004). Urbanization alters regional environments through accelerated consumption of energy and natural products, contamination, and artificial management (Torrey, 2004). Regional environments are being altered due to the increasing population around coastal cities. The frequency of flood loss is being reduced in coastal cities due to decreased rainfall events (Brody et al., 2013). Thawing icebergs raise the sea level and stimulate seawater intrusion into the inland ecosystem (Guang-lan et al., 2002; Guo et al., 2016). As a result, regional climates change in response to modified water balance and biodiversity (Guo et al., 2016; Sarkar et al., 2019). It has been demonstrated that the change of regional climates in urban forest settings can induce the responses of psychological (Park et al., 2011; Wei et al., 2020b) and physiological well-being (An et al., 2019). Therein, local air temperature, relative humidity, and sunlight spectrum were all found to impose significant effects on perceived emotions. It will be beneficial to test these responses to the change of regional microclimates in blue spaces at a larger geographical scale.
Under the guidance of ART and SRT theories, the emotional dynamic was taken as a gauge to assess mental restoration and stress reduction (Zuckerman, 1977; Ulrich, 1979). Many studies evaluated the emotional changes of subjects through self-reported scores on questionnaires (Guan et al., 2017; Zhou et al., 2019). This methodology has been considered questionable due to errors from fatigue, subjective hiding of real thoughts (Kaplan and Kaplan, 1989), and lack of validation (Aerts et al., 2018). As an alternative, facial expressions have been taken into consideration to assess emotional changes more directly and accurately (Wei et al., 2019; Wei et al., 2020a). In studies on mental response to urban green space, facial expressions have been successfully used to evaluate perceived emotions at varied scales in a pilot study (Wei et al., 2021a; Wei et al., 2021b) to regional areas across provisional regions (Wei et al., 2019; Wei et al., 2020a; Liu et al., 2021b; Mao et al., 2022). Face-reading techniques have mainly been used to detect emotional responses to experiences in green spaces. Relevant studies testing mental well-being in wetland ecosystems have rarely been conducted. The assessment of facial expressions can efficiently monitor the emotional response to nature contact at a large scale. This methodology can also improve the detection of microclimates as driving forces.
In this study, a large-scale investigation across 14 cities and 20 urban wetland parks was conducted in typical blue spaces along the eastern coastal regions of China. Big-datasets of facial expressions of positive and negative emotions and climatic factors at the same location were recorded for spatial analysis and mechanism detection. Our objective was to map the spatial distribution of emotional expressions of people visiting urban wetland ecosystems and ascertain key meteorological factors that determined this effect. We also aimed to characterize the relationship between the regional climate and emotional perceptions in urban wetlands and depict the statistical curve of this relationship. Our data and results will facilitate future studies and supply a theoretical reference for sustainable planning of urban wetland parks.
Materials and Methods
Selected Sites and Facial Photographs
This study was conducted on 20 urban wetland parks located in 14 cities along the eastern coast of mainland China. The spatial distribution of wetland parks is shown in Figure 1. Sina Weibo (can be recognized as Sina Micro-blog or China Twitter) was employed as the source of facial data from a social network service (SNS) platform (Wei et al., 2019; Wei et al., 2020a; Wei et al., 2020b; Liu et al., 2021b). Photographs were collected from daily records on Sina Weibo in 2020. Facial photographs were downloaded from Sina Weibo records where wetland parks were registered as check-in places. Matching facial photographs with check-in locations can enable further analysis between facial expression scores and climatic factors (Wei et al., 2020b; Liu et al., 2021b). These wetlands were chosen because there were more than 40 photographs found for each check-in place. Any parks where visitors were fewer than 40 were excluded from our dataset. The control of even distribution of replicated subjects among locations is needed because data about facial expressions were mostly abnormal and an even distribution will benefit running a regression model with expected confidence. Due to the COVID pandemic, no photograph records were found for some periods of 2020. We created data curation using a year-long dataset without specific monitoring for monthly records. A significant number of people were wearing masks during photographs, and all such photographs were excluded from our dataset. As a result, a total of 920 photographs were collected. Socioeconomic dimensions of host counties/districts for wetland parks in cities can be seen in Supplementary Figure S1.
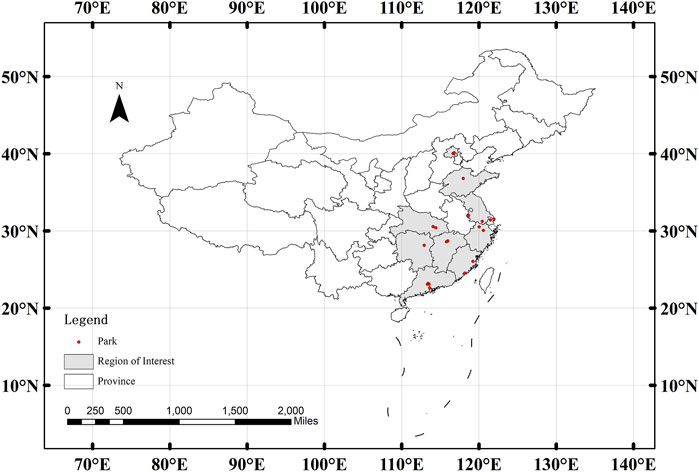
FIGURE 1. Distribution of urban wetland parks along the eastern coast of mainland China. Red spots mark locations of wetland parks. Regions in light gray are provincial areas where objective wetlands are located.
Climatic Records
Climatic records were retrieved from the climatic data centre of national meteorological information of China (Climatic Data Centre, 2021). Daily records of rainfall, wind velocity, average air temperature, and average relative humidity (RH) were downloaded from historical records of meteorological stations located closest to the objective wetland park. Every record was assigned with the date as a daily mean value when each photograph was posted. A climatic record was derived from a city-wide average. Daily climatic data were collected from the day when an individual photo was downloaded from a specific wetland park. This enables regression analysis by closely matching facial data with climatic data on the same day. Mapping the distribution of climatic factors used an average of daily records when each photograph was posted to the micro-blog in Sina Weibo at the target location. Climatic records on sunshine duration, extreme air temperature, RH, etc. were not documented as independent variables to avoid significant variance inflations that could cause collinearity.
Treatment of Facial Photographs
As described before, photographs from people with facial masks were not usable. In addition, all photographs had to contain five facial organs, namely, the eyes, eyebrows, nose, mouth, and ears, for each subject. Selfies or photographs taken by others were kept, but photographs with more than one subject had to be cropped to leave only one face per image. Processed photographs were rotated to make the face perpendicular to the horizontal line to ensure the highest analyzing accuracy.
Facial Expression Analysis
Photographs were analyzed using FireFACE™ software version 1.0 to determine scores for happy and sad expressions (Wei et al., 2020a; Wei et al., 2021a; Liu et al., 2021b). This version of FireFACE can recognize three types of facial expressions, namely, neutral, happy, and sad (total frequency of 100%), but only happy and sad scores were used in this study. Happy and sad scores are percent frequencies that a face is about to present positive and negative emotions, respectively. The software was trained to recognize facial expressions using 30,000 photographs containing happy, sad, and neutral expressions (Wei et al., 2020a). The software was trained to recognize each emotion using about 10,000 photographs. Only one face was presented in each photograph for training, and all subjects were visitors to urban forest parks in mainland China. Training photographs were manually classified into three types of expressions, that is, happy, sad, and neutral for positive, negative, and indifferent affects, respectively. Machine learning was carried out by training the computer to recognize affects by coding directions until matching accuracy reached 80%. During this process, the computer was trained by recognizing a facial photograph with typical characteristics of facial organs and all possible combinations of their muscles for each type of affect. The actual accuracy was validated to be as high as about 90% for happy and sad scores. In brief, a total of 20 photographs were randomly chosen from a pool with an objective affect that had been recognized by the machine. Experts were invited to evaluate the emotions in each photograph. Hence, their matching accuracies were averaged and used to compare with those in 20 most recently published studies in the domain of facial recognition and expression rating. Details concerning validation of scores for these two expressions can be found in the work of Guan et al. (2021).
Statistical Analysis
Both facial expression scores and climatic factors were averaged for every wetland park, and their spatial distributions were mapped using ArcGIS v10.2 software. The variations of happy and sad scores were mapped by pools of data in spring (May, April, and May), summer (June, July, and August), autumn (September, October, and November), and winter (December, January, and February) seasons. Scattered data and interquartile ranges (IQRs) were described in box–whisker plots for happy and sad scores. Statistics were finished using SAS software (SAS Institute, Cary, NC, United States). Data were log-transformed to enable statistical analysis, but results were transformed back to raw data when shown in tables and figures. Log-transformation was performed to enable statistics depending on the general linear (GLM) models for analyzing the hydrological response to climates (Engeland and Hisdal, 2009; Osuch et al., 2017). Analysis of variance (ANOVA) was used to detect differences across wetland parks. Stepwise regression was employed to analyze combined relationships between climatic factors and expressional scores using log-transformed data. Thereafter, a type-I analysis of likelihood ratio test was conducted on contributions of rainfall, wind velocity, average air temperature, and average RH to happy and sad scores. When significant contributions were detected, a zero-inflated negative binomial (ZINB) model was used to regress the four climatic factors to happy and sad scores (Wei et al., 2021a). The maximum likelihood parameters of climatic factors for each existing record were estimated, and a significant response to climatic dose was screened according to the Wald chi-square test at the 0.05 level. All maximum likelihood parameter (MLP) estimates on happy and sad scores were regressed by binomial models to detect the critical values of climates as driving forces that formed presentations of facial expressions. We employed the identical value of 0.5 as a standard to screen the availability of regressed results by binomial models (Tsakiri et al., 2018; Fu et al., 2021). This also reveals the upper or lower limits of estimated contributions to the critical climatic dose. The characteristics of binomial models were used to analyze the extent to which climatic factors drove the change of facial expressions. Pearson correlation was employed to detect the relationship between paired variables among parameters about topography (latitude and longitude), socioeconomic dimension (National Bureau of Statistics, 2020) (see Supplementary Figure S1), and meteorological records.
Results
Spatial Distribution of Facial Expressions
Whisker–box plots for happy and sad scores are shown in Figure 2. Scattered data for happy scores (Figure 2A) were more homogeneous than those for sad scores (Figure 2B). The data of happy scores were mostly dispersed around the IQR between 95 and 5% with little dispersed diffusion (Figure 2A). However, sad scores showed a more heterogeneous dispersion pattern due to many over-medium data dispersed with big diffusions outside the 95% upper limit of IQR (Figure 2B). In addition, medium values of sad scores shared a closer IQR with a lower limit of 5% quartile across most cities.
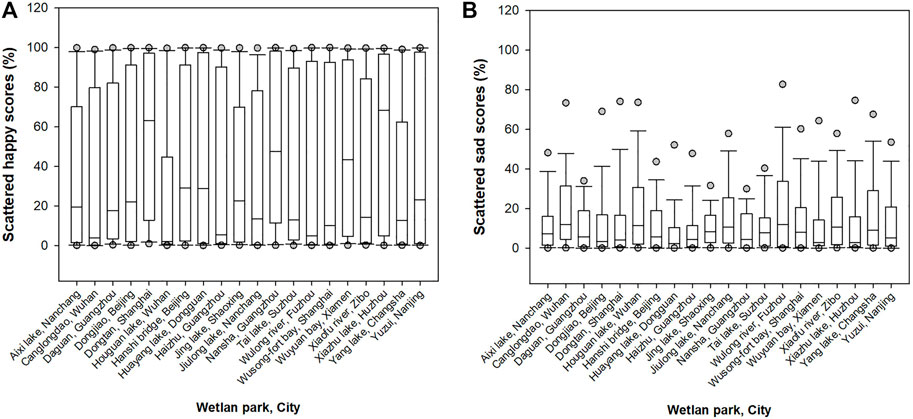
FIGURE 2. Whisker–box plots for happy (A) and sad (B) scores of visitors in 20 urban wetland parks at the eastern cities of China. Whiskers label 95% (upper) and 5% (lower) quartiles to bars at the top and bottom, respectively; box ends at 75% (top) and 25% (bottom) quartiles; dash within the box labeles the median value of data in a city; and scattered dots in gray color label extreme records of raw data with the highest and lowest values at the top and bottom, respectively.
Urban forest park visitors showed a heterogeneous pattern of happy scores’ distribution in spring (Figure 3A). In summer, happy scores tended to be higher in the central part than those in northern and southern parts (Figure 3B). Although Dongguan, Fuzhou, and Guangzhou were close to the southern seaside, visitors did not show happy scores significantly higher than in other parks. In autumn and winter seasons, visitors showed a higher level of happy scores in the south than in the north (Figures 3C,D). The sad score was also distributed as a heterogeneous pattern among visitors in wetland parks (Figure 3E). Again, summer visitors showed higher levels of sad scores in the central part of the study area (Figure 3F). In autumn, sad scores tended to be higher in visitors of inland wetland parks than those at coastal parks (Figure 3G). Visitors mostly showed an even distribution pattern of sad scores in winter with regional levels lower than those in adjacent parks in Fuzhou and Huzhou (Figure 3H).
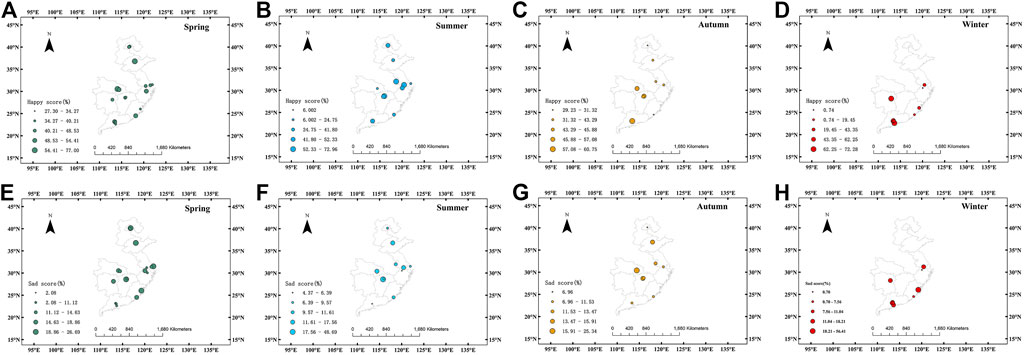
FIGURE 3. Seasonal geographical distributions of happy (A–D) and sad (E–H) scores of visitors in urban wetland parks at cities of East China. The size of a spot and its adjacent value together remark the average of records when visitors posted their photographs to Sina Weibo at the aimed places.
Spatial Distribution of Climatic Factors
The average air temperature showed extreme contrasting levels for adjacent places where visitors took photographs in wetland parks (Figure 4A). For example, the average air temperature in the Haishi Bridge Wetland Park was 23.61°C, which was higher than that in the Dongjiao Wetland Park (15.15°C) in Beijing (Table 1). In Shanghai, the average air temperature in the Dongtan Wetland Park (25.62°C) was higher than that in the Wusong-Fort Bay Park (18.28°C). Contrasting records of average air temperature were also observed between Nansha and Daguan wetland parks in Guangzhou. Extreme maximum and minimum daily climatic records are shown in Supplementary Table S2.
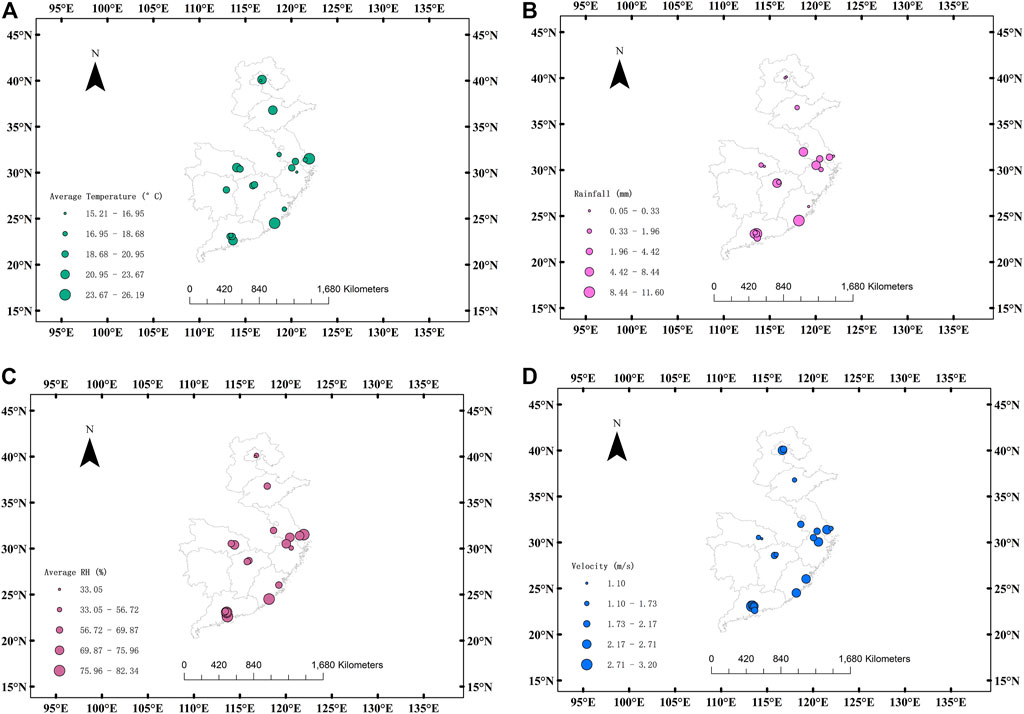
FIGURE 4. Geographical distribution of annual average air temperature (A), rainfall (B), average relative humidity (RH) (C), and wind velocity (D) in urban wetland parks. Spots in dark red, light blue, green, and pink mark annual average air temperature, rainfall, average RH, and wind velocity, respectively. The size of a spot and its adjacent value together remark the average of records when visitors posted their photographs to Sina Weibo at the aimed places.
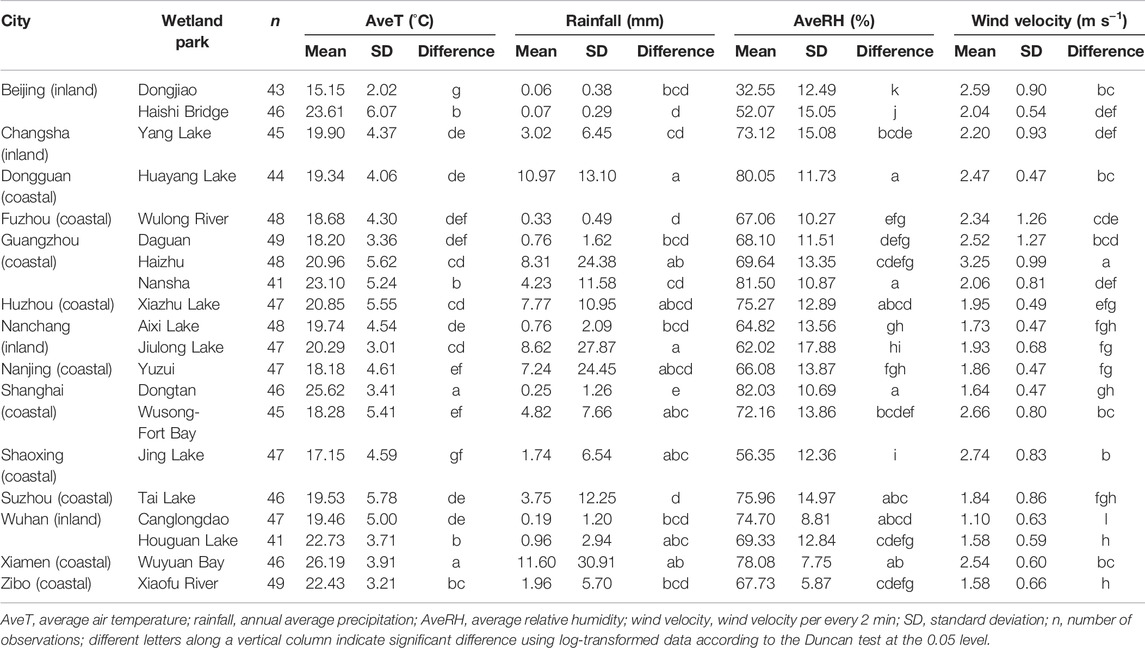
TABLE 1. Difference of climatic factor records for visitors taking photographs in different wetland parks from cities along the eastern coast of mainland China.
Rainfall was generally higher in wetlands located in southern cities than that in northern ones (Figure 4B). Rainfall in wetland parks in Beijing ranged from 0.06 to 0.07 mm, which was lower than that in the Jiulong Lake Wetland Park in Nanchang (8.62 mm) and Huayang Lake Wetland Park in Dongguan (10.97 mm) (Table 1). Contrasting records also existed for rainfall in regionally adjacent wetland parks (Figure 4B). For example, in Nanchang, rainfall in the Jiulong Lake Wetland Park was higher (8.62 mm) than that in the Aixi Lake Park (0.76 mm) (Table 1). In Dongguan, rainfall in Huayang Lake was higher than that in Daguan (0.76 mm) and Nansha (4.76 mm) wetland parks in Guangzhou.
The distribution of average RH in the study area showed a similar pattern with rainfall, which was higher in southern cities than in northern ones; contrasting records existed for adjacent wetland parks (Figure 4C). For example, the average RH in wetland parks in Beijing ranged between 32.55 and 52.07% which was generally lower than that in the Xiaofu Lake Wetland Park in Zibo (67.73%) and that in the Yuzui Wetland Park in Nanjing (66.08%) (Table 1). In Guangzhou, the average RH in the Nansha Wetland Park (81.50%) was higher than that in Haizhu (69.64%) and Daguan wetland parks (68.10%).
Wind velocity was higher in coastal cities than that in inland cities except for Beijing (Figure 4D). Wind velocity in wetland parks of Beijing city ranged from 2.0 to 2.5 m s−1, which was higher than that in the Xiaofu River Wetland Park in Zibo (1.58 mg s−1) (Table 1). Wind velocity in wetland parks in Wuhan ranged between 1.0 m s−1 and 1.5 m s−1, which was lower than that in wetland parks in eastern coastal cities.
Stepwise Regression of Climatic Factors on Facial Scores
The average air temperature was the only climatic factor that generated a significant relationship with happy (F = 7.79; p = 0.0058) and sad scores (F = 3.90; p = 0.0499). The average air temperature had a positive relationship with happy scores, with a parameter estimate of 1.8079 ± 0.6477 (standard error) (type-II sum of squares [SS] = 36.51). In contrast, the average air temperature had a negative relationship with sad scores, with a parameter estimate of -1.3219 ± 0.6696 (type-II SS = 19.33). Therefore, the average air temperature had an overall higher direct contribution to happy scores than to sad scores.
Multivariable Regression Analysis of Climatic Factors on Facial Scores
The type-I analysis of likelihood ratio test by ZINB models indicated that all four types of climatic factors (average air temperature, rainfall, average RH, and wind velocity) had significant contributions to happy (Supplementary Table S1) and sad scores (Supplementary Table S2).
The average air temperature generated significantly negative contributions to happy scores in the range of 14–20°C (Supplementary Table S3). The estimates in the ZINB model fell in the range of -30 to -5. Rainfall only generated five significant contributions to happy scores. Generally, the estimates of rainfall contributions to happy scores increased with the increase in rainfall level from 0.5 to 33.7 mm; however, the contribution was estimated to be negative when rainfall was 23.9 mm (Supplementary Table S3). The average RH showed significant contributions to happy scores in the range of 14–67%. The estimate of RH contribution was generally indicated to decrease with the increase in RH level. When the average RH was 67%, contributions were estimated to be negative (Supplementary Table S3). Wind velocity showed a generally increasing trend of estimated contributions from 10 at 0.8 m s−1 to 22 at 3.4 m s−1 (Supplementary Table S3).
The average air temperature had fluctuant contributions to sad scores with estimates alternating between positive and negative levels in a range between 4.3 and 31°C (Supplementary Table S4). Rainfall had mostly positive contributions to sad scores at most levels, but the contributions were estimated to be negative at the levels of 0.7, 1.9, 8.4, and 11.0 mm (Supplementary Table S4). The average RH had a trend of decreasing contributions to sad scores from the levels of 26–58%. Thereafter, when RH increased higher than 58%, its contributions were mostly positive except for at the level of 66% (Supplementary Table S4). Wind velocity had fluctuant contributions of alternately positive and negative estimates to sad scores in a range between 0.2 m s−1–5.0 m s−1 (Supplementary Table S4).
Model Description of Climatic Factors on Facial Scores
According to data in Supplementary Table S3, the relationship between levels of climatic factors (average air temperature, rainfall, average RH, and wind velocity) and their estimated contributions on happy and sad scores can be described by binomial models (Figure 5).
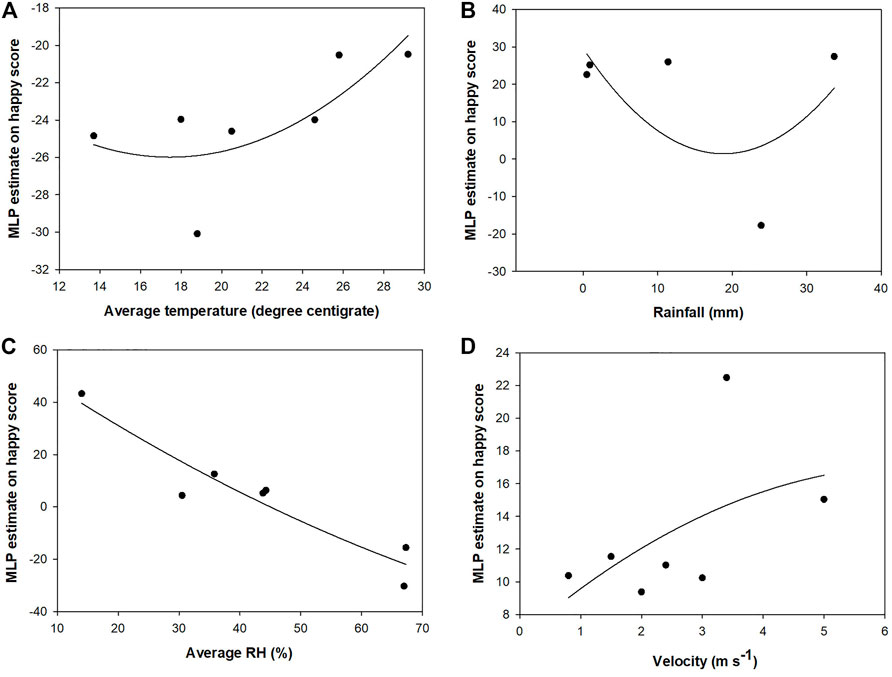
FIGURE 5. Binomial regression of maximum likelihood parameter (MLP) estimates of climatic factors (average temperature, (A); rainfall, (B); average RH, (C); wind velocity, (D)) on happy scores. Spots are significant MLP estimates of an existing microclimatic record indicated by a zero-inflated negative binomial model. Data are derived from Supplementary Table S3. Coefficients of regressed models can be found in Table 2.
The relationship between average air temperature and maximum likelihood parameter (MLP) estimates on happy scores can be described by U-shape binomial curves. MLP estimates on happy scores decreased with the increase in average air temperature up to 11.468°C, when MLP reached the lower limit of -25.988 (Figure 5A). The relationship between rainfall levels and MLP estimates on happy scores can also be described by a U-shape binomial curve where MLP estimates on happy scores decreased with the increase in rainfall up to 18.810 mm, when estimated MLP-happy scores reached the lower limit of 32.862 (Figure 5B). The relationship between average RH and MLP estimates on happy scores can be described by a negative binomial curve (Figure 5C). Theoretically, when the average RH became infinitesimal, the MLP estimate on happy scores was the lowest at a value of -44.394 (Table 2). In contrast, the relationship between wind velocity and MLP estimate on happy scores can be described by a positive binomial curve (Figure 5D). Theoretically, with the increase of wind velocity up to 6.538 m s−1, MLP estimates increase to the upper limit of 17.091. Overall, the coefficient of determination, R2, was higher than the identical value of 0.5 only for regressions against average air temperature and RH. Therefore, regressed results of MLP estimates on happy scores in response to changes of air temperature and RH were more reliable than regressions against rainfall and wind velocity changes.
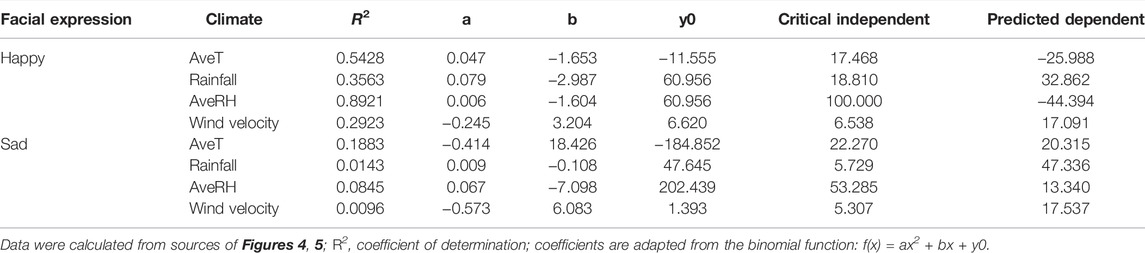
TABLE 2. Coefficients from binomial regressions of climatic factors on maximum likelihood parameter (MLP) estimates on happy and sad scores.
The relationship between average air temperature and MLP estimates on sad scores can also be described by a reciprocal U-shape binomial curve (Figure 6A). With the increase of average air temperature to 22.270°C, MLP estimates reached the upper limit of 20.315 (Table 2). With the increase in rainfall, the MLP estimate on sad scores showed a small increasing trend (Figure 6B). Rainfall had an infinite closeness to the lowest level of 5.792 mm when MLP was estimated at the lower limit of 47.336 (Table 2). The relationship between average RH and MLP estimates on sad scores can be described by a U-shape binomial curve (Figure 6C). With the increase of the average to 53.285%, MLP estimates reached the lower limit of 13.340 (Table 2). The relationship between wind velocity and MLP estimates on sad scores was a barely increasing binomial curve (Figure 6D). Theoretically, with a wind velocity increase to 5.307 m s−1, MLP estimates on sad scores had an infinite closeness to the upper limit of 17.537 (Table 2). However, because all R2 values for regressions were lower than 0.5, none of the regressed MLP estimates on sad scores can be reliable.
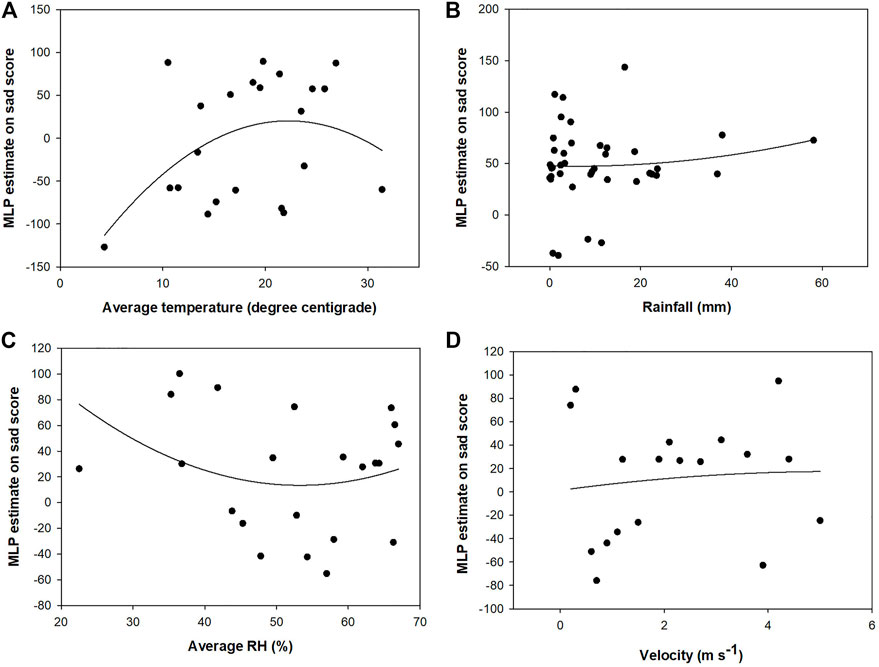
FIGURE 6. Binomial regression of maximum likelihood parameter (MLP) estimates of climatic factors (average temperature, (A); rainfall, (B); average RH, (C); wind velocity, (D)) on sad scores. Spots are significant MLP estimates of an existing microclimatic record indicated by a zero-inflated negative binomial model. Data are derived from Supplementary Table S4. Coefficients of regressed models can be found in Table 2.
Pearson Correlations
Latitude was detected to have a negative relationship with rainfall (R = -0.4720; p = 0.0356) and RH (R = -0.6355; p = 0.0026) (Supplementary Figure S2). In contrast, both population and gross domestic product (GDP) had positive relationships with wind velocity (R = 0.6439, p = 0.0022 and R = 0.6258, p = 0.0032, respectively).
Discussion
Spatial Variation of Emotional Expressions
In our study, happy scores of visitors in wetlands were mapped by a spatial distribution pattern in the range of longitudes between 20°N and 40°N. This pattern was formed by dual drivers of regional air temperature and RH as positive and negative forces, respectively. For example, the high level of happy scores found in the Xiaofu River Park at Zibo city was driven by the meanwhile records of high air temperature and low humidity. However, it was interesting to find that both happy and sad scores showed heterogeneous patterns in spring and winter, which were formed by alternatively high and low levels of scores in the same region although their meteorological conditions were not always different. We attribute these findings to four explanations. First, in natural spaces, emotional well-being can be perceived in response to not only regional weather conditions but also variations in locations (Wei et al., 2019), walking orientations (Wei et al., 2021b), time course (Wei et al., 2021a), and even biodiverse levels (Marselle et al., 2019; Methorst et al., 2021). Microclimates can drive changes in emotional expressions, but they are unlikely to be unique drivers. Second, emotions can also be associated with socioeconomic factors, which, however, we did not detect in this study. In a study, facial expressions were obtained in university campuses across mainland China (Wei et al., 2020a). Therein, both happy and sad scores showed big spatial variations which were highly associated with municipal dimensions in host cities. Third, emotional responses in our study were perceived by combined experiences of landscape metrics of green plus green spaces rather than the single suite of patchy features in blue spaces. Studies have demonstrated that people can perceive different affects in face of varied landscape metrics in both green and blue spaces (Liu et al., 2021a; Zhang et al., 2021). Finally, because our data were obtained from an SNS platform of Sina Weibo, pieces of will by people to post their faces online had a nature of existing uncertainties, which belong to a type of human error to expose their affects (Kaplan and Kaplan, 1989). We admit our data regarding facial expressions had systematic errors during collection and screening. All of our data were randomly allocated, and all suffered possible errors at the same technical level. Therefore, our results concerning spatial distributions of emotional expressions are acceptable and are adequate for further analysis.
Spatial Distribution of Microclimates
Our climatic factors were not shaped by the long-term climatology of local microclimates. Instead, the distribution of our climatic factors was mapped according to daily records during the time photograph suppliers visited wetland parks in our study area. This is why none of our climatic records showed an expected distribution pattern, for example, along a north–south geographical gradient (Wang and Tang, 2003; Lu and Xiong, 2013; Li et al., 2015; Liu et al., 2016). Generally, the distribution of our climatic factors had two characteristics. First, regional climates greatly differed in different climatic zones, including climates in subtropical and tropical regions (Wei and He, 2021). For instance, the average RH of wetland parks in Beijing was lower than that in parks of Wuhan and Nanchang, but their wind velocity was higher. Second, climatic records may be extremely different for wetland parks in regional cities. This was usually found for air temperature and rainfall in wetland parks around Shanghai and Guangdong. This resulted from people taking photographs when they were visiting these wetland parks during specific weather. In subtropical regions, people were more likely to visit wetland parks in Shanghai in weather with higher air temperature and air humidity, but lower wind velocity occurred contrary to the weather when people visited the Jing Lake Wetland Park in Shaoxing. In tropical regions such as wetland parks in Guangzhou, people were prone to visit in weather with higher air temperature, but lower rainfall and air humidity occurred, in contrast to the Huayang Lake Wetland Park in Dongguan. To our knowledge, no available evidence accounts for these differences. Our results can supply reference to further detect and explain why people like to visit these parks in different weathers.
Air Temperature Drives Presentation of a Smile
The average air temperature was the only climatic parameter that promoted positive emotions. Our results are supported by another set of data collected for urban forests across 12 cities in eastern China, which concurs with results found by Liu et al. (2021b). These results suggest a common phenomenon that air temperature can be the key driver among all climatic factors to determine positive expressions for visitors when both in urban green spaces (Guan et al., 2017; Van den Berg, 2017; An et al., 2019; Zhou et al., 2019) and when experiencing urban blue spaces (White et al., 2016; White et al., 2017). Hence, we conclude that those experiencing aquatic environments in wetland parks feel more comfortable when air temperature is warmer. In our study, critical values for average air temperature records fell in a range between 17.468 and 22.270°C, during which the influence of air temperature on negative expressions was the highest. Only when air temperature increased to be higher than this critical range up to approximately 30 °C, the negative effect of air temperature on positive expressions gradually reduced. Therefore, high air temperature favored the presentation of positive emotions by depressing the negative effects. The range of air temperature was also suggested to be comfortable for urban forest experiencers in a range of 12–22°C (Jeong et al., 2016), which was lower than the suggested air temperature range for comfort in wetland parks. However, our findings about the driving force from temperature were contradicted by those found in northern forest parks, where the beneficial effect of temperature on smile presentation tended to diminish when the annual temperature was higher than 6.05°C (Mao et al., 2022). Thus, people’s perception toward temperature change should be differed by microclimatic conditions on contrasting landforms between the deep inland and the coast.
Potential Force of Climatic Drivers to Elicit a Smile
Rainfall did not have a direct relationship with facial expression. Standard deviation (SD) was much higher in parks with low rainfall (lower than 1.0 mm), which made these parks unlikely to receive precipitation. When rainfall was higher than 5.27 mm, the contribution to elicit negative expressions increased synchronously with continuously increasing rainfall levels. When rainfall increases to be over 18 mm, it has a large step effect on the presentation of happy scores. Hence, precipitation over 18 mm is likely to increase positive emotions. Although wind velocity had positive contributions to both expressional scores, the positive contributions were estimated to be higher for happy scores than sad scores when wind velocity increased up to 6.54 m s−1. Wind velocity was indicated in wetland visitors subjected to counties/districts with greater population and higher GDP, which suggests that emotional perceptions of air flow were formed by feelings about the dense crowd and developed regions rather than the real awareness about winds. Due to low levels of coefficient of determination for regressed potential forces on happy and sad scores against rainfall and wind velocity, we cannot accept the likelihoods of facial expressions by the driving forces of these two parameters. Instead, regressions against air temperature and RH can be much more reliable. The increase of air temperature was found to lose its potential force on the presentation of smiles below 11.468°C. This was lower than the lower limit of optimum air temperature range of 17.468°C. Thereafter, the increase of air temperature over 11.468°C will evoke the response of growing force on happy scores, which also fell in the optimum range of 17.468 and 22.270°C. Air humidity between the levels of 14 and 67% generally had a negative contribution to happy scores, which suggests that, for most conditions in our park places, visitors would perceive negatively driving force if air RH increased.
Rainfall and RH had no relationship with socioeconomic dimensions. Instead, their spatial distributions were determined by the latitudinal gradient, which both decreased from the south to the north in our study area. As discussed before, the potential driving forces of rainfall and RH to activate presenting smiles resulted from natural responses to the latitudinal gradient among wetlands.
Limitations of This Study
Our study has several limitations. First, our dataset was limited by the sampling size due to the time of photograph collection. Our dataset comprises a total of 920 photographs from visitors of 20 urban wetland parks in 14 cities. This means that there were 40–50 photographs per park. Facial expression scores in our photographs were used as a bulked average for a park, but their relationships with microclimatic factors were regressed by daily records (n = 920). This dataset size is comparable with that used for regression in other geographical studies. For example, in the work of Sun et al. (2021), the regression of a logistical model was validated by a total of 22 factors and 1,522 landslides. Another instance is from the work of Shahani et al. (2021), where six parameters and 64 series framed a regression. Even so, the size of the dataset in our study is still limited by the time of our data collection. Since 2020 was the first year when the pandemic was felt globally, many people were wearing a mask and were unable to be chosen as our subject. Future studies can continue our design and methodology in the coming years when the public attitude toward COVID-19 is alleviated, increasing the number of people without facial masks in urban wetland parks.
Second, regression precision was limited by distinct dates of records. We run regression models by matching microclimatic records with facial expression scores for the same day. Technically, we were not able to fully determine that the date of photograph exposure was the same day when the photo was shot. This is unlikely to cause a strong technical error in our data variation. All photographs collected were derived from micro-blogs with specific check-in information concerning a specific location. According to common sense, a normal person will not likely take a photograph at a location and post it on a micro-twitter at the same place but at another time. We suggest further efforts in determining a way to make sure both the dates of micro-blog posting and photographing fully match one another.
Third, the use of posted photographs from SNS platforms potentially affects precision due to awareness of exposure. When facial expression scores were used as a gauge to evaluate emotional response to an experience in nature, two types of photographs were used. One is photographs of people who are not conscious of being photographed; therefore, all resulting facial scores will be natural to the nature experience (Wei et al., 2020b; Wei et al., 2021a; Wei et al., 2021b; Guan et al., 2021). This type of study usually needs a dataset of photographs collected from actual visitors to urban nature in cross-over designed studies (Guan et al., 2017; Stigsdotter et al., 2017; An et al., 2019; Zhou et al., 2019). The other type concerns posted photographs derived from SNS that the photograph subject is aware of (Wei et al., 2019; Wei et al., 2020a; Liu et al., 2021b). Photographs in our study belong to this type. Subjects were aware of the photographs that were being taken; hence, their facial expressions were not spontaneous. However, they were unaware their photographs would be used for an academic study. As a result, they do not change their expression due to any potential awareness of being involved in a study. This can especially happen for oriental people, who usually choose to hide the real and extreme expressions of feelings. Nevertheless, an upgraded methodology to obtain spontaneous facial expressions is needed.
Finally, meteorological records have a distinct characteristic of seasonal variation. We collected microclimatic records across a year-long span, and we should have analyzed the seasonal variation as one source of variance. However, because our timeframe for photograph collection was the first year of a global pandemic, many people in urban wetland parks were wearing facial masks and our data for seasonal variation were extremely scattered. Some seasons only had a few photographs that could be used, and some seasons even had none. Future work should be designed with a longer period for photograph collection, enabling a better likelihood of obtaining seasonal data.
Conclusion
No apparent gradient distribution was observed for happy and sad expressional scores from visitors to wetlands in the eastern cities at longitudes between 20°N and 40°N. Positive facial expression tended to be higher for wetland parks located in cities close to the eastern coasts of China but not for cities around the southern coasts. Weather records showed a general spatial difference between contrasting climatic zones or in regional cities. Both happy and sad scores were affected by the change in average air temperature. Combined multivariable regression and binomial correlation suggested that increasing air temperature would not evoke positive emotions unless higher than 11.5°C, and an air temperature range of 17.5–22.3°C will be optimum to induce the presentation of a smiling face. Air humidity generally imposed a negative effect on expressions of positive emotions. Our study introduces a new approach to evaluate ecosystem services for emotional perception by the experience of aquatic environments in wetland parks. Our results can be used as a reference for further studies on the emotional response to experiencing blue spaces.
Data Availability Statement
Restrictions apply to the datasets: The datasets presented in this article are not readily available because data are derived from human subjects with a privacy protection restriction that has been declared in the Ethic Approval Statement. Requests to access the datasets should be directed to the corresponding author.
Ethics Statement
The studies involving human participants were reviewed and approved by the Ethics Committee of School of Water Conservancy and Environment Engineering, Changchun Institute of Technology. Written informed consent for participation was not required for this study in accordance with the national legislation and the institutional requirements.
Author Contributions
HL is the first author, XW is the second author, HW is the third and corresponding author, TX is the fourth author, ML is the fifth author, and SA is the sixth author. Conceptualization: HL and HW; methodology: HL and HW; software: HW; validation: HW and SA; formal analysis: HL and HW; investigation: XW, TX and ML; resources: XW, TX and ML; data curation: TX and ML; writing–original draft preparation: HL; writing–review and editing: HW; visualization: HL and HW; supervision: HW and SA; project administration: HL, HW and SA; and funding acquisition: HL, HW and SA.
Funding
This study was financially supported by the National Key Research and Development Program of China (grant number: 2019YFC0409102), Scientific Research Project of Education Department of Jilin Province (grant number: JJKH20220638KJ), Project of Changchun Science and Technology Bureau (grant number: 21ZGM03), and the National Natural Science Foundation of China (grant numbers: 42001117, 41971122, and 41861017).
Conflict of Interest
The authors declare that the research was conducted in the absence of any commercial or financial relationships that could be construed as a potential conflict of interest.
Publisher’s Note
All claims expressed in this article are solely those of the authors and do not necessarily represent those of their affiliated organizations, or those of the publisher, the editors, and the reviewers. Any product that may be evaluated in this article, or claim that may be made by its manufacturer, is not guaranteed or endorsed by the publisher.
Acknowledgments
The authors acknowledge the editor and reviewers for their contributions and assistances in promoting the manuscript to the current edition. Prof. Shengshu Ai from Changchun Institute of Technology is acknowledged for his assistance in article publication.
Supplementary Material
The Supplementary Material for this article can be found online at: https://www.frontiersin.org/articles/10.3389/feart.2022.781204/full#supplementary-material
Figure S1 | Socio-economic dimensions of population (A), gross domestic product (GDP) (B), administrative area (C), and the distance of objective park to downtown of host-city (D) in host-counties/districts for wetland parks as study sites. Data are derived from National Bureau of Statistics (2020).
Figure S2 | Correlations between paired variables among parameters about topography (longitude and latitude), socio-economy (population, GDP, administrative area [Aarea], and the distance of objective park to downtown of host-city [Distance]), and meteorological records (temperature [T], rainfall [rain], relative humidity [RH], and wind velocity [Wind]).
References
Adli, M., and Schöndorf, J. (2020). Does the City Make Us Ill? the Effect of Urban Stress on Emotions, Behavior, and Mental Health. Bundesgesundheitsblatt Gesundheitsforschung Gesundheitsschutz 63 (8), 979–986. doi:10.1007/s00103-020-03185-w
Aerts, R., Honnay, O., and Van Nieuwenhuyse, A. (2018). Biodiversity and Human Health: Mechanisms and Evidence of the Positive Health Effects of Diversity in Nature and Green Spaces. Br. Med. Bull. 127 (1), 5–22. doi:10.1093/bmb/ldy021
American Psychological Association (2021). APA Dictionary of Psychology [Online]. Available: https://dictionary.apa.org/emotion.
An, B.-Y., Wang, D., Liu, X.-J., Guan, H.-M., Wei, H.-X., and Ren, Z.-B. (2019). The Effect of Environmental Factors in Urban Forests on Blood Pressure and Heart Rate in University Students. J. For. Res. 24 (1), 27–34. doi:10.1080/13416979.2018.1540144
Bratman, G. N., Daily, G. C., Levy, B. J., and Gross, J. J. (2015). The Benefits of Nature Experience: Improved Affect and Cognition. Landscape Urban Plann. 138, 41–50. doi:10.1016/j.landurbplan.2015.02.005
Brody, S., Kim, H., and Gunn, J. (2013). Examining the Impacts of Development Patterns on Flooding on the Gulf of Mexico Coast. Urban Stud. 50 (4), 789–806. doi:10.1177/0042098012448551
Carrus, G., Scopelliti, M., Lafortezza, R., Colangelo, G., Ferrini, F., Salbitano, F., et al. (2015). Go Greener, Feel Better? The Positive Effects of Biodiversity on the Well-Being of Individuals Visiting Urban and Peri-Urban Green Areas. Landscape Urban Plann. 134, 221–228. doi:10.1016/j.landurbplan.2014.10.022
Chen, J., and Chen, S. (2015). Mental Health Effects of Perceived Living Environment and Neighborhood Safety in Urbanizing China. Habitat Int. 46, 101–110. doi:10.1016/j.habitatint.2014.11.002
Climatic Data Centre (2021). Meteorological Data Centre of China Meteorological Administration [Online]. Available: http://data.cma.cn (Accessed September 13, 2021).
Dallimer, M., Irvine, K. N., Skinner, A. M. J., Davies, Z. G., Rouquette, J. R., Maltby, L. L., et al. (2012). Biodiversity and the Feel-Good Factor: Understanding Associations between Self-Reported Human Well-Being and Species Richness. BioScience 62 (1), 47–55. doi:10.1525/bio.2012.62.1.9
Engeland, K., and Hisdal, H. (2009). A Comparison of Low Flow Estimates in Ungauged Catchments Using Regional Regression and the HBV-Model. Water Resour. Manage. 23 (12), 2567–2586. doi:10.1007/s11269-008-9397-7
Fu, G., Chiew, F. H., Zheng, H., Robertson, D. E., Potter, N. J., Teng, J., et al. (2021). Statistical Analysis of Attributions of Climatic Characteristics to Nonstationary Rainfall‐Streamflow Relationship. J. Hydrol. 603, 127017. doi:10.1016/j.jhydrol.2021.127017
Fuller, R. A., Irvine, K. N., Devine-Wright, P., Warren, P. H., and Gaston, K. J. (2007). Psychological Benefits of Greenspace Increase with Biodiversity. Biol. Lett. 3 (4), 390–394. doi:10.1098/rsbl.2007.0149
Guan, H., Wei, H., Hauer, R. J., and Liu, P. (2021). Facial Expressions of Asian People Exposed to Constructed Urban Forests: Accuracy Validation and Variation Assessment. Plos One 16 (6), e0253141. doi:10.1371/journal.pone.0253141
Guan, H., Wei, H., He, X., Ren, Z., and An, B. (2017). The Tree-Species-Specific Effect of Forest Bathing on Perceived Anxiety Alleviation of Young-Adults in Urban Forests. Ann. For. Res. 60 (2), 327–341. doi:10.15287/afr.2017.897
Guang-lan, M., You-song, H., Shao-qing, W., and Zhen-yan, W. (2002). Seawater Intrusion Types and Regional Divisions in the Southern Coast of Laizhou Bay. Chin. J. Ocean. Limnol. 20 (3), 277–284. doi:10.1007/BF02848859
Guo, P., Jin, H., Wei, H., Li, L., and Bao, Y. (2016). Fine Root Growth and Water Use Efficiency in Alfalfa (Medicago sativaL. Cv. Gongong No. 1) Planted Along a Salinity Gradient in Coastal Area of Dalian, Northeast China. Soil Sci. Plant Nutr. 62 (2), 164–172. doi:10.1080/00380768.2016.1149438
He, S., Song, D., and Jian, W.-Y. (2020). The Association Between Urbanization and Depression Among the Middle-Aged and Elderly: A Longitudinal Study in China. Inquiry 57, 004695802096547. doi:10.1177/0046958020965470
Jeong, M.-A., Park, S., and Song, G.-S. (2016). Comparison of Human thermal Responses Between the Urban Forest Area and the Central Building District in Seoul, Korea. Urban For. Urban Green. 15, 133–148. doi:10.1016/j.ufug.2015.12.005
Kaplan, R., and Kaplan, S. (1989). The Epxerience of Nature: A Psychological Perspective. New York, NY, USA: Cambridge University Press.
Kaplan, S. (1995). The Restorative Benefits of Nature: Toward an Integrative Framework. J. Environ. Psychol. 15 (3), 169–182. doi:10.1016/0272-4944(95)90001-2
Li, J., Liu, H., Su, Z., and Fan, X. (2015). Changes in Wind Activity from 1957 to 2011 and Their Possible Influence on Aeolian Desertification in Northern China. J. Arid Land 7 (6), 755–764. doi:10.1007/s40333-015-0050-z
Liu, P., Liu, M., Xia, T., Wang, Y., and Guo, P. (2021a). The Relationship Between Landscape Metrics and Facial Expressions in 18 Urban Forest Parks of Northern China. Forests 12 (12), 1619. doi:10.3390/f12121619
Liu, P., Liu, M., Xia, T., Wang, Y., and Wei, H. (2021b). Can Urban Forest Settings Evoke Positive Emotion? Evidence on Facial Expressions and Detection of Driving Factors. Sustainability 13 (16), 8687. doi:10.3390/su13168687
Liu, S., Yan, D., Wang, H., Li, C., Qin, T., Weng, B., et al. (2016). Evaluation of TRMM 3B42V7 at the Basin Scale Over Mainland China. Adv. Water Sci. 27 (5), 639–651. doi:10.14042/j.cnki.32.1309.2016.05.001
Lu, A., and Xiong, Y. (2013). Systematic Change in Air Humidity in China over Last 50 Years Under Global Climate Change. Res. Soil Water Conservation 20 (1), 141–143.
Mao, B., Liang, F., Li, Z., and Zheng, W. (2022). Microclimates Potentially Shape Spatial Distribution of Facial Expressions for Urban Forest Visitors: A Regional Study of 30 Parks in North China. Sustainability 14 (3), 1648. doi:10.3390/su14031648
Marselle, M. R., Martens, D., Dallimer, M., and Irvine, K. N. (2019). “Review of the Mental Health and Well-Being Benefits of Biodiversity,” in Biodiversity and Health in the Face of Climate Change. Editors M. R. Marselle, J. Stadler, H. Korn, K. N. Irvine, and A. Bonn (Cham: Springer International Publishing), 175–211. doi:10.1007/978-3-030-02318-8_9
Methorst, J., Bonn, A., Marselle, M., Böhning-Gaese, K., and Rehdanz, K. (2021). Species Richness Is Positively Related to Mental Health - A Study for Germany. Landscape Urban Plann. 211, 104084. doi:10.1016/j.landurbplan.2021.104084
National Bureau of Statistics (2020). Statistical Yearbook of China: 2020 [Online]. Available: http://www.stats.gov.cn/ (Accessed February 9, 2022).
Osuch, M., Romanowicz, R., and Wong, W. K. (2017). Analysis of Low Flow Indices Under Varying Climatic Conditions in Poland. Hydrol. Res. 49 (2), 373–389. doi:10.2166/nh.2017.021
Park, B.-J., Furuya, K., Kasetani, T., Takayama, N., Kagawa, T., and Miyazaki, Y. (2011). Relationship Between Psychological Responses and Physical Environments in Forest Settings. Landscape Urban Plann. 102 (1), 24–32. doi:10.1016/j.landurbplan.2011.03.005
Roberts, D. F., and Foehr, U. G. (2008). Trends in media Use. Future Child. 18 (1), 11–37. doi:10.1353/foc.0.0000
Sandifer, P. A., Sutton-Grier, A. E., and Ward, B. P. (2015). Exploring Connections Among Nature, Biodiversity, Ecosystem Services, and Human Health and Well-Being: Opportunities to Enhance Health and Biodiversity Conservation. Ecosystem Serv. 12, 1–15. doi:10.1016/j.ecoser.2014.12.007
Sarkar, D., Bhattacherjee, M., and Chattopadhyay, D. (2019). Influence of Regional Environment in Guiding the Spatial Distribution of Marine Bivalves along the Indian Coast. J. Mar. Biol. Ass. 99 (1), 163–177. doi:10.1017/S0025315417001837
Shahani, N. M., Zheng, X., Liu, C., Hassan, F. U., and Li, P. (2021). Developing an XGBoost Regression Model for Predicting Young's Modulus of Intact Sedimentary Rocks for the Stability of Surface and Subsurface Structures. Front. Earth Sci. 9 (1010), 761990. doi:10.3389/feart.2021.761990
Stigsdotter, U. K., Corazon, S. S., Sidenius, U., Kristiansen, J., and Grahn, P. (2017). It Is Not All Bad for the Grey City - A Crossover Study on Physiological and Psychological Restoration in a Forest and an Urban Environment. Health & Place 46, 145–154. doi:10.1016/j.healthplace.2017.05.007
Sun, D., Wen, H., Xu, J., Zhang, Y., Wang, D., and Zhang, J. (2021). Improving Geospatial Agreement by Hybrid Optimization in Logistic Regression-Based Landslide Susceptibility Modelling. Front. Earth Sci. 9 (686), 713803. doi:10.3389/feart.2021.713803
Sutton-Grier, A. E., and Sandifer, P. A. (2019). Conservation of Wetlands and Other Coastal Ecosystems: A Commentary on Their Value to Protect Biodiversity, Reduce Disaster Impacts, and Promote Human Health and Well-Being. Wetlands 39 (6), 1295–1302. doi:10.1007/s13157-018-1039-0
Torrey, B. B. (2004). Urbanization: An Environmental Force to Be Reckoned with. Washington: PRB - Resource Library.
Tsakiri, K., Marsellos, A., and Kapetanakis, S. (2018). Artificial Neural Network and Multiple Linear Regression for Flood Prediction in Mohawk River, New York. Water 10 (9), 1158. doi:10.3390/w10091158
Ulrich, R. S., Simons, R. F., Losito, B. D., Fiorito, E., Miles, M. A., and Zelson, M. (1991). Stress Recovery During Exposure to Natural and Urban Environments. J. Environ. Psychol. 11 (3), 201–230. doi:10.1016/S0272-4944(05)80184-7
Ulrich, R. S. (1979). Visual Landscapes and Psychological Well‐Being. Landscape Res. 4 (1), 17–23. doi:10.1080/01426397908705892
United Nations (2004). World Urbanization Prospects: The 2003 Revision. New York: UN: United Nations.
Van den Berg, A. E. (2017). From Green Space to Green Prescriptions: Challenges and Opportunities for Research and Practice. Front. Psychol. 8, 268. doi:10.3389/fpsyg.2017.00268
Ventimiglia, I., and Seedat, S. (2019). Current Evidence on Urbanicity and the Impact of Neighbourhoods on Anxiety and Stress-Related Disorders. Curr. Opin. Psychiatry 32 (3), 248–253. doi:10.1097/yco.0000000000000496
Völker, S., and Kistemann, T. (2015). Developing the Urban Blue: Comparative Health Responses to Blue and Green Urban Open Spaces in Germany. Health Place 35, 196–205. doi:10.1016/j.healthplace.2014.10.015
Völker, S., and Kistemann, T. (2011). The Impact of Blue Space on Human Health and Well-Being - Salutogenetic Health Effects of Inland Surface Waters: A Review. Int. J. Hyg. Environ. Health 214 (6), 449–460. doi:10.1016/j.ijheh.2011.05.001
Wang, H., and Tang, Y. (2003). Study on the Regional Characteristics of Air Temperature in East China. Bull. Sci. Technol. 19 (3), 247–251. doi:10.13774/j.cnki.kjtb.2003.03.018
Wei, H., Hauer, R. J., Chen, X., and He, X. (2019). Facial Expressions of Visitors in Forests Along the Urbanization Gradient: What Can We Learn from Selfies on Social Networking Services? Forests 10 (12), 1049. doi:10.3390/f10121049
Wei, H., Hauer, R. J., and Guo, S. (2021a). Daytime Dynamic of Spontaneous Expressions of Pedestrians in an Urban Forest Park. Urban For. Urban Green. 65, 127326. doi:10.1016/j.ufug.2021.127326
Wei, H., Hauer, R. J., and He, X. (2021b). A Forest Experience Does Not Always Evoke Positive Emotion: A Pilot Study on Unconscious Facial Expressions Using the Face Reading Technology. For. Pol. Econ. 123, 102365. doi:10.1016/j.forpol.2020.102365
Wei, H., Hauer, R. J., and Zhai, X. (2020a). The Relationship Between the Facial Expression of People in University Campus and Host-City Variables. Appl. Sci. 10 (4), 1474. doi:10.3390/app10041474
Wei, H., and He, X. (2021). Foliar C/N Stoichiometry in Urban Forest Trees on a Global Scale. J. For. Res. 32 (4), 1429–1443. doi:10.1007/s11676-020-01188-6
Wei, H., Ma, B., Hauer, R. J., Liu, C., Chen, X., and He, X. (2020b). Relationship Between Environmental Factors and Facial Expressions of Visitors During the Urban Forest Experience. Urban For. Urban Green. 53, 126699. doi:10.1016/j.ufug.2020.126699
White, M. P., Pahl, S., Wheeler, B. W., Fleming, L. E. F., and Depledge, M. H. (2016). The ‘Blue Gym': What Can Blue Space Do for You and What Can You Do for Blue Space? J. Mar. Biol. Ass. 96 (1), 5–12. doi:10.1017/s0025315415002209
White, M. P., Weeks, A., Hooper, T., Bleakley, L., Cracknell, D., Lovell, R., et al. (2017). Marine Wildlife as an Important Component of Coastal Visits: The Role of Perceived Biodiversity and Species Behaviour. Mar. Pol. 78, 80–89. doi:10.1016/j.marpol.2017.01.005
Zhang, J., Yang, Z., Chen, Z., Guo, M., and Guo, P. (2021). Optimizing Urban Forest Landscape for Better Perceptions of Positive Emotions. Forests 12 (12), 1691. doi:10.3390/f12121691
Zhou, C., Yan, L., Yu, L., Wei, H., Guan, H., Shang, C., et al. (2019). Effect of Short-Term Forest Bathing in Urban Parks on Perceived Anxiety of Young-Adults: A Pilot Study in Guiyang, Southwest China. Chin. Geogr. Sci. 29 (1), 139–150. doi:10.1007/s11769-018-0987-x
Keywords: blue space, aquatic environment, mental well-being, emotional perception, big-data, social network service
Citation: Li H, Wang X, Wei H, Xia T, Liu M and Ai S (2022) Geographical Distribution and Driving Meteorological Forces of Facial Expressions of Visitors in Urban Wetland Parks in Eastern China. Front. Earth Sci. 10:781204. doi: 10.3389/feart.2022.781204
Received: 22 September 2021; Accepted: 23 February 2022;
Published: 21 April 2022.
Edited by:
Guobin Fu, CSIRO Land and Water, AustraliaReviewed by:
Ahmed Kenawy, Mansoura University, EgyptIwao Uehara, Tokyo University of Agriculture, Japan
Copyright © 2022 Li, Wang, Wei, Xia, Liu and Ai. This is an open-access article distributed under the terms of the Creative Commons Attribution License (CC BY). The use, distribution or reproduction in other forums is permitted, provided the original author(s) and the copyright owner(s) are credited and that the original publication in this journal is cited, in accordance with accepted academic practice. No use, distribution or reproduction is permitted which does not comply with these terms.
*Correspondence: Hongxu Wei, d2VpaG9uZ3h1QGlnYS5hYy5jbg==