- 1Key Lab of Structures Dynamic Behavior and Control of the Ministry of Education, Harbin Institute of Technology, Harbin, China
- 2Key Lab of Smart Prevention and Mitigation of Civil Engineering Disasters of the Ministry of Industry and Information Technology, Harbin Institute of Technology, Harbin, China
Uneven snow distribution plays a main role in the collapse of two-span single-pitched roofs because of the intensified snow accumulation in the valleys and eaves. The roof pitches, wind velocities, and wind directions are the main reasons that cause unbalanced snowdrifts as they drastically affect the flow fields around the roofs. This research investigates the snow distribution characteristics on two-span single-pitched roofs based on the snow-wind combined experiment facility and new similarity criteria. Firstly, the setup of the experiment facility is introduced, and the wind fans matrix and snowfall simulator are calibrated, respectively. Then, a new Froude number similarity, based on the modification of friction velocity ratio, is proposed, and its reliability as a criterion is verified. Finally, experiments on two-span single-pitched roofs are conducted using the new similarity criteria to study the snowdrifts patterns under different conditions. The mechanism of snow accumulations on roofs is explained with the help of CFD calculation. The results show that the valley and eave on the second windward roof bear a larger snow load.
1 Introduction
With climate change, extreme weather disasters occur all over the world frequently. For instance, in 2005, Weihai city in Shandong province was hit by a heavy snowstorm with a maximum snow depth of over 2 m. In 2008, a continuous snow-ice disaster made most areas of southern China suffer from casualties and property losses. Among them, the collapse of structures caused by snowdrift overloading has become the focus in recent years (Zhang and Yi, 2010). Two-span roofed structures are incredibly vulnerable to snow accumulation among these damaged buildings. Table 1 shows several examples of collapsed two-span roofed structures in snow disasters in China in recent years. Because of the characteristics of such roofs, the interaction of wind and snow particles on the roof becomes more intensified, making more snow particles accumulate in the valley between adjacent roofs. Therefore, a two-span roofed structure is a type snow load sensitive structure, and engineering accidents are more likely to occur on such buildings.
Two-span single-pitched roofs are widely used in factories, warehouses, exhibition halls, etc., specifically for their unique shape and practicability. Many building codes and load standards in the United States, Canada, Western Europe, etc., presented detailed provisions for unbalanced snow loads patterns on general two-span roofs to ensure safety. However, most of them provided only a little specification for two-span single-pitched roofs. In the Chinese Load Code for the Design of Building Structures (GB 50009-2012) (Scribd, 2012), there are two patterns for unbalanced snow loads on two-span single-pitched roofs. Although considered separately in the Chinese Load Code, the field observations and studies supporting the provisions for this type of roof were rarely available (Mo et al., 2015; Mo et al., 2016), and numerical simulations or experiments on this subject were rarely published either domestically or internationally. Hence, it is of great significance to investigate unbalanced snow loads on two-span single-pitched roofs for improving the security of building structures in the snow.
In current snow load research methods, the field observation is most direct, reliable, and provides the fundamental first-hand data resource for national load codes, and it has been widely used to verify various numerical simulations and experiments with notable contributions (Høibø, 1988; O’Rourke and Auren, 1997; Thiis and Gjessing, 1999; Thiis, 2003; Thiis and O’Rourke, 2015). Nevertheless, the weather conditions such as the wind field, temperature, and snowfalls were extremely uncontrollable and unstable, which made it difficult to obtain valuable snow load results through measurements. Moreover, most two-span single-pitched roofs were made of lightweight steel, so there was a potential safety hazard in measuring on the roof. Besides, with the rapid development of computer technology, numerical simulation has become a fast and effective method for snow load research. The snow load distribution under specific weather conditions can be calculated (Beyers et al., 2004; Thiis and Ramberg, 2008; Tominaga et al., 2011). However, for the numerical simulation of a large-scale model in a complex environment, the computational accuracy and efficiency are dramatically restricted by the meshing method and computability. Furthermore, due to the lack of experiments or field observations data, the reliability and accuracy of numerical simulations still need to be verified (Liu et al., 2018). In spite of the shortcomings of numerical simulation, it is still an accurate method of predicting the wind field, which plays an essential role in snow loads investigations. Tominaga et al. (2016) confirmed CFD prediction accuracy for the flow fields around the building by comparing simulated results with results obtained in prior wind tunnel experiments for gable roofs. Zhou et al. (2019) used the CFD model to uncover the mechanism of wind effects on the snow redistribution on gable roofs based on the Realizable k-ε turbulence model. Moreover, Zhang et al. (2021) examined the accuracy of different CFD models in predicting the flow field around an arch-roofed building by comparing it with experimental results.
Using wind tunnels and following specific similarity criteria to conduct snow-wind combined experiments on scaled models is another important method for snow engineering studies. It has become one of the most effective methods to investigate the accumulation mechanism and snow distribution patterns on roofs. Unconstrained by natural environmental conditions, it can tune various parameters according to the experimental requirements to reproduce or analyze the process of snowfall and snow drifting. Besides, it is convenient to carry out tests repeatedly.
Currently, many types of experimental particles have been used as a substitute for snow for wind tunnel experiments, for example, silica sand, polyfoam, and saw wood ash (Zhou et al., 2014; Zhou et al., 2016). Kind et al. (Kind and Murray, 1982) compared the characteristics of polystyrene and other types of simulated particles with different densities through wind tunnel experiments. Based on the dimensionless mass flux similarity parameters independently proposed by Li et al. (2008), the scaled experiment for snow distribution on the stepped flat roof was conducted using fine silica sand. Kimbar (Kimbar and Flaga, 2008) discussed the basic similarity criteria for snowfall experiments based on the spreading model and experimented on a large-span stadium roof by applying lightweight polystyrene foam pellets. Substitute particles have no requirements with the wind tunnel inside the environment, but they could not perfectly reproduce the snow repose angle, intergranular viscosity, and other essential characteristics. While on the contrary, real snow and artificial snow particles have solved the problems mentioned above (Delpech et al., 1998; Sato et al., 2001; Delpech and Thiis, 2015; Qiang et al., 2019; Zhou et al., 2021). Sato et al. (2001) conducted a series of experiments over loosed and hard snow covers using the wind tunnel in a cold room to investigate the saltation-layer structure of drifting snow. Qiang et al. (2019) investigated the snow drifting on a flat roof during snowfall in a cryogenic wind tunnel (Shinjo Cryospheric Environment Laboratory of the Snow and Ice Research Center (SIRC)) using artificial snow particles. Zhou et al. (2021) carried out experiments on flat roofs in a cryogenic wind tunnel using artificial snow particles to investigate the impact of roof span and snowfall intensity for snow distributions and transport rates. However, the extravagant cost of construction and operations by using natural or artificial snow has restrained the development of such wind tunnel experimental methods. For example, built in the 1990s, JV climatic wind tunnel in France had cost over 100 million euros. To overcome these defects, a snow-wind combined experimental facility based on the outdoor wind tunnel was developed (Liu et al., 2018). It satisfied the requirements of similarity criteria and snow particle characteristics simultaneously. Besides, due to the built-up equipment being outdoors in Harbin, the meteorological conditions for a long term and stable low-temperature were fully utilized (the daily maximum temperature in winter was less than −0°C and lasted for about 110 days), which reduced the costs. Zhang et al. (2019) researched the snowdrifts on complex long-span roofs using the snow-wind combined experiment facility. Even if the wind-tunnel experiment method has been developed for many years, the research about snow drifting on building roofs is only at the starting stage. Moreover, there is still no investigations about the snow distribution on two-span single-pitched roofs.
The reliability of similarity criteria is the key for the snow-wind combined experimental research. Typically, the snow movement is induced by wind includes drifts, accumulation, jumping, and secondary accumulation. The snow movement stages can be divided into two processes: preferential deposition on the one hand and blowing and drifting snow on the other hand (Lehning et al., 2008). Preferential deposition happens when precipitating without erosion of previously deposited snow and thus in the absence of saltation. Blowing snow and drifting snow are both based on previously deposited snow and distinguished by the snow movement process. Blowing snow is suspended snow, and drifting snow is saltating snow. At present, most theoretical studies are only focused on the blowing and drifting snow process. Considering that the snow-wind combined experiment method used in this paper was also involved preferential deposition, more practical and accurate similarity parameters need to be proposed and verified.
By comparing existing snow load research methods, it could be concluded that the snow blowing similarity criteria based on the snow-wind combined experiment facility reproduced the snowfall process more effectively, accurately, and economically than previous experimental methods. Additionally, the two-span single-pitched roofs have been used extensively but are prone to local snow particles accumulation, leading to engineering failures if not checked. Hence, the snow-wind combined experiments on two-span single-pitched roofs based on new similarity criteria were conducted in this paper. Firstly, the setup of the experiment facility was introduced, and the wind and snow fields were calibrated. Then, through formula derivation, a new Froude number similarity was proposed based on the modification of the friction velocity ratio. Moreover, the reliability of the new similarity criterion was verified by the comparison with other snow-wind combined experiments under the same test conditions. Finally, using the new similarity criteria, experiments on two-span single-pitched roofs were conducted to study the snowdrifts patterns under different conditions; the mechanism of snow accumulations on roofs was explained through CFD calculations.
2 Experimental Theory
2.1 Experimental Equipment
2.1.1 Snow-Wind Combined Experiment Facility
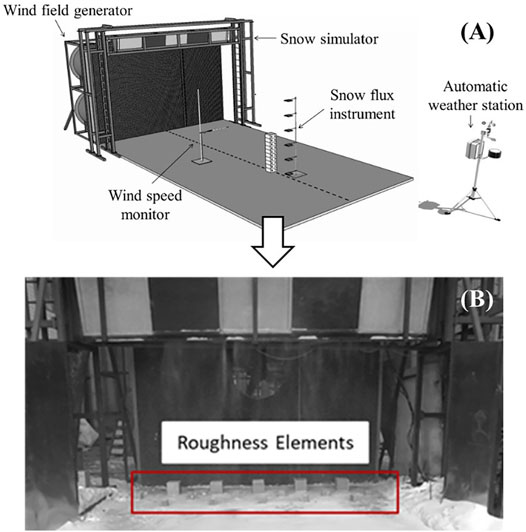
Figure 1 shows a schematic view (A) and photo (B) of the snow-wind combined experiment facility, similar to an open-air wind tunnel. The facility consists of a wind field generator, a snow simulator, and a test section (Liu et al., 2018).
The test section is a 4 × 10 m platform with wind deflectors on both sides. The wind field generator is a 3 × 2 fan-matrix with a cross-section of 4.5 × 3.0 m which can produce a stable wind field with a speed range of 0.5–11.5 m/s in the test section. During the experiment, the wind field over different terrains was modeled by adjusting the frequency of the fan separately. The snow simulator is designed to generate natural snowfall and has a dimension of 5 m along the vertical of the wind direction. The facility can simulate different snowfall rates within the range of 4–20 mm/h.
The experimental wind speed is monitored using AR866A long-probe thermal anemometer at a pre-set location with a measurement range of 0.3–30 m/s, resolution 0.01 m/s, and error 1% ± 1. The snow flux is determined by doing experiments with a box-type snow flux trapper in the absence of any other obstacles (Oikawa et al., 1999) in the test section; the trapper should be placed at the same position as the center of the experimental model. Besides, during the experiments, the environmental conditions, including the temperature, humidity, and natural wind field, are measured with a PC-4 automatic weather station (Liu et al., 2018). The artificial snow particles were adopted as the experimental particles which were made by a snowmaker. The water content and density of particles can be controlled by adjusting water pressure and flow rate.
2.1.2 Experimental Wind Field Characterization
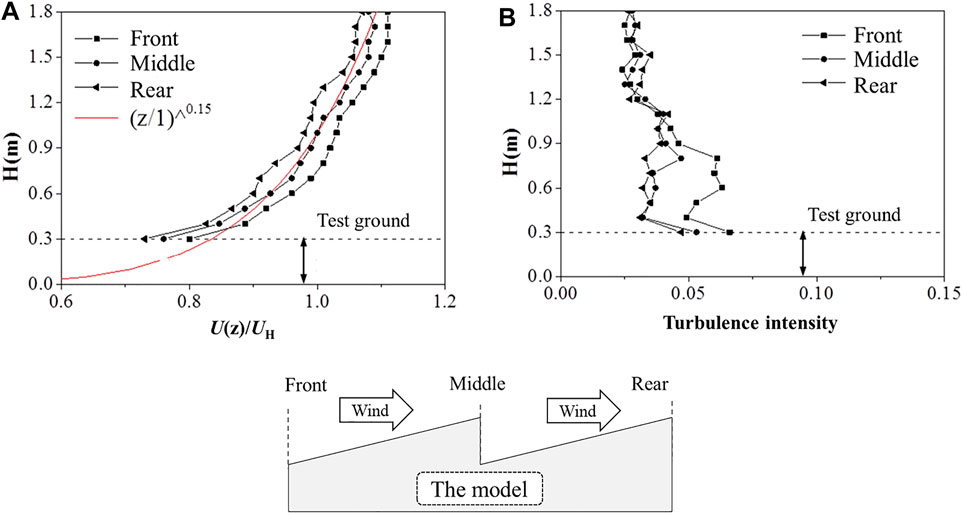
Before the experiment, the wind field of the test section was measured. Profiles of the normalized mean wind speed (the ratio between the measured wind speed U(z) and the reference wind speed UH) and the turbulence intensity at the front, middle and rear positions above the test section are shown in Figure 2. The vertical axis represents the height of the cross-section, and the horizontal axis represents the normalized wind velocity and turbulence intensity. Since the model was fixed on a test ground with a height of 0.3 m, the wind field below 0.3 m is not taken into account here. The fully developed wind velocity profile of the atmospheric boundary layer shown in Figure 2 is determined from the power-law profile as follows:
Where
2.1.3 Experiment Snow Particles
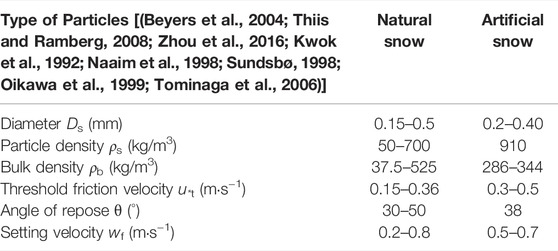
Artificial snow was used for the experiments in this study. To eliminate the difference in the particle properties, the snow particles required for the experiments were all produced using a snowmaker on 01/10/2017. However, fresh snow made with a snowmaker is not suitable for use in the experiments owing to its high moisture content. Thus, the fresh snow was stored at −10°C in a storeroom for at least 5 days before the experiments. The physical properties of the artificial snow particles were measured before the experiments. The diameter and shape of the snow particles were observed with an optical microscope, the bulk density of the snow was measured with a measuring cylinder and a balance, and the angle of repose was 38°, as determined by accumulation experiments. Before the experiment, the snow was put in the precipitator. The building models were made of plywood with a painted surface, and the artificial snow would not deposit on the wood surface when the slope was more than 50°. A comparison of the physical parameters of natural and artificial snow particles is presented in Table 2.
2.1.4 Experimental Snow Field Characterization
In the falling snow experiment, the snowfall simulator sprayed the artificial snow particles into the outdoor wind tunnel. After being transported for a distance, the snow particles become diffused in the wind field, and then the snow particles are deposited preferentially within the experiment section. Considering that the preferential deposition is an essential process in the experiment and the snow distribution patterns on the ground are deeply impacted by the wind, a group of tests was carried out under different wind velocities for the same snow falling duration (0.5 h) to test the uniformity of accumulated snow depth on the ground. Figure 3 shows the preferential snow deposition at different inflow velocities along the downwind and lateral directions.

FIGURE 3. The uniformity of preferential snow deposition on the ground with snowing time of 0.5 h. (A) along the downwind direction and (B) along the lateral direction.
According to the measurement results, it was observed that the snow depth in the area 3.0–7.0 m away from the wind outlet has a higher uniformity in both the downwind direction and the crosswind direction, which was also the area chosen to locate the experimental models.
2.2 Similarity Requirements
In the wind–snow combined experiments, selecting appropriate similarity criteria is particularly essential to keep the consistency of the parameters between the model and the prototype. Generally, the similarities that two flow fields share involve geometric, kinematic, and dynamic similarities, and many researchers have made great contributions in these aspects. Iversen (1979), and Delpech et al. (1998) proposed many classical similarity theories through theoretical derivation and experiments. Nevertheless, it is impossible to simultaneously satisfy all similarity criteria since some criteria contradict each other. Therefore, it is necessary to satisfy the main control factors and relax the restrictions on the secondary factors.
Considering that the snow-wind combined experiment is based on the snowfall pattern rather than the snow blowing and drifting pattern, meeting the Froude number similarity is the fundamental dynamic requirement for carrying out the experiment successfully. According to Odar (1965) and Calkins (1974), in order to reduce the deviation caused by the distortion of the settling velocity ratio, the dimensionless density term was introduced to modify the basic Froude number:
Where g is the acceleration of gravity, L is the reference length of the structure, ρa is the air density, ρs is the snow particle density, and UH is the reference wind speed. The air density is defined as 1.225 kg/m3, the particle density for the model is 910 kg/m3 (Fily, 1996; Delpech et al., 1998), and the particle density for the prototype is 300 kg/m3 (the subscript “p” corresponds to the prototype, and the subscript “m” indicates the model).
Liu et al. (2019) carried out a series of scale model experiments based on the densimetric Froude number. However, their results illustrated that such similarity parameters did not keep the consistency between scale models and prototypes fairly well. Figure 4 shows the Pearson correlation coefficients of the normalized snow depth between the prototype and scale experiments made by Liu et al. (2019). The normalized snow depth was obtained by dividing the snow depth at any point by the mean snow depth on the ground without obstacles. The horizontal axis represents the friction velocity ratio u*/u*t, and the vertical axis represents the Pearson correlation coefficients of the normalized snow depth between the prototype and scale experiments. It was found that the friction velocity ratio was positively correlated with the similarity of snowdrifts patterns since the friction velocity ratio could directly affect snow particles’ erosion and deposition rate. Hence, this paper proposes a further modification for the Froude number based on the friction velocity ratio, which is as follows.
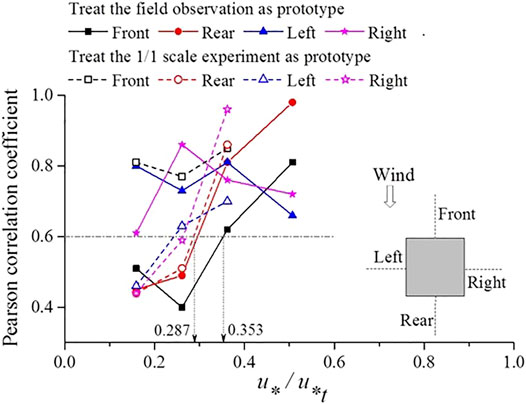
FIGURE 4. Pearson correlation coefficients of the normalized snow depth between the prototype and scale experiments.
Storm (Strom and Kelly, 1962) proposed the lower limit of Reynolds number for particle motion as shown in Eq.3, where υ is the kinematic viscosity, and 1.5 × 10⁻⁵ m2 s−1 was taken for snow particles in the present study, u*t is the threshold friction velocity, and Ds is the snow particle diameter. The lower limit of friction velocity ratio is defined as ξ. Combined with formula derivation, Eq.4 is obtained. Besides, the friction velocity ratio was equal to the ratio of reference wind speed UH and starting wind velocity U0 (Iversen, 1983).
Taking Eqs.4, 5 into Eq. 2, the new Froude number similarity parameter modified by the lower limit of friction velocity ratio was obtained as shown in Eq. 6:
Additionally, there are several other similarity criteria, such as the flow field, ejection process, particle trajectory, and deposition pattern, which must also be satisfied with experiments to ensure a reliable simulation.
Liu (2020) suggested that the experiment should satisfy the time scaling parameter, as shown in Eq. Where T is experiment time (s), wf is the settling velocity of snow particles.
Eq. should also be satisfied to simulate the shear stress of particles near the ground (Iversen, 1981).
To maintain the ratio of drag force to inertial force similarity, Eq. 9 must also be satisfied (Kind, 1986).
Equation 10 must be satisfied to maintain the accumulated rate similarity, where Sd is the rate of snow depth of accumulation.
Besides, the deposition or erosion mechanisms could be modeled satisfactorily through the similarity of the particle ejection process, as shown in Eq. 11.
3 Verification of the Similarity Criteria Reliability
3.1 Verification Process
To verify the accuracy of the revised Froude number similitude parameter, a group of snow-wind combined experiments similar to the scaled experiments was performed based on the densimetric Froude number made by Liu et al. (2019).
Experiments were conducted in the snow-wind combined facility. Considering that the snow-wind combined facility could provide a stable wind field and reliable snowfall condition, the snow-wind combined experiment for a 1 m cube model was chosen to be the prototype. Figure 5 shows the schematic view of the model experiment setup in the facility, which is copied from Liu et al. (2019). Additionally, three groups of multi-dimensional scale experiments were designed as the comparative subjects, and the scale ratios were 1/2, 1/4, 1/10, respectively (Liu et al., 2019). Table 3 shows the experimental conditions of the multidimensional scale experiments, and Table 4 gives information about the comparison of the main similarity criteria of prototype and multidimensional scale models. It was observed that the similarity parameters showed agreement among the prototype model and scale models.
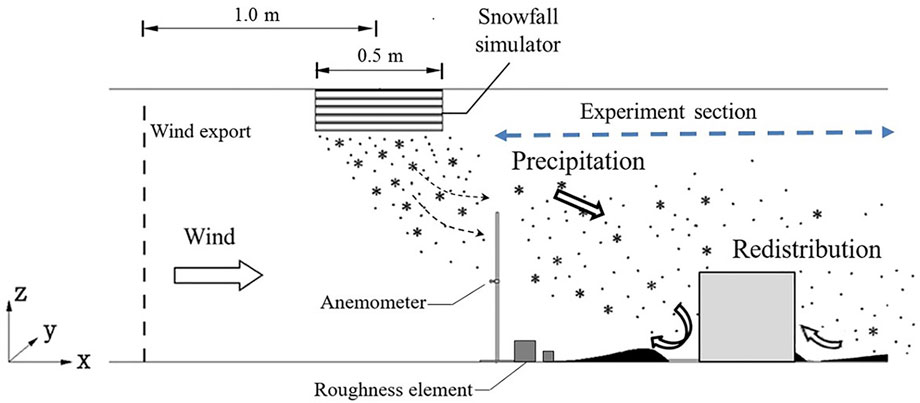
FIGURE 5. Schematic view of the cube model experiment setup in the snow–wind combined experiment facility.

TABLE 4. Comparison of similarity criteria of self-test prototype and multidimensional scale models.
3.2 Verification Results and Discussions
The accuracy of snow distribution simulation can be evaluated from two aspects: the snowdrifts patterns and normalized snow depth.
Figure 6 compares snow distribution patterns of experiments using two different similarity criteria. One is the densimetric Froude number similarity criteria. The other is the new Froude number similarity criteria proposed in this paper. The snow surface was generated by using spatial interpolation. Almost 500 measuring points were used. The results of (A1), (B1), (C1), and (D1) were made by Liu et al. (2019), and (A2), (B2), (C2), and (D2) were made based on the newly proposed Froude number similarity criteria. For (A1), (B1), (C1), and (D1), it is clear that, for the 1/10 scale model, the erosion areas on both lateral sides of the model were dramatically reduced compared with other cases. With the scale decreasing, the snow deposition separation phenomenon on the windward side of the model disappeared gradually. Particularly for 1/10, there was only one continuous deposition area in front of the model on the windward side. Therefore, such similarity parameters were not accurate enough. For (A2), (B2), (C2), and (D2), the consistency among the self-test prototype experiment and scale model experiments has improved. On the one hand, for all cases, there were two horseshoe-shaped erosion areas formed on both lateral sides of the model; besides, the patterns and sizes of these regions were the same. Compared with the results made by Liu et al. (2019), the problem of too small erosion areas for scale 1/10 had been corrected. On the other hand, in front of the windward side of the models, two deposition regions appeared, and the separation phenomenon of the deposition areas showed uniformity among different scales.
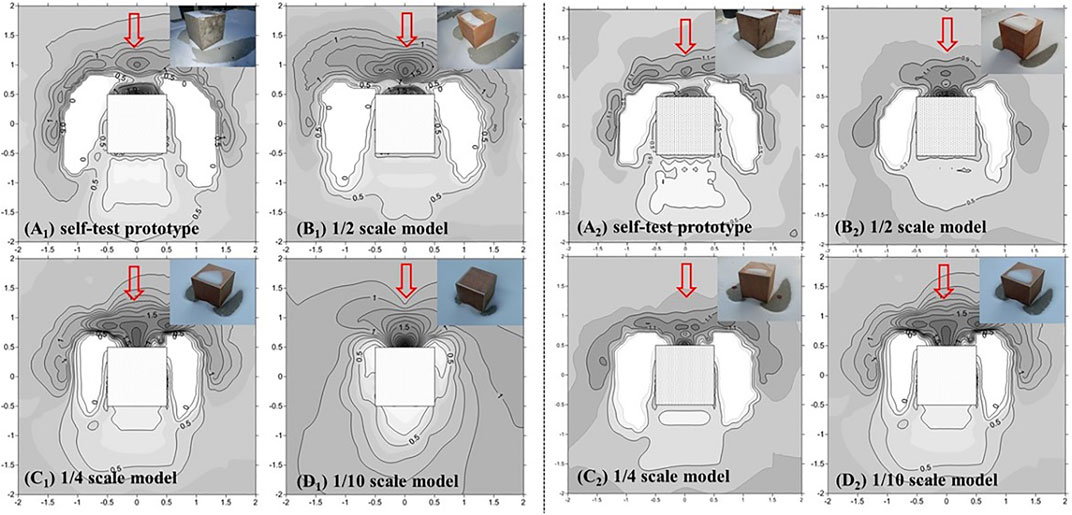
FIGURE 6. Comparison of the snow distribution patterns of experiments using two different similarity criteria. (A1, B1, C1, D1) based on the densimetric Froude number similarity criteria and (A2, B2, C2, D2) based on the new Froude number similarity criteria proposed in this paper.
Figure 7 compares the normalized snow depth of experiments using two different similarity criteria. The results of (A1) and (B1) are for the model’s lateral sides; (A2) and (B2) are for the streamwise direction of the model. The measuring method and direction are shown in the figures, and the horizontal axis “Normalized D” is the dimensionless distance obtained by dividing the distance by the length of the cube model. It was indicated that two “U” shape normalized snow depths were shown on the lateral sides of the model, and an “N” shape normalized snow depth as shown in the streamwise direction of the model on the windward side. By comparing the coefficients in the circles illuminated in Figure 7, the normalized snow depth based on the new similarity criteria modified by friction velocity ratio showed higher accuracy. Based on the analysis of the above experimental results, the accuracy of the Froude number similarity parameter based on the friction velocity ratio modification proposed in this paper was proved, and it is more suitable for use in the snow-wind combined experiments.
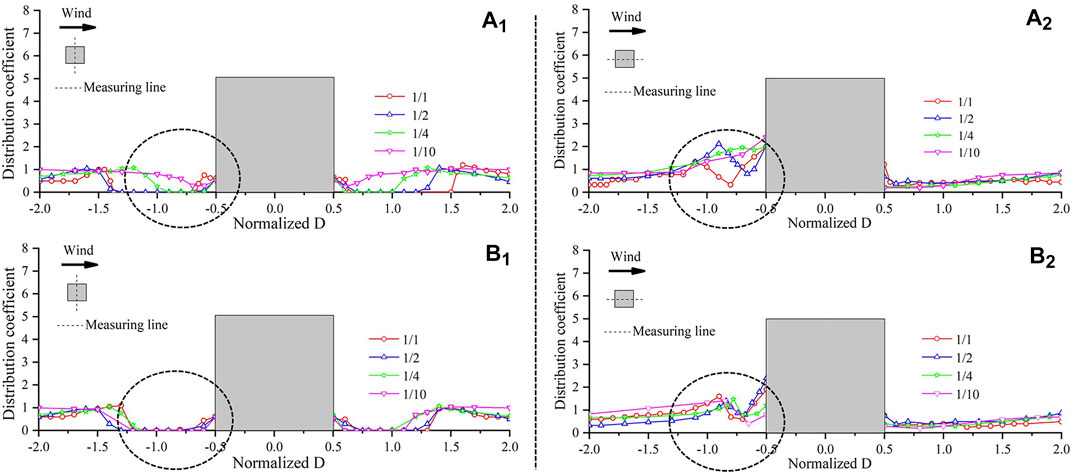
FIGURE 7. Comparison of the normalized snow depth of experiments using two different similarity criteria. (A1, B1) based on the densimetric Froude number similarity criteria and (A2, B2) based on the new Froude number similarity criteria proposed in this paper.
4 Snowdrifts on Two-Span Single-Pitched Roofs
4.1 Experimental Settings
4.1.1 Experimental Model
Figure 8 shows schematic views of the building model (A) and the experiment setup in the wind–snow combined experiment facility (B). The model is composed of two single-pitched roof models (defined as the “first span” and “second span” as shown in Figure 8A), and the experimental model is at a scale of 1/10. The dimension of each single-pitched roof is 10 × 10 m, and the height of the eave on the lower side is 0.2 m, as shown in Figure 8A. The experimental setup is shown in Figure 8B. The model center is located 4 m from the wind export (i.e., the output from the fan matrix), and the anemograph used for determining the reference wind speed UH is placed 2.5 m from the wind source.
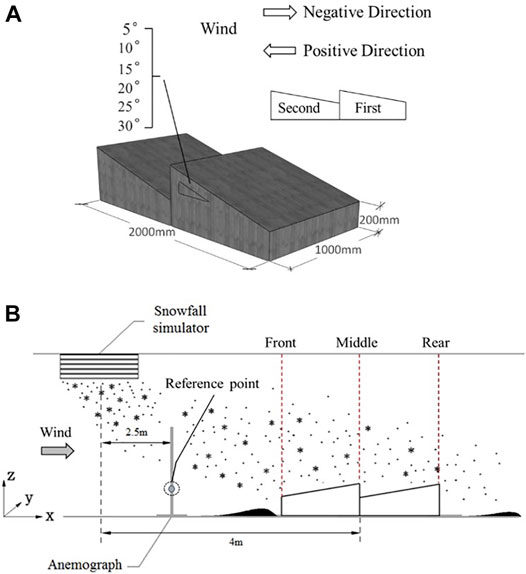
FIGURE 8. Schematic view of the building model (A) and the experiment setup in the snow‐wind combined experiment facility (B).
4.1.2 Experimental Cases
The experiments were organized into three groups according to different purposes. First, to study the influence of the wind direction, two wind directions (the “positive direction” and “negative direction”) were defined, as shown in Figure 8A. Second, to study the effect of the roof pitches, six roof pitches were selected: 5°, 10°, 15°, 20°, 25°, and 30°. Third, three different wind speeds were chosen to study the effect of the wind speeds. Based on the meteorological monitoring in winter in Harbin, China, the natural wind speed ranges from wind scale 2 (1.6–3.3 m/s) to 5 (8.0–10.7 m/s) when snow is falling. Thus, wind speeds of 2.0, 4.5, and 7.0 m/s (at the height of 10 m) were selected for the prototype. According to Eq. 6, the resulting reference wind speeds were 1.8, 2.7, and 3.6 m/s, respectively. Assume that for the prototype, the snowfall rate is 5 mm/h, the snowfall duration is 24 h, and the snow depth is 120 mm. Therefore, the snowfall rate, snowfall duration, and snow depth calculated for the experiments were 15 mm/h, 48 min, and 12 mm, respectively.
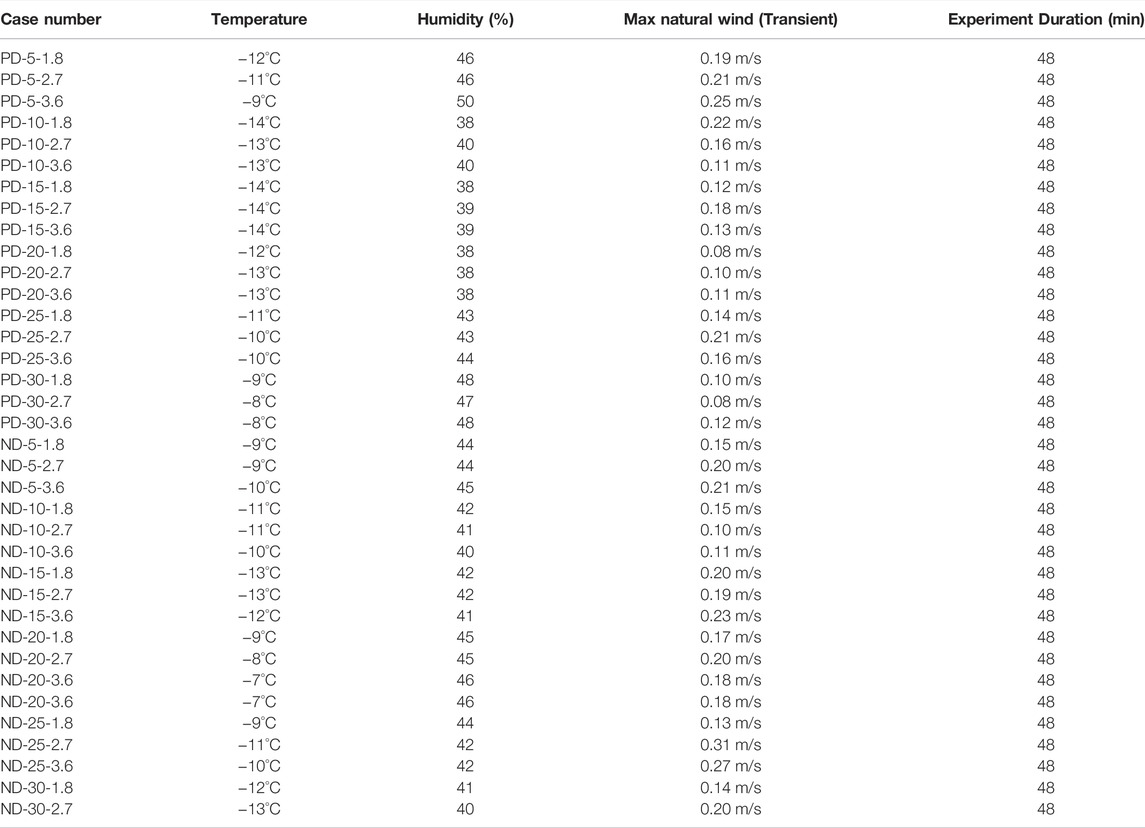
To avoid the influence of the natural environment, time durations from 6:00–10:00 a.m., and 8:00–11:00 p.m. with no wind or solar radiation were selected for the experiments. Besides, the environmental conditions such as air temperature, humidity, and natural wind during the experiments were measured by the PC-4 automatic weather station. The case information is summarized in Table 5. Case numbers are assigned to each experiment; for example, experiment “PD-5-1.8” indicates that the roof pitch of the model is 5°, the wind is in the “positive direction,” and the reference wind speed UH is 1.8 m/s.
Based on the new similarity criteria, the major similarity parameters for the prototype and scale model are given in Table 6. It was found that all of the major similarity parameters of the scale model are in good agreement with the prototype.
4.2 Snow Distribution
The results were illustrated from two aspects: snowdrift patterns and the normalized snow depth (defined as the ratio of the observed snow depth at any point to the average snowfall on the ground).
Shi (2021) simulated the snow distribution on two-span gable roofs. It was found that the snow distribution was invariable along the roof width in the center area. Furthermore, with the increase of width, the snow depth in the roof’s center is hardly affected by the roof on both sides. Considering that the two-span pitched roofs investigated in this paper are widely used in factories and warehouses, the roof width is normally relatively larger than the roof span. Hence, the snow distribution along the centerline of the roof is almost unchanged. Therefore, it should be reasonable to use the 2-D normalized snow depth on the centerline to represent the snow distribution on the whole roof.
4.2.1 Results Under Positive Wind Direction
The normalized snow depth along the centerline of the wind direction on the roof for the “positive direction” is shown in Figure 9. Here, the first span is defined as “Span Ⅰ”, and the second span is defined as “Span Ⅱ”.
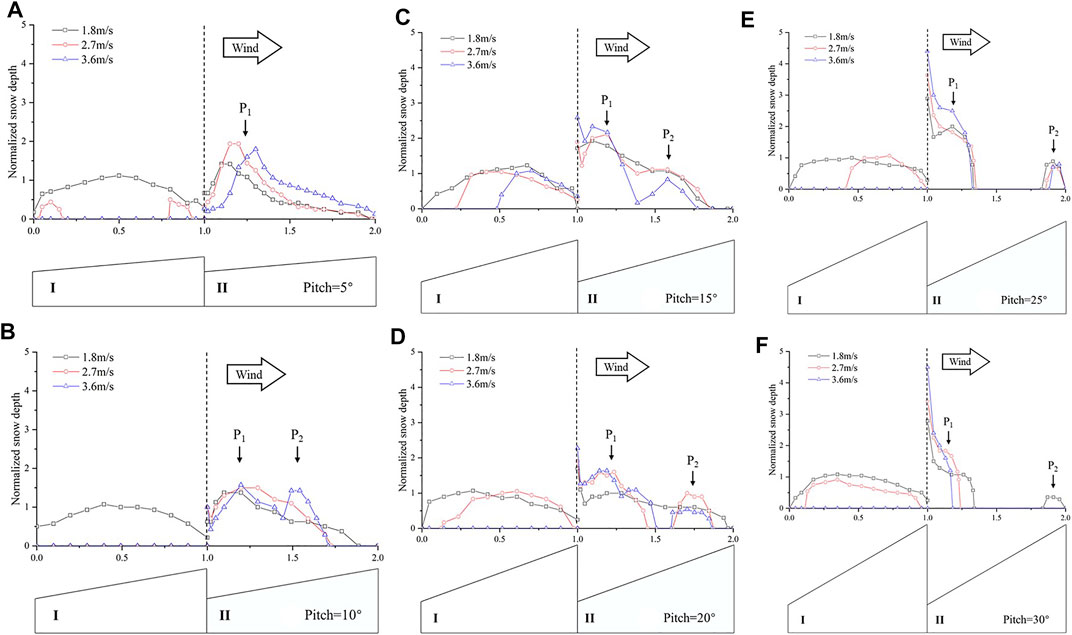
FIGURE 9. Normalized snow depth along the centerline of the roof for the positive wind direction. (A) pitch = 5° (B) pitch = 10° (C) pitch = 15° (D) pitch = 20° (E) pitch = 25° (F) pitch = 30°.
For “Span Ⅰ”: under a low wind velocity, there is a uniform snow distribution, and the normalized snow depth value is about equal to 1.0. With the increase of wind speed, the snowdrift area is narrowed towards the higher edge of “Span Ⅰ”. When UH = 3.6 m/s, almost no snow remains on “Span Ⅰ”.
For “Span Ⅱ”: when the roof pitch is equal to 5°, a snowdrift P1 appears near the valley, as shown in Figure 9. When the roof pitch is larger than 10°, another snowdrift, P2 appears, and with the increase of roof pitch, P1, and P2 move towards the trough and the eaves of “Span Ⅱ”, respectively. The snowdrifts (P1, P2) separation phenomenon is more obvious when the roof pitch is larger than 20°, and snow particles are accumulated more intensely at the bottom of the valley. The peak value of P1 is more than 4.0; the peak value of P2 is around 1.0. When the roof pitch is larger than 25°, the overall snow distribution pattern on “Span Ⅱ” presents: “triangular distribution” - “no snow” - “triangular distribution”, and it will not change with roof pitches increasing. Moreover, it should be noted that: from 5° to 15°, the shape of P1 is similar to an “arch” under different wind velocities, and the normalized snow depth slightly increases with the increasing of roof pitch; from 20° to 30°, the shape of P1 is similar to mirror image of “N”, and the values of the normalized snow depth are also increasing with the increase of roof pitch. However, when the roof pitch is larger than 25°, the peak value declines, as shown in Figure 9. Hence, 25° is the upper critical roof pitch for the normalized snow depth on two-span single-pitched roofs, which is a condition needed to be considered specially.
4.2.2 Results Under Negative Wind Direction
The normalized snow depth along the centerline of the wind direction on the roof for the “negative direction” is shown in Figure 10. Here, the first span is defined as “Span I”, and the second span is defined as “Span II”.
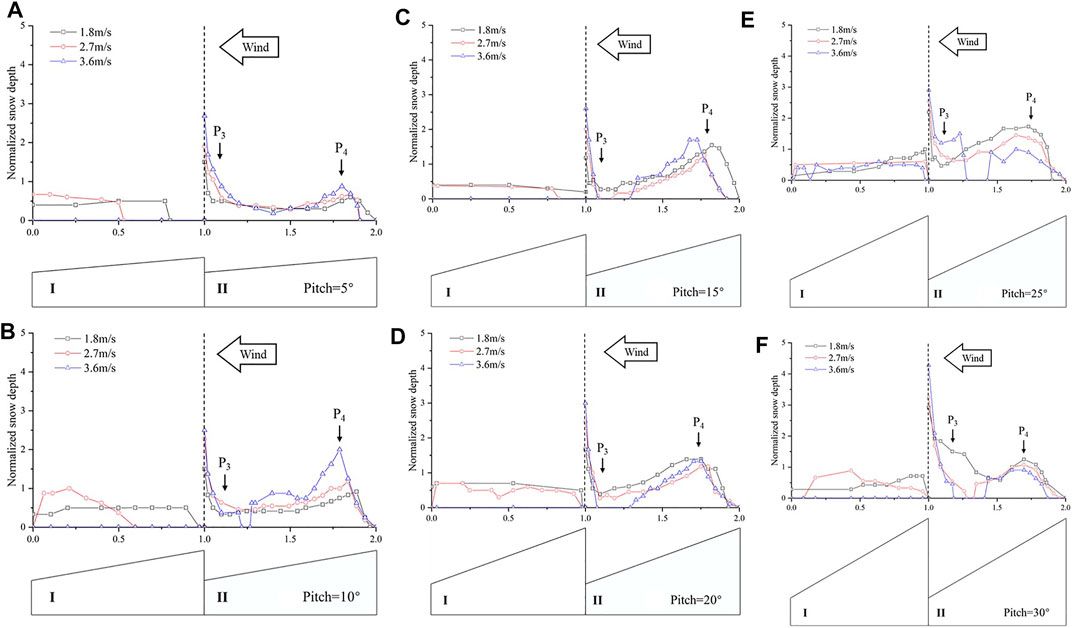
FIGURE 10. Normalized snow depth along the centerline of the roof for the negative wind direction. (A) pitch = 5° (B) pitch = 10° (C) pitch = 15° (D) pitch = 20° (E) pitch = 25° (F) pitch = 30°.
For “Span I”: there is a basic uniform snow distribution, and the average value of the normalized snow depth is less than 0.7, which is barely influenced by the wind velocity or roof pitch. Additionally, when UH = 3.6 m/s, almost no snowdrifts occur on “Span I”.
For “Span II”: no matter the wind velocity or roof pitch, two snowdrifts, P3, P4, are present in all cases. P3 appears in the valley between “Span I” and “Span II”, and the value of the normalized snow depth increase with the rise of roof pitch, but when roof pitch is larger than 25°, the value will intensely increase whose peak value can reach 4.0. P4 occurs near the eaves of “Span II”. The peak value of the normalized snow depth is around 1.5, which is more than P2 under the positive wind direction. Besides, the value is changed marginally with the increase of wind velocity, and the roof pitch plays the main role. It is clear that the value of the normalized snow depth on “Span II” increases with the increase of roof pitch.
Considering that the most severe snowdrift occurs in the valley area, therefore, the snow distribution pattern and the peak normalized snow depth in such area are discussed by comparing the experimental results with snow load codes of different countries. For the snow distribution pattern, a triangular load is usually adopted in different national load codes, the same as the experimental results.
However, the peak normalized snow depth could reach 4.5, which is much larger than the suggestions in the current building codes. For example, the peak snow coefficient for a multi-span single-pitched roof in the Chinese building code is 2.0. The same phenomenon is also observed in the simulations of Zhang et al. (2021). In the study, the snowdrift characteristics on multi-span arch roofs with one, two, three, or four-span roofs were investigated, respectively. The results showed that the peak normalized snow depth in the valley area could reach 4.0 in the presence of snow drifting, and the peak value could reach 5.0 in the presence of both snow drifting and sliding. Taylor (1980) also pointed out that snow drifting and sliding would aggravate snow accumulation in the valley. In summary, current building codes provided reasonable uneven snow distribution patterns for multi-span roofs. Nevertheless, the maximum value of the snow coefficient is too small, which should be reconsidered in the future.
4.3 Discussions of Snowdrifts Pattern by CFD
Through the above experimental results, it could be concluded that the form of the snowdrifts under different conditions presented a strong regularity, and some of the distribution forms would cause serious adverse effects on the safety of continuous roofs in reality. Hence, figuring out the mechanism of snowdrifts is equally necessary. For different snowdrifts patterns, the wind field around the models performed the key action, and vortices played the most vital role, particularly at a low snow concentration (Tsuchiya et al., 2002). However, since it is hard to obtain a detailed and accurate wind field in the experiment facility, and the measuring apparatus itself inevitably affects the results, CFD simulation was chosen to gain the wind fields around the models.
4.3.1 Validation of Turbulence Model
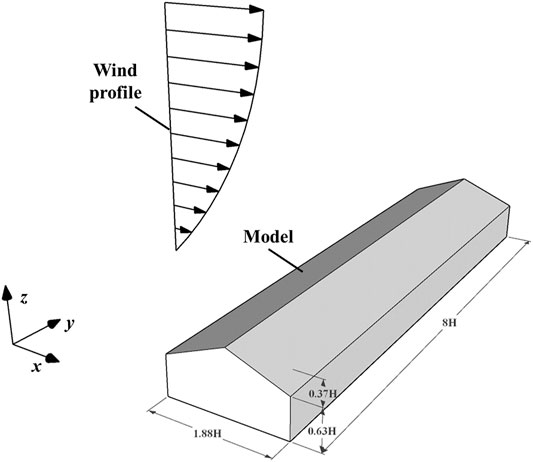
To realistically reproduce the flow field around the building, the predicting accuracy of the turbulence model should be investigated first. The flow field selected as a test case is around a pitched roof building of a wind tunnel experiment (Ntinas et al., 2014). The experiment was carried out in a boundary layer wind tunnel by Ntinas et al. at the Air Physics Lab, Department of Engineering, Aarhus University, Denmark. The experimental model was a pitched roof building with the dimensions of 1.88 H(x) × 8 H(y) × H(z), where H was set to 0.063 m, as shown in Figure 11. In addition, the inflow velocity UH at the model height was set to 0.32 m/s.
The Realizable k-ε model (RLZ, for short) was chosen as the turbulence model for the simulation. The commercial code ANSYS Fluent was used to solve the flow equations on structured rectangular grids. Simulations were done assuming a steady-state situation. The computational domain and the boundary conditions are summarized in Figure 12. The domain covered 41.58H(x) × 8H(y) × 8H(z), which was discretized into 221(x) × 200(y) × 71(z) grids. The inflow velocity and turbulence energy were set according to the experiment results (Ntinas et al., 2014). Besides, the Standard Wall Function was selected here for the ground surface, where the roughness height z0 was 0.000273 m. The Green-Gauss cell-based scheme was used for gradient discretization, and the advection terms were discretized using a second-order upwind scheme.
Figure 13 compares the vertical profiles of the streamwise velocity 1) and turbulence kinetic energy 2) obtained by the CFD simulation and the wind tunnel experiments. Here, blue spots and red lines are the results obtained from the wind tunnel experiments and CFD simulation, respectively. Generally, for both wind velocity and turbulence kinetic energy, the results obtained by the RLZ model show good agreement with the wind tunnel experiment. Therefore, the CFD simulation method can well reproduce the flow field around the pitched roof building, and the Realizable k-ε model was used as the turbulence model in this paper.
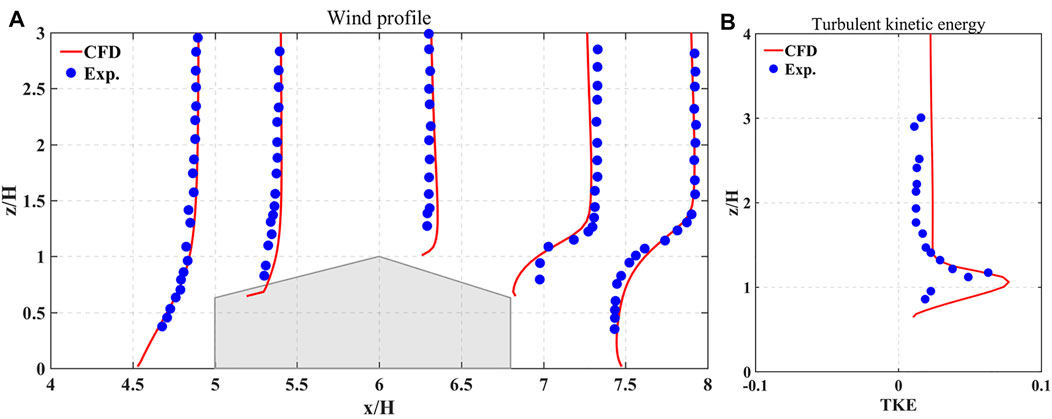
FIGURE 13. Vertical distributions of streamwise velocities (A) and turbulence kinetic energy (B) obtained from CFD simulation and experiment.
4.3.2 Calculation Settings for the Two-Span Single-Pitched Roofs
Figure 14 shows the meshing method and computational domain settings. The dimension of the computational domain was 10m(x) × 5m(y) × 4m(z), which was consistent with that of the experimental site. Besides, Structured grids were used in the simulation, with the height of the first layer grid equaling 0.02 m and dimensionless wall distance y+ ranging from 108 to 270 approximately. The total number of grids was 807000. The mean wind and turbulence intensity profiles were obtained from experiments, and the Realizable k-ε model is used here as the turbulence model. Other calculation settings are the same as the validation case. Due to snowdrifts patterns showed a strong identical changing trend, just several typical cases were simulated by CFD to research the influence of wind velocities, directions, and roof pitches.
4.3.3 Wind Field Simulation Results for Two-Span Single-Pitched Roofs
To make it easier to compare, all the results were included in Figure 15. In the “positive direction”, the explanation for the snow distribution patterns can be found in the results for the flow fields. Contours of dimensionless wind velocity in the “positive direction” under different wind velocities when roof pitch = 30° are shown in Figures 15A–C, respectively. The dimensionless wind velocity was obtained by dividing the wind velocity U by the reference wind velocity UH. The results showed that a standing vortex forms just behind the first span (above the bottom of the valley) along the wind direction, and the wind speed is extremely low, making it possible for the snow particles to accumulate. As the wind speed increases, the scale of this vortex becomes a little bit smaller and the wind speed near the roof of the second span gets stronger, shrinking the area where snow particles can accumulate. Thus, this shrinkage in the area slightly increases the unevenness of the distribution.
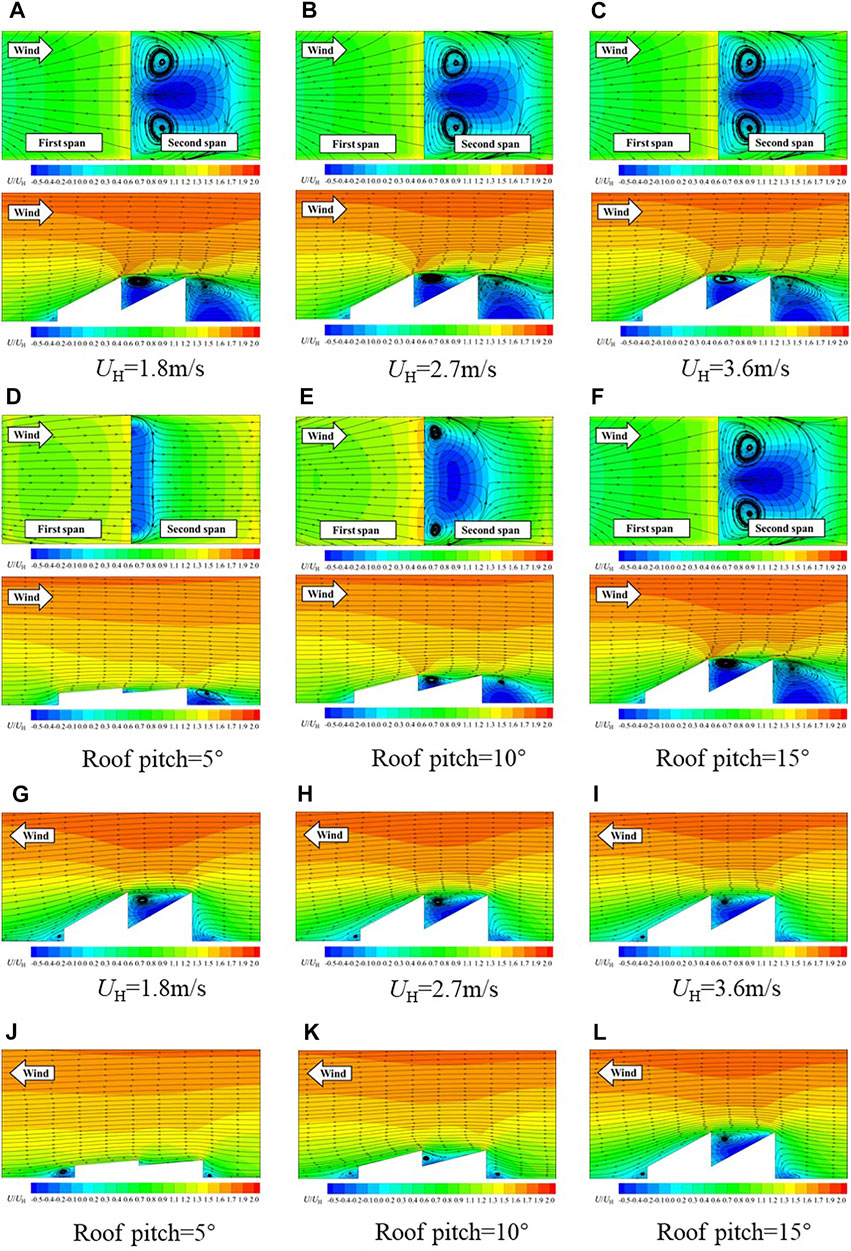
FIGURE 15. Contours of dimensionless wind velocity simulated by CFD. (A-F) positive wind direction and (G-L) negative wind direction.
Figures 15D–F show contours of dimensionless wind velocity under the influence caused by the various roof pitches when UH = 3.6 m/s. The dimensionless wind velocity is obtained by dividing the wind velocity U by the reference wind velocity UH. When the roof pitch is small, the vortex is not fully formed, and the wind speed of the reverse flow is slow. Thus, snow particles primarily get accumulated near the separation point (where the wind velocity equals 0) when brought near the roof by the airflow. It should be noted explicitly that, in this case, the bottom of the valley was suitable for the deposition of snow particles. However, there was no snow accumulation due to the shortage of snow particles supply during the experiment. When the roof pitch increases, the vortex is fully formed, and more snow particles are pushed towards the bottom of the valley by the backflow. Hence, the snow primarily accumulates at the bottom of the valley; the accumulation becomes more focused with increasing wind speed.
Figure 15 also shows the contours of dimensionless wind velocity under the “negative direction”, researching the influence caused by the various wind velocities (G, H, I) and roof pitches (J, K, L), respectively. The variation of wind field with roof pitches and wind speeds in the “negative direction” share outright similarity with that of “positive direction”; therefore, some concise analysis is made here with no prolonged repetition. It is indicated that the standing vortex in the second span had the greatest contribution to the headwind snowdrift. In particular, this pattern of snow distribution is identical to the snow distribution at the front of the upwind side of a cube-shaped model. Moreover, increasing the wind speed results in an increasingly unbalanced distribution. The scale of the vortex grew larger with increasing the roof pitch, involving more snow particles, and making it possible for more snow particles to be deposited at the bottom of the valley.
The above analysis indicates that there are two key criteria for the formation of a distinct snowdrift in an area: the first is that there must be a sufficient supply of snow particles and the other is that the wind speed near the roof must be slow enough to satisfy the deposition conditions for the snow particles. In particular, a standing vortex near the roof with a low wind speed may lead to the formation of a distinct snowdrift. Interestingly, more snow accumulates at the bottom of the valley at larger roof pitches (which means the valley becomes larger). It seems that the snow particles try to fill the valley space between the two spans under the effect of the wind field.
5 Conclusion
This study investigated unbalanced snow loads on two-span single-pitched roofs through 36 groups of experiments under different conditions using the new Froude number similarity criteria. In addition, typical cases were selected for numerical simulation to reveal its mechanism further, which indicated that vortices around the model are the main factor influencing the snowdrifts patterns. From the results of this study, the following conclusions could be drawn with sufficient consideration of the limitation of the experiments:
1) The proposed new Froude number similarity criteria can accurately reproduce the snowdrift patterns and wind field around the model through the comparison among different snow-wind combined experiments. By modifying the similarity criterion with the lower limit of friction velocity ratio, the deposition separation phenomenon in front of the model on the windward side and the size of erosion areas on both lateral sides of the model can keep a great consistency with the self-test model and various scaled models. This modification shows higher reliability and accuracy of the similitude criteria.
2) For two-span single-pitched roofs, the snow distribution is determined by all roof pitches, wind velocity, and wind direction. It is the roof pitch that determines the snowdrifts patterns a lot. The increase in roof pitch causes the formation of a bigger vortex in between the two spans and more intense snow accumulation at the valley. The uneven snow distribution will be more obvious with increasing roof pitch. While for each type of roof pitch, the wind velocity has little effect on the snow distribution.
3) For the experiments with the wind in the “positive direction”, only one accumulation area, P1, where the normalized snow depth>1.0 was observed in the valley between two spans. On the other hand, for the experiments with the wind in the “negative direction”, two accumulation areas P3, P4 where the normalized snow depth>1.0 were observed, one at the valley and another was at a distance from the bottom of the valley along the direction of the wind. Besides, it should be noted that the values of P1, P3, and P4 are much greater than the provisions in current building load codes. Thus, it is suggested that a specific provision should be considered for this type of roof.
The current work has the following limitations that will be improved in future studies:
Snow sliding is an important factor for snow distribution, and roof materials also influence it. Nevertheless, the current investigation ignored the influence of different roof materials, which should be considered in future studies. Moreover, there is only the wind field CFD simulation, the snow and wind interaction process can be considered with a more precise numerical simulation method in the future study.
Data Availability Statement
The original contributions presented in the study are included in the article/Supplementary Material, further inquiries can be directed to the corresponding authors.
Author Contributions
GZ proposed the main innovation point of the paper, and made the work design; QZ and HM carried out the expeiments and analysed the expeimental data; RL and ML made the data organization and wrote the manuscript; FF made important modifications to the manuscript and gave the approve of the final paper.
Funding
This work was financially supported by the Funds for Creative Research Groups of National Natural Science Foundation of China (grant number 51921006), the Chinese National Natural Science Foundation project (grant number 51978207, 51927813, 51808169), National Science Fund for Distinguished Young Scholars (grant number 51525802), and Heilongjiang Natural Science Foundation for Excellent Youth project (grant number YQ 2021E030). And Foundation of Key Laboratory of Structures Dynamic Behavior and Control (Ministry of Education) in Harbin Institute of Technology.
Conflict of Interest
The authors declare that the research was conducted in the absence of any commercial or financial relationships that could be construed as a potential conflict of interest.
The handling editor declared a past co-authorship with several of the authors QZ, FF.
Publisher’s Note
All claims expressed in this article are solely those of the authors and do not necessarily represent those of their affiliated organizations, or those of the publisher, the editors and the reviewers. Any product that may be evaluated in this article, or claim that may be made by its manufacturer, is not guaranteed or endorsed by the publisher.
Acknowledgments
The authors are grateful to the Space Structures Research Center members in Harbin Institute of Technology for providing invaluable information and advice in this study. The authors also wish to thank BAJRACHARYA DIWAS for his language support.
References
Beyers, J. H. M., Sundsbø, P. A., and Harms, T. M. (2004). Numerical Simulation of Three-Dimensional, Transient Snow Drifting Around a Cube. J. Wind Eng. Ind. Aerodynamics 92 (9), 725–747. doi:10.1016/j.jweia.2004.03.011
Calkins, D. J. (1974). Model Studies of Drifting Snow Patterns at Safeguard Facilities in North Dakota (No. CRREL-TR-256). Hanover, New Hampshire: Cold Regions Research And Engineering Lab Hanover NH.
Delpech, P., Palier, P., and Gandemer, J. (1998). Snowdrifting Simulation Around Antarctic Buildings. J. Wind Eng. Ind. Aerodynamics 74-76, 567–576. doi:10.1016/s0167-6105(98)00051-8
Delpech, P., and Thiis, T. K. (2015). Applications of "SnoWind" Engineering-Climatic Wind Tunnel Methods.
Fily, M. (1996). Laboratoire de Glaciologie et Geophysique de l’Environnement. Grenoble. Private communication.
Høibø, H. (1988). “Snow Load on Gable Roofs-Results from Snow Load Measurements on Farm Buildings in Norway,” in Proceedings of the First International Conference on Snow Engineering, 89–96. 1988.
Iversen, J. D. (1981). Comparison of Wind-Tunnel Model and Full-Scale Snow Fence Drifts. J. Wind Eng. Ind. Aerodynamics 8 (3), 231–249. doi:10.1016/0167-6105(81)90023-4
Iversen, J. D. (1979). Drifting Snow Similitude. J. Hydr. Div. 105 (6), 737–753. doi:10.1061/jyceaj.0005228
Iversen, J. D. (1983). Saltation Threshold and Deposition Rate Modeling. Dev. Sedimentology 38, 103–113. doi:10.1016/s0070-4571(08)70791-x
Kimbar, G., and Flaga, A. (2008). “A New Approach to Similarity Criteria for Predicting a Snow Load in Wind-Tunnel Experiments,” in Proceedings of the 6th International Conference on Snow Engineering (Whistler, Canada).
Kind, R. J., and Murray, S. B. (1982). Saltation Flow Measurements Relating to Modeling of Snowdrifting. J. Wind Eng. Ind. Aerodynamics 10 (1), 89–102. doi:10.1016/0167-6105(82)90056-3
Kind, R. J. (1986). Snowdrifting: a Review of Modelling Methods. Cold Regions Sci. Technology 12 (3), 217–228. doi:10.1016/0165-232x(86)90036-4
Kwok, K. C. S., Kim, D. H., Smedley, D. J., and Rohde, H. F. (1992). Snowdrift Around Buildings for Antarctic Environment. J. Wind Eng. Ind. Aerodynamics 44 (1-3), 2797–2808. doi:10.1016/0167-6105(92)90073-j
Lehning, M., Löwe, H., Ryser, M., and Raderschall, N. (2008). Inhomogeneous Precipitation Distribution and Snow Transport in Steep Terrain. Water Resour. Res. 44 (7). doi:10.1029/2007wr006545
Li, X., Zhou, M., and Gu, M. (2008). Study on Snow Load Distribution on the Roof of Beijing South Railway Station (Doctoral Dissertation). Shanghai China.
Liu, M. M. (2020). Research on Combined Wind and Snow Test System and Snow Distribution on Roofs. Harbin: Harbin Institute of Technology. (in Chinese). doi:10.27061/d.cnki.ghgdu.2020.000924
Liu, M., Zhang, Q., Fan, F., and Shen, S. (2018). Experiments on Natural Snow Distribution Around Simplified Building Models Based on Open Air Snow-Wind Combined Experimental Facility. J. Wind Eng. Ind. Aerodynamics 173, 1–13. doi:10.1016/j.jweia.2017.12.010
Liu, M., Zhang, Q., Fan, F., and Shen, S. (2019). Modeling of the Snowdrift in Cold Regions: Introduction and Evaluation of a New Approach. Appl. Sci. 9 (16), 3393. doi:10.3390/app9163393
Mo, H. M., Dai, L. Y., Fan, F., Che, T., and Hong, H. P. (2016). Extreme Snow hazard and Ground Snow Load for China. Nat. Hazards 84 (3), 2095–2120. doi:10.1007/s11069-016-2536-1
Mo, H. M., Fan, F., and Hong, H. P. (2015). Snow hazard Estimation and Mapping for a Province in Northeast China. Nat. Hazards 77 (2), 543–558. doi:10.1007/s11069-014-1566-9
Naaim, M., Naaim-Bouvet, F., and Martinez, H. (1998). Numerical Simulation of Drifting Snow: Erosion and Deposition Models. A. Glaciology. 26, 191–196. doi:10.1017/s0260305500014798
Ntinas, G. K., Zhang, G., Fragos, V. P., Bochtis, D. D., and Nikita-Martzopoulou, C. (2014). Airflow Patterns Around Obstacles with Arched and Pitched Roofs: Wind Tunnel Measurements and Direct Simulation. Eur. J. Mech. - B/Fluids 43, 216–229. doi:10.1016/j.euromechflu.2013.09.004
Odar, F. (1965). Simulation of Drifting Snow. Hanover. NH: Cold Regions Research and Engineering Laboratory. Research Report 174.
Oikawa, S., Tomabechi, T., and Ishihara, T. (1999). One-day Observations of Snowdrifts Around a Model Cube. J. Snow Eng. Jpn. 15 (4), 283–291. doi:10.4106/jsse.15.4_283
O’Rourke, M., and Auren, M. (1997). Snow Loads on Gable Roofs. J. Struct. Eng. 123 (12), 1645–1651. doi:10.1061/(ASCE)0733-9445(1997)123:12(1645)
Qiang, S., Zhou, X., Kosugi, K., and Gu, M. (2019). A Study of Snow Drifting on a Flat Roof during Snowfall Based on Simulations in a Cryogenic Wind Tunnel. J. Wind Eng. Ind. Aerodynamics 188, 269–279. doi:10.1016/j.jweia.2019.02.022
Sato, T., Kosugi, K., and Sato, A. (2001). Saltation-layer Structure of Drifting Snow Observed in Wind Tunnel. Ann. Glaciol. 32, 203–208. doi:10.3189/172756401781819184
Scribd (2012). Load Code for the Design of Building Structures, GB 50009-2012. Beijing: China Architecture & Building Press, 26–29.
Shi, J. (2021). Numerical Simulation of Snow Distribution on Two-Span Gable Roofs. Harbin: Harbin Institute of Technology. (in Chinese).
Strom, G. H., and Kelly, G. R. (1962). Scale Model Studies on Snow Drifting. Hanover, New Hampshire: Cold Regions Research And Engineering Lab Hanover NH.
Sundsbø, P. A. (1998). Numerical Simulations of Wind Deflection Fins to Control Snow Accumulation in Building Steps. J. Wind Eng. Ind. Aerodynamics 74, 543–552. doi:10.1016/S0167-6105(98)00049-X
Thiis, T. K., and Gjessing, Y. (1999). Large-scale Measurements of Snowdrifts Around Flat-Roofed and Single-Pitch-Roofed Buildings. Cold regions Sci. Technol. 30 (1-3), 175–181. doi:10.1016/s0165-232x(99)00021-x
Thiis, T. K. (2003). Large Scale Studies of Development of Snowdrifts Around Buildings. J. Wind Eng. Ind. Aerodynamics 91 (6), 829–839. doi:10.1016/s0167-6105(02)00474-9
Thiis, T. K., and O’Rourke, M. (2015). Model for Snow Loading on Gable Roofs. J. Struct. Eng. 141 (12), 04015051. doi:10.1061/(asce)st.1943-541x.0001286
Thiis, T. K., and Ramberg, J. F. (2008). “Measurements and Numerical Simulations of Development of Snow Drifts on Curved Roofs,” in Proceedings of the 6th International Conference on Snow Engineering (Whistler, Canada), 1–5.
Tominaga, Y., Mochida, A., Yoshino, H., Shida, T., and Okaze, T. (2006). “CFD Prediction of Snowdrift Around a Cubic Building Model,” in The Fourth International Symposium on Computational Wind Engineering (CWE2006) (Yokohama, Japan), 941–944.
Tominaga, Y., Okaze, T., and Mochida, A. (2011). CFD Modeling of Snowdrift Around a Building: An Overview of Models and Evaluation of a New Approach. Building Environ. 46 (4), 899–910. doi:10.1016/j.buildenv.2010.10.020
Tominaga, Y., Okaze, T., and Mochida, A. (2016). “CFD Simulation of Drift Snow Loads for an Isolated Gable-Roof Building,” in 8th International Conference on Snow Engineering (Nantes France), 14–17. 2016.
Tsuchiya, M., Tomabechi, T., Hongo, T., and Ueda, H. (2002). Wind Effects on Snowdrift on Stepped Flat Roofs. J. wind Eng. Ind. aerodynamics 90 (12-15), 1881–1892. doi:10.1016/s0167-6105(02)00295-7
Zhang, G., Zhang, Q., Fan, F., and Shen, S. (2021). Numerical Simulations of Snowdrift Characteristics on Multi-Span Arch Roofs. J. Wind Eng. Ind. Aerodynamics 212, 104593. doi:10.1016/j.jweia.2021.104593
Zhang, G., Zhang, Q., Fan, F., and Shen, S. (2019). Research on Snow Load Characteristics on a Complex Long-Span Roof Based on Snow-Wind Tunnel Tests. Appl. Sci. 9 (20), 4369. doi:10.3390/app9204369
Zhang, W. X., and Yi, W. J. (2010). Analysis of a One-story Industrial Factory Building Collapsed during Snow Disaster. J. Nat. Disasters 19 (5), 119–124. doi:10.13577/j.jnd.2010.0519 (in Chinese)
Zhou, X., Hu, J., and Gu, M. (2014). Wind Tunnel Test of Snow Loads on a Stepped Flat Roof Using Different Granular Materials. Nat. Hazards 74 (3), 1629–1648. doi:10.1007/s11069-014-1296-z
Zhou, X., Kang, L., Yuan, X., and Gu, M. (2016). Wind Tunnel Test of Snow Redistribution on Flat Roofs. Cold Regions Sci. Technology 127, 49–56. doi:10.1016/j.coldregions.2016.04.006
Zhou, X., Liu, Z., Ma, W., Kosugi, K., and Gu, M. (2021). Experimental Investigation of Snow Drifting on Flat Roofs during Snowfall: Impact of Roof Span and Snowfall Intensity. Cold Regions Sci. Technology 190, 103356. doi:10.1016/j.coldregions.2021.103356
Keywords: multi-span single pitched roofs, wind tunnel, similarity criteria, experiments, unbalanced snow loads
Citation: Zhang G, Zhang Q, Mo H, Li R, Liu M and Fan F (2022) Experimental Investigation of Snow Accumulations on Two-Span Single-Pitched Roofs Based on a New Similarity Criterion. Front. Earth Sci. 10:785010. doi: 10.3389/feart.2022.785010
Received: 28 September 2021; Accepted: 08 April 2022;
Published: 11 May 2022.
Edited by:
Michael Lehning, Swiss Federal Institute of Technology Lausanne, SwitzerlandReviewed by:
Henning Löwe, WSL Institute for Snow and Avalanche Research SLF, SwitzerlandYoshihide Tominaga, Niigata Institute of Technology, Japan
Copyright © 2022 Zhang, Zhang, Mo, Li, Liu and Fan. This is an open-access article distributed under the terms of the Creative Commons Attribution License (CC BY). The use, distribution or reproduction in other forums is permitted, provided the original author(s) and the copyright owner(s) are credited and that the original publication in this journal is cited, in accordance with accepted academic practice. No use, distribution or reproduction is permitted which does not comply with these terms.
*Correspondence: Qingwen Zhang, emhhbmdxd0BoaXQuZWR1LmNu; Huamei Mo, bW9odWFtZWlAaGl0LmVkdS5jbg==
 Guolong Zhang
 Qingwen Zhang
 Huamei Mo
 Rui Li
 Mengmeng Liu1,2
 Feng Fan
