 Yong Yang1,2
 Minsi Zhang
- 1School of Resource and Civil Engineering, Northeastern University, Shenyang, China
- 2School of Civil and Architectural Engineering, East China University of Technology, Nanchang, China
The traditional cutting algorithm has a clear concept and is easy to implement, but it cannot consider the finiteness of the discontinuities. Based on the traditional cutting algorithm, an accurate identification method of blocks is proposed, which can identify blocks formed by finite discontinuities and excavation surface. A visual program for identifying blocks and stability analysis is developed by using Microsoft Foundation Class and OpenGL, and then it is applied to tunnel engineering. The shape and the number of the key blocks identified by this method are not limited and consistent with actual engineering. In the case that the size of the discontinuities cannot be accurately obtained, the influence of the size change of the dominant discontinuities on the key block is discussed, which will make up the lack of parameters. The number and volume of the key blocks are large when discontinuities are assumed to be infinite, and the calculation results are conservative. However, the volume and location of the blocks have great reference value and guiding significance for practical engineering.
Instruction
The rock mass is a complex medium composed of rock and discontinuities. The scale and distribution of discontinuities are diverse. The rock mass structure is formed by the intersection of discontinuities. In rock mass engineering with discontinuities development, the block plays a leading role in the stability of rock mass, so it is very necessary to study the rock block. The key block theory, proposed by Goodman and Shi (1985), takes the blocks on the free face of the rock mass as the research objects. Because of rigorous geometric proof and kinematic analysis, key block theory is widely accepted by researchers and engineers. In the past decades, it has been widely used in practical engineering and achieved good results. Based on the key block theory, Chan and Goodman (1987) analyzed the stability of the rock mass under different excavation schemes and obtained the optimal design scheme of underground engineering. Yarahmadi Bafghiy and Verdel (2003) applied probability theory to block theory and obtained the probability distribution of key blocks.
In jointed tunnel engineering, serious economic loss and construction delay will occur with blocks instability. Because of the limitations of the geological survey technique, it is impossible to obtain the exact dimensions of the discontinuities. The traditional cutting algorithm treats discontinuities as infinite planes, which will result in distortion of the calculation results. Therefore, for such engineering, it is necessary to discuss the sizes of the discontinuities to get more scientific calculation results and serve for the engineering design. The identification of the blocks considering the finiteness of discontinuities is a basic and difficult issue in block theory.
At present, there are two identification methods of the blocks when the discontinuities and excavation surface are fixed. The first is the boundary-tracing approach. Goodman and Shi (1985) identified blocks by searching closed loops in the intersection line. Lin et al. (1987) studied the block geometry and identification approach based on the simple homological theory in topology, and then Jing (2000), Lu (2002) provided a more detailed algorithm and the corresponding data structures. Ikegawa and Hudson (1992) proposed the direct body concept, which unified convex polyhedron and concave polyhedron. Based on the concept of the direct body, Zhang, (2015) proposed the closure principle for block identification. Jafari et al. (2011) described a new approach to the problem of geometrically defining polyhedral rock blocks created by the intersection of discontinuities in a rock mass. In the boundary-tracing method, the description of complex concave blocks may be ambiguous in the case of dense finite discontinuities. With the contributions from the researchers, this method is becoming more robust, but at the cost of complexity.
The second is the cutting algorithm. In this cutting algorithm, the plane in which the discontinuity lies cuts a block into two child blocks. Yu et al. (2009) and Xia et al. (2015) identified blocks by dividing the rock mass into several subregions, cutting blocks with planes, and finally splicing the subregions. Based on this, Zhang et al. (2018) and Zhang et al. (2019) searched blocks by constructing different element objects, and then Wang et al. (2021) proposed an efficient method to judge the mobility of rock blocks; Zhang et al. (2010), Zheng et al. (2015) realized the identification of complex blocks by cutting and merging elements in the finite element model. Zheng et al. (2016) studied the calculation accuracy of intersection points. To reduce the storage space of block data, Boon et al. (2015) proposed a single data structure consisting only of the faces. Block identification is a basic research, which can be combined with the discrete fracture networks and probability theory; distribution forecast of blocks (Wang et al., 2013; Zheng et al., 2017) and quality evaluation of rock mass (Palmstrom, 2005; Ni et al., 2017) can be carried out. Zhang et al. (2019) used this method to identify blocks and then evaluate face stability under disc cutters loading of TBM. The cutting algorithm is clear in concept and easy to implement. However, this method cannot consider the finiteness of discontinuities. When the cutting algorithm is used in the finite element model, the finiteness of discontinuities can be considered. However, current computer capacity is not sufficient for projects including a lot of discontinuities.
In this article, based on the cutting algorithm, a new method for block identification is proposed, which is suitable for tunnel engineering and can identify the blocks formed by finite discontinuities and excavation surfaces. A visual program for identification of the blocks and stability analysis is developed by the Microsoft Foundation Class (MFC) and OpenGL. The program is applied to a transport tunnel, and the influence of the discontinuities sizes on the stability of tunnel surrounding rock is discussed.
The Key Block Theory
The Removability of Blocks
The concept of the pyramid proposed by Goodman and Shi (1985) is described as follows: When the discontinuities and the free faces are transferred and intersected at the same point, different types of pyramids will be formed. The pyramid formed by the discontinuities is called joint pyramids (JP). The space is divided into two parts by the free face, of which the side of the rock mass is called the excavation pyramid (EP). If the following formula is satisfied, removable blocks will be formed by the discontinuities and free face:
Identification of the Key Blocks
Figure 1 is a diagram of the forces on a block. The following formula can be obtained from the equilibrium principle of rigid bodies:
ϕl is the internal friction angle of the sliding surface; Nl is the pressure on the sliding surface; F is the residual sliding force;
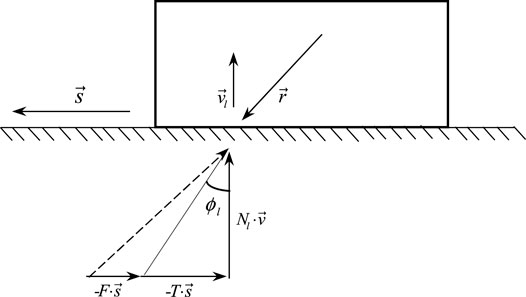
FIGURE 1. The force analysis of a block.
There are three sliding modes, block falling, sliding on single face, and sliding on two faces.
(1) Block Falling
(2) Sliding on single face
(3) Sliding on two faces
When F > 0, the block will be removable. When F ≤ 0, the block will be stable.
The Stability Coefficient
The stability coefficient of a removable block is defined as the ratio of the resistance to the sliding force. As the tensile strength of the discontinuity is 0, there is no resistance when the block falls. This is the most dangerous sliding mode. The stability coefficients of the other two sliding modes are calculated according to the following method:
(1) Sliding on Single Face
When the block slides along single plane i, the stability coefficient is as follows:
(2) Sliding on Two Faces
When the block slides along the planes i and j, the stability coefficient is as follows:
In Eqs 9, 10, Ci and Cj are the cohesions of sliding faces i and j; Si and Sj are the areas of sliding faces i and j; Ni and Nj are the pressures acting on the sliding faces i and j, and the directions are perpendicular to the sliding face. Ni and Nj are determined by the following formula:
A Method for Identifying Blocks Formed by Finite Discontinuities and Its Visual Program
Based on the cutting algorithm, the identification of the blocks formed by the finite discontinuities is realized through the meshing method.
The Characterization of Discontinuities
It is proved that the size of the discontinuity varies little in different directions in the literature. In this article, discontinuity is simplified as a planar disk. Its parameters are shown in Figure 2A, and its expression is formula (13). Figure 2B shows a network model of discontinuities.
where
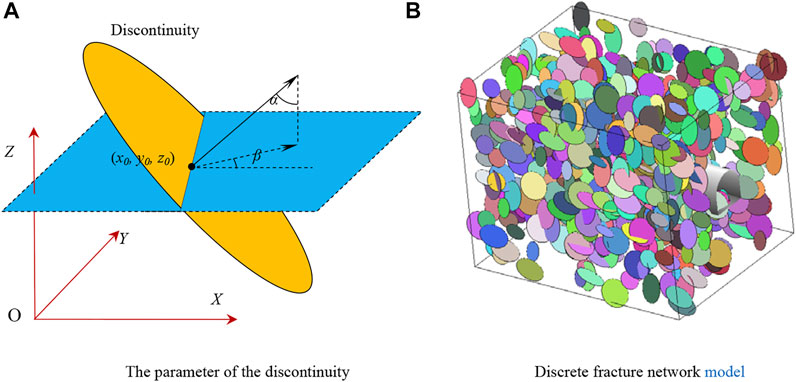
FIGURE 2. Disk model of discontinuities. (A) The parameter of the discontinuity. (B) Discrete fracture network model.
The Characterization of Block and Its Data Storage
As shown in Figure 3, a block is stored in the format of point–line–polygon–polyhedron. A polyhedron is a combination of polygons, which are composed of lines with directions. The direction of the polygon is the normal vector pointing to the inside of the polyhedron, and the directions of the lines and faces comply with the right-hand rule.
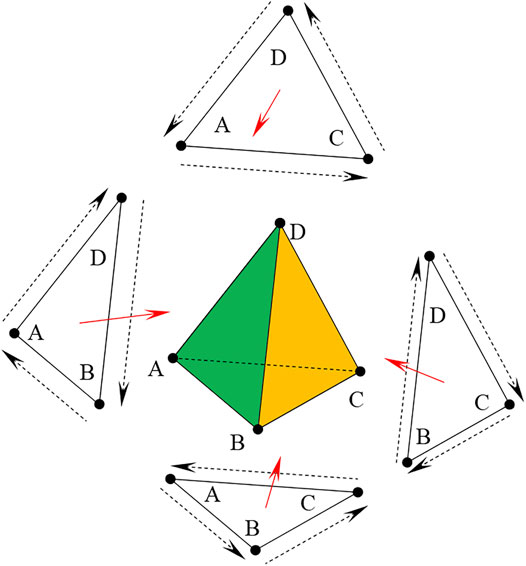
FIGURE 3. Storage mode of the block data.
The direction of the edge can be determined as follows:
where symbols V1 and V2 are, respectively, origin point and end point of the judged edge. MP is a point inside the face. MB is a point inside the block.
The coordinates of MP and MB can be obtained by the following formula:
where symbol m is the number of the vertexes in the judged face. Symbol n is the number of vertexes in the block.
Blocks and their elements are stored in the dynamically linked lists, which makes it easy to add vertices, edges, faces, and polyhedrons without presetting their number. The data structure of the block is designed as shown in Figure 4. In this data structure, topological relationships between vertices, edges, and faces are defined, and quick queries of elements can be implemented.
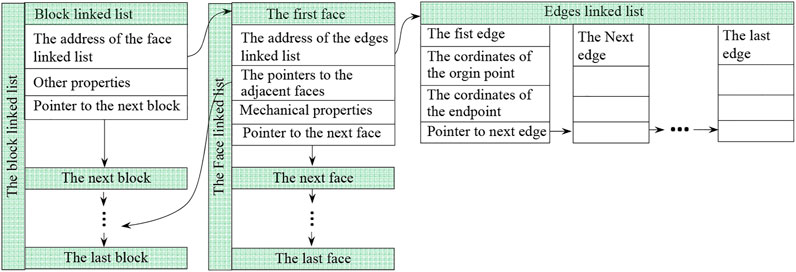
FIGURE 4. Data structure of the block.
Implementation Method
Based on the cutting algorithm, the finiteness of the discontinuity is realized by meshing the study region. The implementation method is illustrated in Figure 5. First, three sets of orthogonal virtual planes are set, and then the rock mass model ABCD is cut into small element blocks by virtual planes using the cutting algorithm. Then, discontinuities J1-J4 are introduced to the model one by one, and the elements that intersect the discontinuities (shadow elements) are cut into two parts. Finally, the virtual plane is removed, and elements are integrated into two blocks, E and M. The concept of this method is clear and easy to implement. The meshing can be realized by the cutting algorithm. The fusion of two adjacent elements divided by the same virtual plane is essentially the fusion of two adjacent edges. As shown in Figure 5A, elements U1 and U2 are fused into block U, and block U will continue to be fused with surrounding elements to construct the block system. Figure 5B is an example of this method.
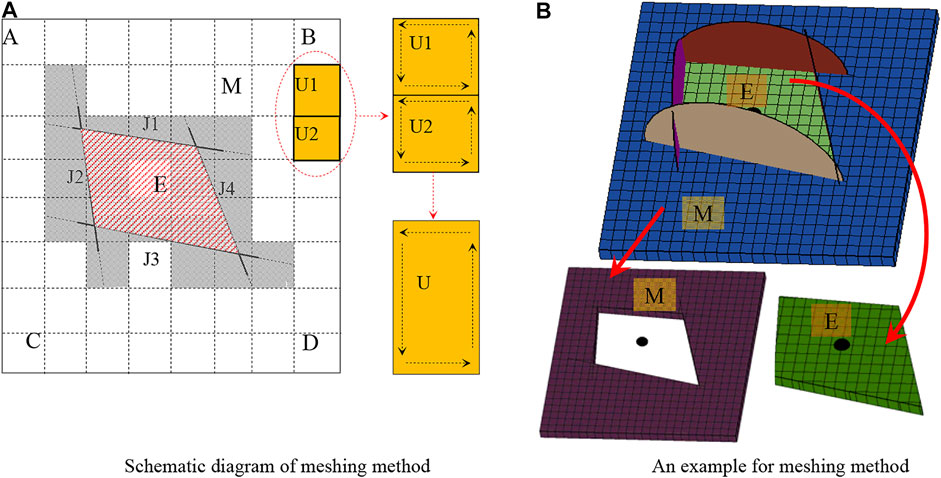
FIGURE 5. Block identification method based on meshing. (A) Schematic diagram of meshing method. (B) An example for meshing method.
The Cutting Algorithm
The cutting plane Ps is expressed by the following formula:
The point M is a point in space, and its coordinates are (x, y, z). We define the following formula:
According to the position relationship between polygons and cutting planes, polygons in a block are divided into three types: Ⅰ, Ⅱ, and Ⅲ.
Ai is the vertex of a polygon, where i = 1, …, n. n is the number of the vertexes in the polygon. Polygons are classified as follows:Ⅰ-type:
Ⅱ-type:
Ⅲ-type:
In a block, F1, F2, and F3 are, respectively, sets of Ⅰ-, Ⅱ-, and Ⅲ-type faces; Ⅲ-type faces are cut into a Ⅰ-type face and a Ⅱ-type face by the cutting plane. L is a set of intersecting lines between Ps and Ⅲ-type faces. P is a polygon composed of all the edges in the set L.
Let the sets B1 and B2 satisfy the following equation:
All faces in B1 are combined into a block above the cutting plane, and all faces in B2 are combined into a block bellow the cutting plane.
This algorithm assumes that the discontinuity penetrates through the blocks that intersect with it. The discontinuity is expanded unpredictably. When the number of discontinuity is small and the size of polyhedron is large, the calculation result is often greatly different from the real situation. As shown in Figure 6, discontinuity D1 intersects with block B, but it does not penetrate through block B. Discontinuity D2 penetrates through block B. Although D1 and D2 have different positions and sizes, the results obtained by the traditional cutting algorithm are the same. Block B is divided into B1 and B2 by the plane in which D1 or D2 lie.
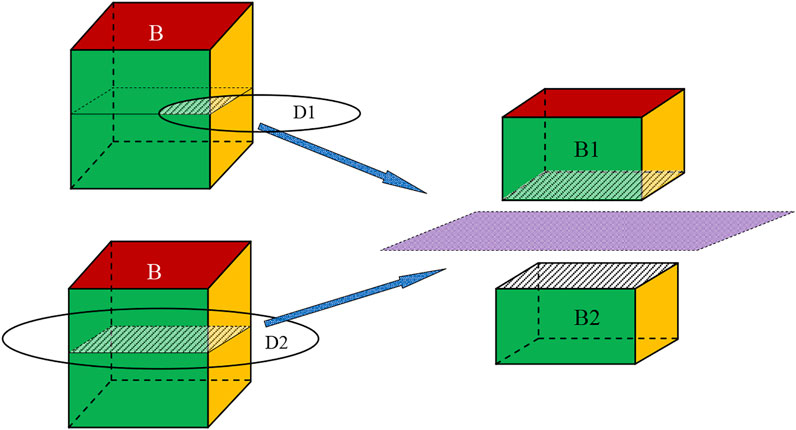
FIGURE 6. The discontinuity cut polyhedron.
The Role of Meshing
In the above cutting algorithm, the discontinuities will be enlarged. This disadvantage can be avoided by introducing a mesh before cutting.
Figure 7 is used to compare the traditional algorithm and meshing algorithm in terms of block identification. As shown in Figure 7A, there are three discontinuities (D1–D3) in the rock mass, and the rock mass will actually be divided into two parts (B1 and B2). According to the traditional cutting algorithm, seven blocks (B1–B7) are formed as shown in Figure 7B. The size of the discontinuity is enlarged by this method, and the enlarged degree is unpredictable. The dotted lines represent the extended parts of the discontinuities. In this example, the three discontinuities are considered to penetrate through the study area. Therefore, this method is suitable for identifying blocks formed by infinite discontinuities, and the size of the discontinuity cannot be considered in the calculation process.
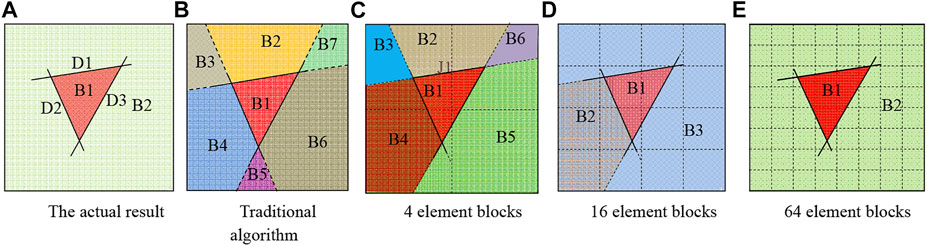
FIGURE 7. The comparison between traditional and meshing algorithm. (A) The actual result. (B) Traditional algorithm. (C) Four-element blocks. (D) Sixteen-element blocks. (E) Sixty-four-element blocks.
The meshing algorithm can limit the size of the discontinuities, and when the number of elements is large enough, the result is close to the real situation. When the rock mass is divided into four elements (2 × 2), six blocks (B1–B6) will be formed as shown in Figure 7C. When the rock mass is divided into 16 elements (4 × 4), three blocks (B1–B3) will be formed as shown in Figure 7D. When the rock mass is divided into 64 elements (8 × 8), two blocks (B1-B2) will be formed as shown in Figure 7E, which is the same as the actual result.
A columnar surface can be transformed into multiple planes, and each plane is determined by the intersection points of the excavation surface and element edges.
The Rules of Meshing
The mesh effectively reduces the extension of the discontinuities, and the extension degree is controlled by the mesh size. As shown in Figure 8, seven discontinuities (J1∼J7) with the same size cut three types of elements in different directions. The solid line represents the actual discontinuities, and the dotted line represents the extended part of the discontinuities. In Figure 8A, the elements are formed by orthogonal and equally spaced visual planes, so J1 and Figure 8B J2 are close in elongation. In Figure 8B, the elements are formed by orthogonal and non–equally spaced visual planes, so J3 and J4 have different extensions. In Figure 8C, the elements are formed by nonorthogonal and non–equally spaced visual planes, so J5, J6, and J7 have different extensions. The mesh in Figure 8A is more reasonable in the above three cases.
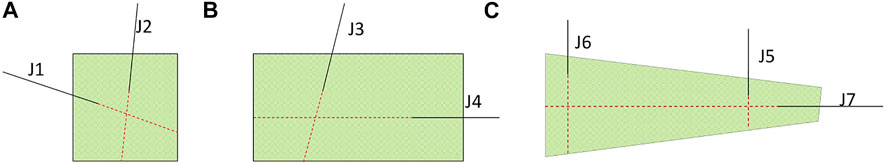
FIGURE 8. Influence of element shape on discontinuities. (A) Square element. (B) Rectangular element. (C) Irregular element.
As can be seen from the above examples, the size of the element block cut by the virtual plane should be uniform in all directions and not too large, so the principle of meshing should be formulated.
(a) The virtual plane used for meshing rock mass model should be orthogonal;
(b) The spacing of the virtual planes depends on the size of the discontinuities. If the size of the discontinuities is large, the spacing can be increased, and vice versa. When only persistent discontinuities exist, the rock mass does not need to be meshed.
Comparison With Traditional Cutting Algorithm
The study area is cut by three sets of discontinuities. The traditional method and mesh method are used for identifying the blocks, respectively. The sizes of the study area are set as 30 × 30 × 30 m, and the radius of all discontinuities is set as 12 m. As shown in Figure 9, the number of elements has a great effect on the block system. In the traditional cutting algorithm, the discontinuities are unpredictably extended, so the calculated results deviate from the real situation. As shown in Figure 9A, the number of blocks formed by the persistent discontinuities is much larger than the actual number of blocks. They show that the number of blocks formed by elements aggregation gradually (Figure 9B) decreases with the increase in the number of elements from Figure 9B to Figure 9F. When the number of elements is 27,000 (Figure 9F), the number of blocks tends to be stable, and the shape of the blocks will remain the same. Therefore, the meshing method can construct blocks system more accurately.
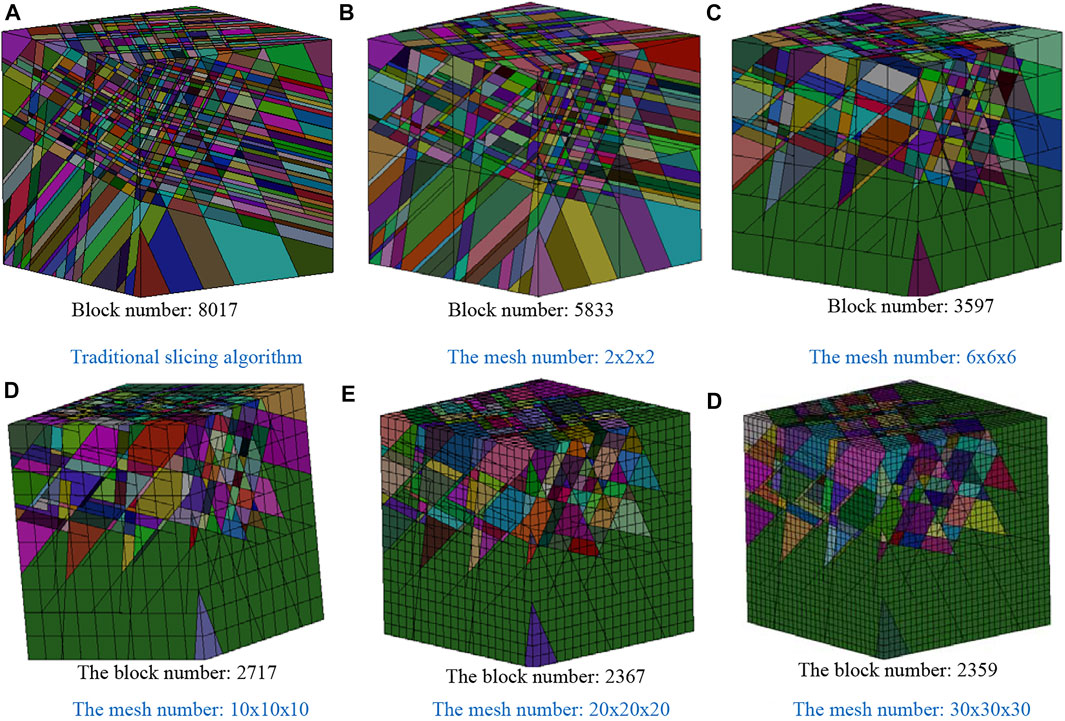
FIGURE 9. The influence of mesh number on the block system. (A) Traditional slicing algorithm. (B) The mesh number: 2 × 2 × 2. (C) The mesh number: 6 × 6 × 6. (D) The mesh number: 10 × 10 × 10. (E) The mesh number: 20 × 20 × 20. (F) The mesh number: 30 × 30 × 30.
The Visual Program Development
Based on the above methods, the rock mass structure analysis system (GeoSMA-3D) is developed, which can construct the system of the rock blocks according to the information of the discontinuities and judge the stability of the surrounding rock mass by the key block theory. MFC is adopted, and the software interface framework is formed automatically.
The development process of the program is shown in Figure 10. The more popular form controls are embedded to realize the input of discontinuities and the display of block information. The model of the rock mass is constructed in two ways. The complex model can be described in terms of face elements. The face elements are described by ordered vertexes and written to a text file that can be imported into the program. For simple models, a dialog box can be used for parametric modeling. The parameters of the discontinuities can be entered from the table on the interface or imported from the text file.
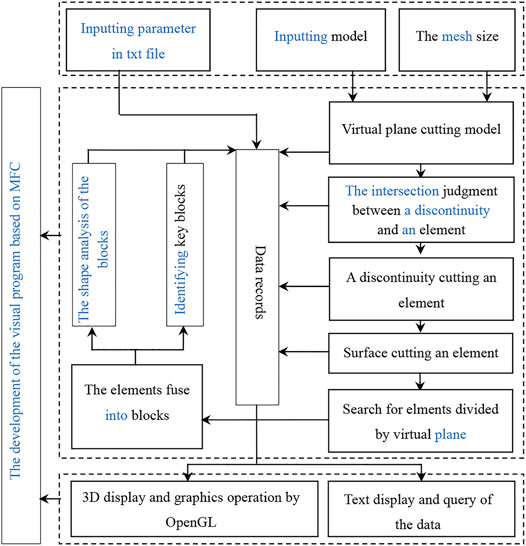
FIGURE 10. The development process of the visual program.
The functions of the software include the trace display of the discontinuities on the excavation surface and the model boundary, the discontinuity display, arbitrary section analysis, identifying key blocks, data output and query of key blocks, and the visualization of data. Figure 11 shows the operation interface and menu of GeoSMA-3D. Compared with the traditional methods, the sizes of the discontinuities are limited, which can realize the construction of a complex block system.

FIGURE 11. GeoSMA-3D system.
A Case Study
Description of the Study Area
A tunnel in Liaoning province is 970 m long with a hole diameter of 8.0 m. TBM3# project (K55 + 225 ∼ K55 + 125) is 100 m in length. The joints are well developed. The discontinuities are mostly filled with rock debris and mud. The blocks formed by the discontinuities and the excavation surface have affected the stability of the project, so it is necessary to analyze rock blocks in detail and provide suggestions for the project.
There are 41 discontinuities in this project. Their parameters can be determined according to the trace line diagram of the left wall. According to the roughness of the discontinuities and the filling material, the mechanical properties of discontinuities can be determined by the relevant studies. The center point of the study area is taken as the origin of the coordinate axes, and the axis of the tunnel is taken as the Y axis. The parameters of the discontinuities after coordinate transformation are shown in Table 1. It is a common problem of all underground projects that the sizes of the discontinuities cannot be accurately obtained because of the limitations of geological survey technology. The sizes of the discontinuities are a key factor affecting the number and volume of the rock blocks. In most references, the discontinuities are all assumed to be infinite, which makes the calculation results more conservative. The size information of the discontinuity provided in Table 1 is estimated by the trace lines during the preliminary investigation. Different sizes of discontinuities are discussed in this article to obtain the calculation results close to the actual engineering and provide scientific and objective data for the project.
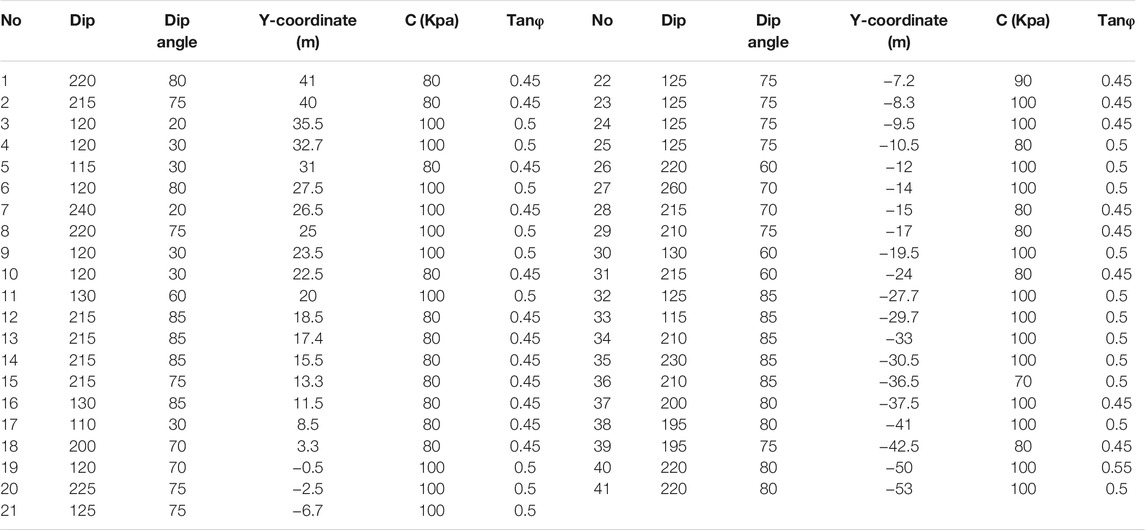
TABLE 1. The parameters of the discontinuities.
The Stability Analysis of Surrounding Rock Block
The Construction of Rock Mass Model
The model of rock mass with a length of 100 m, a width of 40 m, and a height of 40 m is constructed by Geosma-3D. The size of the elements along the tunnel axis is 2 m, and the sizes of the elements in other directions are 1 m. The curve of the excavation surface is a circle with a diameter of 8 m, and the model of the surrounding rock is constructed by the cutting algorithm of the surface. Figure 12 shows the models of the surrounding rock and excavation body.
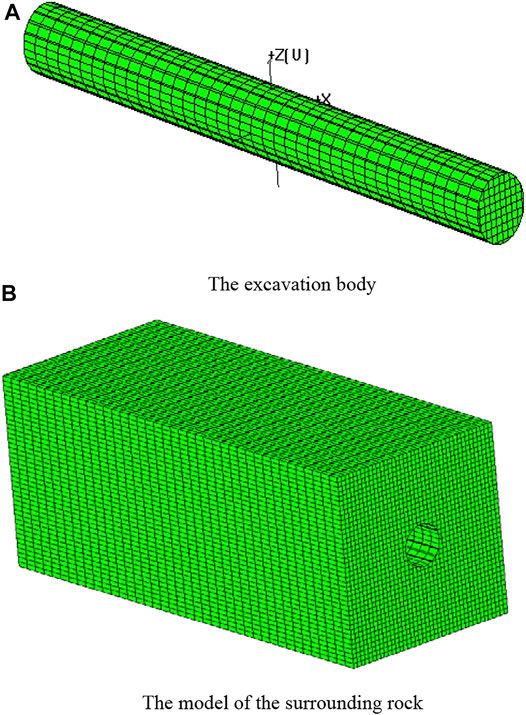
FIGURE 12. Rock mass model of tunnel engineering. (A) The excavation body. (B) The model of the surrounding rock.
The Identification of the Key Blocks and the Display of Results
Because of the limitations of geological survey technology, it is impossible to obtain the sizes of discontinuities accurately. The radii of the discontinuities are all set as 30 m. The information of the key blocks is obtained after calculation. All the key blocks are numbered uniformly. The parameters of the key blocks with a volume greater than 0.1 m3 are shown in Table 2.
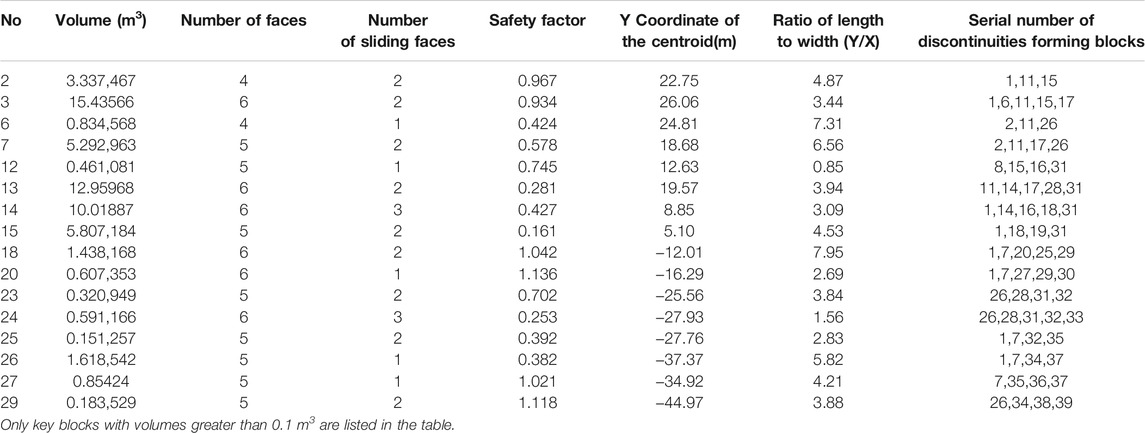
TABLE 2. The information of key block.
The internal structure of the rock mass is shown in Figure 13. Figure 13A is a W-E view, showing the discontinuities in sets Ⅱ and Ⅲ. Figure 13B is an S-N view showing the discontinuities in set Ⅰ. Figure 14 shows the intersection lines of the discontinuities and the selected section, which is consistent with trace lines on the left wall. Figure 15 is the 3D display of the key blocks. The discontinuities in set Ⅰ are dense, whereas the discontinuities in sets Ⅱ and Ⅲ are sparse, so the blocks are mostly flat. The volume distribution of the blocks is shown in Figure 16. The figure shows that the volume of the blocks at the Y axis coordinates of 9, 20, and 26 m is large. These areas should be investigated and supported in time.
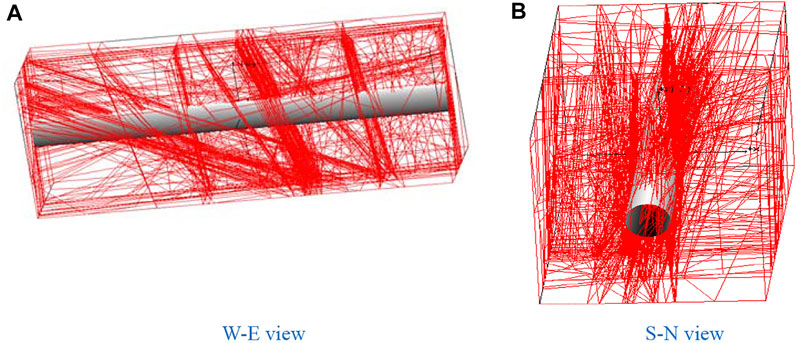
FIGURE 13. The display of the discontinuities. (A) W-E view. (B) S-N view.
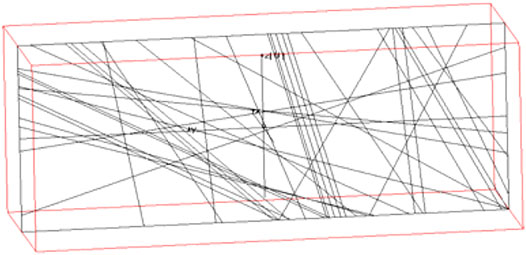
FIGURE 14. The display of the cross-section.
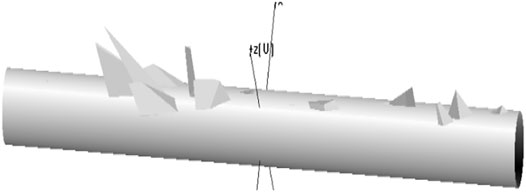
FIGURE 15. The display of the key blocks.
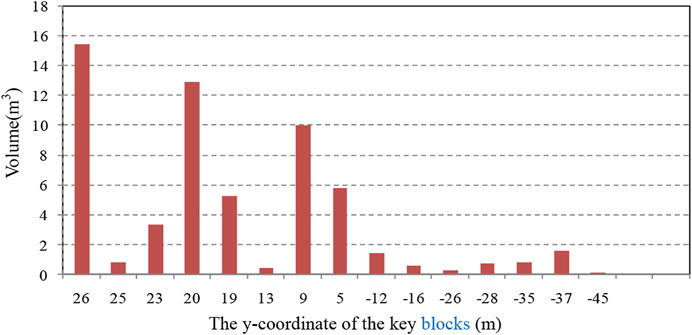
FIGURE 16. Volume distribution of key blocks.
The shape of the blocks with a volume greater than 0.5 m3 is analyzed, and the 3D display is performed in a perspective way, as shown in Figure 17. It shows that the key blocks in this area are tetrahedron, pentahedron, and hexahedron. The ratio of block length to width in this area is mostly between 3 and 8, and the shape of the blocks is consistent with the field investigation. The discontinuities in set Ⅰ play an important role in the formation of the blocks.
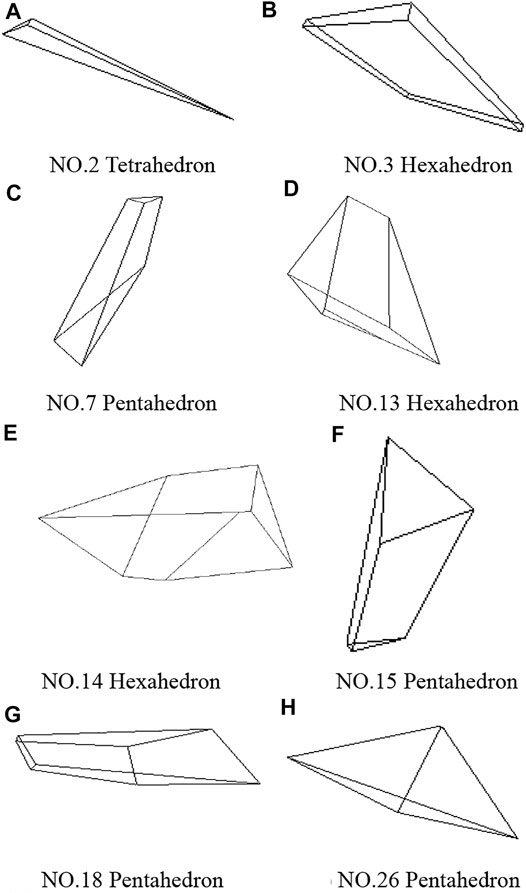
FIGURE 17. The shape of key blocks. (A) No. 2 tetrahedron. (B) No. 3 hexahedron. (C) No. 7 pentahedron. (D) No. 13 hexahedron. (E) No. 14 hexahedron. (F) No. 15 pentahedron. (G) No. 18 pentahedron. (H) No. 26 pentahedron.
The Influence of the Size of the Dominant Discontinuities on Analysis Results
After field investigation, the number of the key blocks obtained by the program is greater than the actual number, because the size of the discontinuities is smaller in the actual project. However, because of the absence of the exact size of the discontinuities, it is necessary to discuss the influence of the size of the dominant discontinuity on analysis results. The discontinuities in set Ⅰ are the dominant discontinuities that form the key blocks because of the small angle (approximately 5°) between discontinuities and the tunnel axis. The discontinuities in sets Ⅱ and Ⅲ are approximately perpendicular to the tunnel axis, and their number is small, so it does not need to be discussed.
The position, dip, dip angle, and quantity of the discontinuities are not changed, but only the size of the discontinuities is changed. Geo-SMA is used to identify key blocks formed by different discontinuities, and the relationship curve between the radii of discontinuities and the volume of the key blocks is obtained as shown in Figure 18. Figure 19 shows the key blocks formed by discontinuities with different radii. It shows that the calculated results are consistent with the actual project when the diameter of the discontinuities is 12 m. The number of key blocks increases with radii of discontinuities. However, the original blocks remain unchanged. When the size of the discontinuities is larger than 20m, the block system obtained by the program will remain unchanged. Therefore, the stability analysis of the blocks under the assumption of infinite discontinuities is conservative, but it has important guiding significance for practical engineering.
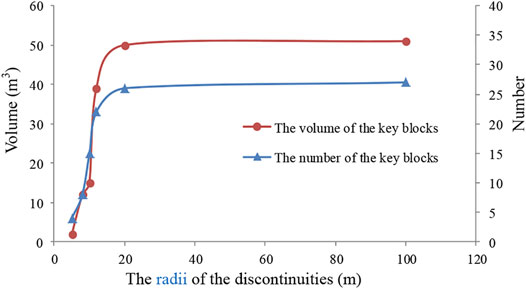
FIGURE 18. Influence of discontinuities radii on key blocks.
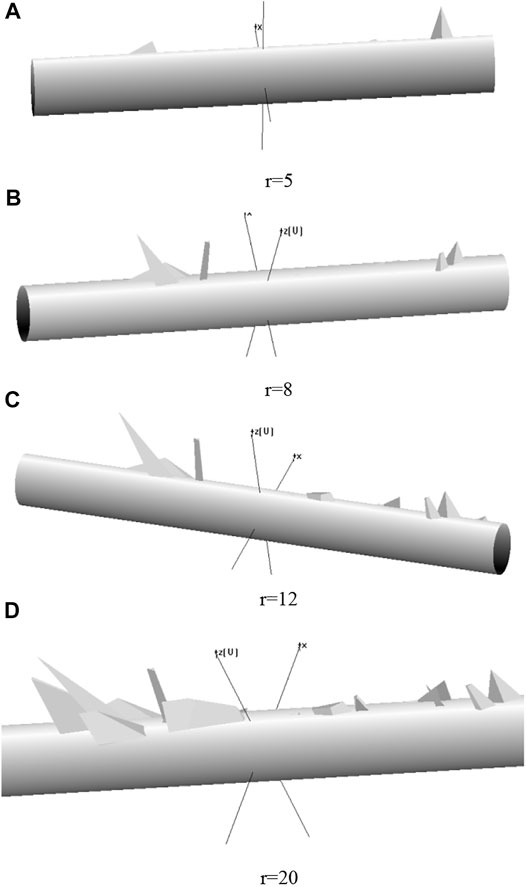
FIGURE 19. The display of the key blocks formed by discontinuities with different radii. (A) r = 5, (B) r = 8, (C) r = 12, (D) r = 20.
Conclusion
(1) Based on the traditional cutting algorithm, an accurate identification method of block considering the finiteness of discontinuities is proposed by introducing the meshing. A dynamic data structure is designed to store block data so that the shape and quantity of blocks are not limited. The accuracy and reliability of the proposed method are verified by a numerical example and the practical project.
(2) Because of the limitations of geological survey techniques, the sizes of the discontinuities are difficult to obtain accurately. The meshing method can limit the size of the discontinuities in the cutting algorithm so that the finiteness of the discontinuities can be considered. The discussion on the size of the dominant discontinuities can make up for the insufficient caused by the absence of the parameters. Although the stability analysis of blocks under the assumption of infinite discontinuities is conservative, it has a reference value and guiding significance for practical engineering.
Data Availability Statement
The original contributions presented in the study are included in the article/Supplementary Material, further inquiries can be directed to the corresponding authors.
Author Contributions
YY: Writing - Original Draft; the computer code and supporting algorithms; SW: Management and coordination responsibility for the research activity planning and execution; MZ: Conceptualization ideas; Writing- Reviewing and Editing. BW: Acquisition of the financial support for the project leading to this publication.
Funding
This study was supported by the National Natural Science Foundation of China (Grant number: 51864001 and 52168055), Academic and Technical Leader Training Program of Jiangxi Province (Grant number: 20212BCJ23003), and Key Research and Development Projects of Jiangxi Province (Grant number: 20202BBG73003).
Conflict of Interest
The authors declare that the research was conducted in the absence of any commercial or financial relationships that could be construed as a potential conflict of interest.
Publisher’s Note
All claims expressed in this article are solely those of the authors and do not necessarily represent those of their affiliated organizations, or those of the publisher, the editors, and the reviewers. Any product that may be evaluated in this article, or claim that may be made by its manufacturer, is not guaranteed or endorsed by the publisher.
References
Boon, C. W., Houlsby, G. T., and Utili, S. (2015). A New Rock Slicing Method Based on Linear Programming. Comput. Geotechnics 65 (apr), 12–29. doi:10.1016/j.compgeo.2014.11.007
Chan, L. Y., and Goodman, R. E. (1987) Predictions the Number of Dimensions of Key Blocks of an Excavation Sing Block Theory and Joint Statistics. in 28th U. S. Symposium on Rock Mechanics. Arizona: Elsevier, 81–87.
Goodman, R. E., and Shi, G. H. (1985). Block Theory and its Application to Rock Engineering. Englewood Cliff: Prentice-Hall.
Ikegawa, Y., and Hudson, J. A. (1992). A Novel Automatic Identification System for Three‐dimensional Multi‐block Systems. Eng. Computations 9, 169–179. doi:10.1108/eb023856
Jafari, A., Khishvand, M., and Rahami, H. (2011). Developing an Algorithm for Reconstruction Blocky Systems in Discontinuous media: Three-Dimensional Analysis. Int. J. Numer. Anal. Methods Geomechanics 37 (7).
Jing, L. (2000). Block System Construction for Three-Dimensional Discrete Element Models of Fractured Rocks. Int. J. Rock Mech. Mining Sci. 37, 645–659. doi:10.1016/S1365-1609(00)00006-X
Lin, D., Fairhurst, C., and Starfield, A. M. (1987). Geometrical Identification of Three-Dimensional Rock Block Systems Using Topological Techniques. Int. J. Rock Mech. Mining Sci. Geomechanics Abstr. 24, 331–338. doi:10.1016/0148-9062(87)92254-6
Lu, J. (2002). Systematic Identification of Polyhedral Rock Blocks with Arbitrary Joints and Faults. Comput. Geotechnics 29, 49–72. doi:10.1016/S0266-352X(01)00018-0
Ni, P., Wang, S., Wang, C., and Zhang, S. (2017). Estimation of REV Size for Fractured Rock Mass Based on Damage Coefficient. Rock Mech. Rock Eng. 50, 555–570. doi:10.1007/s00603-016-1122-x
Palmstrom, A. (2005). Measurements of and Correlations between Block Size and Rock Quality Designation (RQD). Tunnelling Underground Space Tech. 20, 362–377. doi:10.1016/j.tust.2005.01.005
Wang, S., Ni, P., and Guo, M. (2013). Spatial Characterization of Joint Planes and Stability Analysis of Tunnel Blocks. Tunnelling Underground Space Tech. 38, 357–367. doi:10.1016/j.tust.2013.07.017
Wang, S., Zhang, Z., Huang, X., Huang, Y., and Lei, Q. (2021). A Generalized Joint Pyramid Method for Removability Analysis of Rock Blocks: Theoretical Formulation and Numerical Implementation. Comput. Geotechnics 132, 103972. doi:10.1016/j.compgeo.2020.103972
Xia, L., Li, M., Chen, Y., Zheng, Y., and Yu, Q. (2015). Blockiness Level of Rock Mass Around Underground Powerhouse of Three Gorges Project. Tunnelling Underground Space Tech. 48, 67–76. doi:10.1016/j.tust.2015.02.002
Yarahmadi Bafghi, A. R., and Verdel, T. (2003). The Key-Group Method. Int. J. Numer. Anal. Meth. Geomech. 27, 495–511. doi:10.1002/nag.283
Yu, Q., Ohnishi, Y., Xue, G., and Chen, D. (2009). A Generalized Procedure to Identify Three-Dimensional Rock Blocks Around Complex Excavations. Int. J. Numer. Anal. Meth. Geomech. 33, 355–375. doi:10.1002/nag.720
Zhang, Q.-h. (2015). Advances in Three-Dimensional Block Cutting Analysis and its Applications. Comput. Geotechnics 63, 26–32. doi:10.1016/j.compgeo.2014.08.009
Zhang, Y., Xiao, M., and Chen, J. (2010). A New Methodology for Block Identification and its Application in a Large Scale Underground Cavern Complex. Tunnelling Underground Space Tech. 25, 168–180. doi:10.1016/j.tust.2009.10.005
Zhang, Z., Wang, S., and Huang, X. (2018). Analysis on the Evolution of Rock Block Behavior during TBM Tunneling Considering the TBM-Block Interaction. Rock Mech. Rock Eng. 51 (7), 2237–2263. doi:10.1007/s00603-018-1456-7
Zhang, Z., Wang, S., Huang, X., and Rostami, J. (2019). Application of Block Theory for Evaluating Face Stability under Disc Cutters Loading of TBM, Case Study of a Water-Conveyance Tunnel Project. Tunnelling Underground Space Tech. 90, 249–263. doi:10.1016/j.tust.2019.05.002
Zheng, J., Kulatilake, P. H. S. W., and Shu, B. (2017). Improved Probabilistic Kinematic Analysis Procedure Based on Finite Size Discontinuities and its Application to a Rock Slope at Open Pit Mine in U.S. Int. J. Geomech. 17, 04016052. doi:10.1061/(asce)gm.1943-5622.0000721
Zheng, Y., Xia, L., and Yu, Q. (2015). A Method for Identifying Three-Dimensional Rock Blocks Formed by Curved Fractures. Comput. Geotechnics 65, 1–11. doi:10.1016/j.compgeo.2014.11.005
Keywords: block theory, discontinuity, jointed rock mass, key block, tunnel engineering
Citation: Yang Y, Wang S, Zhang M and Wu B (2022) Identification of Key Blocks Considering Finiteness of Discontinuities in Tunnel Engineering. Front. Earth Sci. 10:794936. doi: 10.3389/feart.2022.794936
Received: 14 October 2021; Accepted: 26 January 2022;
Published: 14 March 2022.
Edited by:
Chaojun Jia, Central South University, ChinaCopyright © 2022 Yang, Wang, Zhang and Wu. This is an open-access article distributed under the terms of the Creative Commons Attribution License (CC BY). The use, distribution or reproduction in other forums is permitted, provided the original author(s) and the copyright owner(s) are credited and that the original publication in this journal is cited, in accordance with accepted academic practice. No use, distribution or reproduction is permitted which does not comply with these terms.
*Correspondence: Shuhong Wang, c2h3YW5nQG1haWwubmV1LmVkdS5jbg== Minsi Zhang, bXNjY2NhdGh5QDE2My5jb20=