 Darius Fenner1,2
 Georg Rümpker1,3
 Wei Li1
 Megha Chakraborty1,3
 Johannes Faber1,4
 Jonas Köhler1,3
 Horst Stöcker1,4,5
 Nishtha Srivastava1*
- 1Frankfurt Institute for Advanced Studies, Frankfurt am Main, Germany
- 2Johannes Gutenberg-Universität Mainz, Mainz, Germany
- 3Institute of Geosciences, Goethe-University Frankfurt, Frankfurt am Main, Germany
- 4Institute for Theoretical Physics, Goethe Universität, Frankfurt am Main, Germany
- 5GSI Helmholtzzentrum für Schwerionenforschung GmbH, Darmstadt, Germany
Many active volcanoes exhibit Strombolian activity, which is typically characterized by relatively frequent mild volcanic explosions and also by rare and much more destructive major explosions and paroxysms. Detailed analyses of past major and minor events can help to understand the eruptive behavior of volcanoes and the underlying physical and chemical processes. Catalogs of these eruptions and, specifically, seismo-volcanic events may be generated using continuous seismic recordings at stations in the proximity of volcanoes. However, in many cases, the analysis of the recordings relies heavily on the manual picking of events by human experts. Recently developed Machine Learning-based approaches require large training data sets which may not be available a priori. Here, we propose an alternative user-friendly, time-saving, automated approach labelled as: the Adaptive-Window Volcanic Event Selection Analysis Module (AWESAM). This strategy of creating seismo-volcanic event catalogs consists of three main steps: 1) identification of potential volcanic events based on squared ground-velocity amplitudes, an adaptive MaxFilter, and a prominence threshold. 2) catalog consolidation by comparing and verifying the initial detections based on recordings from two different seismic stations. 3) identification and exclusion of signals from regional tectonic earthquakes. The strength of the python package is the reliable detection of very small and frequent events as well as major explosions and paroxysms. Here, it is applied to publicly accessible continuous seismic recordings from two almost equidistant stations at Stromboli volcano in Italy. We tested AWESAM by comparison with a hand-picked catalog and found that around 95% of the seismo-volcanic events with a signal-to-noise ratio above three are detected. In a first application, we derive a new amplitude-frequency relationship from over 290.000 seismo-volcanic events at Stromboli during 2019–2020 which were detected by AWESAM. The module allows for a straightforward generalization and application to other volcanoes with frequent Strombolian activity worldwide. Furthermore, this module can be implemented for volcanoes with rarer explosions.
1 Introduction
The creation of volcanic event catalogs plays an important role in the monitoring of volcanoes. For example, studies to derive amplitude-frequency relations and inter-event time characteristics from catalogs provide important insights in understanding the eruptive behavior of volcanoes. These catalogs not only enable the evaluation of volcanic hazard but also the in-depth investigation of possible precursors based on the historic instrumental data. Furthermore, these studies are also essential to develop and test early warning systems. Compiling these catalogs is time-consuming and challenging for volcanoes with frequent explosive events as it often involves manual work from experts. There are numerous volcanoes which exhibit this type of activity, often called “Strombolian” activity. For example, Sakurajima in Japan, Semeru in Indonesia, as well as Yasur in Vanuatu are Strombolian volcanoes, to name just a few (Nishimura et al., 2016; Nabyl et al., 1997).
Seismological methods have long been used in volcano monitoring as many types of volcanic activities also exhibit a characteristic seismic signature (Wassermann 2012). There are well-developed dense seismic networks around many volcanoes. In particular, different kinds of seismo-volcanic events can be observed at Strombolian volcanoes. Each of them has a characteristic waveform with different frequency spectra.
Volcano-tectonic events, for example, are caused by movements along tectonic fractures (Zobin 2014) and can be recognized by the P- and S-phases. Other types of signals are long period (LP) and very long period (VLP) events. These are characterized by frequencies between 0.2–5 Hz (Clarke et al., 2021) and 0.01–0.2 Hz (Ripepe et al., 2021) respectively. However, these definitions are not univocally applied in the literature. LP and VLP events are thought to be connected with magmatic activity and fluid transport (Nabyl et al., 1997) as well as pressure changes in the magma column (Legrand and Perton 2022). At times, recorded signals exhibit properties of multiple types. These are called hybrid events (Wassermann 2012).
The typical Strombolian activity is usually explained by the coalescing and busting of gas bubbles (Nabyl et al., 1997), which is often accompanied by LP and VLP signals. However, VLPs are not always connected to visible explosions (Ripepe et al., 2021). Another important type of event is volcanic tremor that is characterized by durations from several minutes to months, with a slower onset and decay. The spectral energy is usually dominant between frequencies of 1–6 Hz (Langer and Falsaperla 1996).
At Strombolian volcanoes, all these events are mostly mild. Violent events, such as major explosions and paroxysms, where meter-sized blocks are ejected up to distances of 2.5 km from the vents (Bevilacqua et al., 2020), can pose a serious threat to residents and tourists. The total fallout volume of ejected tephra can be more than 105 m3 (Métrich et al., 2021). At Stromboli, for example, major explosions and paroxysms are observed at irregular time intervals: the last three paroxysms occurred in 2007 and then, after a long hiatus, in July and August of 2019 (Giudicepietro et al., 2020; Bevilacqua et al., 2020; Andronico et al., 2021).
Furthermore, not all types of volcanic activity exhibit a seismic signature; for example some ground deformations caused due to upward magma movement can only be detected with precision using strainmeters (Wassermann 2012). On the other hand, it should also be noted that earthquakes, landslides, anthropogenic sources can cause ground movements, that are recorded by the seismic sensors that can be misinterpreted as eruptive events.
In the following, we use the generic term “seismo-volcanic event” for any local seismic event that is caused by volcanic activity. Here, we do not discriminate among them and also do not speculate about their source mechanism.
To monitor volcanoes, detecting these seismo-volcanic events is of great importance. However, creating a large database of detected seismo-volcanic events from the seismic data is a challenge because, often, it relies on manual event picking (Cortés et al., 2021). Several automatic methods to extract seismo-volcanic events from seismic data have been described previously. The short-term-average/long-term-average (STA/LTA) algorithm (Allen 1978) is a classical phase and event picking algorithm to detect sudden changes, and thus seismo-volcanic events. The downside to this method is that it will not work reliably for seismo-volcanic events with a slowly increasing amplitude and its performance depends heavily on the choice of the following three parameters: short-term and long-term window length, as well as the trigger threshold.
Machine Learning based approaches, for instance, Support Vector Machines (Masotti et al., 2006), Hidden Markov Models (Benitez et al., 2009), and Deep Learning Models (Cortés et al., 2021) may also be applied. The drawback of these methods is that they require large labeled training, testing and validation datasets. These datasets must be created by other means, which may be time-consuming and labor-intensive. Another challenge for methods based on Machine Learning is the reliable detection of large seismo-volcanic events, since they are also extremely rare in the training data sets.
In order to overcome these drawbacks, we introduce the Adaptive-Window Volcanic Event Selection Analysis Module (AWESAM) to generate catalogs of seismo-volcanic events from recordings at a seismic station located in the proximity of a volcano. The catalogs contain the maximum-amplitude and corresponding time information of the seismo-volcanic events during a certain period. Additional information, such as the waveform or the duration of the event, can also be extracted. Figure 1 gives an overview of the whole algorithm. The strength of this algorithm is its ability to not only detect rare, very large events but also the frequent, small events based on seismic recordings only. This is possible due to an adaptive filter algorithm, which we describe in sub-section 2.2.4. The package is optimized to detect events even when the signal to noise ratio is relatively small. Also, the method is easily adaptable to different volcanoes and it is, therefore, beneficial for monitoring both volcanoes that are extensively studied, such as Stromboli, as well as others where seismic recordings are relatively sparse. Furthermore, the algorithm includes a method for validating the initially detected seismo-volcanic events with the help of a second station. In this step, which we call catalog consolidation, local disturbances that only occur at one of the stations, and may lead to false detections, are excluded by comparison with the recordings at the second station. This step is also used to identify and exclude tectonic earthquakes from the catalog. The different steps are executed together in one workflow, i.e, the application provides a combined implementation of all functionalities.
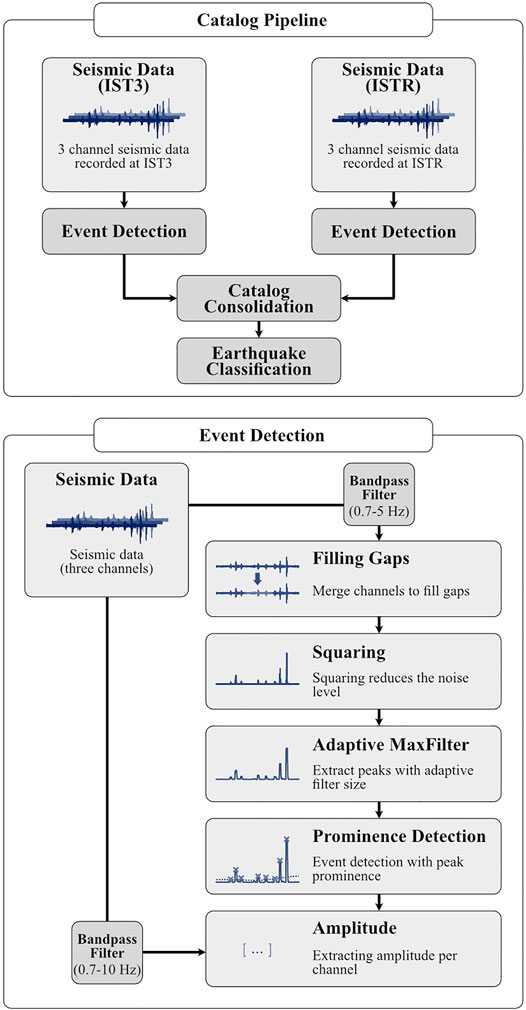
FIGURE 1. Overview of the catalog creation process using AWESAM including seismo-volcanic event detection, catalog consolidation and earthquake classification.
Altogether, AWESAM is a powerful module to create more complete seismo-volcanic event catalogs with the time and amplitude information extracted from unlabeled raw seismic waveforms. In this study, as a first major step, we focus on the detection of as many seismo-volcanic events as possible. Further classification and identification of possible source mechanisms will be part of future work.
In this study, we focus on Stromboli volcano in the Mediterranean Sea (Figure 2A). Several volcanic monitoring activities are being carried out at Stromboli which include the use of seismic stations, cameras, tiltmeters and more. A catalog of VLP events is also available (see e.g., http://eolo.ov.ingv.it/eolo/, (Auger et al., 2006); http://lgs.geo.unifi.it/index.php/monitoring/volcanoes/stromboli2). Furthermore, INGV counts explosions in a weekly bulletin (https://www.ct.ingv.it/). While this method is very accurate, it is also very labor-intensive, time consuming and might not be applicable to other volcanoes. The methods and code presented here save time and are applicable to a number of additional volcanoes to be investigated in future studies. Specifically, the module can be applied to other Strombolian volcanoes, but also to volcanoes with less frequent activity.
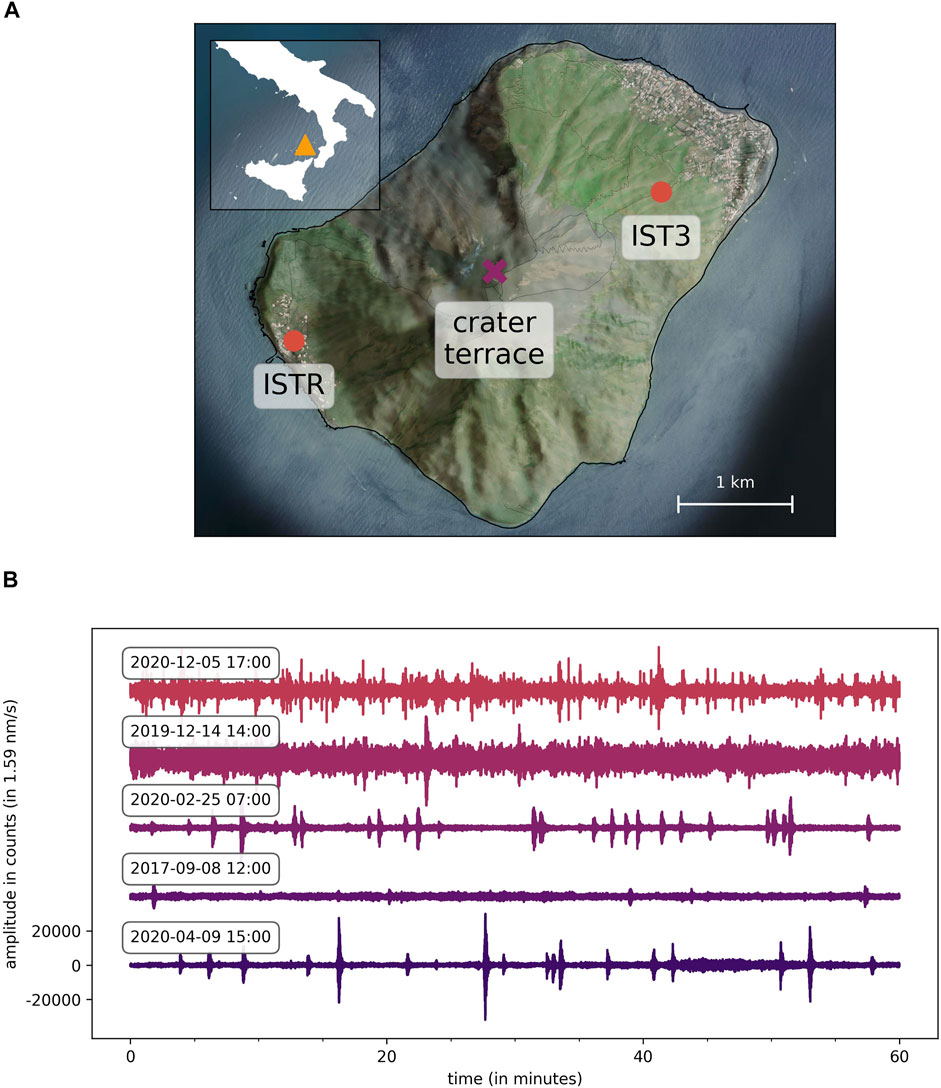
FIGURE 2. (A) IST3 and ISTR are the two almost equidistant seismic stations on Stromboli used for the detection of volcanic events (topographic data from openstreetmap.org (OpenStreetMap 2017)). (B) Example seismic data with different noise levels and inter-event times recorded at station IST3, channel HHN.
2 Compilation of Seismo-Volcanic Event Catalogs
The different steps of the seismo-volcanic event detection algorithm are outlined in the next sections. See Figure 1 for an overview. AWESAM is implemented with the help of the SciPy (Virtanen et al., 2020) ecosystem and obspy (Beyreuther et al., 2010).
2.1 Data Sources - IST3 and ISTR on Stromboli
AWESAM was developed with seismic data recorded at Stromboli, one of the most active volcanoes. The volcano forms a 3 × 4 km island that rises 924 m above sea level, located north of Sicily as part of the Aeolian Islands. There are typically 0 to 25 Strombolian explosions per hour. This activity has been going on since about the 8th century AD (Andronico et al., 2021). However, in our analysis we noticed that the explosion rate varies greatly and can increase up to 60 explosions per hour. These explosions occur at multiple vents located in the crater terrace and eject pyroclastic material up to several tens of meters. The number and position of the vents can change over time (Giudicepietro et al., 2020). As already described in the introduction, this activity is also disrupted by major explosions and paroxysms, which occur in irregular time intervals.
The two seismic stations used by AWESAM are located on opposite sides of the island and have approximately equal distance to the crater area (1a). They are operated by the Istituto Nazionale di Geofisica e Vulcanologia (INGV) and the data is accessible through the INGV Seismological Data Center (INGV Data Centre 2006). The sampling rates are 100 Hz with three channels per station (HHN, HHE, HHZ).
Figure 2B shows signals recorded at IST3 at randomly chosen dates. Both the noise level and the frequency of the eruptions vary greatly. The noise level, which is partly induced by ocean waves and wind (Bormann 2015), obscures some small-amplitude events, making them difficult or impossible to detect. Hence it is a challenge for the algorithm to recognize as many of these small seismo-volcanic events as possible.
2.2 Seismo-Volcanic Event Detection
2.2.1 Complementing Channels
Channel HHN has the maximum amplitude for seismo-volcanic events in almost all cases considered. The reason is that the wavefield at the two stations is mainly horizontally polarized (Giudicepietro et al., 2020). Therefore it would be ideal to always use the HHN-channel. However, there are relatively frequent gaps in the recorded signals. In 2019 and 2020 (averaged over the three channels) 1% (IST3 2012) and 11% (ISTR), respectively, of the data are missing. It also turned out that gaps present in one channel are not always present in the other channels. Therefore, periods where HHN is missing are filled with data from HHE and HHZ. Thereby, the HHE channel is advantaged, as it has the second-largest amplitude. Hence, a stream with as few gaps as possible is generated. In this step, the channels are just composed, without scaling them with a factor.
2.2.2 Filtering
After a continuous signal has been obtained, local disturbances in the data have to be excluded as best as possible. The source of the disturbances is partly unknown. Some may be caused by electrical malfunctions or maintenance/repair work. Figure 3A shows some examples, including an earthquake signal (6.5 M, 500 km from Stromboli). In the original signal, the disturbances may partially or completely cover the volcanic signals, making it impossible to detect them. However, the frequency spectrum of disturbances, which often ranges from 5 to 40 Hz, differs significantly from that of seismo-volcanic events (mostly 0.7–5 Hz, see Figure 3B).
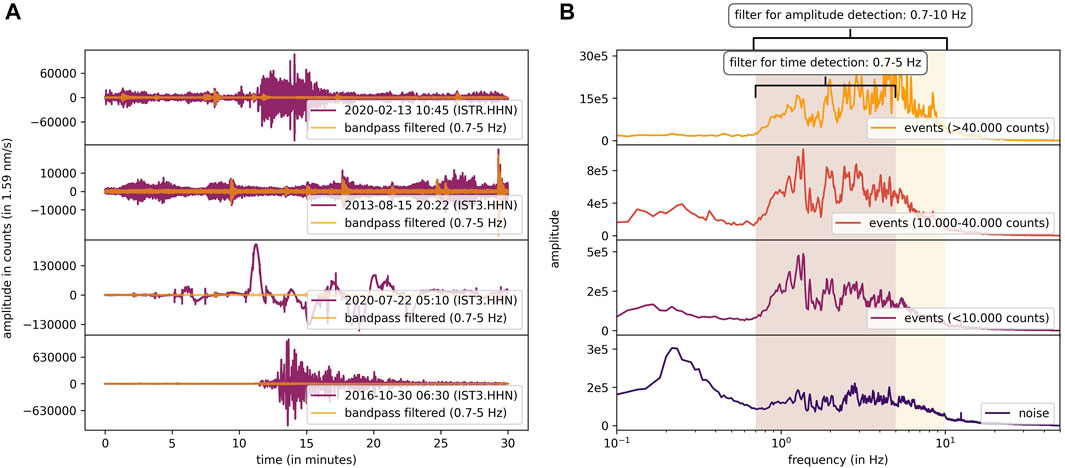
FIGURE 3. (A) Local disturbances at Stromboli. Their source is partly unknown. Because they can completely obscure seismo-volcanic events, a band-pass filter (0.7–5 Hz) is applied, which is effective in removing the disturbances in most cases. (B) Spectra of seismo-volcanic events with different signal amplitudes and noise levels (averaged spectra for 100 signals each). The intensity of noise is largest for frequencies near 0.2 Hz, probably due to ocean microseisms (Ardhuin et al., 2011). The main frequency range for explosive events is between 0.7 and 10 Hz.
Therefore we use a second-order bandpass filter between 0.7 and 5 Hz. Figure 3A visualizes the recovered volcanic signal. Moreover, the earthquake signal has been filtered out as well. Note that this only works for distant, high magnitude earthquakes, because their frequencies are sufficiently low. The remaining earthquakes are identified using the method described in section 2.4. A disadvantage of this filter is that it may exclude some type of events, e.g., VLP events that have a frequency below 0.7 Hz (0.01–0.2 Hz (Ripepe et al., 2021)). However, this filter leads to a 10–40% change in the amplitude of eruptions. Unfortunately, there is no clear correlation between the filtered and unfiltered amplitude. For this reason, a slightly modified passband (0.7–10 Hz) is used to extract the amplitudes. This allows the resulting maximum amplitude to match the amplitude of the original signal well.
Incidentally, filtering is often used for general denoising. However, the seismo-volcanic events at Stromboli exhibit a similar frequency range as the ambient noise, making this method impractical. Therefore, the filtering is mainly used to exclude the (local) disturbances. Some studies also propose more complex filtering methods: for instance, all values in the time-frequency spectrogram, below a certain threshold, are set to zero (Mousavi and Langston 2016). Still, these algorithms also require a sufficient difference in the frequency content of volcanic eruptions and noise. Finally, Machine Learning models can be used for denoising (Zhang et al., 2020; Weiqiang et al., 2019). In this paper, we do not include a dedicated denoising step.
2.2.3 Squaring
As already indicates, one challenge to detect eruptions is the varying noise level. Here, to reduce the noise level, the value of each sample in the time series data is squared. This step removes negative values in the data, but more importantly, it increases the prominence of peaks drastically. In theory, even higher exponents than 2 could be used. However, this would also make it increasingly difficult to identify smaller seismo-volcanic events.
2.2.4 Adaptive MaxFilter
Generally, detecting peaks in the data can be achieved by applying a prominence threshold (Scipy 2021). At first, the oscillations in the signal must be removed in such a way that each seismo-volcanic event appears as a single peak. One possible solution is to compute the envelope of the data. However, events would still consist of multiple peaks. A better method is the application of a MaxFilter to the data. In this algorithm, a moving time window outputs the maximum value in each time step. By fine-tuning the window size (or filter size), this approach works reliably for most seismo-volcanic events.
While this algorithm works well for seismo-volcanic events of smaller amplitude, it remains difficult to detect larger eruptions that have a substantially different shape and duration (i.e. usually the amplitude decay is much slower). To address this problem, the Adaptive MaxFilter algorithm is proposed; this uses a variable filter size. For large explosions, the filter size automatically increases. Otherwise, the same event would be detected multiple times. Figure 4A illustrates the differences between the two methods.
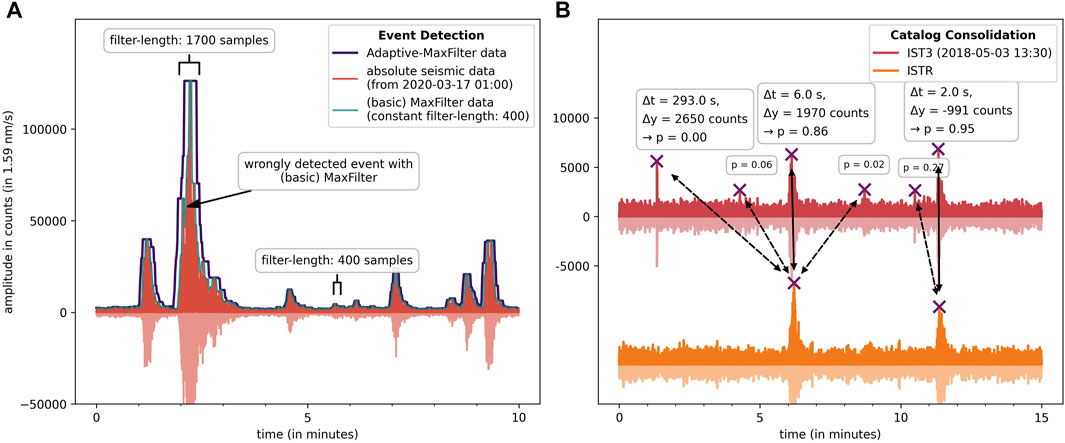
FIGURE 4. (A) Adaptive MaxFilter. The kernel size is adaptively computed from the mean of the absolute data, which enables to reliably detect the seismo-volcanic events of all amplitudes. (B) Catalog consolidation executed on example data to validate the generated catalogs with the signal from a second station. The arrows indicate the closest seismo-volcanic events detected at both stations, from which the distance and probability are computed. The dashed arrows denote that the two events do not correspond to each other. Note that the algorithm only uses the catalogs, the seismic data is just displayed for visualization.
The filter size is determined from the average of the data in a surrounding time window (in this case with a length of 10 min). This approach results in kernel sizes between 300 and 2000 samples. If there is a paroxysm in the corresponding window, it can even increase to up to 10,000 samples.
The stride, which determines the number of samples the time window advances in each step, should be set to 1 to get the best result. However, increasing the stride does not change the outcome of the algorithm substantially. Therefore, a stride of 100 samples is used (resulting in a sample rate of 1 Hz), causing a significant speed-up of the algorithm. Note that only the filter size changes in the Adaptive MaxFilter algorithm while the stride is kept constant. With this approach, we can detect small seismo-volcanic events as well as large paroxysms reliably.
2.2.5 Prominence Detection
In the last step, the time and amplitude of the seismo-volcanic events are computed with a peak detection algorithm (Figure 5). Here, data that were filtered with a 0.7–10 Hz bandpass are used. We found that using the prominence of peaks as the threshold criterion is the best method to discriminate between eruptions and smaller peaks probably originating from background noise (The prominence of a peak is the difference between its height and the lowest point to the next higher peak (Scipy 2021)).
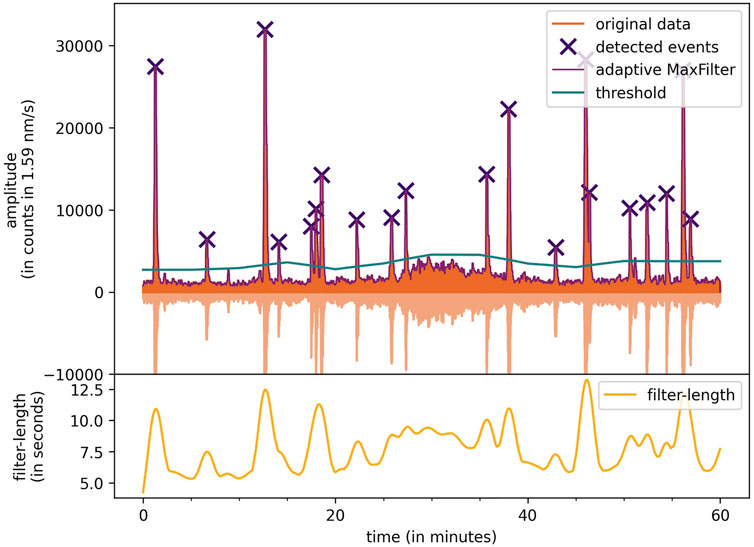
FIGURE 5. Seismo-volcanic event detection algorithm on example data. The adaptive prominence threshold and filter-size is shown.
The changing prominence threshold is necessary to compensate for changes in the noise level and volcanic tremor. It is computed for every 10 min time window (with the data from the same 10 min time window):
where α = 1.5 is a hyper-parameter that defines how many small peaks are detected and μMaxFilter is the average of the data after applying the Adaptive MaxFilter algorithm in the corresponding time window. The ratio of the absolute original data (μdata) to the standard deviation (σdata) can be interpreted as the noise-to-signal ratio.
The result of the prominence detection is an array with the timestamps of all seismo-volcanic events. The amplitude of each can be easily reconstructed from the adaptive MaxFilter-data (after computing the square root, to undo the squaring).
This algorithm allows the creation of solid seismo-volcanic event catalogs. However, some station-specific local disturbances that were not filtered out and tectonic earthquakes are still included. To be able to identify and remove these signals we developed the catalog consolidation algorithm. Note that seismo-volcanic events with a slow onset or amplitude variations related to volcanic tremor are usually not detected. Here, we focus relatively short-term seismo-volcanic events. Also, events that do not induce a seismic signature can not be detected by the proposed method.
2.3 Catalog Consolidation
The goal of this algorithm is to identify local disturbances (which occur at one single station) in a seismo-volcanic event catalog. The idea is that all significant events that occur at both stations must be non-local, thus being volcanic explosions or tectonic earthquakes. However, the catalog consolidation is not necessary to create the final catalog. It is just an additional step to further improve its quality.
As a basis, two catalogs (containing the time and amplitude of volcanic explosions) from two different stations are used. These two catalogs are computed independently with AWESAM’s seismo-volcanic event detection algorithm (section 2.2). In our case, one catalog is generated from the station IST3 (in the following called principal catalog) and the other is obtained using data from ISTR (in the following called complementary catalog). Note that the catalogs can be interchanged, which would lead to minor differences in the final catalog. In this algorithm, the catalog from IST3 is chosen to be the principal catalog since it has generally fewer local interferences, and gaps, as found by manual inspection.
In the main step, for each seismo-volcanic event in the principal catalog, the “closest” entry (regarding a metric defined in Eq. 2) in the complementary catalog is selected. The closer this corresponding event is to the current event in the principal catalog, the higher is the probability that its source is the volcano (Figure 4B). If the distance is large, then there is no corresponding event, which is an indication that the signal is not of volcanic origin. The distance (d) between two events is defined as:
where Δt is the temporal difference and Δy is the difference in amplitude. The metric g is a 2x2-matrix that gives weights to the amplitude and time differences respectively. The metric was determined empirically, to represent a meaningful distance. For example, a 60 s difference in time should result in a higher distance d than a 60 count difference in amplitude.
Furthermore, the metric is a function of the amplitude y of the current event from the principal catalog, because time and amplitude differences of corresponding events usually scale with the amplitude. For example, a 20 s time difference for a large seismo-volcanic event that lasts several minutes should not have a crucial influence, while for a small event it would not be negligible.
Thereby, the higher the distance, the lower the probability that an event’s source is the volcano, and vice versa. This probability is calculated with
to normalize the distance to the interval [0, 1].
Lastly, gaps in the principal catalog are complemented as best as possible with seismo-volcanic events from the complementary catalog. Based on a gap table, which was generated during the detection of eruptions, all events from the complementary catalog that occurred during a gap in the principal catalog are copied to the principal catalog. Note that a gap is only considered if all three channels are missing at the same time.
This complements most gaps in the data, because usually at least one of the two stations delivers a signal in at least one channel. For example, in 2020 there exists no period where both stations have an outtake in all channels simultaneously.
Thereby, in all cases where only one station delivers a signal, no probability is assigned to the seismo-volcanic events. This is important to be able to distinguish events that could be consolidated and ones where there is no additional information available.
The catalog consolidation process, executed on example data, is shown in Figure 6. If the amplitudes in both catalogs for corresponding seismo-volcanic events differ (due to different instruments, for example) a unit conversion is needed. For Stromboli, however, this is not necessary, because the same instruments [IST3 (2012); ISTR 2011] are used and the stations have equal distance to the crater.
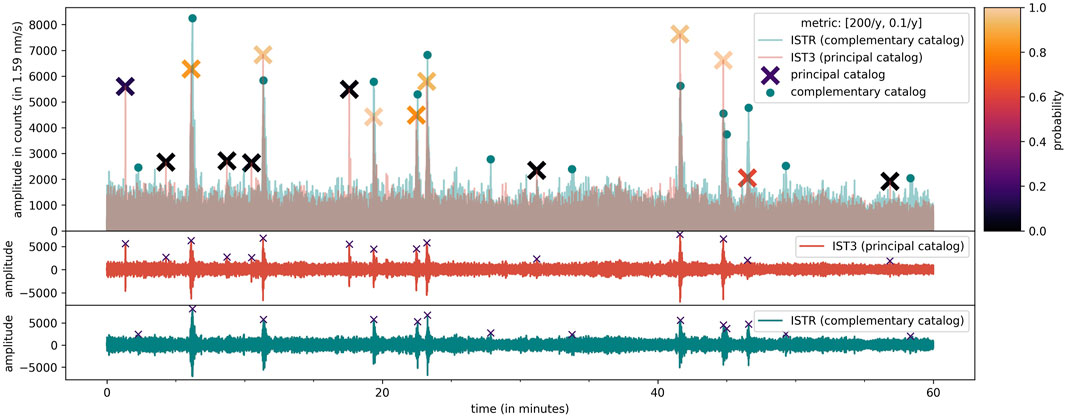
FIGURE 6. Catalog consolidation test. Seismo-volcanic events that only appear at one of the two stations are assigned a small probability (that the source of the signal is the volcano). Events that match in both catalogs have a probability close to 1.
This algorithm effectively removes station-specific disturbances from the catalogs. It can happen that, due to different noise levels, smaller seismo-volcanic events are not detected at one of the stations, and therefore are assigned a low probability to be of volcanic origin. In most cases, however, after filtering, the noise levels are very similar at both stations. Still, if the algorithm is not correctly configured it may assign low probabilities to events of volcanic origin. This only happens for relatively small events that are only recognized in the principal catalog.
2.4 Earthquake Classification
While local disturbances are accounted for during catalog consolidation, tectonic earthquakes are not identified. As shown in Figure 3A, bottom panel, only distant earthquakes may be filtered out. To address the remaining cases, the official earthquake catalog from INGV can be utilized. One problem is that this catalog does not include information about the arrival time and amplitude of an earthquake at Stromboli, but only information about its origin time and hypocenter. To identify events in the seismic data as earthquakes, the local arrival time and amplitude have to be estimated.
To estimate these two parameters, we determine the arrival time and amplitude manually for dozens of larger earthquakes, which can be clearly seen in the seismic data. Based on this, as expected, a correlation between distance and arrival time can be seen clearly in Figure 7A. The proportionality constant is
where T is the time of the earthquake at the hypocenter and s is the distance of the hypocenter to the craters of Stromboli. Note that the distance to Stromboli takes the focal depth of earthquakes, but not the curvature of the Earth, into account.
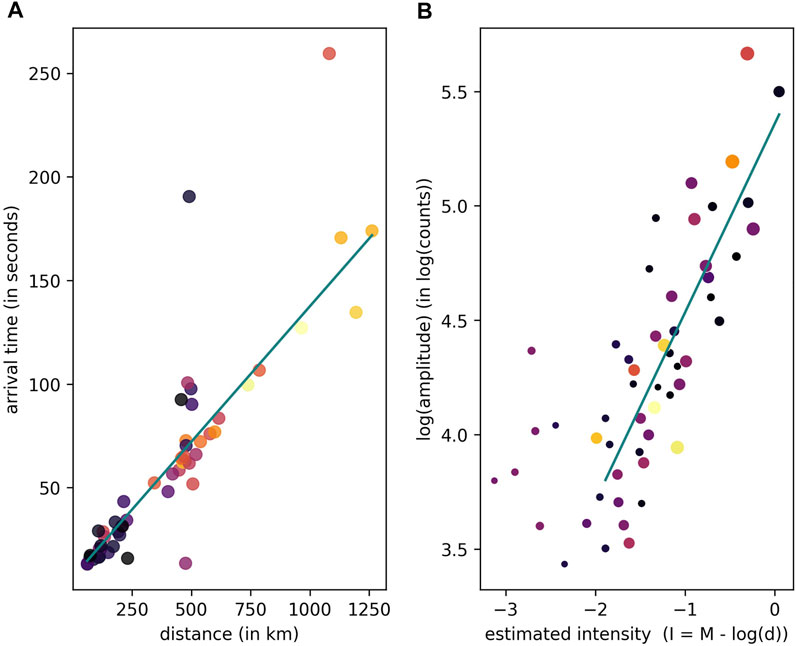
FIGURE 7. Arrival time and amplitude estimate of tectonic earthquake signals recorded at Stromboli.
In addition, an intensity measure is defined, which is based on a method introduced by (Pasolini et al., 2008):
Here the natural logarithm is used. The correlation between the intensity and the actual amplitude (Figure 7B) is sufficient to roughly estimate if an earthquake will be visible at Stromboli or not. The relationship between the intensity I and the amplitude in counts a is:
With this information, the catalog consolidation algorithm can be used to compute the probability that an event is an earthquake. One difference to the previous application (the purpose of which was to identify local disturbances) is that the earthquake catalog (from INGV) is now the complementary catalog. Also, a different distance measure, that was found empirically, is used: this different measure is necessary because, firstly, the estimation of the arrival time is not very accurate and, secondly, because earthquakes usually have a duration of several minutes (compared to the average of 40 s for small LP events):
Note that, before using the INGV catalog, any earthquake closer to the crater area than 1 km is removed, as it is probably connected with the volcanic activity.
After this, the seismo-volcanic event catalog is complete and includes two probabilities (volcanic event-probability and earthquake probability) which provide more information about the source of the events. Please note that the resulting probabilities are not meant to exclude events completely. Instead, they should facilitate the later analysis, by providing additional information.
3 Performance Evaluation and Testing
To compare our catalog, we created a catalog of seismo-volcanic events by hand, containing over 4,500 events, selected from 7.5 days of randomly chosen data. For this purpose, we developed the EventPicker software, a sub package of AWESAM. It simplifies seismo-volcanic event selection down to a single click with the mouse.
To compute the accuracy, these two catalogs (AWESAM-catalog and hand-picked catalog) can be compared using a modification of the catalog consolidation algorithm. In the first step, the probabilities of all AWESAM events (in the time range of the hand-picked events), which now form the principal catalog, are calculated, using the hand-picked catalog as the complementary catalog. Next, by applying a catalog consolidation vice versa, using the hand-picked catalog as the principal and the AWESAM-catalog as the complementary catalog, we generated a measure of how many seismo-volcanic events in one catalog are contained in the other. In consequence, there are two accuracy measures, from which an overall accuracy can be derived:
• A1: Measures the fraction of seismo-volcanic events in the AWESAM-catalog that are also contained in the hand-picked catalog. This value is the average of the probabilities (computed with the catalog consolidation algorithm), while using AWESAM as the principal catalog and the hand-picked as the complementary catalog.
• A2: Measures the fraction of seismo-volcanic events in the hand-picked catalog that are also contained in the AWESAM-catalog. This value is the average of the probabilities (computed with the catalog consolidation algorithm), while using AWESAM as the complementary catalog and the hand-picked as the principal catalog.
• Overall accuracy:
Note that the specific values of the accuracies depend on the metric used in the catalog consolidation. Figure 8 illustrates the accuracy curves of the catalogs. These curves reveal the dependence between the accuracy and the amplitude of seismo-volcanic events relative to the noise level (signal-to-noise ratio–SNR). The higher the SNR, the higher the probability that events are detected. For example, events with an SNR larger than three are detected with an accuracy of 95%. Thereby A1 and A2 hold different information. The fact that A1 is for almost all signal-to-noise ratios smaller than A2 shows that the hand-picked catalog contains some events that do not appear in the AWESAM catalog, but not the other way around (almost all events in the AWESAM catalog are also in the hand-picked catalog). However, Figure 8 also exhibits that this only happens for events, whose amplitudes are close to the noise level. The noise level is computed with the 95th percentile of the absolute seismic data.
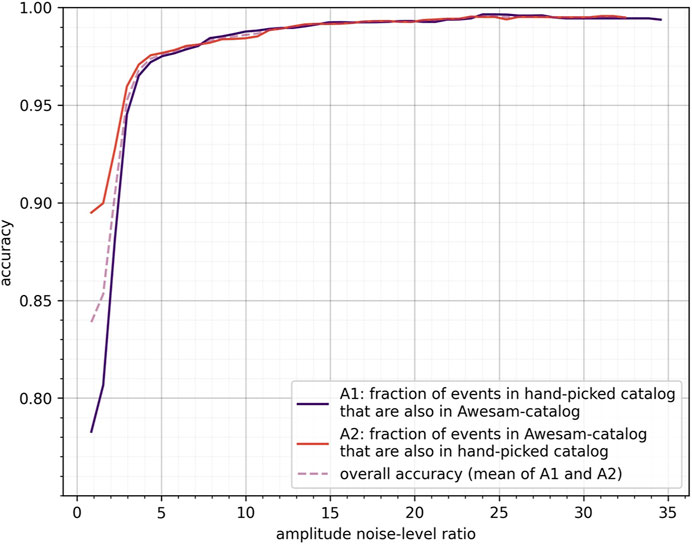
FIGURE 8. The accuracy curves show how the accuracy depends on the signal-to-noise ratio. The more prominent the peak over the noise level, the higher the probability that it is detected.
4 Discussion
Examples of detected seismo-volcanic events of all amplitudes are shown in Figure 9, to highlight that the algorithm works in these different cases. For instance, Figure 9A shows a seismo-volcanic event with an amplitude just above the noise level, and Figure 9D shows the paroxysm in June 2019. Also the data which are obtained from the adaptive MaxFilter are shown. It can be seen that the filter size for the different amplitude changes, so that large events are not detected multiple times.
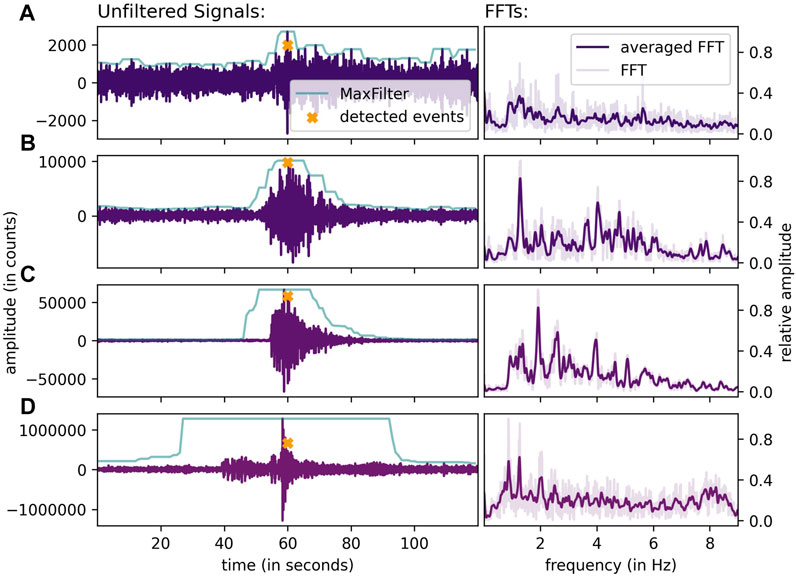
FIGURE 9. Examples of recorded events with different amplitudes and their spectra (FFTs). The green line corresponds to the adaptive MaxFilter data. The slight discrepancy between the amplitude of the signal and the detected event (marked by the orange cross) is due to filtering (discussed in section 2.2.2) (A) a minor event of small amplitude. (B) event with average amplitude. (C) an event of amplitude 60.000; on average, fewer than 5 events per month have a higher amplitude than this event. (D) paroxysm at 3 June 2019 (the duration of the paroxysm is longer, but the identified time-window includes the highest measured amplitude).
The catalog offers a wide range of possibilities for further analysis. For example, amplitude-frequency relations can be investigated and a detailed inter-event-time analysis could help understand possible regularities in occurrences of seismo-volcanic events. For instance, a clustering of major explosions and paroxysms was observed by Bevilacqua et al. (Bevilacqua et al., 2020). Additionally, natural time analysis introduced by Varotsos et al. (Varotsos et al., 2011; Sarlis et al., 2018) is also a promising approach to investigate the volcanic activity. Additionally, it can serve as an indicator for changes in the volcanic activity.
Particularly, the catalog is useful for any analysis that relies on the data of seismo-volcanic events over long periods of time i.e. years and decades. In earlier investigations, for example by Nishimura et al. (Nishimura et al., 2016), the amplitude-frequency relationship was derived based on data for 2 months only.
As a first example for the application of the information provided by the catalog, the temporal evolution of the amplitude-frequency relationship for the years 2019–2020 is shown in Figure 10. In these 2 years, 3 major explosions and two paroxysms (3. July and 28. August 2019) occured. The two paroxysms produced an eruption column of about 6 km height and ejected material to distances multiple kilometers from the vents (Andronico et al., 2021; Bevilacqua et al., 2020). Our algorithm detected all of these major events correctly.
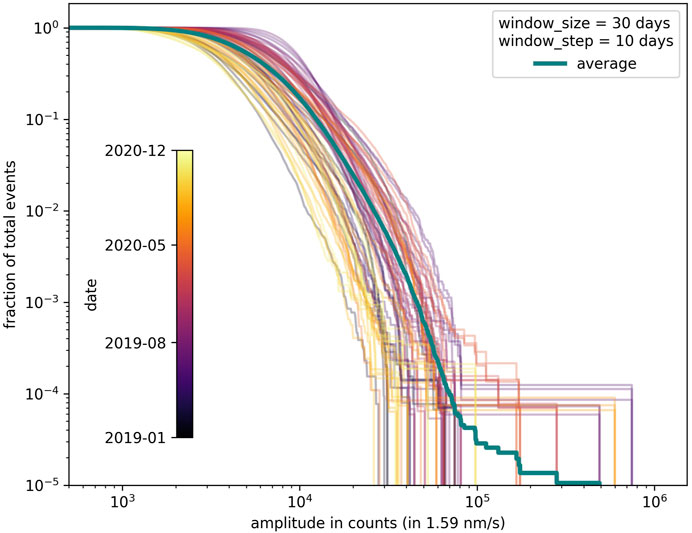
FIGURE 10. The amplitude-frequency relation and its temporal development over a period of 2 years (2019–2020) at Stromboli. The catalog contains more than 290.000 seismo-volcanic events for this time period. The window size used to compute the individual curves is 30 days; a window step size of 10 days was used.
In contrast to results reported earlier (Nishimura et al., 2016), the curve based on all seismo-volcanic events (labeled “average”) is characterized by a significant change in slope for events with amplitudes below and above 50.000 counts. This might reflect the fact that large events have a different source process than smaller events, as it has been suggested previously (see e.g., Métrich et al., 2021). Mild explosions have been located down to 1 km below sea level, while the origin of paroxysms is much deeper (up to 7–15 km below sea level). However, the change in slope is only supported by only ∼10 events. To draw further conclusions, the catalog needs to be extended further to cover more years and thus events. The detailed analyses of the catalog and these observations will be presented in a forthcoming paper.
5 Conclusion
We introduced a time-efficient and automated algorithm for the detection of seismo-volcanic events. Its strength is the ability to identify very small events as well as major explosions and paroxysms. In particular, AWESAM combines the detection, the validation of events with another station and the classification of earthquakes in a single, easy-to-use package. This package was applied to the publicly-available seismic data recorded at Stromboli. To improve the seismo-volcanic event catalog we developed a consolidation algorithm that removes local disturbances and tectonic earthquakes by including data from a second station and by using information derived from the official earthquake catalog of INGV. This module can further be adapted to generate catalogs for other volcanoes with frequent activity, such as Strombolian volcanoes but is also applicable to less active volcanoes. Furthermore, the proposed approach can be implemented to identify earthquakes signals from the recorded seismic waveforms as well. Another strength is that it does not require an extensive seismic network, so it is adaptable to a range of different volcanoes. Our approach requires at least two seismic stations, a catalog of tectonic earthquakes and some reconfiguration of the hyperparameters used. However, even if only one station is in operation or no earthquake catalog is available, the algorithm can still produce a useful catalog of seismo-volcanic events available for further analyses, for example by using methods of supervised machine learning.
Data Availability Statement
Publicly available datasets were analyzed in this study. This data can be found here: http://terremoti.ingv.it/en/instruments/network/IV.
Author Contributions
DF, GR, HS, and NS contributed to conception and design of the study. DF prepared the database and prepared the python module with the help of WL and JF. WL, MC, JK performed the manual picking of Volcanic events. DF wrote the first draft of the manuscript. GR and NS wrote sections of the manuscript. All authors contributed to manuscript revision, read, and approved the submitted version.
Funding
This research is supported by the “KI-Nachwuchswissenschaftlerinnen” - grant SAI 01IS20059 by the Bundesministerium für Bildung und Forschung - BMBF. Calculations were performed at the Frankfurt Institute for Advanced Studies’ new GPU cluster, funded by BMBF for the project Seismologie und Artifizielle Intelligenz (SAI).
Conflict of Interest
HS is employed by GSI Helmholtzzentrum für Schwerionenforschung GmbH, Darmstadt, Germany.
The remaining authors declare that the research was conducted in the absence of any commercial or financial relationships that could be construed as a potential conflict of interest.
Publisher’s Note
All claims expressed in this article are solely those of the authors and do not necessarily represent those of their affiliated organizations, or those of the publisher, the editors and the reviewers. Any product that may be evaluated in this article, or claim that may be made by its manufacturer, is not guaranteed or endorsed by the publisher.
Acknowledgments
We would like to thank Karoly Nemeth and Eugenio Privitera for their constructive and insightful comments which helped us improve the manuscript.
References
Allen, R. V. (1978). Automatic Earthquake Recognition and Timing from Single Traces. Bull. Seismological Soc. America 68, 1521–1532. doi:10.1785/BSSA0680051521
Andronico, D., Del Bello, E., D’Oriano, C., Landi, P., Pardini, F., Scarlato, P., et al. (2021). Uncovering the Eruptive Patterns of the 2019 Double Paroxysm Eruption Crisis of Stromboli Volcano. Nat. Commun. 12, 1–14. doi:10.1038/s41467-021-24420-1
Ardhuin, F., Stutzmann, E., Schimmel, M., and Mangeney, A. (2011). Ocean Wave Sources of Seismic Noise. J. Geophys. Res. 116. doi:10.1029/2011JC006952
Auger, E., D'Auria, L., Martini, M., Chouet, B., and Dawson, P. (2006). Real-time Monitoring and Massive Inversion of Source Parameters of Very Long Period Seismic Signals: An Application to Stromboli Volcano, italy. Geophys. Res. Lett. 33. doi:10.1029/2005GL024703
Benitez, C., Lesage, P., Cortés, G., Segura, J., Ibáñez, J., and Torre, A. (2009). “Automatic Recognition of Volcanic-Seismic Events Based on Continuous Hidden Markov Models,” in The VOLUME project. VOLcanoes: Understanding subsurface mass movement.EU PF6 (No. 018471). Editors C. J. Bean, A. K. Braiden, I. Lokmer, F. Martini, and G. S. O’Brien. (Dublin: VOLUME Project Consortium), 130–139.
Bevilacqua, A., Bertagnini, A., Pompilio, M., Landi, P., Carlo, P. D., Di Roberto, A., et al. (2020). Major Explosions and Paroxysms at Stromboli (italy): a New Historical Catalog and Temporal Models of Occurrence with Uncertainty Quantification. Sci. Rep. 10, 1–18. doi:10.1038/s41598-020-74301-8
Beyreuther, M., Barsch, R., Krischer, L., Megies, T., Behr, Y., and Wassermann, J. (2010). ObsPy: A Python Toolbox for Seismology. Seismological Res. Lett. 81, 530–533. doi:10.1785/gssrl.81.3.530
Bormann, P. (2015). “Seismic Noise,” in Encyclopedia of Earthquake Engineering. (Berlin, Germany: Springer), 2932–2957. doi:10.1007/978-3-642-35344-4_289
Clarke, J., Adam, L., and van Wijk, K. (2021). Lp or Vt Signals? How Intrinsic Attenuation Influences Volcano Seismic Signatures Constrained by Whakaari Volcano Parameters. J. Volcanology Geothermal Res. 418, 107337. doi:10.1016/j.jvolgeores.2021.107337
Cortés, G., Carniel, R., Lesage, P., Mendoza, M. Á., and Della Lucia, I. (2021). Practical Volcano-independent Recognition of Seismic Events: Vulcan.Ears Project. Front. Earth Sci. 8. doi:10.3389/feart.2020.616676
Giudicepietro, F., López, C., Macedonio, G., Alparone, S., Bianco, F., Calvari, S., et al. (2020). Geophysical Precursors of the July-August 2019 Paroxysmal Eruptive Phase and Their Implications for Stromboli Volcano (italy) Monitoring. Sci. Rep. 10. doi:10.1038/s41598-020-67220-1
INGV Data Centre (2006). INGV Seismological Data Centre, Rete Sismica Nazionale (RSN). Italy: Istituto Nazionale di Geofisica e Vulcanologia (INGV). doi:10.13127/SD/X0FXNH7QFY
[Dataset] IST3 (2012). Istituto Nazionale di Geofisica e Vulcanologia - Seismic Station IST3. Available at: http://cnt.rm.ingv.it/en/instruments/station/IST3 (accessed February Monday 7th, 2022).
[Dataset] ISTR (2011). Istituto Nazionale di Geofisica e Vulcanologia - Seismic Station ISTR. Available at: http://cnt.rm.ingv.it/en/instruments/station/ISTR (accessed February Monday 7th, 2022).
Langer, H., and Falsaperla, S. (1996). Long-term Observation of Volcanic Tremor on Stromboli Volcano (italy): A Synopsis. Pageoph 147, 57–82. doi:10.1007/BF00876436
Legrand, D., and Perton, M. (2022). What Are Vlp Signals at Stromboli Volcano? J. Volcanology Geothermal Res. 421, 107438. doi:10.1016/j.jvolgeores.2021.107438
Masotti, M., Falsaperla, S., Langer, H., Spampinato, S., and Campanini, R. (2006). Application of Support Vector Machine to the Classification of Volcanic Tremor at etna, italy. Geophys. Res. Lett. 33. doi:10.1029/2006GL027441
Métrich, N., Bertagnini, A., and Pistolesi, M. (2021). Paroxysms at Stromboli Volcano (italy): Source, Genesis and Dynamics. Front. Earth Sci. 9. doi:10.3389/feart.2021.593339
Mousavi, S. M., and Langston, C. A. (2016). Adaptive Noise Estimation and Suppression for Improving Microseismic Event Detection. J. Appl. Geophys. 132, 116–124. doi:10.1016/j.jappgeo.2016.06.008
Nabyl, A., Dorel, J., and Lardy, M. (1997). A Comparative Study of Low‐frequency Seismic Signals Recorded at Stromboli Volcano, Italy, and at Yasur Volcano, Vanuatu. New Zealand J. Geology. Geophys. 40, 549–558. doi:10.1080/00288306.1997.9514783
Nishimura, T., Iguchi, M., Hendrasto, M., Aoyama, H., Yamada, T., Ripepe, M., et al. (2016). Magnitude-frequency Distribution of Volcanic Explosion Earthquakes. Earth Planet. Sp 68, 1–12. doi:10.1186/s40623-016-0505-2
[Dataset] OpenStreetMap (2017). Planet dump retrieved from https://planet.osm.orghttps://www.openstreetmap.org.
Pasolini, C., Albarello, D., Gasperini, P., D'Amico, V., and Lolli, B. (2008). The Attenuation of Seismic Intensity in italy, Part Ii: Modeling and Validation. Bull. Seismological Soc. America 98, 692–708. doi:10.1785/0120070021
Ripepe, M., Delle Donne, D., Legrand, D., Valade, S., and Lacanna, G. (2021). Magma Pressure Discharge Induces Very Long Period Seismicity. Sci. Rep. 11, 20065. doi:10.1038/s41598-021-99513-4
Sarlis, N. V., Skordas, E. S., and Varotsos, P. A. (2018). Natural Time Analysis of Seismic Time Series. Complexity Seismic Time Ser. 199, 235. doi:10.1016/B978-0-12-813138-1.00007-9
Varotsos, P., Sarlis, N. V., Skordas, E. S., Uyeda, S., and Kamogawa, M. (2011). Natural Time Analysis of Critical Phenomena. Proc. Natl. Acad. Sci. 108, 11361–11364. doi:10.1073/pnas.1108138108
Virtanen, P., Gommers, R., Oliphant, T. E., Haberland, M., Reddy, T., Cournapeau, D., et al. (2020). SciPy 1.0: Fundamental Algorithms for Scientific Computing in Python. Nat. Methods 17, 261–272. doi:10.1038/s41592-019-0686-2
Wassermann, J. (2012). “Volcano Seismology,” in New Manual of Seismological Observatory Practice, 1–77. doi:10.2312/GFZ.NMSOP-2_ch13
Weiqiang, Z., Mousavi, S., and Beroza, G. (2019). Seismic Signal Denoising and Decomposition Using Deep Neural Networks. IEEE Transactions on Geoscience and Remote Sensing. doi:10.1109/TGRS.2019.2926772
Zhang, R.-q., Song, P., Liu, B.-h., Zhang, X.-b., Tan, J., Zou, Z.-h., et al. (2020). Low-frequency Swell Noise Suppression Based on U-Net. Appl. Geophys. 17, 419–431. doi:10.1007/s11770-020-0825-7
Keywords: volcanic event, Strombolian activity, adaptive MaxFilter, python, AWESAM
Citation: Fenner D, Rümpker G, Li W, Chakraborty M, Faber J, Köhler J, Stöcker H and Srivastava N (2022) Automated Seismo-Volcanic Event Detection Applied to Stromboli (Italy). Front. Earth Sci. 10:809037. doi: 10.3389/feart.2022.809037
Received: 04 November 2021; Accepted: 08 February 2022;
Published: 16 March 2022.
Edited by:
Marco Neri, Section of Catania, ItalyReviewed by:
Eugenio Privitera, Section of Catania, ItalyKaroly Nemeth, Massey University, New Zealand
Copyright © 2022 Fenner, Rümpker, Li, Chakraborty, Faber, Köhler, Stöcker and Srivastava. This is an open-access article distributed under the terms of the Creative Commons Attribution License (CC BY). The use, distribution or reproduction in other forums is permitted, provided the original author(s) and the copyright owner(s) are credited and that the original publication in this journal is cited, in accordance with accepted academic practice. No use, distribution or reproduction is permitted which does not comply with these terms.
*Correspondence: Nishtha Srivastava, c3JpdmFzdGF2YUBmaWFzLnVuaS1mcmFua2Z1cnQuZGU=