 Morelia Urlaub1*
 Jacob Geersen2
 Florian Petersen2,3
 Felix Gross2,3
 Alessandro Bonforte4
 Sebastian Krastel2Heidrun Kopp1,2
- 1GEOMAR Helmholtz Centre for Ocean Research Kiel, Kiel, Germany
- 2Institute of Geosciences, Christian-Albrechts-Universität zu Kiel, Kiel, Germany
- 3Center for Ocean and Society, Christian-Albrechts-Universität zu Kiel, Kiel, Germany
- 4Istituto Nazionale di Geofisica e Vulcanologia, Section of Catania—Osservatorio Etneo, Catania, Italy
Coastal and ocean island volcanoes are renowned for having unstable flanks. This can lead to flank deformation on a variety of temporal and spatial scales ranging from slow creep to catastrophic sector collapse. A large section of these unstable flanks is often below sea level, where information on the volcano-tectonic structure and ground deformation is limited. Consequently, kinematic models that attempt to explain measured ground deformation onshore associated with flank instability are poorly constrained in the offshore area. Here, we attempt to determine the locations and the morpho-tectonic structures of the boundaries of the submerged unstable southeastern flank of Mount Etna (Italy). The integration of new marine data (bathymetry, microbathymetry, offshore seismicity, reflection seismic lines) and published marine data (bathymetry, seafloor geodesy, reflection seismic lines) allows identifying the lineament north of Catania Canyon as the southern lateral boundary with a high level of confidence. The northern and the distal (seaward) boundaries are less clear because no microbathymetric or seafloor geodetic data are available. Hypotheses for their locations are presented. Geophysical imaging suggests that the offshore Timpe Fault System is a shallow second-order structure that likely results from extensional deformation within the moving flank. Evidence for active uplift and compression upslope of the amphitheater-shaped depression from seismic data along with subsidence of the onshore Giarre Wedge block observed in ground deformation data leads us to propose that this block is a rotational slump, which moves on top of the large-scale instability. The new shoreline-crossing structural assessment may now inform and improve kinematic models.
1 Introduction
Most volcanoes form in tectonically active areas on top of deformed continental or oceanic basement. The generally complex structural and morphologic nature of the underlying basement influences the stress regime and thus their seismic and volcanic activity (Cayol et al., 2000; Dieterich et al., 2000). The growth of a volcano over long (geologic) times in turn, alters the regional geologic and tectonic framework which may lead to the generation and reactivation of new or existing fault zones (Walter and Schmincke, 2002). Some of these faults are limited to shallow depth within the volcanic edifice, or at the contact between the edifice and the underlying basement, while others extend to larger depth. The latter faults may provide links between the volcano-tectonic motion and the regional tectonic setting (Bonaccorso et al., 2013). The complex intertwined relation between local and regional volcanic and tectonic processes can induce instability in the volcanic edifice (Chiocci et al., 2011), raising the potential for hazardous events triggered by flank collapses and their related aseismic (creep) and seismic (earthquake) motion, in addition to those hazards associated with volcanic activity.
Flank instability appears to be even more frequent on coastal and ocean island volcanoes than on fully subaerial ones (Alparone et al., 2013; Poland et al., 2017). This is likely due to the lithological (weak marine sediments) and morphological (seawards inclined) nature of the sedimentary basement that underlies the volcanic edifice and that favours the sliding of the edifice under its own weight. Gravitational flank sliding thus adds to the tectonic setting and to the magma dynamics beneath and inside the volcano (Alparone et al., 2011; Bonforte et al., 2013a; Poland et al., 2017). Yet, the presence of the sea dramatically increases the hazard related to flank instability. Slope failures and partial collapses of coastal and ocean island volcanoes can cause damaging tsunamis as the world recently witnessed when the volcano Anak Krakatau in the Sunda Strait (Indonesia) collapsed catastrophically on 22 December 2018. The resulting landslide caused a tsunami resulting in more than 400 fatalities (Walter et al., 2019). Also, huge intraplate volcanoes, such as Fogo, the Canary Islands, and Hawaii have collapsed in the geological history and pose an ocean-wide hazard (Paris, 2015; Ramalho et al., 2015).
Knowledge of the relationship between volcanic activity and tectonic deformation may put us in a position to recognise potential precursory signals of impending collapses. Kinematic models that seek to explain these relationships require certain boundary conditions, with the geometry of the faults that define the downward movement of an unstable flank, and that accommodate gravitational movement, being a main factor (Solaro et al., 2010; Bonforte et al., 2011; Azzaro et al., 2013). For the onshore part of the volcano edifice, this geometry is often well known from geological, seismic, and geodetic data. In those areas of the volcano edifice covered by water, the geometry of faults and their transient activity is generally poorly constrained. Yet, ocean island volcanoes grow from the bottom of the deep sea and often only a small fraction of the edifice is exposed. In the case of Kilauea (Hawaii), 85% of the volcano is under water. Also, for Mount Etna, which is growing at the edge of continental crust (Figure 1), a volumetrically large part of the mobile sector is submerged (Chiocci et al., 2011; Gross et al., 2016). This fact explains that kinematic models of flank deformation often predict the largest deformation to occur in the offshore sectors. For example, the area of maximum co-seismic slip related to the recent moment magnitude (Mw) 6.9 earthquakes at Kilauea in May 2018 was modeled at ∼10 km off the coast (Liu et al., 2018). At Mount Etna, kinematic models of slow slip events (Mattia et al., 2015; Palano, 2016; Bruno et al., 2017) also predict maximum slip seawards of the coast, although the ground deformation pattern is different during periods of strong magmatic inflation (Acocella et al., 2003; Neri et al., 2004; Solaro et al., 2010). It is obvious that the submerged flanks of coastal and ocean island volcanoes play important roles in accommodating volcano-tectonic deformation and gravitational flank movement. Yet, these offshore flanks usually represent the least explored and understood parts of a volcano.
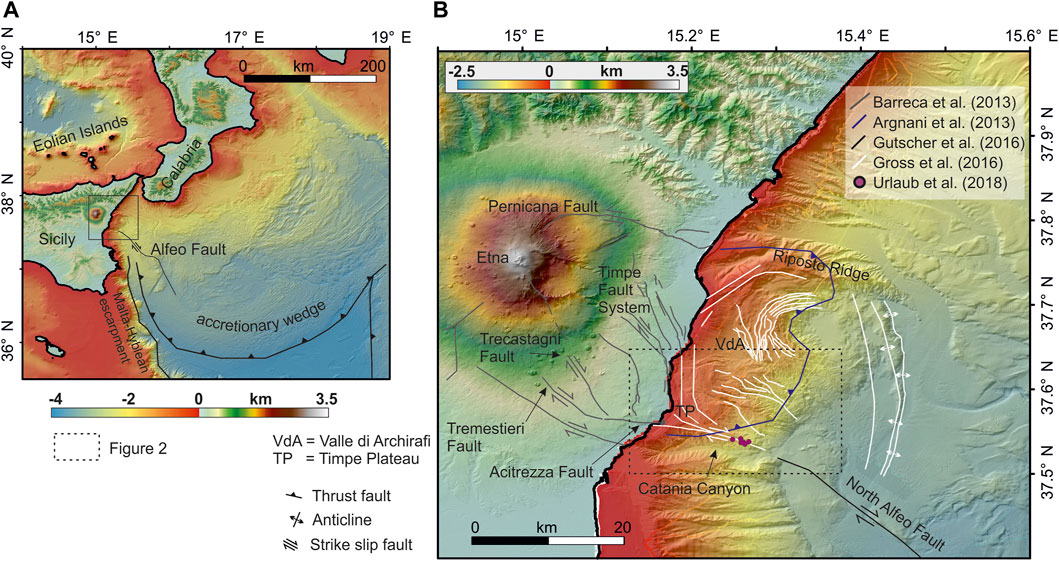
FIGURE 1. Overview of the study area in South Italy. (A) Shaded relief map of the Western Ionian Sea with the Calabrian Arc subduction zone. Bathymetry is that of Gutscher et al. (2017). (B) Shaded relief map of the Mount Etna region. Onshore digital elevation data from the Shuttle Radar Topography Mission. Bathymetry from Chiocci et al. (2011). Main structures that are kinematically linked to flank instability are indicated following the respective publications. The grey dashed rectangle shows the focus area of newly acquired bathymetric and microbathymetric data.
To understand flank collapse hazard at volcanoes whose edifices are, to a large extent, covered by water, the offshore geometry and kinematics of the unstable sector needs to be rigorously understood. This knowledge can then lend constraints to kinematic models that seek to explain observed ground deformation but lack information on the offshore extent, architecture, and geometry of the moving flank. Worldwide, there are only few volcanoes for which the offshore volcano-tectonic structure, deformation, and dynamics are well studied. Kilauea is one example, where this knowledge is available and, indeed, revealed crucial to the understanding of the volcano’s overall stability. With seismic, bathymetric, and seafloor geodetic data it was possible to identify a mobile, shallow slump (Hilina Slump) that is riding atop Kilauea’s seawards sliding south flank (Morgan et al., 2003; Phillips et al., 2008). Only with this information, it was possible to confirm the origin and underlying processes of the onshore extensional headwall domain (Hilina Fault System).
Here, we focus on the submerged boundaries of the unstable sector of Mount Etna. We present new bathymetric and microbathymetric maps from the continental bulge and the transition to the Ionian basin, as well as new offshore seismicity data from an Ocean Bottom Seismometer network installed from April 2016 to February 2017, and as yet unpublished seismic reflection lines. These new data, in combination with marine geological, geodetic, and geophysical data published in recent years allow us to determine the location of the southern boundary, as well as to discuss the yet widely unexplored northern and seaward boundaries of the unstable flank. We further identify the main uncertainties and key questions that remain unanswered concerning the geometry of Mount Etna’s unstable sector, and propose pathways to overcome these.
2 Mount Etna: Regional Tectonic Setting and Flank Instability
Mount Etna is a basaltic stratovolcano on the East coast of Sicily, Italy (Figure 1). The volcano is located at the edge of the subducting Ionian slab of the Calabrian subduction zone (Gvirtzmann and Nur, 1999a). The crustal deformation rates related to plate convergence in eastern Sicily vary around 3–6 mm/yr (Ventura et al., 2014). A key tectonic element in the larger region is the Subduction Tear Edge Propagator (STEP) fault, which is hypothesised to continue underneath Mount Etna. Possible candidates for the shallow expression of this STEP fault are the Malta Escarpment (Neri et al., 2018, and references therein) or the Alfeo fault system in the Ionian Sea (Figure 1A). The Malta Escarpment is a prominent morphological feature offshore eastern Sicily that separates the continental hyblean crust from the oceanic crust of the Ionian Basin (Lanzafame et al., 1996; Neri et al., 2018, and references therein). The Alfeo fault system consists of the normal South Alfeo fault off Southern Sicily and the right-lateral North Alfeo fault off Central and Northern Sicily (Gutscher et al., 2016). It has been suggested that the North Alfeo fault continues underneath Mount Etna (Barreca et al., 2013; Gutscher et al., 2016).
Mount Etna has a prominent morphology resulting from a rapid and complex growth of the volcanic edifice. The summit is 3,350 m above sea level. The volcanic pile is about 2 km thick (Branca and Ferrara, 2013) and grows on the continental margin that dips seawards. The volcano’s eastern flank reaches well into the Ionian Sea to ∼1,500 m below sea level (Figure 1B). The sedimentary basement underneath Mount Etna consists of early Quaternary clays bounded to the north and to the west by flysch units of the Apennine–Maghrebian Chain (Branca et al., 2011). The basement gently dips in SE direction thereby promoting lateral spreading and flank instability of Mount Etna’s southeastern sector (Branca and Ferrara, 2013). The deformation of the eastern flank is quite different and often independent of that affecting the northern and western parts of the volcano, showing a different stress state, acting at least on the volcanic pile and the uppermost part of the sedimentary basement, as revealed by geodetic and seismic data (Alparone et al., 2011). Onshore geodetic measurements document large-scale continuous seaward motion of the SE flank at an average rate of 3–5 cm per year since the early 1980s (Patanè et al., 2003; Bonforte and Puglisi, 2006; Solaro et al., 2010). Seawards slip occurs as continuous motion spiked by episodic acceleration that often links to rift zone activity and dike intrusions (Bonforte et al., 2013b; Palano, 2016; Bruno et al., 2017). During rest phases, when the edifice is not affected by magmatic inflation that mainly deforms the central part of the volcano, displacement rates on the southeastern slope generally increase towards the coast and into the Ionian Sea (Bonforte and Puglisi, 2006; De Guidi et al., 2018; Urlaub et al., 2018). Even during deflation phases, characterized by centripetal deformation, the southeasternmost part of the volcano moves eastward (Bonforte et al., 2008). This pattern suggests that the present deformation is driven by gravitational instability, being further promoted by magma dynamics.
The morphologically prominent and seismically active Timpe Fault System, with its NNW-SSE orientation, crosses the eastern slope of Mount Etna for a length of about 30 km (Figure 1B). The individual segments of the Timpe Fault System show oblique normal and dextral motion, thus accommodating WNW-ESE oriented extension mostly through shallow (<5 km in depth) earthquakes of moderate magnitudes (Mw < 5) (Alparone et al., 2015). There are contrasting views regarding the origin of the Timpe Fault System. This fault system has been considered one of the northernmost segments of the NNW-SSE oriented Malta Escarpment. Barreca et al. (2018) suggest connection of the Timpe Fault System to the offshore North Alfeo fault. These hypotheses contrast the observation that the hanging wall and the footwall of the Timpe fault system move along with the SE flank, suggesting that the Timpe System is dragged seawards with the mobile flank and then should be confined above the detachment surface of the unstable flank and thus a shallow, second order system (Bonforte and Puglisi, 2006).
2.1 Onshore Boundaries and Volcano-Tectonic Structures
On land, the outline of the unstable flank is well determined by geodetic, geophysical, and geological methods. Along the northern boundary of the unstable flank, deformation focuses along the transtensive left-lateral Pernicana fault system with average slip rates of 2–3 cm/yr (Neri et al., 2004; Bonforte et al., 2007; Azzaro et al., 2013). The Pernicana fault extends from the NE Rift downslope to the coast (Figure 1B). While the western sections of the fault system are seismically very active, its eastern part is almost completely devoid of shallow seismicity (Groppelli and Tibaldi, 1999; Alparone et al., 2013, 2015). The sharp morphologic expression of the Pernicana fault vanishes close to the Ionian coast, where there is a culmination of the sedimentary basement (Bonforte et al., 2007). Here, deformation related to instability of Mount Etna’s eastern flank is diffuse and solely expressed as creep along multiple en échelon left-lateral faults (Azzaro et al., 2013).
Extending from the South Rift, the Trecastagni-Tremestieri fault system represents the modern southern boundary of the unstable sector (Bonforte et al., 2013a). The NNW-SSE trending faults appear as pronounced morphological scarps. The faults accommodate normal and right-lateral movements through continuous creep with episodic accelerations accompanied with shallow seismicity (Acocella et al., 2003; Gambino et al., 2011; Bonforte et al., 2013b; De Novellis et al., 2019). Towards the coast, the faults join into one and the southern boundary continues to the coast along the NNW-SSE San Gregorio and then along the WNW-ESE Acitrezza fault systems (Bonforte et al., 2011). These are mostly hidden faults without morphological expressions at the surface affected by continuous creep.
2.2 Offshore Boundaries: A Review of Current Understanding and Uncertainties
The large-scale morphology of the continental margin offshore of Mount Etna is characterized by an east oriented convex bulge that hosts slope gradients of up to 25° (Figure 1B). The continental slope reaches down to ∼1800 m water depth about 20 km off the coast. A morphological step marked by a sudden decrease in slope angle represents the transition into the Ionian Sea basin. The central realm of the continental bulge is described by the Valle di Archirafi bounded by a structural high, both of which are affected by normal faulting (Gross et al., 2016). A prominent morphological feature offshore Mount Etna is the semi-circular amphitheatre enclosing a local depression. Chiocci et al. (2011) propose that the amphitheater is the result of a large submarine landslide.
The Acitrezza fault marking the southern boundary of the onshore unstable sector in the coastal area continues across the shoreline as a WNW-ESE trending morphological feature at the seafloor (Chiocci et al., 2011; Gross et al., 2016). At about 400 m water depth the offshore continuation of the Acitrezza fault appears to merge with a series of NNW-SSE trending escarpments at the seafloor that bend into the WNW-ESE orientation. It has been suggested that the NNW-SSE trending seafloor escarpments represent the surface expression of the southwards prolongation of the Timpe Fault System (Barreca et al., 2018). Further seawards of where the seafloor escarpments merge into a single fault system, a 30 km long WNW-ESE topographic high on the northern limb of Catania Canyon termed lineament (Chiocci et al., 2011) is visible (Figure 1B). Seafloor geodetic measurements conducted between 2016–2017 confirm the lineament as an active right-lateral fault that had experienced at least 4 cm of slip released during a recent slow slip event (Urlaub et al., 2018). The fault slip rate measured in this single location matches the cumulative slip of the linked onshore faults related to flank instability. Hence, the lineament likely represents a section of the southern offshore boundary of the mobile sector (Gross et al., 2016; Urlaub et al., 2018). Some authors hypothesise that this fault at the northern limb of Catania Canyon is the shallow branch of the North Alfeo fault, which would argue for a crustal origin (Gutscher et al., 2017; Barreca et al., 2018). From seismic data there is, however, no indication that the lineament connects to crustal faults, which would suggest that this lateral boundary of the moving flank is not genetically linked to crustal tectonics (Argnani and Bonazzi, 2005; Argnani et al., 2013).
In the north, the transition of the Pernicana fault into the offshore is less obvious. Isolated small NNE–SSW trending seafloor scarps in the shallow offshore realm indicate active deformation (Argnani et al., 2013). Further downslope, the NW-SE trending Riposto Ridge, probably a remnant of Apennine–Maghrebian Chain units, forms a morphological boundary (Chiocci et al., 2011; Gross et al., 2016). There is no evidence for extensive and localized active faulting in the shallow subsurface in seismic data (Argnani et al., 2013; Gross et al., 2016). This stands in contrast to many kinematic models based on onshore ground deformation data that predict largest flank slip within the northern submerged sector of the flank (e.g., Palano, 2016; Bruno et al., 2017; Mattia et al., 2015).
Different hypotheses compete with respect to the location of the distal (seaward) boundary of the unstable volcano pile, mainly based on seismic data of different resolution. Argnani et al. (2013) suggest the offshore bulge is bounded by a thrust fault encircling the offshore bulge (Figure 1B), which is related to the intrusion of the magmatic body. Gross et al. (2016) described two anticlines several kilometres seawards of the thrust fault interpreted by Argnani et al. (2013) in seismic reflection data (Figure 1B). The authors suggest that compression caused by downwards flank movement forms the anticlines, which thus mark the seaward foot of the volcanic sector.
3 Summary of Data Sets and Observations
In the following, we analyse new bathymetric and microbathymetric maps from the southern part of the offshore flank, unpublished reflection seismic lines as well as 1 year of offshore seismicity recorded by an Ocean Bottom Seismometer network. Previously published marine data complement the new data. We summarise the key implications from each dataset with respect to Etna’s flank dynamics and in the context of existing literature.
3.1 Ship-Based Bathymetry
A Multibeam Echo Sounder (MBES) sends acoustic signals in form of a fan, which are reflected/scattered at the seafloor. In addition to the traveltime, which is transferred into water depth, the system also records the strength of the reflected/scattered signal (backscatter). Through emitting a swath of several hundreds of beams at each side, MBES attached to the hull of a ship covers a strip of the seafloor up to six times the water depth wide. The vertical and lateral resolution is primarily dependent on the water depth. The new MBES data off Etna, which were collected in 2020 have a vertical resolution of <10 m and the grid spacing of the bathymetric maps is ≤30 m (Figure 2). It includes data from 2020 RV SONNE cruise SO277 (Berndt et al., 2021) and 2020 RV ALKOR cruise AL532 (Urlaub et al., 2020). During SO277, MBES data were acquired with hull-mounted Kongsberg EM122 and EM710 systems. For these data sets, we also show the backscatter intensities (Figure 3C). During AL532, bathymetric data were collected in shallow water (<600 m) with an ELAC Seabeam 1050 MBES system installed in the vessel’s moonpool. Derivatives of the bathymetry, such as slope gradient (Figure 3A) and aspect (Figure 3B) help to interpret seafloor morphologies (Figure 3D). The new hydroacoustic data are here combined with published data from Chiocci et al. (2011), Gross et al. (2016), and Gutscher et al. (2017) (Figure 3).
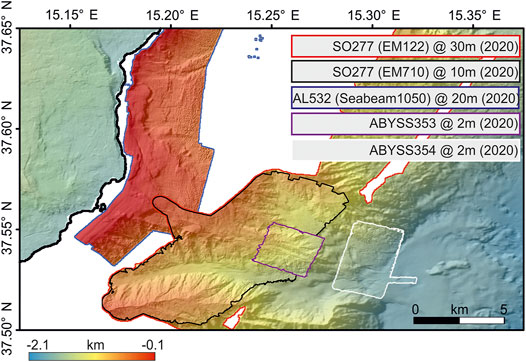
FIGURE 2. Newly acquired bathymetric data sets presented in this study for the first time. The location is shown in Figure 1B.
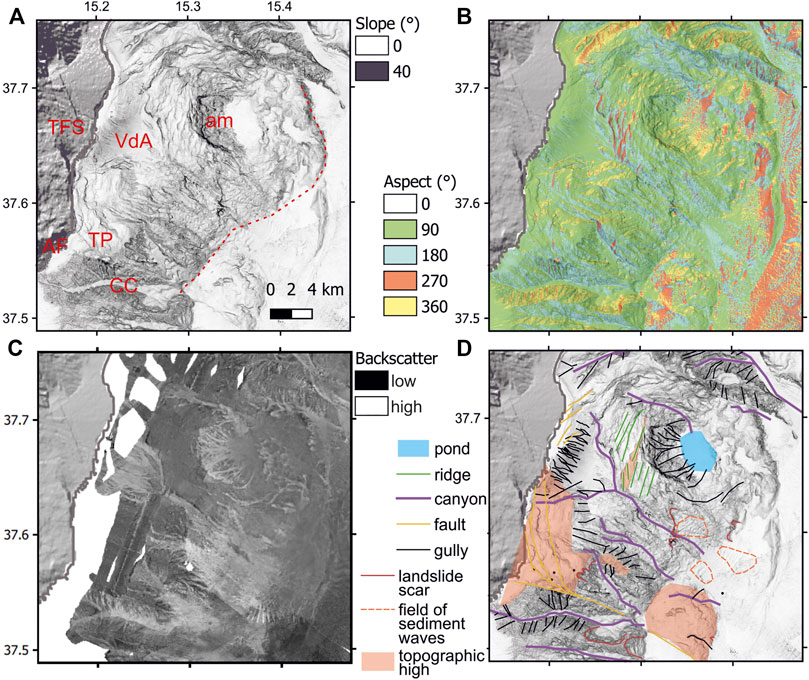
FIGURE 3. Products and derivatives of the new integrated bathymetric data: (A) slope gradient, (B) aspect, (C) backscatter, (D) morphological interpretation. CC, Catania Canyon, TFS, Timpe Fault System, VdA, Valle di Archirafi, TP, Timpe Plateau, AF, Acitrezza fault, am, amphitheatre. The dashed red line marks the seawards edge of the continental bulge, i.e. the transition from the continental slope to the Ionian Basin.
The combined bathymetric data reveal a suite of seabed morphologies, sedimentary structures and bedforms predominantly related to gravitational sediment transport. We identify canyons, gullies, landslide scars, sediment ponds, and sediment waves (Figure 3). Catania Canyon in the south of the study area is just one of several larger canyons, not all of which directly relate to onshore rivers. The major canyon systems dip straight into the Ionian Basin without forming significant meanders. Landslide scars occur along steep canyon walls (e.g., at the south limb of Catania Canyon) and at the foot of the continental bulge. Numerous smaller scars, partly at the limit of the resolution of the data, cluster in areas of low backscatter (Figure 3C) indicating the presence of softer sediments. There are two fields of sediment waves at the seawards edge of the continental bulge, and thus on nearly flat seafloor. A third area of sediment waves is observed upslope, in another area of low backscatter. Creep of shallow soft sediments is probably forming these waves (Pope et al., 2018).
From analyses of local relief, aspect, and location of gullies (Figure 3D), we identify several topographic highs. The Timpe Plateau, described previously by Gross et al. (2016) and Carlino et al. (2019), constitutes the south westernmost topographic high. It is cross-cut by several NW-SE trending escarpments, offsetting the seafloor downwards and in ENE direction in a stepwise fashion. East of the Timpe Plateau a smaller and isolated topographic high is visible surrounded by deeply-cutting gullies. These are signs of long-term erosion, suggesting the topographic feature to be rather old. Within the center of Valle di Archirafi a subtle topographic high dipping landwards deviates the canyon systems to its sides. To the northeast, an elongated topographic high marks the uppermost of a series of coast-parallel elongated features, which we term ridges. The aspect map (Figure 3B) depicts the two-sided ridge-shape structure as facing land- and seawards. In contrast to these topographic highs on the upper continental slope, another almost circular topographic high is visible at the foot of the continental bulge in the southeast of the study area. The structure also has a circular shape as highlighted in the aspect map (Figure 3B). While its eastern side inclines seawards, its western side inclines landwards. This may be indicative of active uplift in the centre of this structure.
The bathymetric data also show the surficial expression of several faults, which usually show up as linear trending escarpments at the seafloor. In the northern study area, several short seafloor offsets provide a stair step morphology dipping towards the SE (Figure 3A). As in the coastal area onshore, no prominent seafloor expression of a northern boundary fault is visible. In the south, the fault that constitutes the seaward extension of the onshore Acitrezza fault has a positive seafloor relief and extends in WNW-ESE direction (Figure 3A). North of it, the seafloor shows several parallel NNW-SSE trending escarpments that offset the seafloor downwards towards the ENE in a stepwise fashion. These escarpments continue across the shore and connect to the faults of the onshore Timpe Fault System (Figure 3A). Seawards, they appear to bend to an E-W direction before merging with the offshore Acitrezza fault coming from the West. The result of this merging is a prominent feature termed lineament and previously interpreted as the southern boundary of the unstable sector (Chiocci et al., 2011; Gross et al., 2016; Urlaub et al., 2018). The lineament at the northern wall of Catania Canyon continues in distal direction but vanishes at the toe of the continental bulge. About 1 km farther eastwards, the northernmost seafloor expression of the North Alfeo fault appears.
3.2 Microbathymetry
Resolution of shipborne bathymetric surveys is limited, especially in deep water, due to the strong attenuation of high-frequency sound waves and the lateral distance between neighbouring beams. Bathymetric grids in large water depths based on shipborne bathymetric surveys therefore usually have a lateral resolution in the range of several 10 s of meters. One option for increasing lateral resolution is to reduce the distance between the MBES and the seafloor. This approach allows to use higher frequencies while reducing the distance between neighbouring beams at the seafloor. Autonomous Underwater Vehicles (AUVs) are unmanned untethered vehicles that operate fully independent along a pre-programed track and that are capable of carrying multibeam echosounders. In January 2020, during expedition AL532 with RV ALKOR, the deep-water AUV ABYSS performed two dives carrying a Reson SeaBat T50 multibeam echosounder 80 m above the seafloor. The acquired data provide two new microbathymetric maps, each covering an area about 2.5 × 2.5 km of the seafloor with a grid spacing of 2 m (Figure 4). See Urlaub et al. (2020) for details on survey design and processing routines.
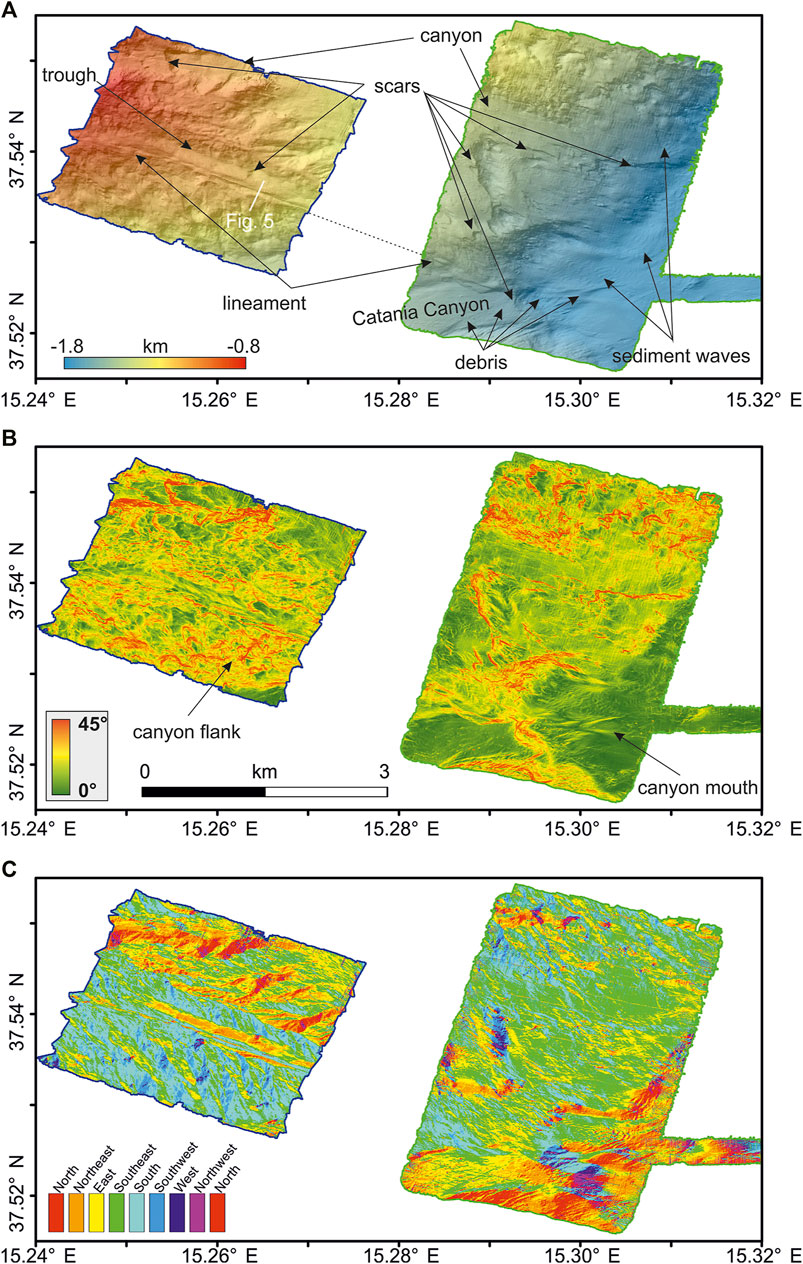
FIGURE 4. (A) Depth, (B) slope, and (C) aspect (downhill direction) maps of the multibeam bathymetry data collected with an AUV. See Figure 2 for location of the maps. Black line in a) marks the prominent surface expression of the offshore extent of the Acitrezza fault.
Both maps image the seafloor across the lineament, i.e. the offshore continuation of the Acitrezza fault. The more proximal located map covers the area of the seafloor geodetic experiment, which recorded right-lateral faulting during a slow slip event in May 2017 (Urlaub et al., 2018). The other map, further downslope, covers the toe of the continental bulge and its transition to the less steep Ionian Basin. Although only 3 km apart, the two maps show very different morphologic expressions of what, from the shipborne bathymetric data, is interpreted as a single fault.
The seafloor in the upslope site is steep and rugged. The area is inclined in ESE direction with average slope gradients between 10–20° following the large-scale configuration of the continental margin. This overall trend is superimposed by multiple linear W-E trending structures. Along the southern margin of the map, a steep (30–40°) southwards facing slope marks the northern flank of the Catania Canyon. Along the northern edge of the canyon, a larger scale topographic high subdivides into two WNW-ESE trending ridges separated by an approximately 100 m wide trough that is 20–60 m deep. The southern ridge morphology is peculiar striking, and presents an almost razor-sharp, about 10 m wide, structure that elevates about 5 m from the surrounding seafloor (Figure 4). We interpret this as the surface expression of the active strike-slip fault that ruptured during the May 2017 slow-slip event.
The more distally located microbathymetric map covers the transition from the continental bulge into the Ionian Basin, including the mouth of Catania Canyon. The seafloor inclination is on average about 13° on the continental slope and <5° in the basin on the SE part of the map. Overall, the seafloor morphology in this map is much smoother than farther upslope and dominated by sedimentary features like canyons, landslide scars, canyon debris, and sediment waves. In the southwestern corner of the map a NW–SE oriented elongated positive relief is visible that disappears in the canyon mouth. It matches the downslope continuation of the active strike slip fault observed farther upslope indicating a similar genetic origin. There is no seafloor expression of this fault within the mouth of Catania Canyon as well as farther towards the east. This might be due to active sediments transport through the canyon leading to either deposition of these sediments at the mouth of the canyon, or thalweg erosion, which would both mask the imprint of recent fault activity. Alternatively, the distal part of the fault may not have been active recently. Constraints on the interplay of sedimentary processes linked to Catania Canyon and tectonic processes related to Etna’s moving flank are hampered by the limited information that is available regarding the activity of Catania Canyon. While the imprint of debris in the canyon floor suggests a certain degree of canyon activity there is no major river system that connects to the head of the canyon and that could provide sediment input. A steep scar and drop in relief from 1700 to 1790 m water depth in the entire canyon thalweg could be the result of erosion by mass movements or bottom currents. With the available data it is thus not possible to resolve the exact location, offshore extent, and activity of the distal most section of the southern boundary fault of Etnas unstable flank.
3.3 Seismic Reflection Profiles
While bathymetric data provide information on surface morphologies, seismic reflection surveys image the structure of the subsurface. Seismic resolution and penetration depths are primarily controlled by the frequency of the emitted signal and the physical nature of the subsurface. Due to strong attenuation of high-frequency signals, it is difficult to achieve high resolution and deep penetration at the same time. Here, we analyse seismic reflection data yielding a vertical resolution of ∼10 m. Subsurface penetration along the submerged flank of Mount Etna strongly depends on the nature of the subsurface and varies between some tens of meters (on the volcanic pile) and up to 1 km (in sedimentary basins). These data are thus particularly well-suited to image shallow sedimentary strata.
We show unpublished seismic reflection lines (Figure 5) from two surveys conducted in 2012 during expedition M86/2 with RV METEOR (Krastel and Cruise, 2012) and in 2016 during expedition POS496 with RV POSEIDON (Krastel, 2016). During the 2012 survey, a Geometrics GeoEel digital streamer including 104 channels and a total length of 162.5 m was used for recording of seismic signals. The source was a 2 × 1.7 L GI gun. For the 2016 survey the seismic source was a Mini GI air gun (2 × 0.2 L) and the receiver a Geometrics GeoEel digital streamer with 80 channels and a total length of 125 m. Standard processing routines were applied with details described in Gross et al. (2016) and Schulze (2017).
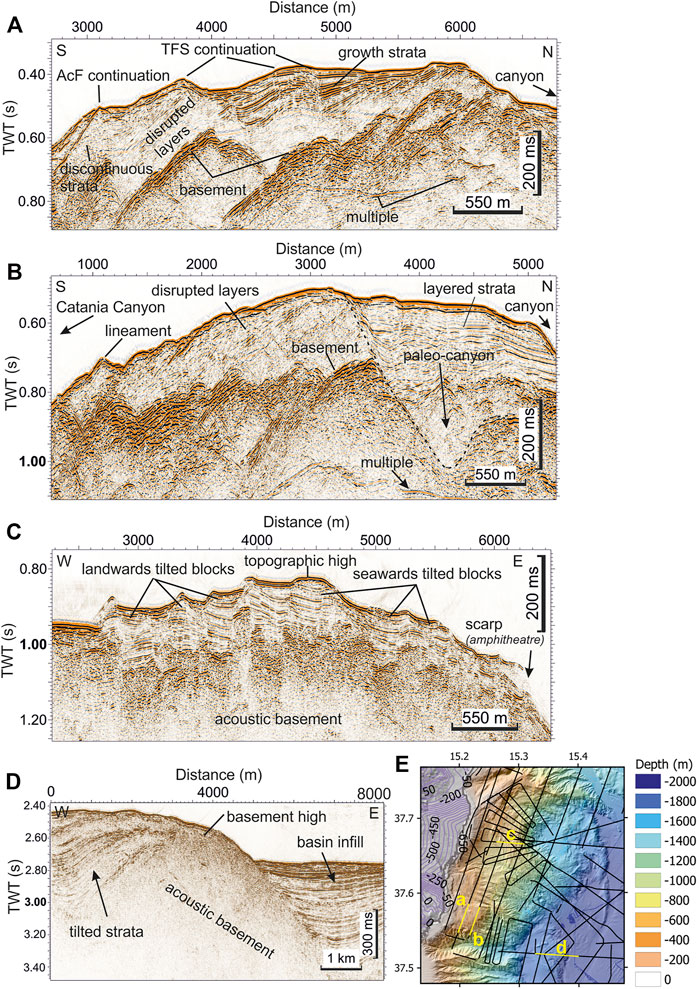
FIGURE 5. Reflection seismic profiles across (A,B) the southern boundary fault, (C) the area of ridges and elongated local topographic high, and (D) the topographic high at the edge of the continental bulge. Locations are shown in e.
Two margin-parallel seismic lines image the offshore continuation of the Acitrezza and Timpe faults, at distances of 3.5 km (Figure 5A) and 5 km (Figure 5B) off the coast (locations shown in Figure 5E). The deepest recognisable unit in both profiles is of high amplitudes with an undulating surface. This unit likely corresponds to the pre-Etnean clay basement as also suggested by Barreca et al. (2018). The overall depth of the inferred basement is consistent with the seaward extrapolation of onshore basement depth shown in Figure 5E. The pre-Etnean clay units are overlain by mainly chaotic as well as layered units. While the chaotic strata may correspond to volcanic deposits, the layered reflections are usually interpreted as continental slope sediments (Gross et al., 2016). The latter become progressively more disrupted and offset from N to S, indicating recent and shallow tectonic deformation.
The proximal seismic line (Figure 5A) images the offshore continuation of the Acitrezza fault as a vertical divide between shallow discontinuous strata to the S from layered (but disrupted) strata to the N. This may result from significant juxtaposition of geologic units across the strike-slip fault. The seismic data do not resolve whether the fault is limited to shallow depths or if it also affects the underlying stable basement. Farther towards the north, the seismic line reveals the curved seafloor escarpments observed in the bathymetry (Figure 3D) that appear to connect the onshore Timpe Fault System with the offshore continuation of the Acitrezza fault. Here, the seafloor escarpments are the surface expression of seaward dipping normal faults, with growth strata in the hanging-wall indicating syn-sedimentary and likely recent extensional deformation. It is possible to trace reflector packages across the faults, suggesting no or little offset by strike slip motion. Again, no significant offsets of the undulated basement are visible. Nevertheless, this may also be an effect of the poor imaging of the basement strata.
About 2 km farther downslope (Figure 5B) of the seismic line shown in Figure 5A, the surface expressions of the different fault systems have merged into one structure which corresponds to the W-E trending lineament observed at the seafloor (Figure 5B, Chiocci et al., 2011; Gross et al., 2016). Here, the lineament is underlain by a local basement high. To the north, disrupted sedimentary layers, likely of volcanic and volcanoclastic origin, cover the undulating basement. In the central part of Figure 5B the subsurface strata, including the basement, are cut by a v-shaped paleo-depression filled with continuous and layered strata, partly of undulating nature. We interpret the v-shaped structure as a paleo-canyon that is filled with sedimentary strata that has experienced little or no deformation.
The seismic line shown in Figure 5C trends perpendicular to the coast across the continental slope upslope of the amphitheater. Layered continental slope sediments that separate into individual blocks bounded by steeply inclined extensional faults characterize the shallow sub-surface (Figure 5C). Tilt of the individual blocks in landward (at the western part of the seismic line) and seaward (eastern part) direction results in the peculiar seafloor morphology of coast-parallel trending ridges (Figure 3) that were also observed by Gross et al. (2016). The slope sediments are underlain by a chaotic acoustic basement that may correspond to volcanic and volcanoclastic material. We interpret the shallow extensional deformation of the slope sediments, including the transition from primarily landward dipping faults in upslope direction to primarily seaward dipping faults farther downslope, as the result of localized margin parallel uplift of the continental slope.
The most distal seismic line (Figure 5D) images the Ionian Basin just seaward of the mouth of Catania Canyon in W-E direction. Along the central part of the line, the acoustic basement crops out at the seafloor (Figure 5D). It separates folded and deformed sedimentary strata to the west from layered and largely undeformed sedimentary strata to the east. On the western side of the line, the dip of the sedimentary layers increases with depth, indicating syn-sedimentary deformation. Although the genetic origin of the acoustic basement in the central part of the line remains unresolved, it seems to mark the transition of compressional deformation at the margin of Mount Etna into the Ionian Basin.
3.4 Seafloor Geodesy
The above data sets all show compelling evidence for long-term deformation across the southern boundary of Mount Etna’s moving flank. There is also evidence for active (short-term) movement along this boundary from a seafloor geodetic experiment (Urlaub et al., 2018). Relative seafloor motion across the boundary fault was recorded from April 2016 until January 2018 within the area covered by the proximal microbathymetric AUV map (Figure 4) between 800–1,100 m water depth (Figure 6A). The direct-path acoustic ranging method provided continuous distance measurements between five transponders at the seafloor in an array configuration. The measurements allowed reconstructing relative seafloor displacement within the array in the respective observation period at sub-centimetre precision (Petersen et al., 2019).
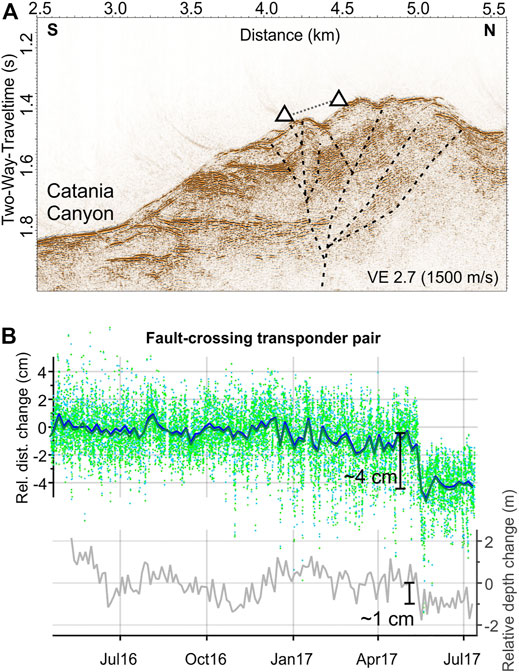
FIGURE 6. Results from the seafloor geodetic experiment (see Figure 1B for location). (A) Seismic profile in the area of the seafloor geodetic network, crossing the southern boundary fault. Triangles mark the approximate location of transponders, which are projected onto the profile. (B) Time series of relative distance changes and relative depth changes between two transponders that are located on different sides of the boundary fault after Urlaub et al. (2018). Absolute distance between transponders is 840 m. Dots show actual measurements and continuous lines show distance changes averaged over 5 days.
The seafloor network revealed a significant distance change between fault-crossing transponder pairs in May 2017 (Figure 6B). Vertical motion makes up only a minor part of these distance changes. Combining the network information, up to 4 cm of right-lateral fault slip was released across the well-defined lineament (Figure 4) in a slow-slip event lasting 8 days (Urlaub et al., 2018). This is a minimum estimate of fault slip because activity of other fault branches not covered by the array cannot be excluded. In the same observation period, onshore faults kinematically related to flank instability also accumulated ∼4 cm of right-lateral fault slip, providing confidence in the cross-shoreline continuation of these fault systems.
3.5 Offshore Seismicity
In April 2016, six short-period ocean-bottom seismometers (OBS) were deployed around the seafloor geodetic network at the southeastern flank of Mount Etna. Five OBS recorded continuously until their recovery in February 2017 while one instrument ceased to record after 2 months. Each OBS was equipped with a three-component short-period geophone of 4.5 Hz corner frequency and a HiTech Inc. hydrophone. We used an STA/LTA trigger to detect seismic events in the continuous waveforms. After applying a 3–15 Hz bandpass filter to the waveforms, we manually picked the onsets of P and S phase arrivals. The data processing, phase picking and database management were accomplished using the software SEISAN of Havskov and Ottemoeller (1999). Subsequently, we estimated absolute event locations based on a local 1D velocity model, which was extracted from an adjacent 2D refraction seismic profile (Dannowski et al., 2019) using the non-linear oct-tree search algorithm NonLinLoc (Lomax et al., 2000). We located five local earthquakes with phase arrivals on all recording OBS (Figure 7; Table 1). These events had not been detected by the permanent onshore network maintained by the local Etna Observatory and have not yet been published.
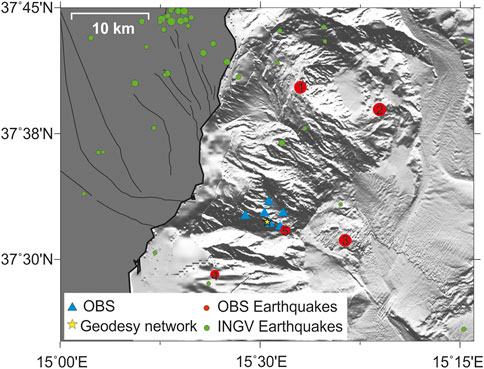
FIGURE 7. Seismicity on Mount Etna’s submarine southeastern flank between April 2016 and February 2017, during which an Ocean Bottom Seismometer array consisting of six instruments (blue triangles) was installed. See Table 1 for details on the events detected by the OBS array.
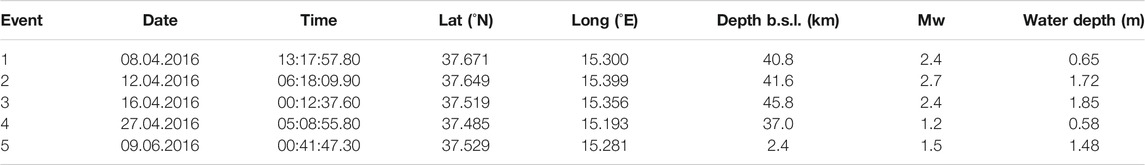
TABLE 1. Seismic events detected by the Ocean Bottom Seismometer network from April 2016 until February 2017. Note that we report only those events that were not detected by the permanent onshore network.
All detected earthquakes occurred outside of the OBS network (GAP >180°) and have not been resolved by the onshore network. The calculated moment magnitudes range from 1.2 < Mw < 2.7. Four events occurred in depths >35 km and are therefore not associated to Etna’s flank. The location of the single shallow event coincides with the seawards extension of the lineament (Figure 7), along which the seafloor geodetic array recorded the right-lateral slow slip motion described above. The event occurred 2.4 km depth below sea level, which accounts for only 900 m below the seafloor. The location uncertainties for this event are low given its proximity to the OBS network. Because of its shallow depth and location, we interpret the event as a manifestation of Etna’s flank instability. The earthquake occurred in June 2016 and thus 11 months prior to the geodetically recorded slow slip event.
4 Discussion
Bringing together published (bathymetry, seafloor geodesy) and newly acquired marine geophysical data (reflection seismic lines, bathymetry, microbathymetry, offshore seismicity) yields new insights into the geometry of Mount Etna’s submerged unstable southeastern flank. Here, we summarise and discuss our observations in order to define the structures and locations of the boundaries of the moving flank. We identify the gaps that still exist in this definition and describe how they might be overcome in order to further constrain the offshore volcano-tectonic structure.
4.1 Southern Boundary
In the shallow offshore, there is a clear morphological continuation of the onshore Acitrezza fault. In seismic data, this structure (termed lineament) represents a near-vertical divide between different units, as expected for horizontal juxtaposition caused by strike-slip motion (Figures 5A,B). This lineament continues downslope as a razor-sharp fault scarp at the seafloor, now resolved for the first time in newly collected microbathymetric data (Figure 4A). The fault morphology is almost identical to that of the Dragon’s Back segment of the San Andreas fault (Figure 8). This part of the San Andreas Fault accommodates dextral slip of 3.5 cm/yr (Jones and Wesnousky, 1992). Hence, the morphology observed at Etna’s flank indicates recent and shallow deformation at comparable rates. This is further supported by recent dextral deformation across the fault scarp during a slow-slip event of 4 cm recorded by the seafloor geodetic array in May 2017. The inferred slip rate of the offshore fault is of similar magnitude as displacement rates associated with seaward flank sliding onshore, and thus at least an order of magnitude higher than tectonic rates in the region. We therefore conclude that the offshore continuation of the Acitrezza fault (or lineament) accommodates seaward flank sliding. The lineament is the main volcano-tectonic feature accommodating seaward motion along the southern boundary of the unstable sector. The amount of slip recorded during the May 2017 event is in the same order of magnitude as the cumulative slip measured on all onshore faults across the southern boundary during the same time, all converging to this lineament offshore. From this, and the lack of adjacent offshore fault scarps of similar nature, we suggest that the southern boundary of the mobile sector in the marine realm is described by a single fault, cumulating and releasing the slip that is then partitioned upwards on along all onshore faults dissecting the southeastern flank of the volcano.
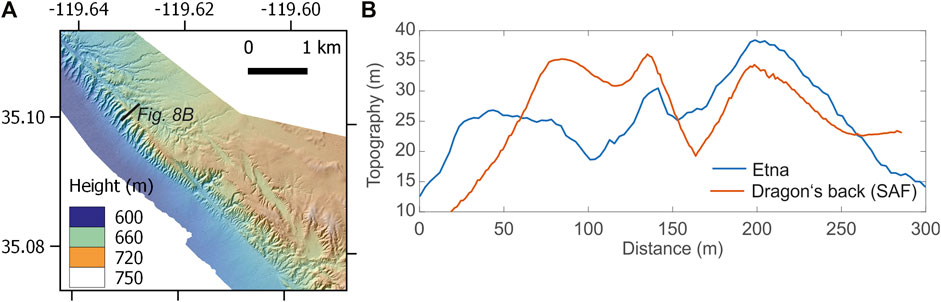
FIGURE 8. Comparison of the morphology around the San Andreas Fault and the offshore continuation of the Acitrezza fault offshore Mount Etna. (A) Topographic map of the Dragon’s Back pressure ridge segment of the San Andreas Fault. Data was extracted from the OpenTopography Facility with support from the National Science Foundation under NSF Award Numbers 1833703, 1833643, and 1833632. (B) Cross-fault height profiles. Locations are shown in Figure 8A and in Figure 4A.
The offshore continuation of the faults belonging to the Timpe Fault System accommodates extensional deformation most likely limited to the shallow sedimentary strata (Figure 5A). Continuation of sedimentary layers from the footwall into the hanging wall of the faults suggests no or little offset by strike slip motion. These faults bend towards the ESE (Figure 3D), i.e. in downslope direction, before merging with the offshore continuation of the Acitrezza fault (or lineament) representing the southern boundary of the moving flank. We interpret the bending and shallow extension as a result of downwards and eastwards sliding of the moving flank. In this model, the offshore branches of the Timpe Fault System are shallow second-order structures that result from extensional deformation within the moving flank.
The active southern boundary fault extends in downslope direction at least to the seawards edge of the continental bulge. This is supported by its prominent morphology (Figure 4) and shallow seismic activity (Figure 7) along its distal trace. A possible continuation into the Ionian Basin is less clear. The morphological expression of the fault on the seafloor disappears in the mouth of Catania Canyon (Figure 4A), where it is most likely masked by sediment deposition or erosion that exceeds fault activity.
A link to regional strike-slip tectonics, i.e. to the North Alfeo fault, is not evident from our data. We therefore propose that the observed southeastern flank motion is primarily gravitationally driven. However, a certain geometric, dynamic, and genetic link to underlying crustal structures, which may act as a nucleus for driving or simply a weak zone for accommodating flank movement, cannot be excluded. Understanding this possible link is important in order to better characterise the hazard posed by this fault as well as the interaction of the volcano with the tectonic setting.
4.2 Seaward and Northern Boundaries
As the southern boundary extends at least to the edge of the continental bulge, also the seawards boundary (foot) of the unstable flank must be located similarly far into the Ionian Sea, at least along its south-eastern edge. Here, a basement high (i.e. the acoustic basement described in Figure 5D) separates folded young sediments in the west from unfolded shallow sediments in the Ionian Basin (Figure 5D). This area also reveals a local topographic high (Figures 3B,D). Folding of shallow strata in the west (0–3,000 m in Figure 5D) is likely a result of compression against this basement high. This basement high seems to act as a kinematic boundary because the sediments in the Ionian Basin on the eastern flank of the basement high are undisturbed (5,000–8,000 m in Figure 5D). We propose that, as Mount Etna’s unstable flank moves seawards, it bulldozes shallow sedimentary strata against the basement high, which forms a stable buttress. This bulldozing induces compressional deformation of shallow sediments leading to folding of these sediments west of the basement high, but not east of it. A similar deformation pattern is absent in seismic data from the toe of the bulge to the north so that the northward continuation of the seaward boundary is still uncertain and needs further investigation.
A region within the northernmost sector of the moving flank that seems to experience uplift is the rim upslope of the amphitheater. The edge of the amphitheatre is described by a N-S elongated topographic high bounded to the west by the Valle di Archirafi and to the east by the amphitheatre. Shallow normal faults accommodate extensional deformation on both sides of the topographic high (Figure 5C). The resulting downward movement of shallow sediment blocks produces a stair-step morphology. We suggest that these normal faults form in response to local uplift along a N-S trending axis roughly parallel to the coast. One process that could induce this localized uplift is rotational slumping originating at the western side of the Valle di Archirafi. This would induce contraction at the slump’s foot that squeezes up the sediments to form the N-S trending elongated topographic high. In this conceptual model, the Timpe faults would represent the head- and sidewalls of rotational slumping. This model resembles that of the Hilina Slump at Kilauea’s submerged flank (Figure 9), where onshore normal faults mark the headwall of the slump. Extensional deformation along these faults leads to the formation of the offshore mid-slope basin (equivalent to Valle di Archirafi). In the deep offshore, an uplifting feature known as the outer bench corresponds to the slump’s toe (Morgan et al., 2003). At Kilauea, the seaward-facing steep cliff of the outer bench is affected by significant erosion, which probably is a result of oversteepening due to ongoing uplift (Philips et al., 2008). Following this argumentation, the amphitheater at Etna could also be forming by intense erosion. The high backscatter intensity (Figure 3C) indicates that the amphitheatre consists of comparatively hard material. Any soft material might have eroded.
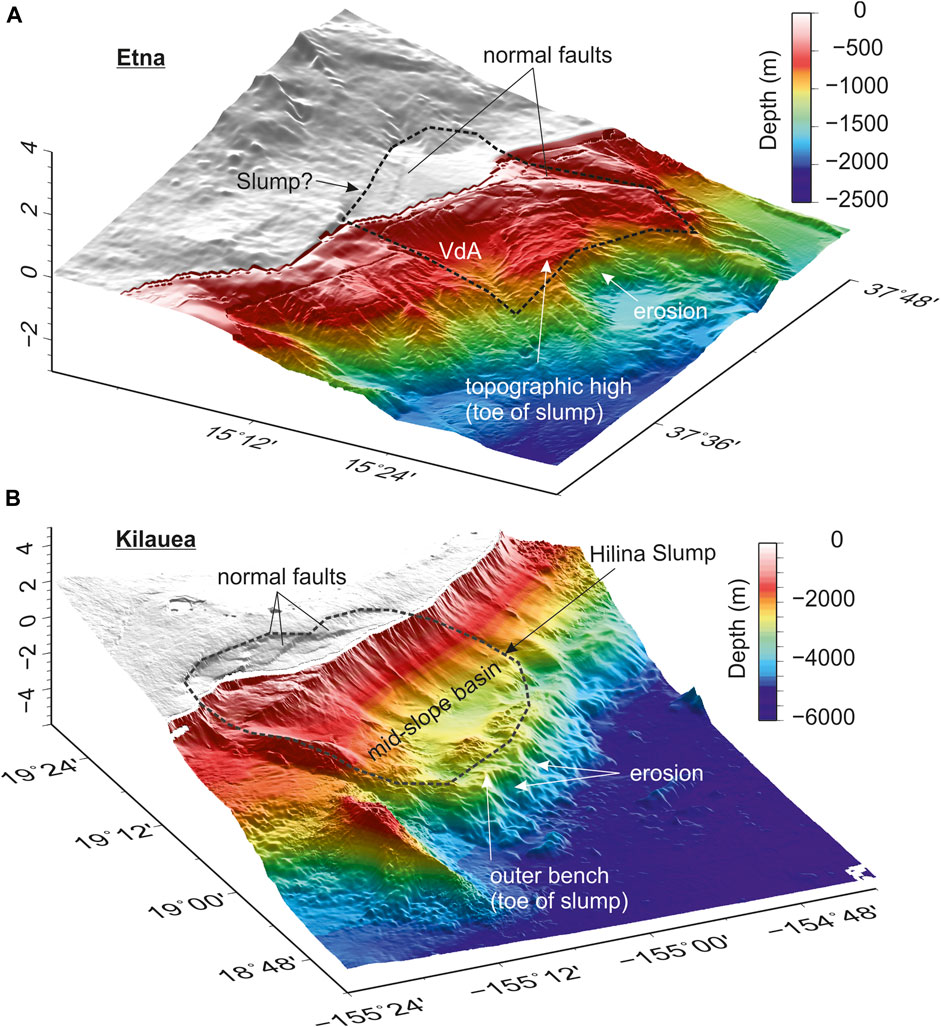
FIGURE 9. Perspective view from the offshore of (A) Etna and (B) Kilauea. The Valle di Archirafi (VdA) at Etna could be formed by a rotational slump, as is the case for the mid-slope basin at Kilauea. Data for Kilauea downloaded from the Global Multi-Resolution Topography Synthesis (Ryan et al., 2009).
This conceptual model explains the uplift and extensional collapse of the continental margin upslope of the amphitheater. It further sheds light on the erosional process that led to the formation and shape of the amphitheater. The model, however, does not resolve the question on the seawards boundary of the unstable flank in the north. It seems possible that uplift of shallow sedimentary strata induced by gravitational slumping at the western side of the Valle di Archirafi is superimposed on a longer (deeper origin) wavelength deformation pattern induced by the distal boundary of the moving flank. This scenario is supported by the fact that south of the area interpreted to be affected by slumping there is no clear seafloor or sub-seafloor structure that may correspond to the seawards boundary. This includes the lack of evidence for EW compression as well as any sharply defined fault outcrops at the seafloor. In alignment with previous studies (Argnani et al., 2013) we do not observe clear evidence for the location of the northern boundary of the entire mobile flank in our data.
4.3 Overall Structure of Etna’s Southeastern Flank
For a synthesis of the above findings, we build on the onshore structural map of Bonforte et al. (2011) and extend it to the offshore flank (Figure 10). Based on results from the Permanent Scatterers technique, Bonforte et al. (2011) identify three main structural domains that form Etna’s mobile southeastern flank; Northeast Block, Giarre Wedge, and Medium-East Block. The Giarre Wedge (red domain in Figure 10) is the sector showing the strongest subsidence, associated with a significant eastward motion that remains outstanding even when the rest of the volcano is deflating. In the model we propose above, this is the extensional and subsiding part at the head of a rotational slump. The compressional part (or toe) of the slump is probably found offshore at the topographic high upslope of the amphitheatre (Figures 5C, 10). This area thus could belong to the Giarre Wedge block (red domain in Figure 10). We determine the block’s seawards termination to coincide with a break in slope and the disappearance of North-South trending ridges. There is a morphological divide between the North-South trending ridges marking the toe of the slump, and East-West oriented lineaments that shape the south of the study area (Figures 3D, 10). This morphological divide probably forms the southern edge of the area of the unstable flank that is additionally involved in slumping (red domain). Because of the faster movement of the Giarre Wedge with respect to the other blocks, we expect this boundary area to host right-lateral motion but microbathymetric and seafloor geodetic data are needed to confirm this. The area between this divide and the southern boundary fault probably represents the pure eastwards flank movement on seawards inclined basement. We suggest this pattern to be conform to the onshore Medium-East Block (green domain).
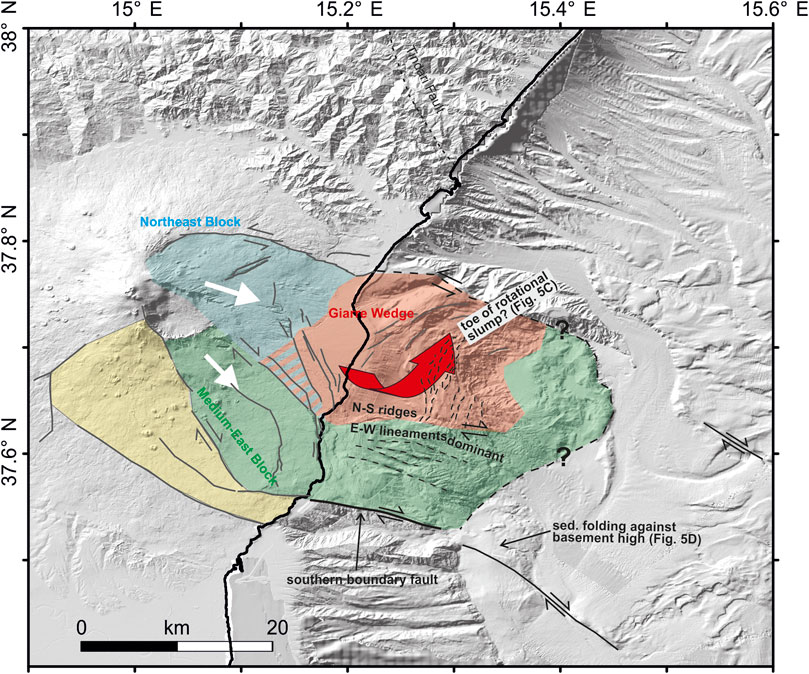
FIGURE 10. Structural map of Mount Etna’s unstable southeastern flank combining the onshore structure and nomenclature proposed by Bonforte et al. (2011) and the offshore structure presented here. Dashed lines with question marks indicate uncertainty in the location of the limit of the unstable sector. The red arrow suggests rotational slump movement of the Giarre Wedge. We infer a slump movement from observations of strong subsidence of the onshore part in InSAR and GNSS data (Bonforte and Puglisi, 2006), and evidence of active uplift in the offshore part in seismic data (Figure 5C).
Our structural interpretation suggests that also the offshore flank is segmented, similarly to what has been proposed for the onshore part of the southeastern flank based on GNSS and InSAR data (Solaro et al., 2010; Bonforte et al., 2011). What is the reason for this segmentation? Bonforte et al. (2011) propose that basement discontinuities drive segmentation. This is also possible for the offshore flank. However, the hypothesis is difficult to test because of a lack of information on offshore stable basement morphology. The available marine geophysical data do not allow consistent imaging of the stable basement underlying the volcano flank.
5 Summary and Outlook
The geometry, structure and recent activity of the lateral submerged southern boundary of Mount Etna’s unstable flank is now well-defined based on a wealth of different marine geophysical data. Deciphering a link and possible interaction of the volcanic flank with regional tectonic structures requires further investigations. A comparison of fault slip at the continental bulge and at tectonic features in the Ionian Basin will help identify a potential connection. Furthermore, long-term offshore slip rates will provide more confidence on the overall rates and style of deformation. Knowing the depth of the fault will also help discern between tectonic and gravitational origin of fault slip. As seismic imaging is poor due to the nature of the substrate even across different resolutions (Argnani et al., 2013; Gross et al., 2016; Carlino et al., 2019), comparison and integration with other methods or disciplines could help determine whether the faults considered here are crustal structures. Faults are preferred vertical pathways for pore fluids, which carry diagenetic signals from the stratigraphic units they originate from. Hence, geochemical analyses of the composition of sediment pore fluid from faults could be one possibility to constrain fault depth.
From shipborne bathymetric data and seismic reflection lines it was possible to formulate hypothesizes about possible locations of the seawards and northern boundary of the moving flank. It has to be noted, however, that the high level of confidence that now accompanies the location and activity of the southern boundary offshore fault was only achieved through the combination of latest microbathymetry collected with an AUV (in 2020) and a continuous seafloor geodetic survey (2016–2018). Such a combination of latest and state-of-the-art marine geophysical data is, to our knowledge, however, not available for a single other submerged volcanic flank on Earth.
Considering the continuous gravitational downwards and eastwards sliding of the volcano flank, the seawards boundary should be a compressional feature. We show evidence for compression in certain locations but do not succeed to identify a continuous structure in the available seismic data. At Kilauea, monitoring vertical seafloor deformation with pressure gauges revealed active uplift of the volcano’s toe (Philipps et al., 2008). The data confirmed the structure and seawards boundary of Kilauea’s unstable south flank as Morgan et al. (2003) postulated based on reflection seismic data. Such pressure monitoring at the toe of Mount Etna’s flank, which we suspect to actively uplift in response to flank dynamics, may also help to constrain the seawards limit of Mount Etna’s flank. Unless such data become available, the location of the offshore northern and seawards boundaries of the mobile sector remain speculative.
Today, the situation at the lateral northern boundary of the moving flank resembles the available knowledge on the southern boundary prior to collection of the AUV microbathymetry and seafloor geodesy data. We expect the northern boundary of the Etna landslide to deform in a left-lateral motion at similar rate and style as the southern boundary. It is also possible that the motion on the offshore northern side is accommodated by a more complex arrangement of structures, as is the case on southern onshore side of the volcano. While we are able to formulate hypothesizes about its location and activity of the boundary faults, a better constrained model will only be possible with comparable data (i.e., with microbathymetry and seafloor geodesy).
Data Availability Statement
The datasets presented in this study can be found in the online repository PANGAEA (https://www.pangaea.de/) as supplement to this publication:
https://doi.pangaea.de/10.1594/PANGAEA.922750
https://doi.pangaea.de/10.1594/PANGAEA.893036
https://doi.pangaea.de/10.1594/PANGAEA.941403
All other data will be made available upon request to the corresponding author.
Author Contributions
MU and JG led the conception and design of the manuscript and wrote the first draft. JG wrote sections of the manuscript. FP conducted the seismological analysis. AB and FG contributed to the conception of the study. MU, FP, FG, AB, and SK acquired the data. HK substantially contributed to data acquisition. All authors contributed to manuscript revision, read, and approved the submitted version.
Funding
This project has received funding from the European Research Council (ERC) under the European Union’s Horizon 2020 research and innovation programme (grant agreement No. 948797).
Conflict of Interest
The authors declare that the research was conducted in the absence of any commercial or financial relationships that could be construed as a potential conflict of interest.
Publisher’s Note
All claims expressed in this article are solely those of the authors and do not necessarily represent those of their affiliated organizations, or those of the publisher, the editors and the reviewers. Any product that may be evaluated in this article, or claim that may be made by its manufacturer, is not guaranteed or endorsed by the publisher.
Acknowledgments
We thank Marc André Gutscher for providing the CIRCEE bathymetry compilation of the Ionian Sea, Irena Schulten for processing the backscatter data, Bruna Pandolpho for calculating morphometric attributes, Anja Steinführer for processing and editing the AUV bathymetry, and the scientific and nautic crews of expeditions M86/2, M111, POS496, POS509, POS515, AL532, and SO277. Sincere thanks to the Chief Editor Valerio Acocella and two reviewers for thorough reviews that helped improving the manuscript. Figures were created using the Free and Open Source QGIS and GMT, as well as ArcMAP, The Kingdom Software, and Matlab.
References
Acocella, V., Behncke, B., Neri, M., and D'Amico, S. (2003). Link between Major Flank Slip and 2002–2003 Eruption at Mt. Etna (Italy). Geophys. Res. Lett. 30 (24). doi:10.1029/2003gl018642
Alparone, S., Barberi, G., Bonforte, A., Maiolino, V., and Ursino, A. (2011). Evidence of Multiple Strain fields beneath the Eastern Flank of Mt. Etna Volcano (Sicily, Italy) Deduced from Seismic and Geodetic Data during 2003-2004. Bull. Volcanol 73, 869–885. doi:10.1007/s00445-011-0456-1
Alparone, S., Bonaccorso, A., Bonforte, A., and Currenti, G. (2013). Long-term Stress-Strain Analysis of Volcano Flank Instability: The Eastern Sector of Etna from 1980 to 2012. J. Geophys. Res. 118, 1–11. doi:10.1002/jgrb.50364
Alparone, S., Maiolino, V., Mostaccio, A., Scaltrito, A., Ursino, A., and Barberi, G. (2015). Instrumental Seismic Catalogue of Mt. Etna Earthquakes (Sicily, Italy): Ten Years (2000-2010) of Instrumental Recordings. Ann. Geophys. 58 (4), S0435. doi:10.4401/ag-6591
Argnani, A., and Bonazzi, C. (2005). Malta Escarpment Fault Zone Offshore Eastern Sicily: Pliocene-Quaternary Tectonic Evolution Based on New Multichannel Seismic Data. Tectonics 24. doi:10.1029/2004tc001656
Argnani, A., Mazzarini, F., Bonazzi, C., Bisson, M., and Isola, I. (2013). The Deformation Offshore of Mount Etna as Imaged by Multichannel Seismic Reflection Profiles. J. Volcanology Geothermal Res. 251, 50–64. doi:10.1016/j.jvolgeores.2012.04.016
Azzaro, R., Bonforte, A., Branca, S., and Guglielmino, F. (2013). Geometry and Kinematics of the Fault Systems Controlling the Unstable Flank of Etna Volcano (Sicily). J. Volcanology Geothermal Res. 251, 5–15. doi:10.1016/j.jvolgeores.2012.10.001
Barreca, G., Bonforte, A., and Neri, M. (2013). A Pilot GIS Database of Active Faults of Mt. Etna (Sicily): A Tool for Integrated hazard Evaluation. J. Volcanology Geothermal Res. 251, 170–186. doi:10.1016/j.jvolgeores.2012.08.013
Barreca, G., Corradino, M., Monaco, C., and Pepe, F. (2018). Active Tectonics along the South East Offshore Margin of Mt. Etna: New Insights from High-Resolution Seismic Profiles. Geosciences 8 (2), 62. doi:10.3390/geosciences8020062
Berndt, C., Urlaub, M., Jegen, M., Zahra, F., Gesa, F., Carolin, K., et al. (2021). RV SONNE Fahrtbericht/Cruise Report SO277 OMAX: Offshore Malta Aquifer Exploration, Emden (Germany) - Emden (Germany), 14.08. - 03.10.2020. GEOMAR Report, N. Ser. 057, 139. doi:10.3289/GEOMAR_REP_NS_57_20
Bonaccorso, A., Currenti, G., and Del Negro, C. (2013). Interaction of Volcano-Tectonic Fault with Magma Storage, Intrusion and Flank Instability: A Thirty Years Study at Mt. Etna Volcano. J. Volcanology Geothermal Res. 251, 127–136. doi:10.1016/j.jvolgeores.2012.06.002
Bonforte, A., Bonaccorso, A., Guglielmino, F., Palano, M., and Puglisi, G. (2008). Feeding System and Magma Storage beneath Mt. Etna as Revealed by Recent Inflation/deflation Cycles. J. Geophys. Res. Solid Earth 113. doi:10.1029/2007jb005334
Bonforte, A., Branca, S., and Palano, M. (2007). Geometric and Kinematic Variations along the Active Pernicana Fault: Implication for the Dynamics of Mount Etna NE Flank (Italy). J. Volcanology Geothermal Res. 160, 210–222. doi:10.1016/j.jvolgeores.2006.08.009
Bonforte, A., Carnazzo, A., Gambino, S., Guglielmino, F., Obrizzo, F., and Puglisi, G. (2013a). A Multidisciplinary Study of an Active Fault Crossing Urban Areas: The Trecastagni Fault at Mt. Etna (Italy). J. Volcanology Geothermal Res. 251, 41–49. doi:10.1016/j.jvolgeores.2012.05.001
Bonforte, A., Guglielmino, F., Coltelli, M., Ferretti, A., and Puglisi, G. (2011). Structural Assessment of Mount Etna Volcano from Permanent Scatterers Analysis. Geochem. Geophys. Geosys 12, Q02002. doi:10.1029/2010gc003213
Bonforte, A., Guglielmino, F., and Puglisi, G. (2013b). Interaction between Magma Intrusion and Flank Dynamics at Mt. Etna in 2008, Imaged by Integrated Dense GPS and DInSAR Data. Geochem. Geophys. Geosyst. 14 (8), 2818–2835. doi:10.1002/ggge.20190
Bonforte, A., and Puglisi, G. (2006). Dynamics of the Eastern Flank of Mt. Etna Volcano (Italy) Investigated by a Dense GPS Network. J. Volcanology Geothermal Res. 153 (3-4), 357–369. doi:10.1016/j.jvolgeores.2005.12.005
Branca, S., Coltelli, M., Groppelli, G., and Lentini, F. (2011). Geological Map of Etna Volcano, 1: 50,000 Scale. Ital. J. Geosciences 130 (3), 265–291. doi:10.3301/ijg.2011.15
Branca, S., and Ferrara, V. (2013). The Morphostructural Setting of Mount Etna Sedimentary Basement (Italy): Implications for the Geometry and Volume of the Volcano and its Flank Instability. Tectonophysics 586, 46–64. doi:10.1016/j.tecto.2012.11.011
Bruno, V., Mattia, M., Montgomery-Brown, E., Rossi, M., and Scandura, D. (2017). Inflation Leading to a Slow Slip Event and Volcanic Unrest at Mount Etna in 2016: Insights from CGPS Data. Geophys. Res. Lett. 44 (24), 12–141. doi:10.1002/2017gl075744
Cayol, V., Dieterich, J. H., Okamura, A. T., and Miklius, A. (2000). High Magma Storage Rates before the 1983 Eruption of Kilauea, Hawaii. Science 288 (5475), 2343–2346. doi:10.1126/science.288.5475.2343
Chiocci, F. L., Coltelli, M., Bosman, A., and Cavallaro, D. (2011). Continental Margin Large-Scale Instability Controlling the Flank Sliding of Etna Volcano. Earth Planet. Sci. Lett. 305, 57–64. doi:10.1016/j.epsl.2011.02.040
Dannowski, A., Kopp, H., Klingelhoefer, F., Klaeschen, D., Gutscher, M.-A., Krabbenhoeft, A., et al. (2019). Ionian Abyssal Plain: A Window into the Tethys Oceanic Lithosphere. Solid Earth 10 (2), 447–462. doi:10.5194/se-10-447-2019
De Guidi, G., Brighenti, F., Carnemolla, F., Imposa, S., Marchese, S. A., and Palano, M. (2018). The Unstable Eastern Flank of Mt. Etna Volcano (Italy): First Results of a GNSS-Based Network at its southeastern Edge. J. Volcanology Geothermal Res. 357, 418–424. doi:10.1016/j.jvolgeores.2018.04.027
De Novellis, V., Atzori, S., De Luca, C., Manzo, M., Valerio, E., and Bonano, M. (2019). DInSAR Analysis and Analytical Modeling of Mount Etna Displacements: The December 2018 Volcano-Tectonic Crisis. Geophys. Res. Lett. 46 (11), 5817–5827. doi:10.1029/2019gl082467
Dieterich, J., Cayol, V., and Okubo, P. (2000). The Use of Earthquake Rate Changes as a Stress Meter at Kilauea Volcano. Nature 408 (6811), 457–460. doi:10.1038/35044054
Firetto Carlino, M., Cavallaro, D., Coltelli, M., Cocchi, L., Zgur, F., and Patanè, D. (2019). Time and Space Scattered Volcanism of Mt. Etna Driven by Strike-Slip Tectonics. Sci. Rep. 9 (1), 15–12215. doi:10.1038/s41598-019-48550-1
Gambino, S., Bonforte, A., Carnazzo, A., Falzone, G., Ferrari, F., Ferro, A., et al. (2011). Displacement across the Trecastagni Fault (Mt. Etna) and Induced Seismicity: the October 2009 to January 2010 Episode. Ann. Geophys. 54.
Groppelli, G., and Tibaldi, A. (1999). Control of Rock Rheology on Deformation Style and Slip-Rate along the Active Pernicana Fault, Mt. Etna, Italy. Tectonophysics 305 (4), 521–537. doi:10.1016/s0040-1951(99)00035-9
Gross, F., Krastel, S., Geersen, J., Behrmann, J. H., Ridente, D., and Chiocci, F. L. (2016). J. Bialas, C. Papenberg, D. Cukur, M. Urlaub, A. MicallefThe Limits of Seaward Spreading and Slope Instability at the continental Margin Offshore Mt Etna, Imaged by High Resolution 2D Seismic Data. Tectonophysics 667, 63–76. doi:10.1016/j.tecto.2015.11.011
Gutscher, M. A., Dominguez, S., Lepinay, B. M. de, Pinheiro, L., and Gallais, F., (2016). Tectonic Expression of an Active Slab Tear from High-Resolution Seismic and Bathymetric Data Offshore Sicily (Ionian Sea). Tectonics 35 (1), 39–54. doi:10.1002/2015tc003898
Gutscher, M. A., Kopp, H., Krastel, S., Bohrmann, G., Garlan, T., and Zaragosi, S. (2017). Active Tectonics of the Calabrian Subduction Revealed by New Multi-Beam Bathymetric Data and High-Resolution Seismic Profiles in the Ionian Sea (Central Mediterranean). Earth Planet. Sci. Lett. 461, 61–72. doi:10.1016/j.epsl.2016.12.020
Gvirtzman, Z., and Nur, A. (1999a). The Formation of Mount Etna as the Consequence of Slab Rollback,. Nature 401, 782–785. doi:10.1038/44555
Havskov, J., and Ottemoeller, L. (1999). SeisAn Earthquake Analysis Software. Seismological Res. Lett. 70, 532–534. doi:10.1785/gssrl.70.5.532
Jones, C. H., and Wesnousky, S. G. (1992). Variations in Strength and Slip Rate along the San Andreas Fault System. Science 256 (5053), 83–86. doi:10.1126/science.256.5053.83
Krastel, S., and Cruise, P. (2012). Seismogenic Faults, Landslides, and Associated Tsunamis off Southern Italy. Cruise No. M86/2 – November 21, 2011 – January 17, 2012 – Cartagena (Spain) – Brindisi (Italy). METEOR-Berichte M86/2, 49. DFG-Senatskommission für Ozeanographie. doi:10.2312/cr_m86_2
Krastel, S. (2016). RV POSEIDON-CRUISE POS496, Malaga – Catania, 24.03.2016-04.04.2016, Short Cruise Report: MAGOMET - Offshore flank movement of Mount Etna and associated landslide hazard in the Ionian Sea (Mediterranean Sea). Christian-Albrechts-Universität zu Kiel. Inst. Geosciences 8. doi:10.3289/SCR_POS_496
Lanzafame, G., Neri, M., and Rust, D. (1996). A Preliminary Structural Evaluation of Recent Tectonic Activity on the Eastern Flank of Mount Etna, Sicily., West Lond. Pap. Environ. Stud. 3, 73–90.
Liu, C., Lay, T., and Xiong, X. (2018). Rupture in the 4 May 2018 MW 6.9 Earthquake Seaward of the Kīlauea East Rift Zone Fissure Eruption in Hawaii. Geophys. Res. Lett. 45 (18), 9508–9515. doi:10.1029/2018gl079349
Lomax, A., Virieux, J., Volant, P., and Berge-Thierry, C. (2000). Probabilistic Earthquake Location in 3D and Layered Models. Adv. seismic event location18, 101–134. doi:10.1007/978-94-015-9536-0_5
Mattia, M., Bruno, V., Caltabiano, T., Cannata, A., Cannavo, F., D’Alessandro, W., et al. (2015). A Comprehensive Interpretative Model of Slow Slip Events on Mt. Etna’s Eastern Flank. Geochemistry, Geophys. Geosystems 16 (3), 635–658.
Morgan, J. K., Moore, G. F., and Clague, D. A. (2003). Slope Failure and Volcanic Spreading along the Submarine South Flank of Kīlauea Volcano, Hawaii. J. Geophys. Res. 108. doi:10.1029/2003jb002411
Neri, M., Acocella, V., and Behncke, B. (2004). The Role of the Pernicana Fault System in the Spreading of Mt. Etna (Italy) during the 2002–2003 Eruption. Bull. Volcanology 66 (5), 417–430. doi:10.1007/s00445-003-0322-x
Neri, M., Rivalta, E., Maccaferri, F., Acocella, V., and Cirrincione, R. (2018). Etnean and Hyblean Volcanism Shifted Away from the Malta Escarpment by Crustal Stresses. Earth Planet. Sci. Lett. 486, 15–22. doi:10.1016/j.epsl.2018.01.006
Palano, M. (2016). Episodic Slow Slip Events and Seaward Flank Motion at Mt. Etna Volcano (Italy). J. Volcanology Geothermal Res. 324, 8–14. doi:10.1016/j.jvolgeores.2016.05.010
Paris, R. (2015). Source Mechanisms of Volcanic Tsunamis. Philosophical Transactions of the Royal Society A: Mathematical. Phys. Eng. Sci. 373 (2053), 20140380. doi:10.1098/rsta.2014.0380
Patanè, D., De Gori, P., Chiarabba, C., and Bonaccorso, A. (2003). Magma Ascent and the Pressurization of Mount Etna's Volcanic System. Science 299, 2061–2063. doi:10.1126/science.1080653
Petersen, F., Kopp, H., Lange, D., Hannemann, K., and Urlaub, M. (2019). Measuring Tectonic Seafloor Deformation and Strain-Build up with Acoustic Direct-Path Ranging. J. Geodynamics 124, 14–24. doi:10.1016/j.jog.2019.01.002
Phillips, K. A., Chadwell, C. D., and Hildebrand, J. A. (2008). Vertical Deformation Measurements on the Submerged South Flank of Kīlauea Volcano, Hawai'i Reveal Seafloor Motion Associated with Volcanic Collapse. J. Geophys. Res. 113. doi:10.1029/2007jb005124
Poland, M., Peltier, A., Bonforte, A., and Puglisi, G. (2017). The spectrum of persistent volcanic flank instability; A review and proposed framework based on Kilauea, Piton de la Fournaise and Etna. J. Volcanol. Geother. Res. 339, 63–80. doi:10.1016/j.jvolgeores.2017.05.004
Pope, E. L., Jutzeler, M., Cartigny, M. J., Shreeve, J., Talling, P. J., Wright, I. C., et al. (2018). Origin of Spectacular fields of Submarine Sediment Waves Around Volcanic Islands. Earth Planet. Sci. Lett. 493, 12–24. doi:10.1016/j.epsl.2018.04.020
Ramalho, R. S., Winckler, G., Madeira, J., Helffrich, G. R., Hipólito, A., and Quartau, R. (2015). Hazard Potential of Volcanic Flank Collapses Raised by New Megatsunami Evidence. Sci. Adv. 1 (9), e1500456. doi:10.1126/sciadv.1500456
Ryan, W. B. F., CarbotteMelkonian, S. M. A., Arko, R., Weissel, R. A., Ferrini, V., Goodwillie, A., et al. (2009). Global Multi-Resolution Topography (GMRT) Synthesis Data Set. Geochem. Geophys. Geosyst 10, Q03014. doi:10.1029/2008GC002332
Schulze, I. (2017). Continental Margin Deformation Offshore Mt Etna and Potential Landslide Risk. Kiel, Germany: Christian-Albrechts-Universität zu Kiel. Msc Thesis.
Solaro, G., Acocella, V., Pepe, S., Ruch, J., Neri, M., and Sansosti, E. (2010). Anatomy of an Unstable Volcano from InSAR: Multiple Processes Affecting Flank Instability at Mt. Etna, 1994–2008. J. Geophys. Res. Solid Earth 115. doi:10.1029/2009jb000820
Urlaub, M., Bonforte, A., Kurbjuhn, T., Steinführer, A., and Wenzlaff, E. (2020). Monitoring and Mapping Active Deformation Offshore Etna, Cruise No. AL532, 29.01.2020 – 02.02.2020 Catania (Italy) – Catania (Italy), MAPACT-ETNA. Alkor-Berichte, AL532 27. GEOMAR Helmholtz-Zentrum für Ozeanforschung Kiel, Kiel, Germany. doi:10.3289/CR_AL532
Urlaub, M., Petersen, F., Gross, F., Bonforte, A., Puglisi, G., Guglielmino, F., et al. (2018). Gravitational Collapse of Mount Etna's southeastern Flank. Sci. Adv. 4, eaat9700. doi:10.1126/sciadv.aat9700
Ventura, B. M., Serpelloni, E., Argnani, A., Bonforte, A., Bürgmann, R., and Anzidei, M. (2014). Fast Geodetic Strain-Rates in Eastern Sicily (Southern Italy): New Insights into Block Tectonics and Seismic Potential in the Area of the Great 1693 Earthquake. Earth Planet. Sci. Lett. 404, 77–88. doi:10.1016/j.epsl.2014.07.025
Walter, T. R., Haghighi, M. H., Schneider, F. M., Coppola, D., Motagh, M., and Saul, J. (2019). Complex hazard cascade Culminating in the Anak Krakatau Sector Collapse. Nat. Commun. 10 (1), 1–11. doi:10.1038/s41467-019-12284-5
Keywords: volcano-tectonic structure, flank instability, flank collapse, onshore-offshore, reflection seismic, bathymetry, seafloor geodesy, strike slip fault
Citation: Urlaub M, Geersen J, Petersen F, Gross F, Bonforte A, Krastel S and Kopp H (2022) The Submarine Boundaries of Mount Etna’s Unstable Southeastern Flank. Front. Earth Sci. 10:810790. doi: 10.3389/feart.2022.810790
Received: 07 November 2021; Accepted: 04 February 2022;
Published: 03 March 2022.
Edited by:
Luis E. Lara, Servicio Nacional de Geología y Minería de Chile (SERNAGEOMIN), ChileReviewed by:
Paraskevi Nomikou, National and Kapodistrian University of Athens, GreeceRaffaello Cioni, University of Florence, Italy
Copyright © 2022 Urlaub, Geersen, Petersen, Gross, Bonforte, Krastel and Kopp. This is an open-access article distributed under the terms of the Creative Commons Attribution License (CC BY). The use, distribution or reproduction in other forums is permitted, provided the original author(s) and the copyright owner(s) are credited and that the original publication in this journal is cited, in accordance with accepted academic practice. No use, distribution or reproduction is permitted which does not comply with these terms.
*Correspondence: Morelia Urlaub, bXVybGF1YkBnZW9tYXIuZGU=