 Leyi Li1,2
 Hong Chang1,3*
 Josep M. Pares4
 Balázs Bradák5
 Zeke Zhang1
 Xiaoke Qiang1,3
 Chong Guan1,6Chunyan Quan1
- 1State Key Laboratory of Loess and Quaternary Geology, Institute of Earth Environment, Chinese Academy of Sciences, Xi’an, China
- 2Xi’an Institute for Innovative Earth Environment Research, Xi’an, China
- 3CAS Center for Excellence in Quaternary Science and Global Change, Xi’an, China
- 4Geochronology, CENIEH, Burgos, Spain
- 5Graduate School of Maritime Sciences, Kobe University, Kobe, Japan
- 6Xi’an Center of Geological Survey (Northwest China Center of Geoscience), China Geological Survey, Xi’an, China
The timing and intensity of deformation of the Tanggula Range and Tuotuohe Basin are in debatable but strengthening the research on them is necessary for better understanding the geodynamic models of the Tibet and the tectonic-climate connections during the Cenozoic. Here we present the anisotropy of magnetic susceptibility (AMS) records from the foreland Tuotuohe Basin to understand the tectonic uplift history of the Tanggula Range for the interval of ∼37–19.7 Ma. Rock magnetic analyses indicate that the main magnetic carrier is paramagnetic and the minor is hematite. Thus, the AMS in the Tuotuohe Section (TS) can be used to track the tectonic strain related to tectonic processes. The distribution direction of the maximum principle susceptibility (Kmax) is approximately NW–SE, which intersects at about 10°with the strike of the strata and is nearly parallel to the Tanggula thrust fault system, whereas the minimum principle susceptibility (Kmin) is oriented in the NE–SW direction with a girdle distribution. This is consistent with the sedimentary fabric imprinted by the NE–SW shortening direction, representing the earliest deformation stage. AMS data in the TS can be divided into two phases at 30 Ma. From ∼37 to 30 Ma, the AMS parameters indicate an active tectonic strain and the Tanggula Range uplift induced by the India–Asia convergence, whereas between 30 and 19.7 Ma, the strain is weak compared with the earlier phase. Finally, the weak strain environment between 30 and 19.7 Ma indicated by the AMS indexes of the TS and the paleoelevation evidence from the Tuotuohe Basin all together suggest that an additional 1000–2000 m of surface uplift of the basin may have begun after 19.7 Ma.
Introduction
The India–Asia collision led to the formation of the Tibetan Plateau (Molnar and Tapponnier, 1975; Yin and Harrison, 2000). Due to its vast area and high mean elevation (∼5000 m), its tectonic uplift significantly affects not only the Asian but also the global climate through the permanent high pressure airmasses forming over the plateau and the influence of mountain range on precipitation in the region (Manabe and Terpstra, 1974; Raymo and Ruddiman, 1992; Molnar et al., 1993; An et al., 2001). Despite being in the focus of intense research, the tectonic uplift history of the Tibetan Plateau and strain variation is still intensely debated due to the reasons such as difficult strata age constraints and limitations of the paleoaltimetries (e.g., Fang et al., 2020; Spicer et al., 2021). Although many studies have been conducted in the basins distributed in and around Tibet (Huang et al., 2006; Dupont-Nivet et al., 2007; Lu et al., 2014; Chang et al., 2015; Tang et al., 2015; Fang et al., 2019), still there are some poorly investigated continuous section, which could suggest nearly consecutive basin-mountain evolution history of the basin, in the central northern part of the Tibetan Plateau, mainly due to difficulties such as the harsh conditions, cold temperature and inconvenient traffic. Especially, the timing and intensity of deformation of the Tanggula Range and Tuotuohe Basin are in debatable (e.g., Wang et al., 2008; Staisch et al., 2014). For the Tanggula Range, the most negative leaf wax hydrogen isotope value suggests an approximately 4 km paleoelevation during the late Eocene (Lin et al., 2020), while “Proto-Tibetan Plateau” model indicates that it has uplifted to present elevation since 40 Ma (Wang et al., 2008, 2014). For the Tuotuohe Basin, there is an additional ˜ 1000 m tectonic uplift during Miocene suggested by paleoelevation and balanced cross-section evidence (Sun et al., 2015; Staisch et al., 2016). Mantle lithosphere removal was invoked to explain this uplift activity (England and Houseman, 1989; Staisch et al., 2016) and there is still debate for the starting work time of this mechanism (e.g., Staisch et al., 2016; Lu et al., 2018). It is meaningful and necessary to strengthen the research on the central northern part of the Tibetan Plateau, specifically the Tuotuohe Basin, for better understanding its tectonic uplift history during the Cenozoic.
Anisotropy of magnetic susceptibility (AMS) is a common geophysical method to study numerous dynamic processes and quantify strain since its application by Graham (1954) due to its rapid, nondestructive nature and sensitivity. The AMS arises from the preferred orientation of anisotropic magnetic minerals and it mainly reflects the preferred orientation of crystallographic lattices and shape of the magnetic minerals (Rochette et al., 1992; Hus, 2003). This method has been applied to determine various processes since the pioneer note by Graham (1954), such as, the direction of eolian sediments (Lagroix and Banerjee, 2002, 2004; Zhang et al., 2010; Ge et al., 2014), retrieve the strain imprint in deformed sedimentary rocks (Borradaile and Henry, 1997; Pares and vander pluijm., 2002; Pares and vander pluijm., 2003; Pares and vander pluijm., 2014), and track the uplift history of some mountain range and upper crustal shortening processes (Charreau et al., 2005, 2006, 2009; Huang et al., 2006, 2010; Tang et al., 2012, 2015; Lu et al., 2014; Qiao et al., 2016; Li S. et al., 2020). In addition to these applications, AMS parameters could also preserve information about paleoenvironmental changes and have been used as a paleoclimatic proxy (e.g., Bradák et al., 2020; and the references therein). AMS method is also proven as an effective and sensitive technique revealing tectonic stress evolution during sedimentation and changes therein in active orogenesis, even in weakly deformed clastic sedimentary rocks (e.g., Li S. et al., 2020).
In this study, we focus on the Tuotuohe Basin. Herein, we apply AMS as an independent method to construct the tectonic strain variations of the Tanggula Range based on the late Eocene to early Miocene basin deposits of the Tuotuohe Section (TS) and combine other geological evidence to further discuss the dynamic system/mechanism transition time.
Geological Setting
The Tibetan Plateau comprises several orogenic systems and terranes from the south to the north: the Himalayan Orogen, Lhasa, Qiangtang, Songpan–Ganzi, and Kunlun–Qaidam–Qilian terranes (Figure 1A). The Tuotuohe Basin is located in the northeastern part of the Qiangtang terrane. It is a sub-basin of the Hoh Xil Basin. To the north of the Tuotuohe Basin (study site indicated by green star) lies the eastern Kunlun Range and to the south lies the Tanggula Range. This basin covers an area of 13,000 km2, and its average elevation is 4500 m. It is one of the largest Cenozoic basins in the hinterland of the Tibetan Plateau. It is a foreland basin of the Tanggula thrust fault system (Li et al., 2012). The thick Cenozoic deposits in this basin record not only the intracontinental deformation and uplift history but also the paleoclimate change information. Research on this basin is valuable to decipher the tectonic evolution of the Tanggula Range.
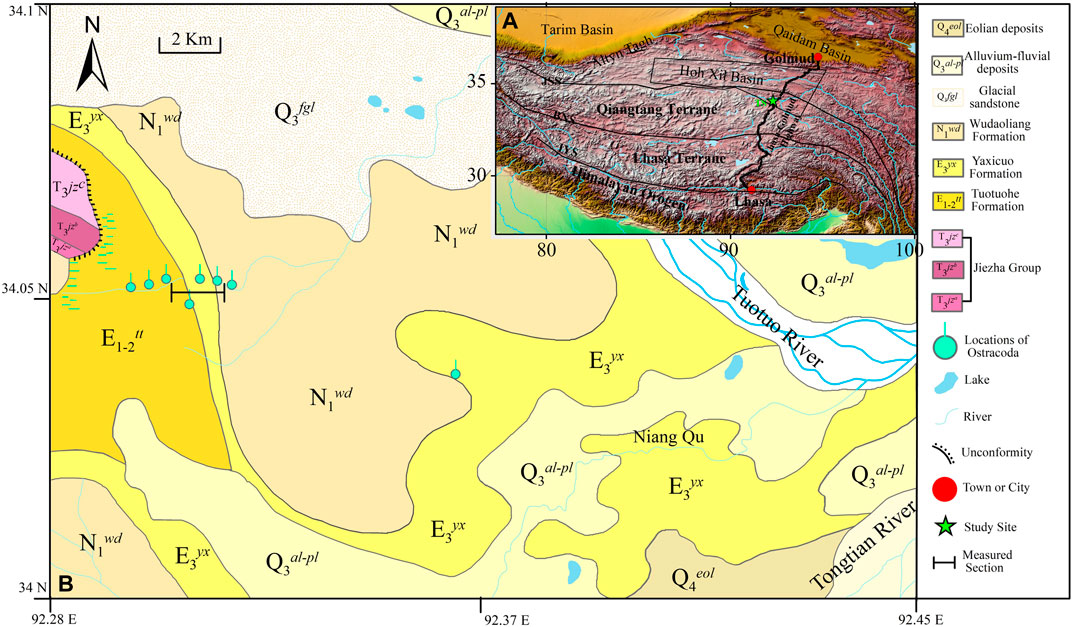
FIGURE 1. (A) Topographic map of the Tibetan Plateau showing sutures, major terranes and orogen, the Lhasa–Golmud Highway, Hoh Xil Basin, and the study site; (B) Geological map of the Tuotuohe Basin based on regional geological mapping (QBGMR, 1989). Abbreviations: IYS, Indus–Yalong suture; BNS, Bangonghu–Nujiang suture; JSS, Jinshajiang suture; T3jz, late Triassic Jiezha Group; E1-2tt, Paleocene-Eocene Tuotuohe Formation; E3yx, Oligocene Yaxicuo Formation; N1wd, Miocene Wudaoliang Formation; Q3fgl, late Pleistocene glacial sandstone; Q3al-pl, late Pleistocene alluvium-fluvial deposits; Q4eol, Holocene eolian deposits.
The TS is located ∼20 km to the southeast of Tanggula Town, where the Lhasa–Golmud highway crosses the Tuotuo River. At the TS, 1176 m of its strata are exposed and can be divided into three units according to its physical properties, lithology, sedimentary structure, contact relationships, and comparisons with regional stratigraphy (Figure 1B). The lowermost unit is the Tuotuohe Formation (TTH Fm.)—a fluvial succession dominated by brownish-red–grayish-green sandstone with pebbly sandstone and characterized by large-scale cross bedding, normal-graded bedding, stratified structures, and ripple marks. The overlying Yaxicuo Formation (YXC Fm.) is dominated by the lacustrine and fluvial deltaic facies. It is primarily composed of interbedded brownish-red sandstone and brownish-red–gray mudstone, with interspersed stratified gray argillaceous limestone having climbing-ripple cross laminations. The lacustrine Wudaoliang Formation (WDL Fm.) is the youngest unit and is dominated by light-gray and pale-blue mudstone, marlstone, argillaceous limestone, and calcareous mudstone, with interbedded gypsum layers. Contacts between these units (TTH Fm., YXC Fm., and WDL Fm.) are conformable in the TS, suggesting relatively continuous deposition from the TTH Fm. through the WDL Fm., although the exact ages represented by these units are not well constrained (Figure 2). Here the conformable relationship between the YXC and WDL Fms. in the TS is consistent with the Tongtianhe Section of the southern Tuotuohe Basin (Wang et al., 2008). In the TS, the lower TTH Fm. is obscured by cover and the measured WDL Fm. terminates near the core of a syncline where the youngest WDL Fm. strata are exposed.
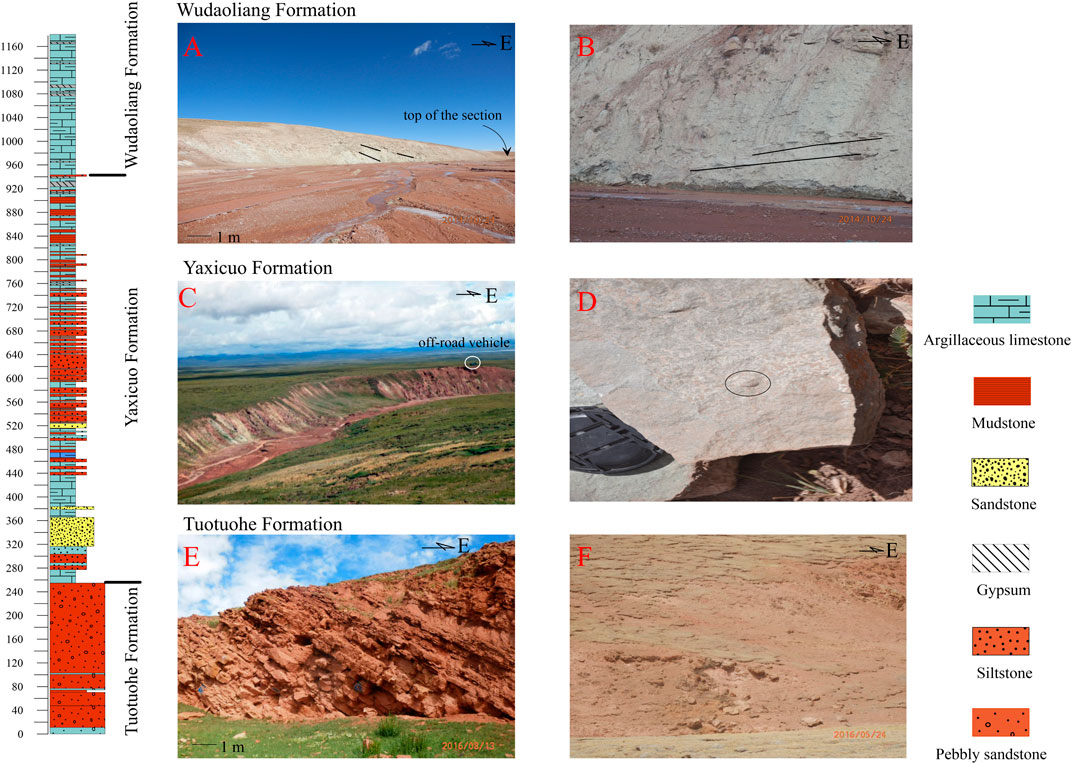
FIGURE 2. Lithologies and representative photographs in the Tuotuohe Section (TS). (A) Wudaoliang Formation (WDL Fm.) Black lines show the direction of dip to the SE. (B) WDL Fm. to the east of the measured section, dipping SW. (C) Yaxicuo Formation (YXC Fm.) of mainly alternating fluvial and lacustrine facies. (D) Fossils found in the YXC Fm. include gastropods and charophytes indicating age of Oligocene. (E) Fluvial sandstones of the Tuotuohe Formation (TTH Fm.). (F) The base of our section lies in the TTH Fm.
Chronology of the TS is constrained by biostratigraphy (charophytes, pollen, and ostracods), the youngest detrital zircon ages, and high-resolution magnetostratigraphy (Li et al., under review)1. Recent studies have refined the ages of the TTH Fm. (∼37–33 Ma), YXC Fm. (33–23.6 Ma), and WDL Fm. (23.6–19.7 Ma) (Li et al., under review).
Materials and Methods
To acquire fresh samples, we removed the surface-covering layer until the original rocks were exposed. The average sampling interval was 1 m. Between 160 and 450 m, the average sampling interval was approximately 4 m due to the strata was covered by thick grassland vegetation. In total, 946 block samples were collected. These samples were then taken to the laboratory and fashioned into cubic specimens of 2 cm3 for paleomagnetic and AMS measurements.
Various rock magnetic experiments were used on pilot rock samples to determine their magnetic mineral composition. The low-temperature magnetic measurements were performed using a Quantum Design, Inc. superconducting quantum interference device magnetic properties measurement system (Quantum Design, USA). Low-temperature susceptibility was measured from 1 to 300 K. High-temperature-dependent magnetic susceptibility was measured from room temperature up to 700°C, and then back to room temperature (heating and cooling rate of ∼6.5°C/min), using an MFK1-FA Kappabridge operated at a frequency of 976 Hz, equipped with a CS-3 high-temperature furnace. The measurements were conducted in an argon atmosphere (flow rate ∼50 ml/min). Isothermal remanent magnetization (IRM) acquisitions were obtained using an ASC IM-10-30 pulse magnetizer (ASC Scientific, USA) with stepwise increasing fields and then stepwise-applied backfields. The highest applied normal field was 2.5 T, and the backfield was 300 mT. Totally 36 magnetic steps were applied. The remanence measurements were conducted using an JR-6A spinner magnetometer (AGICO, Czech) in a magnetic shielded room (residual field <300 nT). Decomposition of IRM acquisition curves method were used to further identify the relative content contribution of magnetite and hematite in the sediments (Kruiver et al., 2001).
The domain size of magnetic components in the studied pilot samples were estimated by the use of hysteresis loops measured by vibrating sample magnetometer (Princeton Measurements, MicroMag 3900) at room temperature with the maximum applied magnetic field of 1.5 T.
Mineral analysis was elaborated by a ZEISS EVO 18 Scanning Electron Microscope (SEM) with Energy Dispersive Spectroscopy (EDS) controlled by an Advanced Mineral Identification and Characterization System (AMICS). The AMICS is the analysis system for automated identification and quantification of minerals, which is based on a comprehensive database of more than 2000 minerals.
AMS of all the samples were measured using an MFK1-FA Kappabridge (AGICO, Czech) with an automated handling system before thermal demagnetization, operating at 300 A/m at a frequency of 875 Hz. Each sample was rotated through three orthogonal directions, and the results were calculated following the definitions of Tarling and Hrouda (1993). The AMS parameters are the principal directions (maximum—kmax, intermediate—kint, and minimum—kmin) of the ellipsoid tensor, including the bulk magnetic susceptibility (km), corrected anisotropy degree (P′) (Jelinek, 1981), shape parameter (T) (Jelinek, 1981), magnetic lineation (L) (Khan, 1962), and flatness (E) (Hrouda, 1982). The parameter E represents the intensity of the development of magnetic foliation with respect to that of magnetic lineation (Hrouda, 1982). All the experiments were conducted at the Institute of Earth Environment, Chinese Academy of Sciences.
Results
Magnetic Mineralogy
High-temperature-dependent magnetic susceptibility is a useful parameter for determining the magnetic mineral composition (Liu et al., 2003). The heating curves of pilot samples showed that a characteristic peak at about 550°C (C71, B242, B303, A120, A305) (Figure 3). This behavior can be interpreted as the result of the new formation of some higher susceptibility minerals, such as magnetite, reduced from low susceptibility hematite in an oxygen-free environment (Oches and Banerjee, 1996) and/or the Hopkinson peak, related to the wide grain size distribution of fine particles (Muxworthy et al., 2002). A common characteristic in all heating curves is a drop of the susceptibility at ∼580°C and a decrease to zero at ∼680°C, suggesting the existence of magnetite and hematite, respectively. Because the susceptibility of hematite is about two orders of magnitude lower than magnetite, thus the dramatic decline of the susceptibility of heating curves at ∼680°C may indicate the presence of relatively abundant hematite. In addition, the cooling curves are much higher than the heating curves (irreversible heating-cooling cycle) with a susceptibility increasing significantly between temperature 600–480°C. This phenomenon is attributed to the transformation of iron containing silicates, clays or other Fe-bearing paramagnetic minerals (Hunt et al., 1995; Deng et al., 2001).
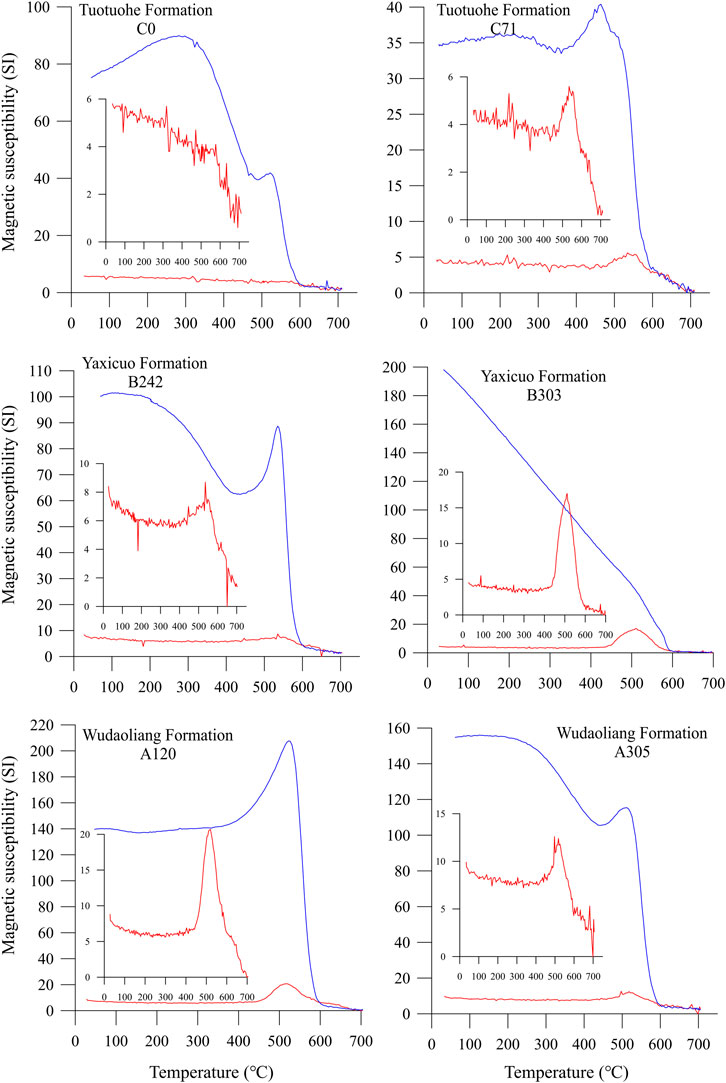
FIGURE 3. Temperature-dependent susceptibility curves of typical samples from the Tuotuohe Section (TS). Heating and cooling cycles are indicated with red and blue lines, respectively.
The TS samples that were subjected to low temperature thermal treatments did not exhibit well-defined Morin transitions at approximately 250 K (−23.15°C), although there were some inflection points identified (Figures 4A–D). However, two samples exhibited Verwey transitions at approximately 120 K (−153.15°C) (Figures 4C,D). Combing the low susceptibility of the samples and the unrevealed Morin transition, indicated the possible mainly contribution of paramagnetic minerals and magnetite.
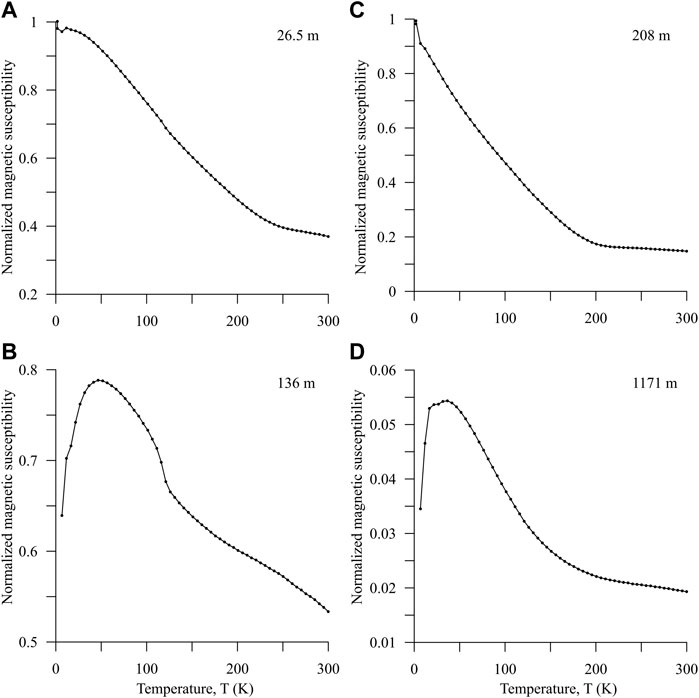
FIGURE 4. Low-temperature variations of the magnetic susceptibility of typical samples from the Tuotuohe Section (TS).
All the IRM acquisition curves of representative samples did not fully saturate until the applied field reached 2–2.5 T, which indicates the existence of a high-coercivity component, such as hematite (Figure 5). To assess this interpretation, IRM acquisition curves were unmixed following (Kruiver et al., 2001). The IRM component analyses identified the following two components in all the samples (Figure 5): a low-coercivity and high-coercivity component. For the former, the B1/2 (the field at which half of the saturation IRM is reached) of the samples was between 61 and 157 mT, which could be maghemite, fine-grained, c.a., <1 um hematite, or magnetite (O´reilly, 1984). For the high-coercivity component, the B1/2 of the samples was between ∼439 and 548 mT, which is consistent with the magnetic properties of hematite (O´reilly, 1984). In the TS, the proportion of the high-coercivity component, such as hematite, is relevantly higher. However, care must be taken defining hematite as the dominant magnetic mineral based on the relevant proportion. Based on the study of Frank and Nowaczyk (2008), the influence of hematite on the magnetic parameters of a magnetic mineral mixture can be widely ignored below 90–95 wt% hematite content especially when magnetite is present.
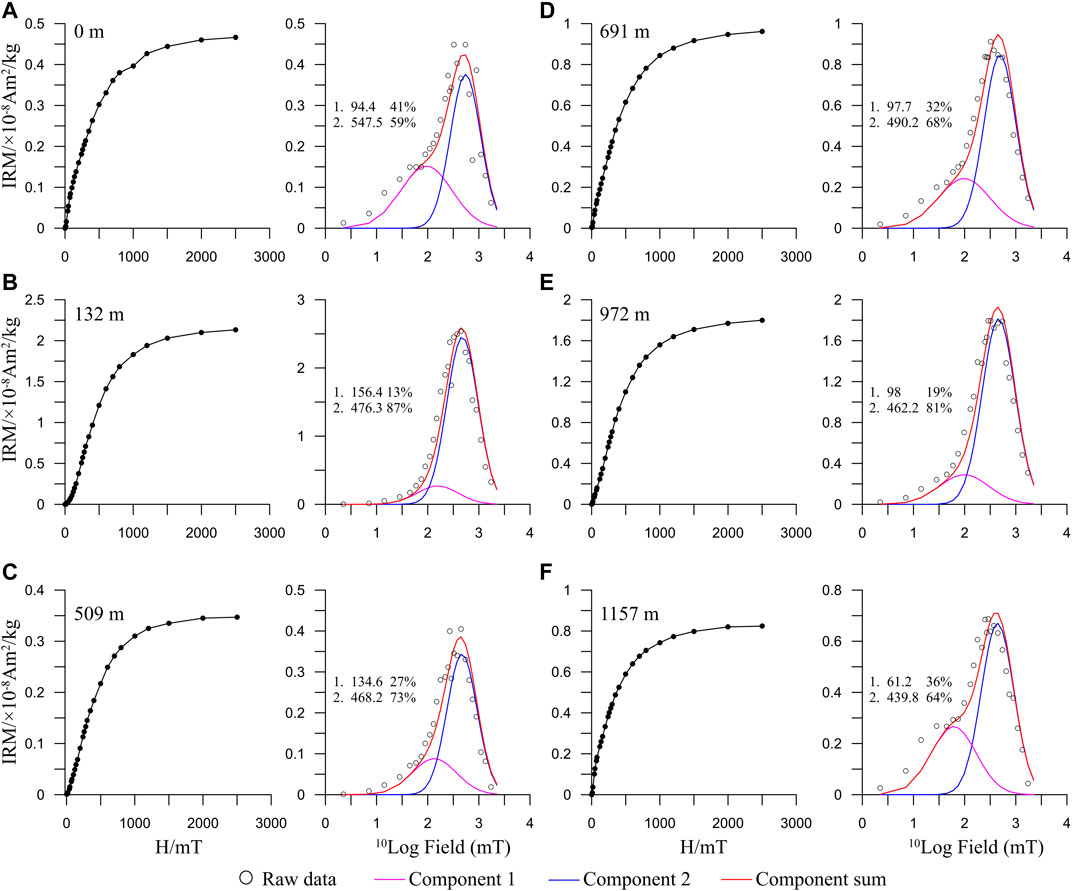
FIGURE 5. Isothermal remanent magnetization (IRM) acquisition curves (left) and their corresponding component analyses (right) for representative samples from the Tuotuohe Section (TS). In component analysis figures, the numbers 1 and 2 represent components 1 (low coercivity) and 2 (high coercivity), respectively. Subsequent numbers represent B1/2 (the field at which half of the saturation IRM is reached) and relative contributions to saturation IRM. in turn.
Hysteresis loops are also used to determine the magnetic mineralogy (Figures 6A–F). The magnetization of all the samples display a decreasing characteristics after paramagnetic correction, suggesting the existence of abundant paramagnetic and/or clay minerals. For the samples C119, C228 and B336 (Figures 6A–C), the hysteresis loops are generally wasp-waisted and remain saturated within a 1–1.5-T field, indicating combinations of magnetic minerals with low and high coercivities, for example, magnetite and abundant hematite (Roberts et al., 1995). For sample A0 (Figure 6D), the hysteresis loops closed above ∼450 mT, indicating the contribution of soft magnetic components, such as magnetite and the contribution from high coercivity minerals, such as hematite (Roberts et al., 1995). For samples A180 and A237 (Figures 6E,F), the curves of magnetization are closed at ∼100 mT and change linearly with field, indicating the paramagnetic may the mainly contribution to the susceptibility (Bean, 1955; Roberts et al., 2019). In addition, in order to obtain an approximate percentage of the paramagnetic contribution to the bulk magnetic susceptibility, the paramagnetic susceptibility was calculated from the slope of the hysteresis loops between 0.7 and 1.0 T (Richter and van der Pluijm, 1994). The results indicate that the paramagnetic components constitute a significant proportion of the magnetic susceptibility, the corresponded proportion values are as following: 64% for C119, 75% for C228, 66% for B336, 43% for A0, 88% for A180, 87% for A137.
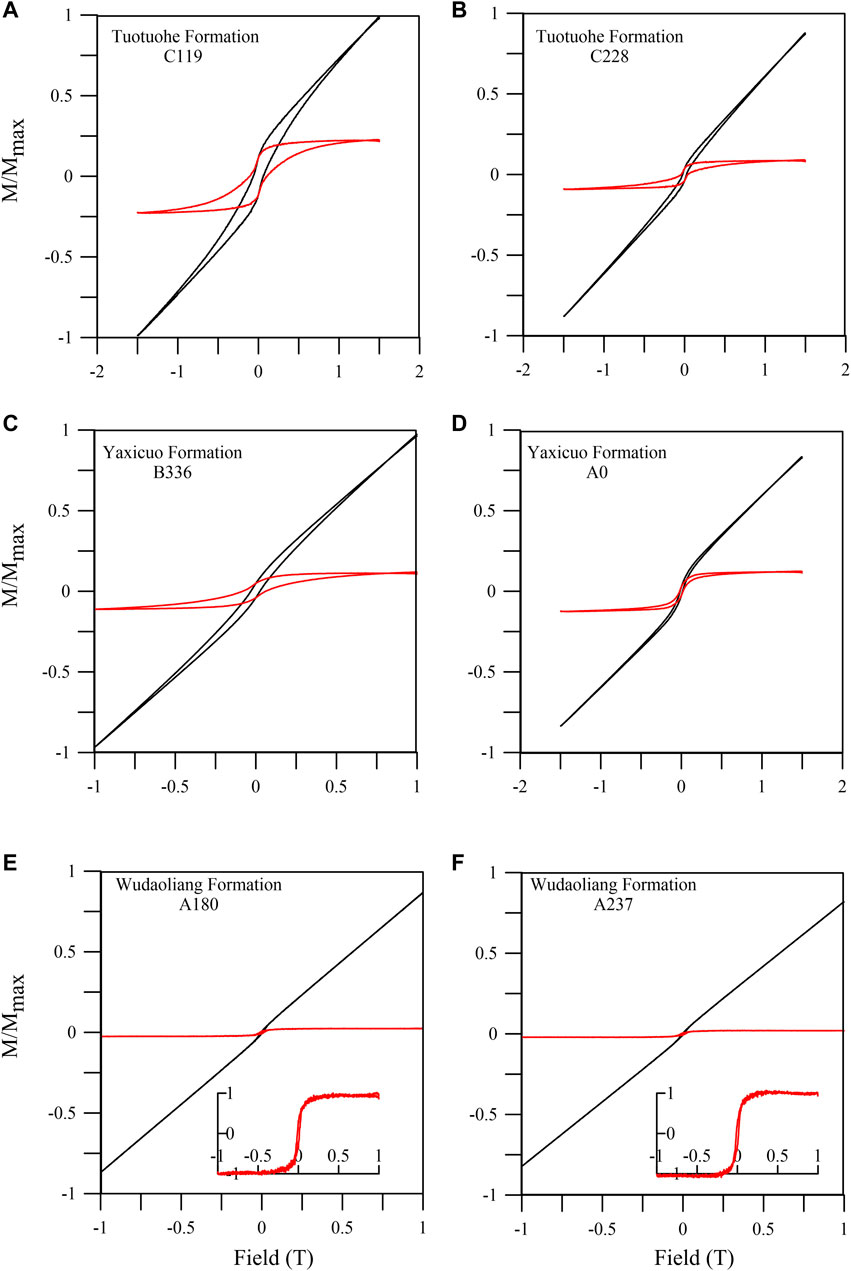
FIGURE 6. Magnetic hysteresis loops of the samples from the Tuotuohe, Yaxicuo, and Wudaoliang Formations. The black and red loops of each sample are the original and paramagnetic corrected loops, respectively. The loops at the lower-right corner in figs. (E) and (F) are for better illustration of paramagnetic slope-corrected loops.
Mineral analysis suggests that the TS sample is mainly composed of quartz (weight percentage is 56.85%), calcite (13.32%), orthoclase (10.61%), and illite (11.17%). Hematite is the minor component, contributing with 0.21 w%.
Combining all the rock magnetic and mineral analysis experiments, we conclude that paramagnetic minerals may control the magnetic properties of these samples in the TS and the experiments indicate the appearance of magnetite and hematite as well.
Anisotropy of Magnetic Susceptibility
In AMS, Parameters F12, F23 are used to evaluate the statistical significance of the lineation and foliation. F12 describes the strength of the anisotropy testing in the plane containing the kmax and kint axes and F23 is used in regard to the plane kint-kmin as it is described in details by Jelínek (1981). The formulas for them were described by Jelínek, 1981. Generally, values > 4 indicate statistically significant anisotropies (Zhu et al., 2004). E12 indicates the angular uncertainty in the direction of maximum principal axis within the magnetic foliation plane and the measurement with E12 < 22.5° is considered to satisfy the statistically significant level (Lagroix and Banerjee, 2004; Zhu et al., 2004). All these parameters are included in the experimental results. To eliminate the directions based on statistically insignificant anisotropy, 400 samples were rejected based on their F12 < 4 and E12 > 22.5° parameters.
Equal-area stereographic projections of the AMS data before and after test are shown in Figure 7. Before bedding correction, the mean kmin axis of the entire population of specimens concentrates in the SW and the mean kmax axis is oriented approximately NW–SE. After tilt correction, the mean kmin axis has a slight NE–SW girdle distribution and is overall perpendicular to the bedding plane, indicated by the mean vector of the data. The kmax axis is in an approximately NW–SE direction and generally parallel to the fold axis that deformed the basin. In a Foliation and Lineation (F-L) diagram, 77% of the samples located in the oblate region. Additionally, the results of TTH Fm., YXC Fm. and WDL Fm. were shown by different symbols (Figure 7), 57% of the TTH Fm., 78% of the YXC Fm. and 87% of the WDL Fm. distributed in the oblate region. The shape and corrected anistropy (T-P′) diagram of the AMS ellipsoids is also generally located in the oblate region (75% of all the data). Similar with F-L diagram, from TTH Fm. to WDL Fm., the percentages distributed in the oblate are 55%, 76 and 86%, respectively.
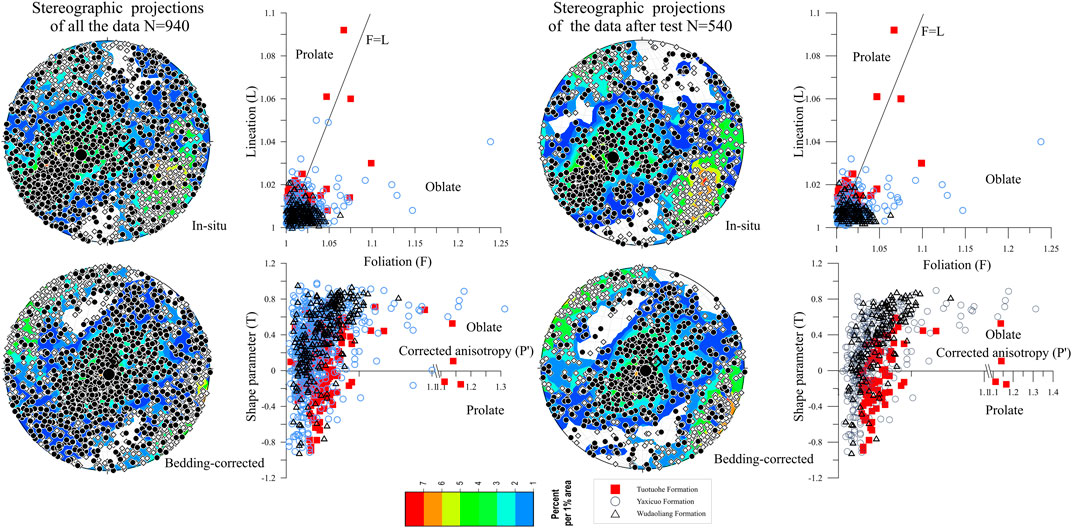
FIGURE 7. All the stereonet projections of the anisotropy of magnetic susceptibility principal axes from the Tuotuohe Section (TS) and also shown are the so-called Flinn (foliation vs. lineation) and Jelinek (P′ vs. T) diagrams. In stereonet projections, the hollow squares represent the kmax orientation, and the solid circles indicate the kmin orientations. In Flinn (foliation vs. lineation) and Jelinek (P′ vs. T) diagrams, the squares indicate the Tuotuohe Formation (TTH Fm.), the open circles represent Yaxicuo Formation (YXC Fm.), and the triangles represent Wudaoliang Formation (WDL Fm.).
The equal-area stereographic projections of the AMS data after test are also shown in Figure 7. Generally, characteristics of the main principal axies distribution were similar with the result before test. 72% of all the entire population of specimens distributed in the oblate region in F-L diagram and 41% of the TTH Fm. 73% of the YXC Fm. and 83% of the WDL Fm. located in the oblate area. In T-P′ diagram, oblate area is possessed by 69% of all the data and the oblate possession percentages are 39%, 70 and 82% for TTH Fm., YXC Fm. and WDL Fm., respectively.
The stereoplots, related to the various formations are shown separately to see the change characters of the main principal axis distribution of the AMS (Figure 8). In general, there were not big differences between the principal axis distribution in corresponded formations before and after the evaluation of the anisotropy of the samples (F-tests). From TTH Fm. to WDL Fm., there was an evident change of the principal axis distribution after removing the samples with statistically insignificant anisotropy. From TTH Fm. to YXC Fm., there was an evident clockwise rotation for the maximum principal axis, but from YXC Fm. to WDL Fm., the rotation was not obvious.
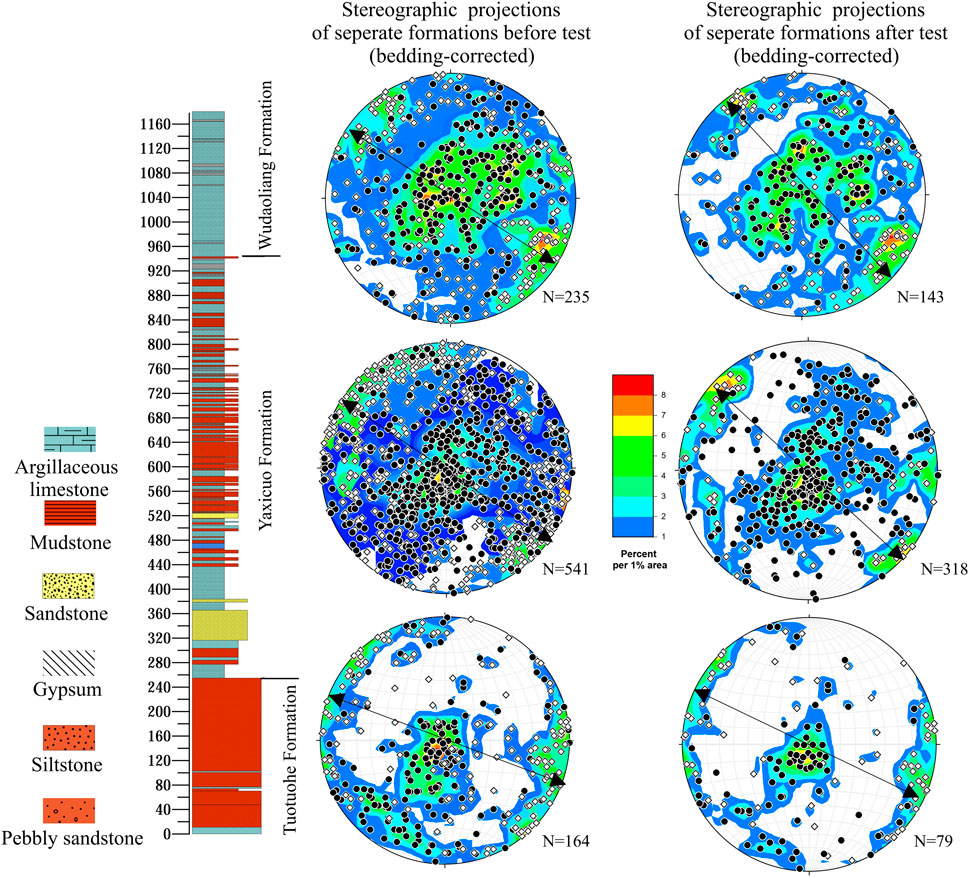
FIGURE 8. The stereonet projections of the anisotropy of magnetic susceptibility principal axes from the Tuotuohe Section (TS), seperates by formations. The left projections are for all the oroginal data before test while the right are for data after the test. The white squares suggest the maximum principal axis (kmax) and the black circles represent the minimum principal axis (kmin). The black arrows represent the distribute direction of the maximum principal axis (kmax).
These types of AMS characteristics are commonly found in foreland basins rather than in deposits strongly influenced by paleocurrent, indicating that the sedimentary fabric was overprinted by the weak tectonic strain (Huang et al., 2006; Lu et al., 2014; Tang et al.,, 2015; Li S. et al., 2020). But when the magnetic fabric characters of the TTH Fm. changed to YXC Fm. is difficult to constrain based on only roughly division by formation units. Thus, it is necessary to study the AMS parameters against depth or age of the section (Figure 9). The data of km, T, L, E, and P′ after test exhibit significant changes with stratigraphic height and could be divided into two distinct intervals (Figure 9).
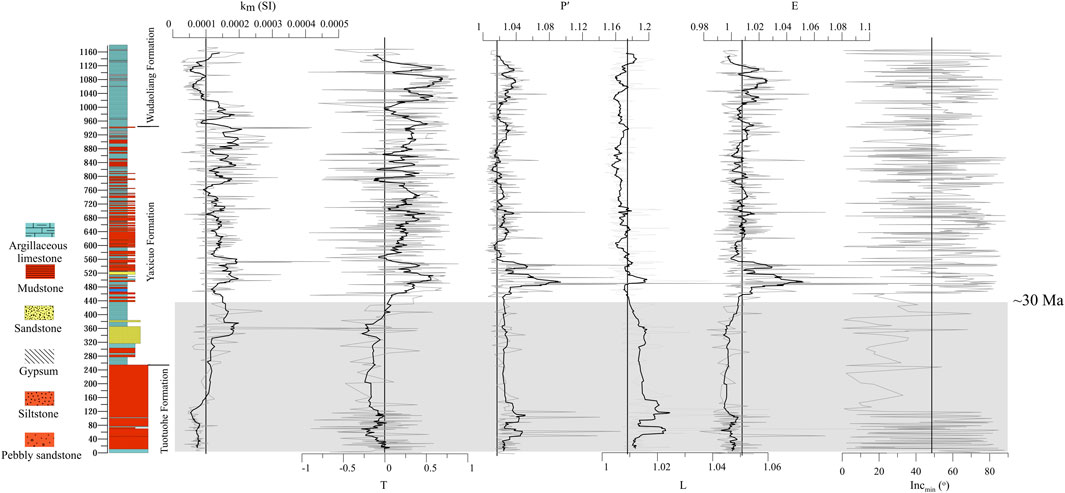
FIGURE 9. Anisotropy of magnetic susceptibility (AMS) parameters of the Tuotuohe Section (TS) as a function of depth. The solid black lines represent the average values. Please note that the black line in the shape parameter (T) diagram represents the boundary of prolate and oblate. The black curves are running average data with 11 window width.
The km (mean volumetric magnetic susceptibility) ranges from 2.46 × 10⁻⁵ to 7.39 × 10⁻⁴ SI, with an average of 1.24 × 10⁻⁴ SI. At 30 Ma, the bulk magnetic susceptibility decreases slightly from 1.63 × 10⁻⁴ to 1.17 × 10⁻⁴ SI and then remains at a relatively stable value up to 22.5 Ma (1020 m), followed by a gradually decreasing trend. The value of T ranges from −0.921 to 0.896, and its mean value is 0.187. The AMS fabrics and parameters exhibit a significant change at 30 Ma in the section. Before 30 Ma, the mean T value is −0.104. However, from 30 to 19.7 Ma, the mean T value is 0.259. The ellipsoid is prolate (∼37–30 Ma) compared with the upper part of section (30–19.7 Ma). The parameter E also changes at 30 Ma. Below 30 Ma, the mean value of E is 0.999. Above 30 Ma, the mean value is approximately 1.01, indicating that the ellipsoid changes from prolate to oblate. The parameter L also evidently changes at 30 Ma: from 37 to 30 Ma, its mean value is 1.015, whereas its mean value is 1.007 between 30 and 19.7 Ma. The mean value of the P′ decreases from 1.0307 (∼37–30 Ma) to 1.026 (30–19.7 Ma) at ∼30 Ma and also the inclination of the minimum principal axis significantly deviates from the perpendicular to the bedding plane between ∼37 Ma and 30 Ma comparing with the inclination values of 30 Ma to 19.7 Ma.
Discussion
Source of Magnetic Susceptibility
The average value of the bulk magnetic susceptibility is 1.24 × 10⁻⁴, lower than 500 × 10–6, the bulk magnetic susceptibilities correspond to the values of paramagnetic minerals such as clay (Rochette, 1987; Tarling and Hrouda, 1993). The mean P′ value of the TS (1.024) is lower than the value for chlorite and muscovite, which is P′ = 1.15 (Martın-Hernández and Hirt, 2003) and far less than the value of goethite, hematite and magnetite, instead, closer to the P′ value of paramagnetic minerals (Rochette et al., 1992). In addition, the paramagnetic susceptibility calculated from the slope of the hysteresis loops between 0.7 and 1.0 T (Richter and van der Pluijm, 1994) indicate that the paramagnetic components constitute a significant proportion (>43%) of the magnetic susceptibility. In addition, the mean magnetic susceptibility of the TTH Fm., YXC Fm. and WDL Fm. are 7.44 × 10⁻⁵ SI, 14.5 × 10⁻⁵ SI and 10.3 × 10⁻⁵ SI, respectively, are far less than that of magnetite (×578 10–5 SI) (Tarling and Hrouda, 1993). These values already suggest that paramagnetic fractions mainly control AMS (Hrouda and Jelinek, 1990). As evidenced from the diagrams of km versus P′ and T (Figure 10), the relationships of P′ and T to km are relatively independent. The T does not correlate with the change in bulk magnetic susceptibility in the vertical direction (Figure 9) and is independent of lithology. These observations suggest that these three parameters are independent of the ferromagnetic concentrations in the TS and the AMS is controlled by the paramagnetic mineral fraction (e.g., silicates and clays) (Rochette et al., 1992; Hus, 2003; Li et al., 2014; Taylor and Lagroix, 2015). Taking the relatively low bulk magnetic susceptibility, degree of corrected anisotropy and the independent relationships together, the susceptibility and AMS parameters are mainly controlled by paramagnetic contributors.
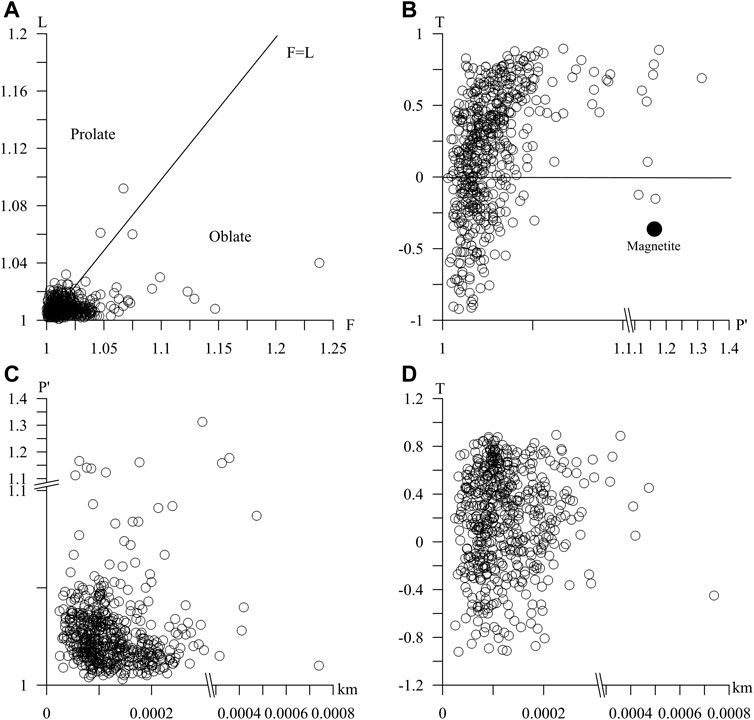
FIGURE 10. Analysis of the relationship between some basic magnetic fabric parameters. (A,B) Flinn (F–L) and Jelinek (P′–T) diagrams of all the samples, respectivelly (the AMS ellipsoid for magnetite: P′ = 1.18, T = −0.30, based on Tarling and Hrouda, 1993 is marked by an enlarged circle) and; (C,D) the relationships among bulk magnetic susceptibility (km), corrected anistropy (P′), and shape parameter (T) are also shown.
In addition, the elongated distributions of all the samples of the P′–T do not include or pass through the values of P′and T of the magnetite (Figure 10), indicating that the observed AMS parameters are not a direct function of the concentration of magnetite in the TS (Pares et al., 1999).
All the evidence indicates that the AMS of the TS is mainly dominated by the anisotropy of paramagnetic minerals (such as phyllosilicates and clay minerals), although magnetite and hematite minerals also make some contributions. In the future, we will try to do further experiments, such as anisotropy of anhysteretic-remanence-magnetization (AARM) to compare the bulk and ferro/antiferromagnetic fabric built by magnetite and hematite.
Generally, paramagnetic minerals represent a larger volume fraction than ferromagnetic minerals in rocks and therefore are likely to be influenced by the crystal plastic deformation of grains and physical rotation (Pares et al., 1999; Martin-Henandez and Ferre, 2007). During the progressive plastic and physical rotation, the sedimentary fabric is characterized by the kmin perpendicular to bedding and kmax lying within the bedding plane. With progressive deformation, the kmin remains perpendicular to bedding, but kmax roughly clusters parallel to the intersection of an incipient layer parallel shortening fabric with bedding (Weil and Yonkee, 2009). In the studied TS profiles, the corrected AMS result is congruent with the preliminary tectonic fabric. Thus, the AMS of TS measures the preferred orientation of the phyllosilicate grains, indicating the strain caused grain re-orientation by compaction and tectonic processes (Paterson et al., 1995; Pares et al., 1999). In this case, the structural interpretation is the following. The magnetic foliation (the principal axis of kmin) corresponds to the bedding plane while the lineation (the principal axis of kmax) corresponds to the zone axis of sheets, which can be assumed to be parallel to the flow direction, to the current direction in the sediments, to the intersection of pressure stress (Rochette, 1987).
Tectonic Implications Derived From AMS
AMS has the potential to capture early deformation of basins, making it possible to even detect subtle deformations (Pares and van der Pluijm, 2003; Pares and van der Pluijm, 2014). Many studies have applied AMS to retrieve tectonically overprinted fabrics in sedimentary rocks, particularly in the weakly deformed rocks (Huang et al., 2006; Charreau et al., 2005, 2006, 2009; Tang et al., 2012, 2015; Li S. et al., 2020).
The magnetic fabric and its AMS parameters is sensitive to weak deformation in both directions and magnitudes of strain ellipsoids (Graham, 1966; Pares et al., 1999; Pares, 2015). In an undeformed stage, the primary fabric is essentially indicating sedimentary processes and influenced by compaction. In most cases, it is characterized by the kmin axis perpendicular to the bedding, the kmax axis distributed around the plane and the AMS ellipsoid is oblate. While imprinting by a layer parallel shortening on the sedimentary fabric, the kmin axis shows a girdle and is parallel to the shortening direction, whereas the kmax axis is perpendicular to the shortening direction and parallel to the tensile direction (Pares et al., 1999). When the strain increases further, the kmin axis is parallel to the strain direction and maintains a small elongation in the direction of the compression, whereas the kmax axis remains perpendicular to the shortening direction. At this point, the AMS ellipsoid changes from oblate to prolate. With further increasing strain, the kmin axis distributes around the plane and the kmax axis clusters to the bedding pole (Pares et al., 1999).
In the TS, the distributed direction of the Kmax is approximately in the NW–SE direction, which is parallel to the strike (the strike is ∼140°) of the strata and the Tanggula thrust fault (the strike is ∼150°) described in Li et al. (2012). The Kmin is oriented in the NE–SW direction with a girdle distribution (Figure 7). This is consistent with the sedimentary fabric imprinted by the NE–SW shortening direction, representing the earliest deformation stage, and this is also supported by the mean value of P′ in TS, which is 1.024 (Figure 9). (Pares, 2004). However, sedimentary compaction and transport dynamics could also overprint the original sedimentary magnetic fabric (Tang et al., 2015). Sedimentary compaction will generally lead to a more oblate fabric, with the parameter T showing an increasing trend as a function of depth, which characteristic was not found in the case of TS data (Figure 9). Sediment transport will result in the mean kmax being parallel to the transport direction and the mean kmin being nearly perpendicular to the bedding. In the Tuotuohe Basin, the paleocurrent directions of the TTH and YXC Fms. are toward the north and northeast (Liu et al., 2003; Wang et al., 2008; Li et al., 2012) and contradicting the mean kmax direction. The NW–SE kmax direction of the overall section in the TS parallels to the Tanggula thrust fault (Figure 7), suggesting the overprinting of tectonic fabrics on the original sedimentary fabrics instead of the paleocurrent.
Above rock magnetic experiments collectively show that the paramagnetic minerals, such as phyllosilicates and clay minerals, are the main contributors to the AMS of TS and thus the AMS measures the preferred orientation of the phyllosilicate grains, indicating the strain caused grain re-orientation by compaction and tectonic processes (e.g., physical alignment) though some local contribution of magnetite could not be ruled out (Paterson et al., 1995; Pares et al., 1999). This direct relationship between AMS and tectonic strain have been established for weakly deformed fine grained sediments from several areas in the world, such as the Pyrenees, Italian peninsula, Appalachians (Grahams, 1966; Oertel, 1983; Mattei et al., 1997), also supported by a summary of quantitative measurements of the preferred orientation of phyllosilicates grains in a variety of tectonically weakly deformed to undeformed rocks (Paterson et al., 1995), and also supported by the relationship that the magnetic lineation closely follows the fold axis of Tanggula Range in our section.
Thus, AMS offers a proxy for the preferred orientations of grains and could be used to track the tectonic strain variation (Hrouda, 1982). To trace the strain change indicated by the AMS parameters, we divided the TS into two parts according to the variations of km, L, T, E, P′, and kmin (Figure 9). All these parameters display a generally change from 37–30 Ma to 30–19.7 Ma. T and E indicate the ellipsoid changes from prolate to oblate, at c.a. 30 Ma (420 m). L exhibits a higher degree of lineation between ∼37 and 30 Ma (0–420 m) than the 30–19.7 Ma range. In addition, from ∼37 to 30 Ma (0–420 m), kmin deviated from the bedding pole, whereas the kmax was distributed along the NW–SE direction, which is approximately parallel to the fold strike. Nearly half of the kmin was scattered away from the bedding pole, as indicated by the equal-area projections, and there is an evident SW-oriented distribution (also indicated by the mean value of the kmin) (Figure 11). This is an evident original magnetic fabric overprinted by tectonic strain through layer-parallel shortening, which suggested based on insights from magnetic fabrics in sandbox models and field observed magnetic fabric development in many mountain belts (Pares et al., 1999; Almqvist and Koyi, 2018; Schöfisch et al., 2021). From ∼30 to 19.7 Ma (420 m to the top), kmin was still grouped around the bedding pole, whereas the kmax was distributed along the NNW–SSE direction. In this stage, the kmin values are much more concentrated than the former, as indicated by the equal-area projections and the mean value of the kmin (Figure 11). Comparing the changes of the principal magnetic axes and parameters, there is a relatively significant tectonic strain from ∼37 to 30 Ma.
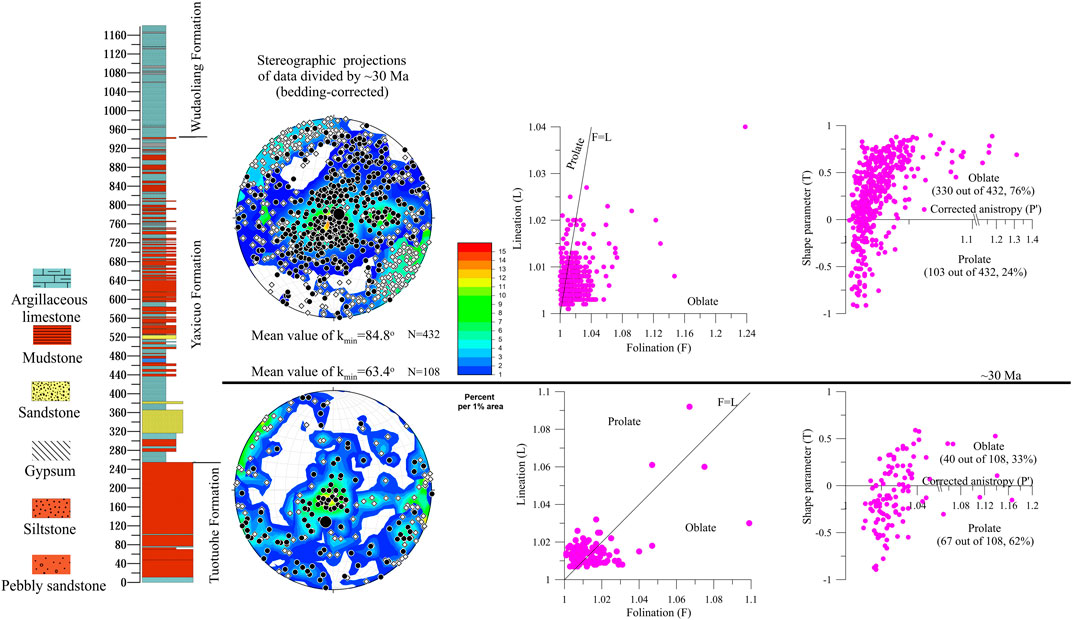
FIGURE 11. Stereonet projections of the maximum principal axis (kmax) (square) and the minimum principal axis (kmin) (circle), and the Flinn (F–L), and Jelinek (P′–T) diagram of the AMS data (after the F tests). All the diagrams are separated into two parts at 30 Ma. Please note that the bigger solid black dots in the stereonet projections are the mean value of the Kmin.
The strain variations seen in the principal axes distributions are also supported by the F–L and P′–T diagrams (Figure 11). From the sedimentary fabric to the composite sedimentary/tectonic fabric, the ellipsoid changes gradually from oblate (T > 0) to prolate (T < 0) with increasing strain (Pares, 2004; Weil and Yonkee, 2009). In the TS, from ∼37 to 30 Ma (0–420 m), 62% of the T values (67 out of 108) are located in the prolate part. However, from 30 to 19.7 Ma (420 m to the top), 24% of the T values (103 out of 433) are distributed in the prolate region. The F–L diagrams obtain the same features as the T values, having nearly the same proportion distributions of prolate and oblate samples (Figure 11). Taking the concrete AMS parameters (km, T, P′, L, E, and kmin), principal axes distribution, F–L and P′–T diagrams together, it is evident that the phase from ∼37 to 30 Ma experienced a relatively strong tectonic strain in the NE–SW direction comparing with the phase of 30–19.7 Ma.
Implications for Cenozoic Uplift of the Tuotuohe Basin and Tanggula Range
In the studied section, the AMS data demonstrated that the Tanggula Range was active during ∼37–30 Ma. Please note, that due to the sampling difficulties, the bottom of the studied samples does not represent the actual bottom age of the TTH Fm. Hence, the tectonic activity was not tested earlier than 37 Ma via AMS. However, based on the study of Wang et al. (2008), significant tectonic uplift of the Tanggula Range happened between 47 and 36 Ma indicated by magmatic activities as well as fission track ages.
A variety of evidence (Table 1) has strongly demonstrated late Eocene–early Oligocene tectonic activity around the Tanggula Range. First, abundant volcanic activities are distributed in this time span. In the Tuotuohe region, the Zhalaxiageyong trachyte is found with U–Pb ages of 34.06–32.39 Ma (Ning et al., 2016) and a rhyodacite lava flow is interbedded with the TTH Fm., for which the 40Ar/39Ar age is ∼33.5 Ma (Staisch et al., 2014). In Saiduopu, north of the Tanggula Range near the Tanggula Pass, the U–Pb analytical results for zircons from the Saiduopu granite are ∼39 or ∼40.6 ± 3.1 Ma (Roger et al., 2000; Duan et al., 2005). To the south of Quemocuo, intruded gabbro along the thrust fault is dated at 44 Ma (Li et al., 2006). In the Qiangtang terrane, Eocene–early Oligocene (50–29 Ma) volcanic and intrusive rocks are widespread (Wang et al., 2010).
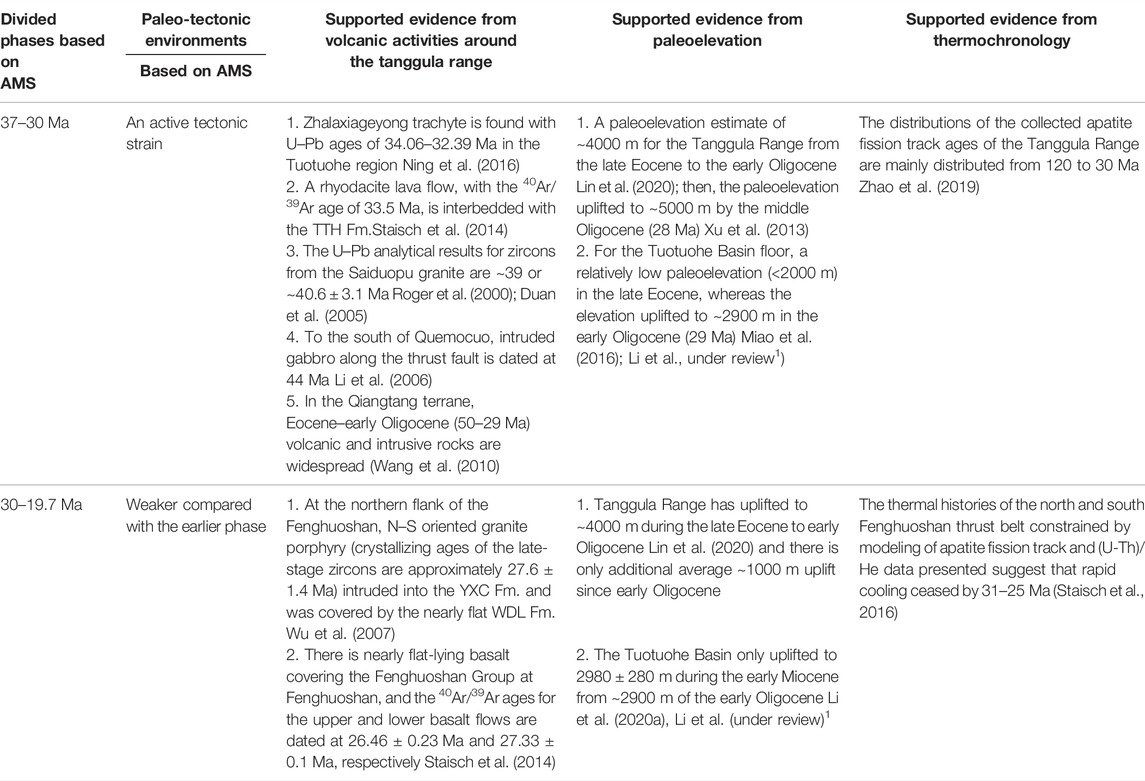
TABLE 1. Supported evidence for the divided phase based on AMS.
Second, there is an elevation uplift during this time induced by the continuous India-Asia convergence. The most negative leaf wax hydrogen isotope value indicates a paleoelevation estimate of ∼4000 m for the Tanggula Range from the late Eocene to the early Oligocene (Lin et al., 2020); then, the paleoelevation uplifted to ∼5000 m by the middle Oligocene (28 Ma) (Xu et al., 2013). For the Tuotuohe Basin floor, palynological assemblages in the fossil records indicate a relatively low paleoelevation (<2000 m) in the late Eocene, whereas the elevation uplifted to ∼2900 m in the early Oligocene (29 Ma) (Miao et al., 2016; Li et al., under review). This result is supported by the paleoelevation result from the Fenghuoshan Section, immediately north of our studied section, which indicated the paleoelevation is < 2800 m after upper crustal shortening stopped during 30–27 Ma as implied by the thermochronometric data (Miao et al., 2016; Dai et al., 2020; Li et al., in review).
Third, the Tanggula Range experienced a major late Cretaceous–early Miocene uplift and a cooling episode evidenced by thermochronology: the distributions of the collected apatite fission track ages of the Tanggula Range are mainly distributed from 120 to 30 Ma (Zhao et al., 2019).
According to the AMS results of samples collected from our studied section, the tectonic strain activity induced by the India–Asia convergence decreased at approximately 30 Ma. This is almost consistent with crustal shortening evidence (Table 1) such as: 1) at the northern flank of the Fenghuoshan, N–S oriented granite porphyry intruded into the YXC Fm. and was covered by the nearly flat WDL Fm. The crystallizing ages of the late-stage zircons are approximately 27.6 ± 1.4 Ma, indicating that the cessation time of the Fenghuoshan thrust fault belt is between 29 and 26.2 Ma (Wu et al., 2007; Dai et al., 2020). 2) there is nearly flat-lying basalt covering the Fenghuoshan Group at Fenghuoshan, and the 40Ar/39Ar ages for the upper and lower basalt flows are dated at 26.46 ± 0.23 Ma and 27.33 ± 0.1 Ma, respectively (Staisch et al., 2014).
As highlighted earlier, the Tuotuohe Basin floor is at ∼2900 m in the early Oligocene (29 Ma) according to the fossil records and the Fenghuoshan Section is at <2800 m after upper crustal shortening during 30–27 Ma (Dai et al., 2020; Li et al., under review). This indicates that an additional 1000–2000 m of surface uplift was needed to reach modern elevations (∼4500 m). Crustal shortening decreased or stopped after 30–27 Ma, and the early Miocene flat-lying attitude of the WDL Fm. has been preserved to the present (Wu et al., 2008; Staisch et al., 2014; Dai et al., 2020; Li et al., under review); thus, it is necessary to invoke other mechanisms to explain the surface uplift without changing the upper crustal shortening. A combination of mechanisms including continental subduction, convective removal of the lower lithosphere, and magmatic inflation has been proposed by Dai et al. (2020). However, this study does not consider which mechanism is responsible for the additional 1000–2000 m surface uplift of the Tuotuohe Basin. Instead, it focuses on when the relevant mechanism started to work. Based on geophysical and petrochemical evidence, Lu et al. (2018) confirmed that convective removal of the Tibet mantle lithosphere started at ∼26 Ma, which contributed to the wholesale uplift, and this finding is supported by Dai et al. (2020). However, the AMS parameters of the TS do not record significant amplitude changes between 30 and 19.7 Ma, indicating that there is no active tectonic strain experienced by the Tuotuohe Basin during the range ∼30–19.7 Ma. That indicates that the additional 1000–2000 m of surface uplift began at least after 19.7 Ma, and this viewpoint is supported by the paleoelevation results of the Wudaoliang and Lunpola Basins, which suggested that both basins were at less than 3000 m in the middle Miocene (Deng et al., 2012; Sun et al., 2014).
Conclusion
AMS data of the Tuotuohe Basin can be divided into two phases at 30 Ma. From ∼37 to 30 Ma, AMS parameters indicate an active tectonic strain and Tanggula Range uplift induced by the India–Asia convergence. Between 30 and 19.7 Ma, the strain is weak compared with the earlier phase. The AMS indexes of the TS do not record significant strain changes between 30 and 19.7 Ma, which indicates that the additional 1000–2000 m of surface uplift of the Tuotuohe Basin began at least after 19.7 Ma.
Data Availability Statement
The raw data supporting the conclusion of this article can be directed to the first author.
Author Contributions
HC designed the experiments. LL, HC, XQ, CG, and CQ performed the field work and experiments. All authors analyzed the data. LL wrote the manuscript with help from the other authors.
Funding
This work was supported by the National Natural Science Foundation of China (42102023,41420104008 and 41572166), the Second Tibetan Plateau Scientific Expedition and Research Program, Chinese Academy of Sciences (2019QZKK0707; 2019QZKK0704), the “Strategic Priority Research Program” of the Chinese Academy of Sciences (XDB40010100) and the State Key Laboratory of Loess and Quaternary Geology, Institute of Earth Environment, CAS (SKLLQGPY 1804 and SKLLQG2121).
Conflict of Interest
The authors declare that the research was conducted in the absence of any commercial or financial relationships that could be construed as a potential conflict of interest.
Publisher’s Note
All claims expressed in this article are solely those of the authors and do not necessarily represent those of their affiliated organizations, or those of the publisher, the editors and the reviewers. Any product that may be evaluated in this article, or claim that may be made by its manufacturer, is not guaranteed or endorsed by the publisher.
Acknowledgments
We are grateful to the editor and the reviewers for their creative comments to the manuscript.
Footnotes
1Li, L., Chang, H., Farnsworth, A., Niemi, N., Clift, P., Qiang, X. K., et al. Revised Chronology of the Middle-Upper Sequence of the Cenozoic Stratigraphy in the Hoh Xil Basin, central-northern Tibet and its Paleoenvironmental Implications. under review.
References
Almqvist, B. S. G., and Koyi, H. (2018). Bulk Strain in Orogenic Wedges Based on Insights from Magnetic Fabrics in Sandbox Models. Geology 46 (6), 483–486. doi:10.1130/g39998.1
An, Z., Kutzbach, J. E., Prell, W. L., and Porter, S. C. (2001). Evolution of Asian Monsoons and Phased Uplift of the Himalaya–Tibetan Plateau since Late Miocene Times[J]. Nature 411 (6833), 62–66. doi:10.1038/3507503
Bean, C. P. (1955). Hysteresis Loops of Mixtures of Ferromagnetic Micropowders. J. Appl. Phys. 26 (11), 1381–1383. doi:10.1063/1.1721912
Borradaile, G. J., and Henry, B. (1997). Tectonic Applications of Magnetic Susceptibility and its Anisotropy[J]. Earth-Science Rev. 42 (1), 49–93. doi:10.1016/s0012-8252(96)00044-x
Bradák, B., Seto, Y., Chadima, M., Kovacs, J., Tanos, P., Ujvari, G., et al. (2020). Magnetic Fabric of Loess and its Significance in Pleistocene Environment Reconstructions[J]. Earth-Science Rev., 210 103385. doi:10.1016/j.earscirev.2020.103385
Chang, H., Li, L., Qiang, X., Garzione, C. N., Pullen, A., and An, Z. (2015). Magnetostratigraphy of Cenozoic Deposits in the Western Qaidam Basin and its Implication for the Surface Uplift of the Northeastern Margin of the Tibetan Plateau. Earth Planet. Sci. Lett. 430, 271–283. doi:10.1016/j.epsl.2015.08.029
Charreau, J., Chen, Y., Gilder, S., Barrier, L., Augier, R., Sen, S., et al. (2009). Neogene Uplift of the Tian Shan Mountains Observed in the Magnetic Record of the Jingou River Section (Northwest China)[J]. Tectonics 28 (2), 2137. doi:10.1029/2007tc002137
Charreau, J., Chen, Y., Gilder, S., Dominguez, S., Avouac, J. P., Sen, S., et al. (2005). Magnetostratigraphy and Rock Magnetism of the Neogene Kuitun He Section (Northwest China): Implications for Late Cenozoic Uplift of the Tianshan Mountains[J]. Earth Planet. Sci. Lett. 230 (1), 177–192. doi:10.1016/j.epsl.2004.11.002
Charreau, J., Gilder, S., Chen, Y., Dominguez, S., Avouac, J.-P., Sen, S., et al. (2006). Magnetostratigraphy of the Yaha Section, Tarim Basin (China): 11 Ma Acceleration in Erosion and Uplift of the Tian Shan Mountains. Geology 34 (3), 181–184. doi:10.1130/g22106.1
Dai, J. G., Fox, M., Shuster, D. L., Hourigan, J., Han, X., Li, L. Y., et al. (2020). Burial and Exhumation of the Hoh Xil Basin, Northern Tibetan Plateau: Constraints from Detrital (U‐Th)/He Ages[J]. Basin Res. 32 (5), 904–925. doi:10.1111/bre.12405
Deng, C., Zhu, R., Jackson, M. J., Verosub, K. L., and Singer, M. J. (2001). Variability of the Temperature-dependent Susceptibility of the Holocene Eolian Deposits in the Chinese Loess Plateau: a Pedogenesis Indicator[J]. Phys. Chem. Earth, A: Solid Earth Geodesy 26 (11-12), 873–878. doi:10.1016/s1464-1895(01)00135-1
Deng, T., Wang, S. Q., Xie, G. P., Li, Q., Hou, S., Sun, B., et al. (2012). A Mammalian Fossil from the Dingqing Formation in the Lunpola Basin, Northern Tibet, and its Relevance to Age and paleo-Altimetry[J]. Chin. Sci. Bull. 57 (2), 261–269. doi:10.1007/s11434-011-4773-8
Duan, Z., Li, Y., Zhang, Y., and Wang, M. (2005). Zircon U-Pb Age, Continent Dynamics Significance and Geochemical Characteristics of the Mesozoic and Cenozoic Granites from the Tanggula Range in the Qinghai—Tibet Plateau[J]. ACTA GEOLOGICA SINICA 79 (1), 88–97.
Dupont-Nivet, G., Krijgsman, W., Langereis, C. G., Abels, H. A., Dai, S., and Fang, X. (2007). Tibetan Plateau Aridification Linked to Global Cooling at the Eocene-Oligocene Transition. Nature 445 (7128), 635–638. doi:10.1038/nature05516
Fang, X., Dupont-Nivet, G., Wang, C., Song, C., Meng, Q., Zhang, W., et al. (2020). Revised Chronology of central Tibet Uplift (Lunpola Basin). Sci. Adv. 6 (50), eaba7298. doi:10.1126/sciadv.aba7298
Fang, X., Fang, Y., Zan, J., Zhang, W., Song, C., Appel, E., et al. (2019). Cenozoic Magnetostratigraphy of the Xining Basin, NE Tibetan Plateau, and its Constraints on Paleontological, Sedimentological and Tectonomorphological Evolution. Earth-Science Rev. 190, 460–485. doi:10.1016/j.earscirev.2019.01.021
Frank, U., and Nowaczyk, N. R. (2008). Mineral Magnetic Properties of Artificial Samples Systematically Mixed from Haematite and Magnetite. Geophys. J. Int. 175 (2), 449–461. doi:10.1111/j.1365-246x.2008.03821.x
Ge, J., Guo, Z., Zhao, D., Zhang, Y., Wang, T., Yi, L., et al. (2014). Spatial Variations in Paleowind Direction during the Last Glacial Period in north China Reconstructed from Variations in the Anisotropy of Magnetic Susceptibility of Loess Deposits. Tectonophysics 629, 353–361. doi:10.1016/j.tecto.2014.07.002
Graham, J. W. (1996). Significance of Magnetic Anisotropy in Appalachian Sedimentary Rocks[J]. Geophys. Monogr. Ser., 1 627–648. doi:10.1029/GM010p0627
Graham, J. W. (1954). Rock Magnetism and the Earth's Magnetic Field during Paleozoic Time. J. Geophys. Res. 59 (2), 215–222. doi:10.1029/jz059i002p00215
Hrouda, F. E. (1982). Magnetic Anisotropy of Rocks and its Application in Geology and Geophysics. Geophys. Surv. 5 (1), 37–82. doi:10.1007/bf01450244
Hrouda, F., and Jelínek, V. (1990). Resolution of Ferrimagnetic and Paramagnetic Anisotropies in Rocks, Using Combined Low-Field and High-Field Measurements. Geophys. J. Int. 103 (1), 75–84. doi:10.1111/j.1365-246x.1990.tb01753.x
Huang, B., Piper, J. D. A., Peng, S., Liu, T., Li, Z., Wang, Q., et al. (2006). Magnetostratigraphic Study of the Kuche Depression, Tarim Basin, and Cenozoic Uplift of the Tian Shan Range, Western China[J]. Earth Planet. Sci. Lett. 251 (3), 346–364. doi:10.1016/j.epsl.2006.09.020
Huang, B., Piper, J. D. A., Qiao, Q., Wang, H., and Zhang, C. (2010). Magnetostratigraphic and Rock Magnetic Study of the Neogene Upper Yaha Section, Kuche Depression (Tarim Basin): Implications to Formation of the Xiyu Conglomerate Formation, NW China[J]. J. Geophys. Res. Solid Earth 115 (B1), 6175. doi:10.1029/2008jb006175
Hunt, C. P., Banerjee, S. K., Han, J., Solheid, P. A., Oches, E., Sun, W., et al. (1995). Rock-magnetic Proxies of Climate Change in the Loess-Palaeosol Sequences of the Western Loess Plateau of China. Geophys. J. Int. 123 (1), 232–244. doi:10.1111/j.1365-246x.1995.tb06672.x
Hus, J. J. (2003). The Magnetic Fabric of Some Loess/palaeosol Deposits[J]. Phys. Chem. Earth, Parts A/B/C 28 (16-19), 689–699. doi:10.1016/s1474-7065(03)00128-1
Jelinek, V. (1981). Characterization of the Magnetic Fabric of Rocks[J]. Tectonophysics 79 (3-4), T63–T67. doi:10.1016/0040-1951(81)90110-4
Khan, M. A. (1962). The Anisotropy of Magnetic Susceptibility of Some Igneous and Metamorphic Rocks. J. Geophys. Res. 67 (7), 2873–2885. doi:10.1029/jz067i007p02873
Kruiver, P. P., Dekkers, M. J., and Heslop, D. (2001). Quantification of Magnetic Coercivity Components by the Analysis of Acquisition Curves of Isothermal Remanent Magnetisation[J]. Earth Planet. Sci. Lett. 189 (3), 269–276. doi:10.1016/s0012-821x(01)00367-3
Lagroix, F., and Banerjee, S. K. (2002). Paleowind Directions from the Magnetic Fabric of Loess Profiles in central Alaska[J]. Earth Planet. Sci. Lett. 195 (1), 99–112. doi:10.1016/s0012-821x(01)00564-7
Lagroix, F., and Banerjee, S. K. (2004). The Regional and Temporal Significance of Primary Aeolian Magnetic Fabrics Preserved in Alaskan Loess[J]. Earth Planet. Sci. Lett. 225 (3), 379–395. doi:10.1016/j.epsl.2004.07.003
Li, L., Chang, H., Guan, C., Liu, W., and Cao, Y. (2020a). Early Miocene Paleoaltitude of the Tuotuohe Basin, Central‐Northern Tibetan Plateau and its Tectonic Implications. Acta Geologica Sinica ‐ English Edition 94 (5), 1364–1372. doi:10.1111/1755-6724.14373
Li, S., van Hinsbergen, D. J. J., Shen, Z., Najman, Y., Deng, C., Zhu, R., et al. (2020b). Anisotropy of Magnetic Susceptibility (AMS) Analysis of the Gonjo Basin as an Independent Constraint to Date Tibetan Shortening Pulses[J]. Geophys. Res. Lett. 47 (8), e2020GL087531. doi:10.1029/2020gl087531
Li, S., Deng, C., Paterson, G. A., Yao, H., Huang, S., Liu, C., et al. (2014). Tectonic and Sedimentary Evolution of the Late Miocene-Pleistocene Dali Basin in the Southeast Margin of the Tibetan Plateau: Evidences from Anisotropy of Magnetic Susceptibility and Rock Magnetic Data. Tectonophysics 629, 362–377. doi:10.1016/j.tecto.2014.05.035
Li, Y., Wang, C., Yi, H., and Liu, Z. (2006). Cenozoic Thrust System and Uplifting of the Tanggula Mountain, Northern Tibet[J]. ACTA GEOLOGICA SINICA 80 (8), 1118–1130.
Li, Y., Wang, C., Zhao, X., Yin, A., and Ma, C. (2012). Cenozoic Thrust System, basin Evolution, and Uplift of the Tanggula Range in the Tuotuohe Region, central Tibet. Gondwana Res. 22 (2), 482–492. doi:10.1016/j.gr.2011.11.017
Lin, J., Dai, J. G., Zhuang, G., Jia, G., Zhang, L., Ning, Z., et al. (2020). Late Eocene–Oligocene High Relief Paleotopography in the North Central Tibetan Plateau: Insights from Detrital Zircon U–Pb Geochronology and Leaf Wax Hydrogen Isotope Studies[J]. Tectonics 39 (2), e2019TC005815. doi:10.1029/2019tc005815
Liu, Z., Zhao, X., Wang, C., Liu, S., and Yi, H. (2003). Magnetostratigraphy of Tertiary Sediments from the Hoh Xil Basin: Implications for the Cenozoic Tectonic History of the Tibetan Plateau. Geophys. J. Int. 154 (2), 233–252. doi:10.1046/j.1365-246x.2003.01986.x
Lu, H., Tian, X., Yun, K., and Li, H. (2018). Convective Removal of the Tibetan Plateau Mantle Lithosphere by ∼26 Ma. Tectonophysics 731-732, 17–34. doi:10.1016/j.tecto.2018.03.006
Lu, H., Wang, E., and Meng, K. (2014). Paleomagnetism and Anisotropy of Magnetic Susceptibility of the Tertiary Janggalsay Section (Southeast Tarim basin): Implications for Miocene Tectonic Evolution of the Altyn Tagh Range. Tectonophysics 618, 67–78. doi:10.1016/j.tecto.2014.01.031
Manabe, S., and Terpstra, T. B. (1974). The Effects of Mountains on the General Circulation of the Atmosphere as Identified by Numerical Experiments. J. Atmos. Sci. 31 (1), 3–42. doi:10.1175/1520-0469(1974)031<0003:teomot>2.0.co;2
Martín-Hernández, F., and Ferré, E. C. (2007). Separation of Paramagnetic and Ferrimagnetic Anisotropies: A Review[J]. J. Geophys. Res. Solid Earth 112 (B3). 4340. doi:10.1029/2006JB004340
Martı́n-Hernández, F., and Hirt, A. M. (2003). The Anisotropy of Magnetic Susceptibility in Biotite, Muscovite and Chlorite Single Crystals[J]. Tectonophysics 367 (1-2), 13–28. doi:10.1016/S0040-1951(03)00127-6
Mattei, M., Sagnotti, L., Faccenna, C., and Funiciello, R. (1997). Magnetic Fabric of Weakly Deformed clay-rich Sediments in the Italian peninsula: Relationship with Compressional and Extensional Tectonics[J]. Tectonophysics 271 (1-2), 107–122. doi:10.1016/s0040-1951(96)00244-2
Miao, Y., Wu, F., Chang, H., Fang, X., Deng, T., Sun, J., et al. (2016). A Late-Eocene Palynological Record from the Hoh Xil Basin, Northern Tibetan Plateau, and its Implications for Stratigraphic Age, Paleoclimate and Paleoelevation. Gondwana Res. 31, 241–252. doi:10.1016/j.gr.2015.01.007
Molnar, P., England, P., and Martinod, J. (1993). Mantle Dynamics, Uplift of the Tibetan Plateau, and the Indian Monsoon. Rev. Geophys. 31 (4), 357–396. doi:10.1029/93rg02030
Molnar, P., and Tapponnier, P. (1975). Cenozoic Tectonics of Asia: Effects of a Continental Collision: Features of Recent continental Tectonics in Asia Can Be Interpreted as Results of the India-Eurasia Collision. science 189 (4201), 419–426. doi:10.1126/science.189.4201.419
Muxworthy, A. R., Schmidbauer, E., and Petersen, N. (2002). Magnetic Properties and Mössbauer Spectra of Urban Atmospheric Particulate Matter: a Case Study from Munich, Germany. Geophys. J. Int. 150 (2), 558–570. doi:10.1046/j.1365-246x.2002.01725.x
Ning, C., Li, B., and Wang, B. (2016). Zircon U--Pb Chronology and Geochemistry of Zhalaxiageyong Trachyte in Tuotuohe area,Qinghai[J]. GLOBAL GEOLOGY. 35 (4), 920–930. doi:10.1007/s12583-017-0954-y
Oches, E. A., and Banerjee, S. K. (1996). Rock-magnetic Proxies of Climate Change from Loess -paleosol Sediments of the Czech Republic. Stud. Geophys. Geod 40 (3), 287–300. doi:10.1007/bf02300744
Oertel, G. (1983). The Relationship of Strain and Preferred Orientation of Phyllosilicate Grains in Rocks—A Review[J]. Tectonophysics 100 (1-3), 413–447. doi:10.1016/0040-1951(83)90197-x
Parés, J. M. (2004). How Deformed Are Weakly Deformed Mudrocks? Insights from Magnetic Anisotropy[J]. Geol. Soc. Lond. Spec. Publications 238 (1), 191–203. doi:10.1144/GSL.SP.2004.238.01.13
Parés, J. M. (2015). Sixty Years of Anisotropy of Magnetic Susceptibility in Deformed Sedimentary Rocks[J]. Front. Earth Sci. 3, 4. doi:10.3389/feart.2015.00004
Parés, J. M., van der Pluijm, B. A., and Dinarès-Turell, J. (1999). Evolution of Magnetic Fabrics during Incipient Deformation of Mudrocks (Pyrenees, Northern Spain) [J]. Tectonophysics 307 (1), 1–14.
Parés, J. M., and Van Der Pluijm, B. A. (2002). Evaluating Magnetic Lineations (AMS) in Deformed Rocks[J]. Tectonophysics 350 (4), 283–298. doi:10.1016/S0040-1951(02)00119-1
Parés, J. M., and van der Pluijm, B. A. (2014). Low-temperature AMS and the Quantification of Subfabrics in Deformed Rocks[J]. Tectonophysics 629, 55–62. doi:10.1016/j.tecto.2014.03.005
Parés, J. M., and Van Der Pluijm, B. A. (2003). Magnetic Fabrics and Strain in Pencil Structures of the Knobs Formation, Valley and Ridge Province, US Appalachians[J]. J. Struct. Geology. 25 (9), 1349–1358. doi:10.1016/S0191-8141(02)00197-9
Paterson, S. R., Yu, H., and Oertel, G. (1995). Primary and Tectonic Fabric Intensities in Mudrocks[J]. Tectonophysics 247 (1-4), 105–119. doi:10.1016/0040-1951(94)00199-j
Qiao, Q., Huang, B., Piper, J. D. A., Deng, T., and Liu, C. (2016). Neogene Magnetostratigraphy and Rock Magnetic Study of the Kashi Depression, NW China: Implications to Neotectonics in the SW Tianshan Mountains[J]. J. Geophys. Res. Solid Earth 121, 1280–1296. doi:10.1002/2015JB012687
Raymo, M. E., and Ruddiman, W. F. (1992). Tectonic Forcing of Late Cenozoic Climate. Nature 359 (6391), 117–122. doi:10.1038/359117a0
Richter, C., and van der Pluijm, B. A. (1994). Separation of Paramagnetic and Ferrimagnetic Susceptibilities Using Low Temperature Magnetic Susceptibilities and Comparison with High Field Methods. Phys. Earth Planet. Interiors 82 (2), 113–123. doi:10.1016/0031-9201(94)90084-1
Roberts, A. P., Cui, Y., and Verosub, K. L. (1995). Wasp-waisted Hysteresis Loops: Mineral Magnetic Characteristics and Discrimination of Components in Mixed Magnetic Systems. J. Geophys. Res. 100 (B9), 17909–17924. doi:10.1029/95jb00672
Roberts, A. P., Hu, P., Harrison, R. J., Heslop, D., Muxworthy, A. R., Oda, H., et al. (2019). Domain State Diagnosis in Rock Magnetism: Evaluation of Potential Alternatives to the Day Diagram. J. Geophys. Res. Solid Earth 124 (6), 5286–5314. doi:10.1029/2018jb017049
Rochette, P., Jackson, M., and Aubourg, C. (1992). Rock Magnetism and the Interpretation of Anisotropy of Magnetic Susceptibility. Rev. Geophys. 30 (3), 209–226. doi:10.1029/92rg00733
Rochette, P. (1987). Magnetic Susceptibility of the Rock Matrix Related to Magnetic Fabric Studies. J. Struct. Geology. 9 (8), 1015–1020. doi:10.1016/0191-8141(87)90009-5
Roger, F., Tapponnier, P., Arnaud, N., Schärer, U., Brunel, M., Zhiqin, X., et al. (2000). An Eocene Magmatic belt across central Tibet: Mantle Subduction Triggered by the Indian Collision? Terra Nova 12 (3), 102–108. doi:10.1046/j.1365-3121.2000.123282.x
Schöfisch, T., Koyi, H., and Almqvist, B. (2021). Influence of Décollement Friction on Anisotropy of Magnetic Susceptibility in a Fold-And-Thrust belt Model[J]. J. Struct. Geology. 144, 104274. doi:10.1016/j.jsg.2020.104274
Spicer, R. A., Su, T., Valdes, P. J., Farnsworth, A., Wu, F. X., Shi, G., et al. (2021). Why 'the Uplift of the Tibetan Plateau' Is a Myth. Natl. Sci. Rev. 8 (1), nwaa091. doi:10.1093/nsr/nwaa091
Staisch, L. M., Niemi, N. A., Hong, C., Clark, M. K., Rowley, D. B., and Currie, B. (2014). A Cretaceous-Eocene Depositional Age for the Fenghuoshan Group, Hoh Xil Basin: Implications for the Tectonic Evolution of the Northern Tibet Plateau. Tectonics 33 (3), 281–301. doi:10.1002/2013tc003367
Staisch, L. M., Niemi, N. A., Clark, M. K., and Chang, H. (2016). Eocene To Late Oligocene History Of Crustal Shortening Within The Hoh Xil Basin And Implications For The Uplift History Of The Northern Tibetan Plateau. Tectonics 35, 862–895. doi:10.1002/2015TC003972
Sun, J., Xu, Q., Liu, W., Zhang, Z., Xue, L., and Zhao, P. (2014). Palynological Evidence for the Latest Oligocene−early Miocene Paleoelevation Estimate in the Lunpola Basin, central Tibet. Palaeogeogr. Palaeoclimatol. Palaeoecol. 399, 21–30. doi:10.1016/j.palaeo.2014.02.004
Sun, B., Wang, Y. F., Li, C. S., Yang, J., Li, J. F., Li, Y. L., et al. (2015). Early Miocene Elevation In Northern Tibet Estimated By Palaeobotanical Evidence. Sci. Rep. 5, 10379. doi:10.1038/srep10379
Tang, Z., Huang, B., Dong, X., Ji, J., and Ding, Z. (2012). Anisotropy of Magnetic Susceptibility of the Jingou River Section: Implications for Late Cenozoic Uplift of the Tian Shan[J]. Geochem. Geophys. Geosystems 13 (3), 2012. doi:10.1029/2011gc003966
Tang, Z., Dong, X., Wang, X., and Ding, Z. (2015). Oligocene‐Miocene Magnetostratigraphy and Magnetic Anisotropy of theBaxbulak Section from thePamir‐TianShan Convergence Zone. Geochem. Geophys. Geosyst. 16 (10), 3575–3592. doi:10.1002/2015gc005965
Taylor, S. N., and Lagroix, F. (2015). Magnetic Anisotropy Reveals the Depositional and Postdepositional History of a Loess-Paleosol Sequence at Nussloch (Germany). J. Geophys. Res. Solid Earth 120 (5), 2859–2876. doi:10.1002/2014jb011803
Wang, C., Zhao, X., Liu, Z., Lippert, P. C., Graham, S. A., Coe, R. S., et al. (2008). Constraints on the Early Uplift History of the Tibetan Plateau. Pnas 105 (13), 4987–4992. doi:10.1073/pnas.0703595105
Wang, Q., Wyman, D. A., Li, Z. X., Sun, W., Chung, S. L., Zhang, Q., et al. (2010). Eocene north–south Trending Dikes in central Tibet: New Constraints on the Timing of East–West Extension with Implications for Early Plateau uplift?[J]. Earth Planet. Sci. Lett. 298 (1), 205–216. doi:10.1016/j.epsl.2010.07.046
Weil, A. B., and Yonkee, A. (2009). Anisotropy of Magnetic Susceptibility in Weakly Deformed Red Beds from the Wyoming Salient, Sevier Thrust belt: Relations to Layer-Parallel Shortening and Orogenic Curvature. Lithosphere 1 (4), 235–256. doi:10.1130/l42.1
Wu, Z., Barosh, P. J., Wu, Z., Hu, D., Zhao, X., Ye, P., et al. (2008). Vast Early Miocene Lakes of the central Tibetan Plateau[J]. Geol. Soc. America Bull. 120 (9-10), 1326–1337. doi:10.1130/B26043.1
Wu, Z., Ye, P., and Hu, D. (2007). U-pb IsotopicDating of Zircons from PorphyryGranite of the Fenghuoshan Mts., Northern Tibetan Plateau and ItsGeological Significance[J]. GEOSCIENCE 21 (3), 435–442.
Xu, Q., Ding, L., Zhang, L., Cai, F., Lai, Q., Yang, D., et al. (2013). Paleogene High Elevations in the Qiangtang Terrane, central Tibetan Plateau. Earth Planet. Sci. Lett. 362, 31–42. doi:10.1016/j.epsl.2012.11.058
Yin, A., and Harrison, T. M. (2000). Geologic Evolution of the Himalayan-Tibetan Orogen. Annu. Rev. Earth Planet. Sci. 28 (1), 211–280. doi:10.1146/annurev.earth.28.1.211
Zhang, R., Kravchinsky, V. A., Zhu, R., and Yue, L. (2010). Paleomonsoon Route Reconstruction along a W–E Transect in the Chinese Loess Plateau Using the Anisotropy of Magnetic Susceptibility: Summer Monsoon Model[J]. Earth Planet. Sci. Lett. 299 (3), 436–446. doi:10.1016/j.epsl.2010.09.026
Zhao, Z., Lu, L., and Wu, Z. (2019). Uplifting Evolution of the Central Uplift Belt, Qiangtang: Constraints from Tectonic Thermochronology[J]. Earth Sci. Front. 26 (2), 249–326. 10.1073/pnas.0703595105.
Keywords: tuotuohe basin, anisotropy of magnetic susceptibility, tanggula range, tectonic uplift, Tibet
Citation: Li L, Chang H, Pares JM, Bradák B, Zhang Z, Qiang X, Guan C and Quan C (2022) Cenozoic Uplift of Tanggula Range and Tuouohe Basin, Northern Tibet: Insights of the Anisotropy of Magnetic Susceptibility. Front. Earth Sci. 10:815315. doi: 10.3389/feart.2022.815315
Received: 15 November 2021; Accepted: 24 February 2022;
Published: 12 April 2022.
Edited by:
Yibo Yang, Institute of Tibetan Plateau Research (CAS), ChinaReviewed by:
Junliang Ji, China University of Geosciences Wuhan, ChinaWentian Liang, Northwest University, China
Dongliang Liu, Chinese Academy of Geologi-cal Sciences (CAGS), China
Copyright © 2022 Li, Chang, Pares, Bradák, Zhang, Qiang, Guan and Quan. This is an open-access article distributed under the terms of the Creative Commons Attribution License (CC BY). The use, distribution or reproduction in other forums is permitted, provided the original author(s) and the copyright owner(s) are credited and that the original publication in this journal is cited, in accordance with accepted academic practice. No use, distribution or reproduction is permitted which does not comply with these terms.
*Correspondence: Hong Chang, Y2hhbmdoQGxvZXNzLmxscWcuYWMuY24=