 Nahin Mostofa Niloy
 Mashura Shammi
 Md. Morshedul Haque
 Shafi M. Tareq
- 1Hydrobiogeochemistry and Pollution Control Laboratory, Department of Environmental Sciences, Jahangirnagar University, Dhaka, Bangladesh
- 2Department of Environmental Science and Engineering, Bangladesh University of Textile, Dhaka, Bangladesh
The Ganges and the Brahmaputra, two major rivers in Bangladesh, contribute major loads of dissolved organic matter (DOM) into the Bay of Bengal. The composition, sources, availability, and seasonal heterogeneity of DOM in these two rivers are thus very important to know about the biogeochemical cycles, fate, and ecological and environmental aspects before discharge into the Bay of Bengal. In this study, DOM was characterized in the downstream reaches of the Ganges and Brahmaputra rivers before their confluence with each other. The concentration of dissolved oxygen decreased in the pre-monsoon and monsoon in both rivers due to the increased decomposition and oxidation of rainfall-washed substances and thus made the water unsuitable for drinking. The amount of total coliform also made the water of both rivers unsuitable for drinking, recreational, and irrigation purposes. In total, four DOM components (one humic, one detergent-, and two protein-like) in the Ganges River and five DOM components (three humic- and two protein-like) in the Brahmaputra River were identified at their downstream reaches using fluorescence spectroscopy, three-dimensional excitation emission matrix (EEM) measurement, and parallel factor analysis (PARAFAC). The abundances of DOM components were higher in the pre-monsoon and monsoon seasons than in the post-monsoon season. Protein-like components contributed the most in two rivers. DOM was obtained mostly from terrestrial sources and was matured and less aromatic. This study also identifies that sewage water is the largest contributor to DOM in surface water, next to natural sources, and indicates the excessive anthropogenic activities in the river basins of Bangladesh.
1 Introduction
Dissolved organic matter (DOM) is a complex pool of compounds critical in the global carbon cycle (Wünsch and Murphy, 2021) and plays a vital role in aquatic ecosystems (Chaves et al., 2020; He et al., 2021). Identifying the molecular composition of riverine DOM is essential for knowing the source, mobility, and fate across landscapes. Geomorphological characteristics of the watershed, land use, and sediment load can change DOM’s quality, quantity, and reactivity over time (Wagner et al., 2015). Globally, large rivers are significant sources of DOM to the oceans and connect the terrestrial and marine biogeochemical cycle (Wagner et al., 2015; Riedel et al., 2016; Pang et al., 2020). The Ganges–Brahmaputra–Meghna (GBM) river basin is the third-largest hydrological system globally in terms of freshwater flow to the ocean. It is also one of the most populated deltas (Sharma et al., 2021). These transboundary river basins confront intensified stress on water resources (Munia et al., 2020). Moreover, the structure and composition of DOM remain poorly understood in rivers flowing through different climates and landforms (Liu et al., 2021). Therefore, a more detailed study is needed on DOM quality, quantity, and reactivity on their global drivers, such as changes in local natural runoff and inflows from upstream parts of a basin and local and upstream water consumption.
Himalayan rivers play a pivotal role in regional water and food supply, global sediments, and carbon budgets (Chen et al., 2020). Land use and anthropogenic activities directly affect downstream DOM quality and carbon (C) fluxes in the Asian rivers (Wagner et al., 2015; Park et al., 2018). Considering the physicochemical parameters, the water quality was found to be in the maximum deteriorated state during the monsoon and in the minimum state in the pre-monsoon in the Ganges and Brahmaputra rivers in Bangladesh (Tareq et al., 2013). Heavy metals were found exceeding the standard limits during the monsoon in the Brahmaputra River in Bangladesh (Rahman et al., 2017; Bhuyan et al., 2019). The water quality in the upstream Ganges River in Bangladesh was found to be unsuitable for drinking purpose and household consumption (Haque et al., 2020). The fluorescent DOM properties in the upstream Ganges of fulvic acid (M-type), fulvic acid (C-type), and protein-like were higher in the pre-monsoon (March–June) and monsoon (July–October) periods than in the post-monsoon (November–February). The components were fresh, autochthonous, and had less aromatic characteristics from natural and anthropogenic sources. The DOM components were abundant from the late pre-monsoon to the monsoon period in the upstream Ganges River in Bangladesh (Niloy et al., 2021a; Niloy et al., 2021c). However, there is no insight into the downstream evolution of DOM composition in the Ganges and Brahmaputra rivers in Bangladesh.
Fluorescence spectroscopy is a powerful, sensitive, and broadly used method to characterize DOM in fresh and marine water (Hudson et al., 2007; Mostofa et al., 2010; Nelson and Gauglitz, 2016). Fluorescence measurements require no pre-concentration of samples to generate three-dimensional excitation emission matrix (EEM) landscapes of conjugated DOM components. The particular wavelength position in an EEM landscape can reveal the DOM components, sources, and compositional states. Further analyzing EEM landscapes using a parallel factor multivariate analysis (PARAFAC) can separate the conjugated DOM components from the EEM (Stedmon and Markager, 2005a; Stedmon and Markager, 2005b; Stedmon and Bro, 2008). PARAFAC could separate the conjugated DOM components from the EEM. The simple sample preparation technique and facile duo function of EEM-PARAFAC in fluorescence spectroscopy were worth using in this study.
The degradation potential index (DPI) is used to observe differences in the degradability of DOM among sources. It is defined as the ratio of availability of the labile to recalcitrant organic components (Liao et al., 2021). The DPI is nowadays tagged with an end-member mixing (EMM) model to identify the contribution of various DOM sources to surface water (Yang et al., 2015; Liao et al., 2021). The Ganges and Brahmaputra rivers carry huge loads of natural and anthropogenic organic matters from their origin to downstream before the confluence (Steckler et al., 2022). The fluorescence intensity of DOM and microbial contamination was higher in the Brahmaputra River than that in the Ganges at the upstream position of these two rivers (Niloy et al., 2021a; Niloy et al., 2022).
On the contrary, the Ganges River contained more aromatic, high molecular size and weight DOM, and anthropogenically derived pollutants than the Brahmaputra River at the upstream location of these rivers in Bangladesh. Both terrestrial and aquatic-originated DOM were present, fluctuations in DOM intensity were related to rainfall, and other climatic effects, photodegradation, and microbial activity affected the DOM composition in both rivers (Niloy et al., 2021a; Niloy et al., 2022). The selection of the downstream position was thus very significant to know about the types and concentration of DOM, their originations, and factors influencing their availability in both rivers. Considering these needs, this study aimed to characterize DOM components and identify their sources and fate downstream of the Ganges and Brahmaputra rivers of Bangladesh. This study also targeted determining the degradation level of DOM of various origins and their contribution to the river water.
2 Materials and Methods
2.1 Study Area
The Ganges and Brahmaputra rivers are major transboundary rivers and originate from the Gangotri and Chemayungdung glaciers of the Himalayas. After flowing through the Indian regions, the Ganges and Brahmaputra River enter Bangladesh through northwestern and northern districts named Chapainawabganj and Nilphamary. The Ganges–Brahmaputra system discharges around 30,770 m3/s of water monthly. It carries about 1.84 billion tons of sediment/year, securing the third greatest water discharge and maximum sediment loads among world rivers (Papa et al., 2012; Steckler et al., 2022). Both river basins are greatly affected by the tropical climate. The average monthly rainfall data in the corresponding sampling location were collected using a rain gage during the study period to identify its roles in DOM intensity fluctuations (Supplementary Table S1). About 400 million and 83 million people live in the Ganges and Brahmaputra river basins, and in Bangladesh, the population density is around 390 person/km2 and 828 person/km2 (Mahanta et al., 2014; The Himalayan Climate and Water Atlas, 2015). The Ganges–Brahmaputra basin is used for agricultural production, fisheries, recreation, irrigation, and navigation, making it an economic hub. However, the basins of the two rivers are affected by biophysical, socioeconomic challenges, climatic stress, and substantial anthropogenically derived pollutants (Anwar, 2006; Rahman et al., 2020).
2.2 Sampling and Field Monitoring
The downstream water samples of the Ganges and Brahmaputra rivers were collected from the river stretch in the Rajbari district (23° 46' 52.2" N, 89° 38' 36.9" E) and the Nogorbari port in the Manikganj district (23° 6' 48.6" N, 89° 39' 5.8" E) of Bangladesh from April 2018 to March 2019 (Figure 1). The sampling locations were significantly far away from the bank of the two rivers. Water samples were collected in polypropylene bottles. The sample bottles were washed with 10% HCl, followed by distilled water and drying. The water samples were filtered using a pre-combusted (at 450°C for 4 h in a Muffle furnace) Whatman GF/F glass fiber filter (0.7 µm) immediately by a hand pump in the field. The filtered water samples were then preserved in the cooler box at 4°C, while transported to the hydrobiogeochemistry and pollution control laboratory at the Department of Environmental Sciences, Jahangirnagar University. All the instrumental measurements and chemical analyses of samples were completed immediately after reaching the department laboratory after sampling. The water quality parameters such as pH, dissolved oxygen (DO), electrical conductivity (EC), turbidity, and total dissolved solids (TDSs) were measured in situ using an YSI multiparameter. The other water quality parameters, such as biological oxygen demand (BOD), chemical oxygen demand (COD), and total coliform, were also measured.
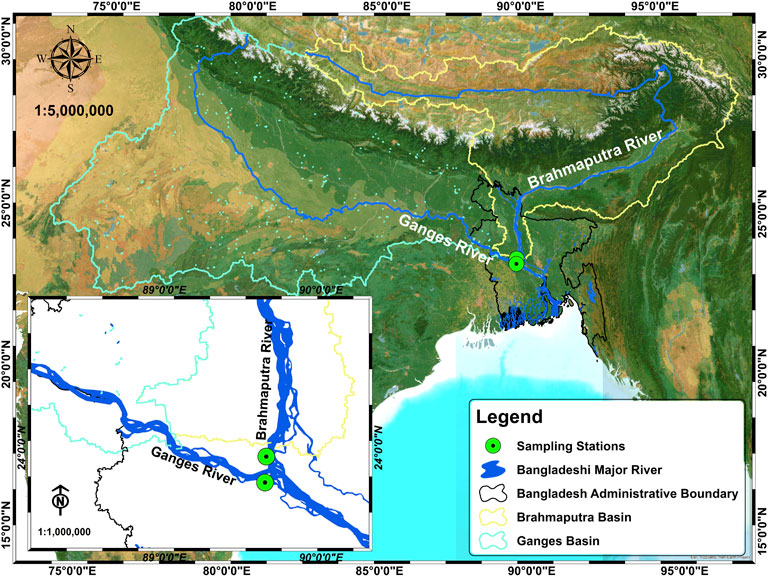
FIGURE 1. Map of the study areas and monitoring stations at the Ganges and Brahmaputra rivers. The map was created using ArcGIS 10.3.1 and the topographic image modified from ArcGIS/ESRI online.
2.3 DOC and DOM Measurement
DOC was determined using a catalytic oxidation method (Shimadzu TOC analyzer LCPH/CPN) at high temperature through a non-dispersive infrared (NDIR) detector. The samples were tested for fluorescence characterization in Hitachi F-4600. The samples were measured keeping excitation (Ex) wavelength 225–400 nm and emission (Em) wavelength 250–550 nm with 5- and 1-nm intervals, respectively. The excitation and emission slits were set to 5 nm of band-pass at 1200 nm min−1 scan speed. Before analysis, all the quartz cuvettes were rinsed with a 5% (w/w) nitric acid solution. The Milli-Q water blank EEM spectra were taken before the sample spectra. EEM data were further rectified for inner filter effects (Panigrahi and Mishra, 2019). The ultrapure Milli-Q water was used as a blank reference sample and was also used to convert arbitrary units of data into Raman units. The filtered samples were also measured using an UV spectrophotometer (SPECORD 210 Plus, Analytikjena) concurrently in the wavelength ranges between 190–1100 nm, keeping scanning speed at 60 nm/min.
2.4 Parallel Factor Analysis of Dissolved Organic Matter Components
The parallel factor analysis (PARAFAC) model was used to separate individual DOM components from the EEM using the DOMFluor toolbox (v1.7) in MATLAB software (v.2016a) (Stedmon and Bro, 2008). Blank Milli-Q water data were subtracted from the original sample data to remove Raman and Rayleigh scattering (Goletz et al., 2011; Stedmon and Bro, 2008). Sample data were validated properly using the split-half technique to identify the exact number of DOM components. The identified intensity (i.e., Fmax) values were read at Raman Unit (RU).
2.5 Degradation Potential Index Calculation and its Coupling with the End-Member Mixing Model
The degradation potential index (DPI) was calculated from the labile/recalcitrant ratio of the DOM components (Liao et al., 2021). The humic (C)-like DOM component shows fluorophores at a longer wavelength (UV–Visible), while the humic (M)-like component shows fluorophores at the midrange wavelengths (UV-A) (Table 2; Supplementary Table S5). Tryptophan-, tyrosine-, and detergent-like components show fluorophores at shorter wavelengths (UV-B and UV-C) (Table 2; Supplementary Table S5). The fluorophores in longer wavelengths might be significantly affected by photodegradation and lose their availability significantly, while fluorophores of shorter wavelengths are more susceptible to microbial degradation (Mostofa et al., 2010; Mann et al., 2012; Zhou et al., 2019; Yang et al., 2020). The tyrosine-like component could be removed entirely by biodegradation (Cory and Kaplan, 2012). However, tryptophan-like components exist as a persistent DOM in water as microbes cannot ingest and metabolize them properly (Cory and Kaplan, 2012). The differentiation of lability and recalcitrant nature of DOM was defined considering both photo- and microbial degradation in this study. The synergistic effects of photo- and microbial degradation widely reduce humic (C)-, tyrosine-, and detergent-like components. However, due to mid-wavelength position and microbial inability in mineralization, the photo- and microbial degradation effects could remove humic (M)- and tryptophan-like components in small amounts from river water (Mostofa et al., 2010; Cory and Kaplan, 2012; Mann et al., 2012; Zhou et al., 2019; Yang et al., 2020). Considering the degradation effects on the DOM, humic (C)-, tyrosine-, and detergent-like components were susceptible to being labile and humic (M), and tryptophan-like substances might be persistent DOMs in this study.
Algae, groundwater, industrial effluents, soil, terrestrial plants, and sewerage water were considered the main DOM contributors to surface water. The percentage contribution of DOM in a specific source was used to quantify its DPI value. The DPI of a distinct source was calculated from the equation:
The DPI was further coupled with the DOM end-member mixing model (Liao et al., 2021). The dual model was run in MATLAB software (v. 2016a) (Liao et al., 2021). The percentage contribution of DOM components from each natural/anthropogenic source into rivers was calculated (Liao et al., 2021) as follows:
where DPIR is the DPI of river water. (DPIA × fA), (DPIGW × fGW), (DPIIE × fIE), (DPIS × fS), (DPITP × fTP), and (DPISW × fSW) describe the multiplication of DPI and percentage DOM contribution of algae, groundwater, industrial effluents, soil, terrestrial plants, and sewerage water, respectively.
2.6 Quality Control and Quality Assurance and Data Analysis
Quality control and quality assurance (QA/QC) were maintained in all analyses in this study. All samples were measured three times. Data entry was performed using Microsoft Excel, and the standard deviation was calculated. Pearson’s correlation of DOM components in the downstream reaches of the Ganges and Brahmaputra rivers was computed using SPSS. All graphs were prepared using Sigmaplot, Originpro, and MATLAB. The map was prepared using ArcGIS.
3 Results and Discussion
3.1 Comparative Analysis of Water Quality Parameters
The temperatures in both river basins had higher values in the pre-monsoon and monsoon than in post-monsoon and showed a similar pattern of seasonal variation (r = 0.992, p < 0.01) (Table 1). Turbidity was higher in the monsoon than in pre-monsoon and post-monsoon, and this might be due to the significant organic matter inputs by rain in both the Ganges and Brahmaputra rivers. The water was alkaline in both rivers (Table 1). It exceeded the permissible limits set by the Department of Environment (DoE) in Bangladesh (BECR, 1997) for drinking, irrigation, and fishery purposes most of the time of the year in the two rivers. DO was comparatively low in the monsoon in both rivers, indicating the additional oxygen consumption to decompose and oxidize increased organic matters (Table 1). However, DO was within the accessible limit according to the standards set by the DoE (BECR, 1997) to use water for drinking, fisheries, and irrigation. EC was comparatively lower in the monsoon (Table 1). According to the World Health Organization WHO, (2004), EC was within the permissible limit. TDS was relatively lower in the pre-monsoon and monsoon than in post-monsoon (Table 1). TDS was within the acceptable limits according to WHO, (2004). BOD was comparatively high and exceeded the permissible limit set by the DoE (BECR, 1997) at the end of the pre-monsoon (Table 1). COD was also higher from pre-monsoon to the entire monsoon in both the rivers (Table 1). COD values exceeded the permissible limit set by the DoE (BECR, 1997) for drinking purposes throughout the year. Total coliform was in a minimum amount in the early monsoon in both rivers (Table 1). This could be due to the large deposition of organic matter and resistance to the growth of coliform bacteria by intense chlorophyll a production in eutrophication (Seo et al., 2019). However, the total coliform exceeded the limits set by the DoE (BECR, 1997) and confirmed that the water was unsuitable for drinking, recreational, and irrigation purposes in both rivers.
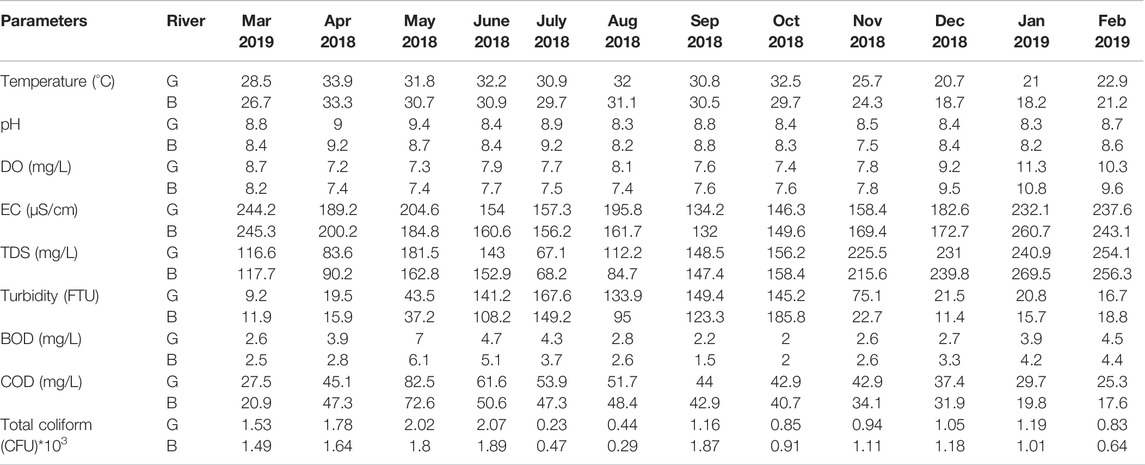
TABLE 1. Physicochemical parameters in the downstream of Ganges (G) and Brahmaputra (B) rivers.
3.2 Excitation Emission Matrix, Parallel Factor Analysis, and DOC Concentration
The EEM measurement identified five fluorophores in the Ganges River: Peak A (Ex/Em = 245/414 nm), Peak M (310/398 nm), Peak W (340/428 nm), Peak T (275/334 nm), and Peak Tuv (230/346 nm) and seven fluorophores in the Brahmaputra River: Peak A (Ex/Em = 245/418 nm), Peak C (365/442 nm), Peak M (295/404 nm), Peak T (275/312 nm), Peak Tuv (230/304 nm), Peak T (275/358 nm), and Peak Tuv (230/348 nm) (Figure 2, Supplementary Figure S1). Peaks A, C, and M represent humic-like component (Coble, 1996), while Peak W represents detergent-like anthropogenic substance (Mostofa et al., 2010; Niloy et al., 2021c). Peak T and Peak Tuv describe the tyrosine- and tryptophan-like component at the low and high emission wavelengths, respectively (Coble et al., 1990). The identified fluorophores thus indicated the natural and anthropogenically derived DOM components in the two rivers. PARAFAC analysis identified DOM components in the Ganges and Brahmaputra rivers, considering monthly water samples of each year. The PARAFAC analysis found four DOM components in the Ganges River: C1-G (Ex/Em = 230/406 nm, 310/406 nm), C2-G (265/462 nm, 340/462 nm), C3-G (225/334, 270/338), and C4-G (285/354) (Supplementary Figure S2). C1-G could be characterized as humic (M)-like, C2-G as detergent-like, and C3-G and C4-G as protein-like components (Table 2). C1-G in such wavelength could be labile and originated from terrestrial sources (Goldman and Sullivan, 2017). FI, HIX, and SUVA254 values also indicated the composition and source of C1-G as labile, less aromatic, and terrestrially derived (Supplementary Table S2). Anthropogenically derived component C2-G is widely used as a fluorescent whitening agent (FWA) in maximum commercial and household detergents in Bangladesh at a concentration higher than the usage standard (Niloy et al., 2021c). This component was also identified upstream of the Ganges River in Bangladesh (Niloy et al., 2021a), in the rainwater of Bangladesh (Niloy et al., 2021b), and even in the sewerage drainage water in China (Mostofa et al., 2010). C3-G and C4-G are two tryptophan-like components (Mostofa et al., 2010; Baghoth et al., 2011; Wu et al., 2011). Anthropogenically derived C3-G component is available in sewerage water and municipal leachate, while C4-G is autochthonous and could be found in water treatment plants (Table 2). Tryptophan-like component is a dominant organic compound found in microbially derived precursor materials, and a small portion of this component is labile or semi-labile. The encapsulation of tryptophan-like component in the humic matrix helps it behave as a recalcitrant molecule in the environment (Cory and Kaplan, 2012). This persistent nature of the tryptophan-like component has well-resembled with the C3-G in this study in terms of similar wavelength ranges (Table 2). C4-G had a bathochromic shift (red shift) in emission wavelength, and it could be due to its increased solvent polarity and bonding with metal ions (Kowalczuk et al., 2009).
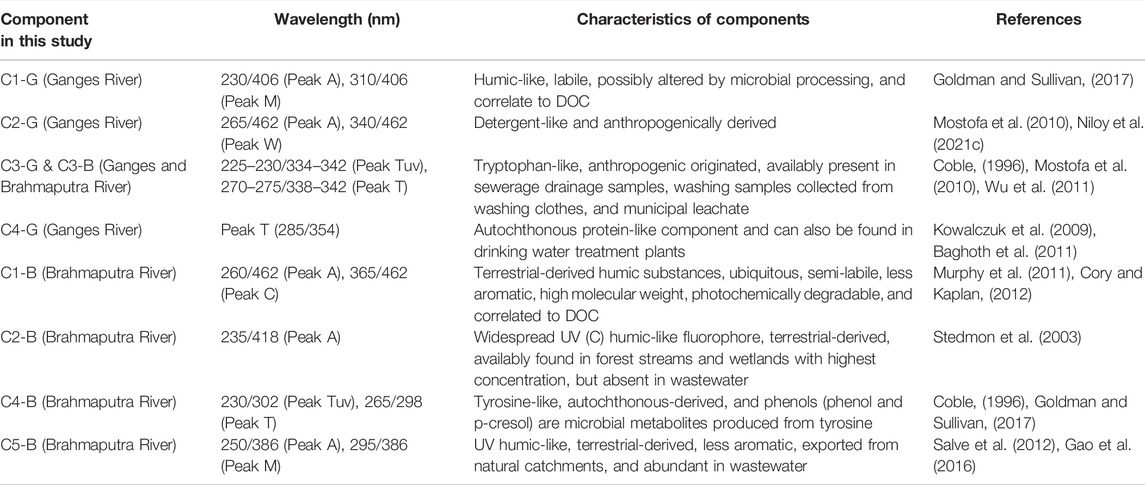
TABLE 2. Characteristics of identified DOM components in the PARAFAC analysis in Ganges and Brahmaputra rivers.
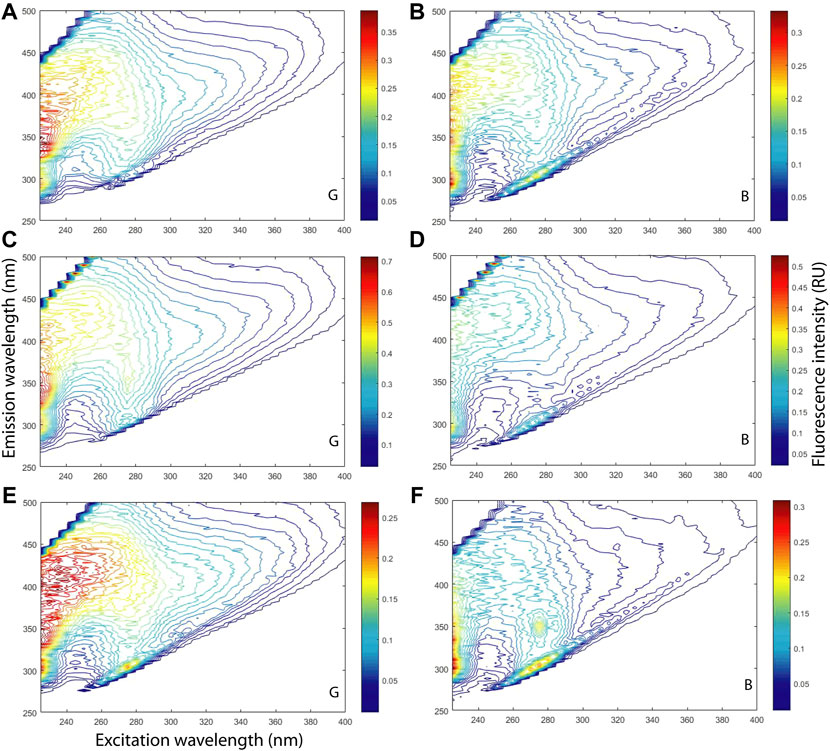
FIGURE 2. Three-dimensional EEM measurement of DOM using monthly fluorescence data in the pre-monsoon (April): (A)-G and (B)-B; monsoon (August): (C)-G and (D)-B; and post-monsoon (December): (E)-G and (F)-B in the Ganges (G) and Brahmaputra rivers. (B). Identified fluorophores in the Ganges River: Peak A (Ex/Em = 245/414 nm), Peak M (310/398 nm), Peak W (340/428 nm), Peak T (275/334 nm), and Peak Tuv (230/346 nm) and in the Brahmaputra River: Peak A (Ex/Em = 245/418 nm), Peak C (365/442 nm), Peak M (295/404 nm), Peak T (75/312 nm), Peak Tuv (230/304 nm), Peak T (275/358 nm), and Peak Tuv (230/348 nm).
The PARAFAC analysis also identified five DOM components: C1-B (Ex/Em = 260/462 nm, 365/462 nm), C2-B (235/418 nm), C3-B (230/342 nm, 275/342 nm), C4-B (230/302 nm, 265/298 nm), and C5-B (250/386 nm, 295/386 nm) in the Brahmaputra River (Supplementary Figure S2). Among the identified DOM components in the Brahmaputra River, C1-B could be characterized as humic-like, C2-B as UV (C) humic-like, C3-B as tryptophan-like, C4-B as tyrosine-like, and C5-B as UV humic-like substances (Table 2). C1-B could originate from terrestrial sources and be found in the wastewater-impacted environments (Murphy et al., 2011; Cory and Kaplan, 2012). C2-B was a forest- and wetland-derived compound (Stedmon et al., 2003). The tryptophan-like component in the Brahmaputra River C3-B had similar characteristics to C3-G of the Ganges River (Table 2).
DOM components showed seasonal variability at both the rivers. The intensity of fluorophores in the two rivers is depicted in Supplementary Figure S1. Humic- (C1-G) and detergent-like (C2-G) components showed maximum intensity in the monsoon. On the contrary, two protein-like components, C3-G and C4-G, had higher intensity in the pre-monsoon than in other seasons in the Ganges River (Figure 3A). The intensities of all DOM components were minimum in the post-monsoon season (Figure 3A). The maximum intensity contribution of component C3-G at all seasons and detergent-like component C2-G indicated the probability of dense human settlement and continuous anthropogenic activities around the river basin. Humic- and detergent-like components C1-G and C2-G were significantly dependent on rainfall-runoff (r = 0.8, p < 0.01) to enter the Ganges River from the terrestrial environment (Supplementary Table S3). However, rainfall had an insignificant negative correlation with tryptophan-like components from anthropogenically derived C3-G (r = −0.2, p > 0.05) and autochthonous-originate d C4-G (r = −0.01, p > 0.05) (Supplementary Table S3). Poor correlation between C3-G and rain indicated that this DOM component did not depend on rain to enter the river. Instead, C3-G might be mixed with the Ganges River water through pipelines from sewerage, washing, and leachate sources or disposal by anthropogenic sources directly. This direct input of C3-G into the Ganges River water described the possibility of dense household and industrial settlements in the river basin. High intensity of C3-G was also marked as a possibility for microbial activities on a large scale throughout the year in the Ganges River, according to the method described by Nowicki et al. (2019).
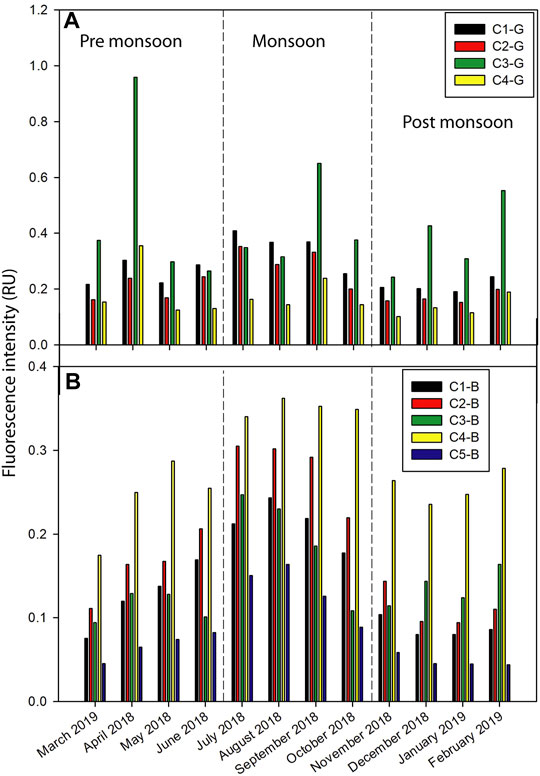
FIGURE 3. Fluorescence intensity of components in the downstream of (A) the Ganges and (B) Brahmaputra rivers.
The fluorescence intensities of DOM components also showed seasonal heterogeneity in the Brahmaputra River. All DOM components in this river showed maximum intensity in the monsoon (Figure 3B). After the monsoon, humic-like components (C1-B, C2-B, and C5-B) showed high intensities in the pre-monsoon, while the protein-like components (C3-B and C4-B) showed their second higher intensities in the post-monsoon (Figure 3B). All humic-like (r = 0.9, p < 0.01) and protein-like (r = 0.6, p < 0.05) components in the Brahmaputra River had a significant positive correlation with rain (Supplementary Table S4). The significant correlation described the dependence of DOM components in the Brahmaputra River on rainfall-runoff to enter the river. DOM characterization in the Brahmaputra River by PARAFAC analysis (Table 2) described that components could enter from forest streams, natural catchments, and various wastewater sources. The dependency of DOM components on rain indicated that the components from wastewater sources do not enter the Brahmaputra River water through closed sewerage pipelines or direct disposal by humans like in the Ganges River. The Brahmaputra River basin is supposed to contain more natural forests and wetlands covered in its surroundings as natural humic-like components were dominant in this river (4.9 RU) compared to the Ganges River (3.3 RU) (Figure 3). On the contrary, the higher intensity of anthropogenically derived protein-like components and the presence of detergents indicated a more significant amount of anthropogenic activities in the Ganges River basin than in the Brahmaputra River (Figure 3).
DOC concentration varied between 1.74 and 4.76 mg/L (2.71 ± 1.01) and 0.84 and 3.89 mg/L (1.90 ± 0.97) downstream of the Ganges and Brahmaputra River, respectively (Figure 4). Annual average DOC concentration in some major Asian rivers, such as the Yellow River, Yangtze River, and Pearl River, was found at 2.70 mg/L, 2.24 mg/L, and 1.51 mg/L, respectively (Shi et al., 2016). DOC concentration in the downstream reaches of the Ganges and the Brahmaputra rivers was comparable to that mentioned above for the major Asian rivers (Figure 4). The seasonal DOC concentration followed the order pre-monsoon > monsoon > post-monsoon in both rivers (Figure 4). However, the fluorescent intensities of DOM components were higher in monsoon than in pre-monsoon at both rivers (Figure 3). The different seasonal fluctuation of DOC and DOM components in pre-monsoon and monsoon might be due to the additional presence of nitrogenous, phosphoric, and other organic compounds. Protein-like components were found in maximum intensity during the monsoon in the Brahmaputra River (Figure 3B). The comparison of protein-like components with DOC concentration indicated that the Brahmaputra River might contain additional nitrogenous compounds during the monsoon than in the other two seasons. On the contrary, the protein-like component showed the second-highest intensity in the monsoon in the Ganges River (Figure 3A). The comparison of protein-like components with DOC concentration suggested that the Ganges River might contain phosphoric and other organic compounds in addition to carbonaceous and nitrogenous substances.
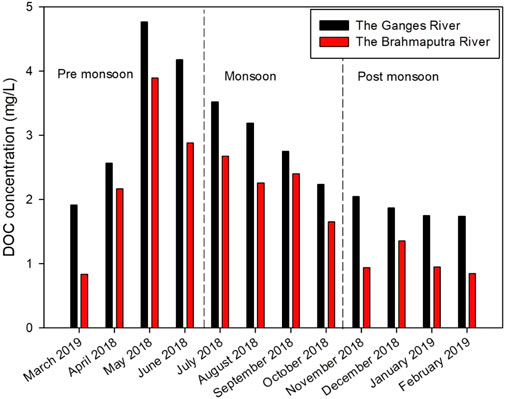
FIGURE 4. DOC concentration in the downstream of the Ganges and Brahmaputra rivers.
3.2.1 Statistical Correlation of Dissolved Organic Matter Components in the Downstream Reaches of the Ganges and Brahmaputra River
The microbially degradable component C1-G could contribute to the DOC in the aquatic system (Goldman and Sullivan, 2017). However, in this study, C1-G had an insignificant correlation with DOC concentration (r = 0.41, p > 0.05), indicating that this carbon-dominated component might be incorporated with nitrogenous, phosphorous, and other organic compounds (Supplementary Table S3). Moreover, bonding with metal ions and low pH could also quench the fluorescence intensity of the DOM (Kowalczuk et al., 2009). pH values were higher in the Ganges River (Table 1). The insignificant correlation between DOC and C1-G thus described a possibility of intensity quench of this component due to its attachment with metal ions. The humic-like component in the Ganges River C1-G degraded due to the temperature effect (r = 0.6, p < 0.05) (Supplementary Table S3). C1-G and C4-G also had a significant positive correlation (r = 0.6–0.7, p < 0.05) with E250/365, indicating that the intensity of these two DOM components increased with the decrease of their molecular size (Supplementary Table S3).
C1-B contributed significantly to the DOC concentration (r = 0.6, p < 0.05), unlike C1-G. Both C1-B (r = 0.7, p < 0.01) and C2-B (r = 0.7, p < 0.05) had a strong correlation with HIX, suggesting their major contributions to the aromaticity in the Brahmaputra River, though the total aromaticity was low in the river water (Supplementary Table S4). The temperature could quench fluorescent intensity due to molecular collision effects (Henderson et al., 2009). However, the inverse function of this parameter could also be seen to be playing an important role in photodegradation, thermal decomposition, and mineralization and thus increasing the intensity of components (Gruenheid et al., 2008; Porcal et al., 2015). The role of temperature in the degradation and mineralization of humic-like components C1-B, C2-B, and C5-B and thus loss of their relative molecular size increasing intensity could be described from the strong positive correlation (r = 0.6–0.7, p < 0.05, 0.01) of these three DOM components with temperature and relative molecular size values (E250/365) in this study (Supplementary Table S4). C5-B could also contribute significantly to the autochthonous DOM production through microbial degradation unlike C1-B and C2-B, which could be described from its strong positive correlation with BIX and the Freshness index (r = 0.6, p < 0.05) in the Brahmaputra River (Supplementary Table S4). The increase of humic-like components C1-B, C2-B, and C5-B significantly reduced the DO concentration (r = −0.6–0.7, p < 0.05), causing deleterious effects on aquatic species due to their presence (Supplementary Table S4). On the contrary, protein-like components in the Brahmaputra River and humic-, protein-, and detergent-like components in the Ganges River hardly reduce DO concentration (r = −0.2–0.4, p > 0.05) (Supplementary Table S4).
3.3 Degradation Potential Index and Source Apportion of Dissolved Organic Matter Into Surface Water
The EEM and PARAFAC analyses identified fluorophores and DOM components of various natural and anthropogenic sources in surface water. EEM analysis, detail characterization, and intensities of identified DOM components are depicted in Figure 5 and Supplementary Tables S5, S6, respectively. The EEM and PARAFAC identified two humic- and two protein-like components in algae, three humic-like components in groundwater, two humic- and one protein-like component in industrial effluents, four humic-like components in soil, three humic-like components in terrestrial plants, and two humic-, one protein-, and one detergent-like component in sewerage water samples (Supplementary Table S5). The DOM degradation varied among sources: sewerage water > terrestrial plants > algae > soil > groundwater > industrial effluents (Figure 6). The minimum DPI value indicated the presence of persistent organic molecules in industrial effluents.
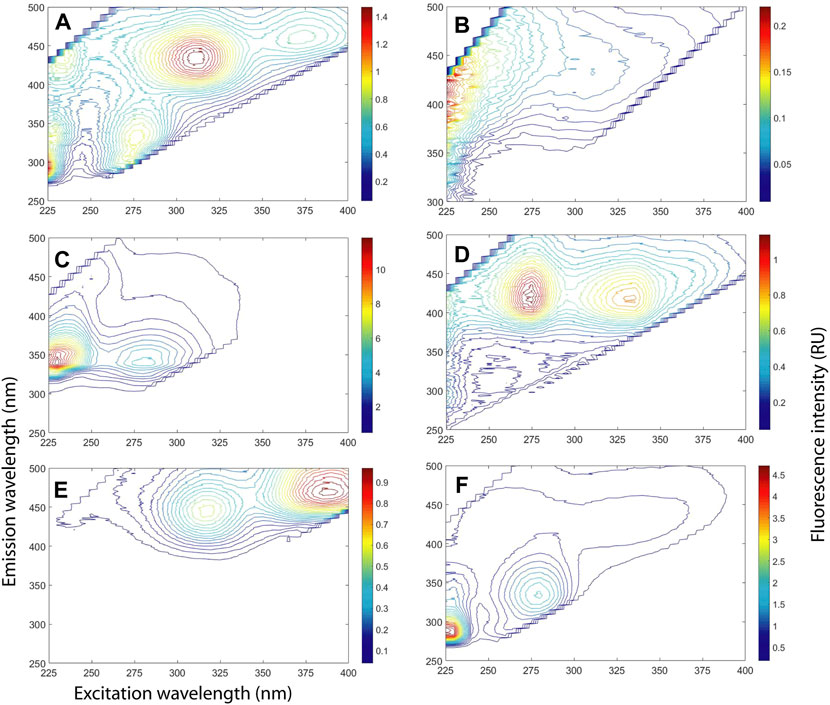
FIGURE 5. EEM spectra of common natural and anthropogenic DOM sources during the late monsoon at the Ganges and Brahmaputra rivers basins: (A) algae, (B) groundwater, (C) industrial effluents, (D) soil, (E) terrestrial plants, and (F) sewerage water. These samples were collected separately from their sources and measured using a fluorescence spectrophotometer.
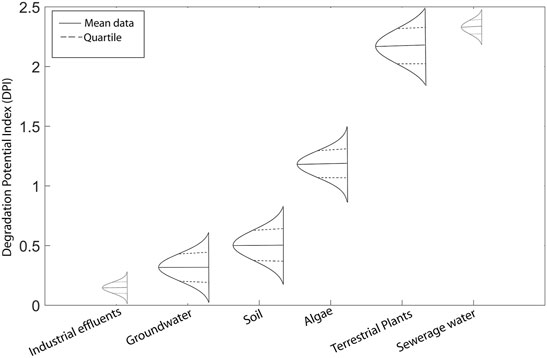
FIGURE 6. Degradation potential index (DPI) of common natural and anthropogenic DOM sources in the environment. The DPI of sources was calculated using equation (i).
The DOM contributions from sources were calculated by coupling the DPI values of sources with the contributing DOM components in surface water. Algae, groundwater, industrial effluents, soil, terrestrial plants, and sewerage water contributed around 13.3–19.2%, 2.8–4.2%, 0.8–1.2%, 5.5–7.1%, 19.8–25.2%, and 44.7–56.7% DOM throughout the year, respectively (Figure 7). The contribution from similar sources could change insignificantly with spatiotemporal variability Liao et al. (2021). The production of DOM from algae depends on its decay influenced by photo-irradiation and microbial activity (Hansen et al., 2016). The produced DOM from algae was both labile and recalcitrant, ensuring its long-term stability in water. The contribution of algal DOM was comparable to that of terrestrial DOM contributed by plants (Figure 7). Groundwater also contributed a minimal amount of DOM to surface water (Figure 7). Due to heavy rainfall, the infiltration and percolation of terrestrial-derived DOM in large amounts into groundwater might increase its contribution to surface water in the monsoon (r = 0.7, p < 0.05) (Figure 7). The minimum contribution of DOM from groundwater indicated water table sink due to insufficient rain (r = 0.8, p < 0.05). The contribution from the industrial effluents into surface water was minimum among all sources (Figure 7). However, rivers in Bangladesh are highly contaminated by untreated inputs of industrial effluents and solid wastes (Aktar and Moonajilin, 2017; Uddin and Jeong, 2021).
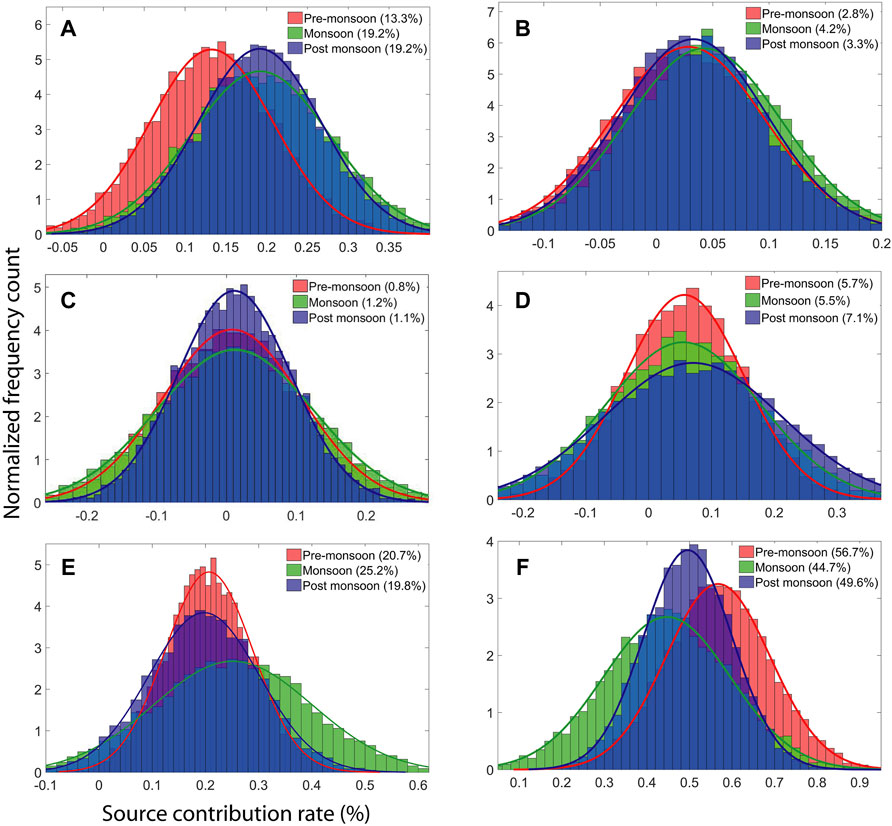
FIGURE 7. Seasonal variation (pre-monsoon, monsoon, and post-monsoon) in the DOM contribution (in percentage, %) from various natural and anthropogenic sources in the environment to the downstream of the Ganges and Brahmaputra rivers in the pre-monsoon (March–June), monsoon (July–October), and post-monsoon (November–February). The considered natural and anthropogenic DOM sources here are (A) algae, (B) groundwater, (C) industrial effluents, (D) soil, (E) terrestrial plants, and (F) sewerage water.
Nevertheless, lower DOM contribution might be due to the abundant presence of hydrophobic, non-polar, and dispersing chemicals and dyes in industrial effluents. The two terrestrial-derived natural sources, soil and terrestrial plants, responded inversely to rainfall (Figure 7). DOM from the soil contributed least in monsoon and most in the dry post-monsoon (Figure 7). However, due to heavy rain in the monsoon, dilution effects could hardly affect DOM exudation from terrestrial plant sources (r = −0.7, p < 0.05). Instead, significant rain washed DOM in high amounts from terrestrial plants into surface water, thus contributing to the maximum in the monsoon (r = 0.8, p < 0.01) (Figure 7). Terrestrial plants contributed minimum in the post-monsoon into surface water. The entirely anthropogenically originated sewerage water contributed the most among all sources (Figure 7). The slight rainfall rapidly washed long deposited sewerage wastes (r = 0.8, p < 0.01) in large amounts into the surface water and thus increased DOM contribution in the pre-monsoon. However, DOM contribution from sewerage sources was minimum during the monsoon, which might be due to the dilution effects (r = −0.5, p > 0.05) (Figure 7). The high DOM contribution from the sewerage water confirmed the enormous waste disposals unethically and a wide range of anthropogenic activity.
3.4 Fate of Dissolved Organic Matter in the Ganges and Brahmaputra Rivers
The concentration and sources of DOM changed dynamically from upstream to downstream in both the Ganges and Brahmaputra Rivers in Bangladesh. The factors such as local climate, hydrology, physical and chemical interaction among DOM, source variation, surrounding forest cover, human settlement, and state of the industrialization played a pivotal role in DOM dynamicity in the two rivers.
The upstream of the Ganges River, four DOM components, including detergent-like, protein-like, and two humic-like, were identified in the PARAFAC analysis (Niloy et al., 2021a). Detergent- and protein-like components came from anthropogenic sources, whereas two humic-like substances originated from natural terrestrial sources and microbial processing. DOM components were primarily fresh, immediately humified, and aromatic (Niloy et al., 2021a). The relative molecular weight was maximum from the late monsoon to the entire post-monsoon (Supplementary Table S7). Autochthonous DOM production was also high. Total intensities of DOM components were higher in the pre-monsoon and monsoon than post-monsoon. Rainfall played a significant role (r = 0.741, p < 0.01) in the fluctuation of DOM intensities (Niloy et al., 2021a). The Ganges River water was in the intermediate-risk category due to the microbial contamination throughout the entire monsoon (Niloy et al., 2021a).
PARAFAC also identified four DOM components downstream of the Ganges River (Supplementary Figure S2). However, the specified DOM components: a humic-like, a detergent-like, and two protein-like components, indicated the loss of natural humic components and increased anthropogenic protein-like substances compared to the upstream (Supplementary Figure S2, Table 2). The total fluorescent intensity in the downstream was 1.8–17.7 times higher than that in the upstream of the river (Figure 8). The intensities of humic-like components increased by 0.7–8.0 times, protein-like components by 4.2–135.0 times, and detergent-like components by 1.1–5.6 times downstream than the upstream of the river (Figure 3; Supplementary Figure S4). The increase of anthropogenically derived protein- and detergent-like components and their intensities indicated higher population density and industrialization at the downstream of the river basin than the upstream. Unlike significant seasonal heterogeneity (r = 0.387, p > 0.05), DOM showed descending order of intensity: pre-monsoon > monsoon > post-monsoon and monsoon > pre-monsoon > post-monsoon in the upstream and downstream of the river (Figure 3; Supplementary Figure S4). The only identified humic-like component in this study originated through microbial processing resembling the upstream (Table 2). However, higher intensity of humic (M)-like and tryptophan-like substances indicated more microbial activity downstream than upstream in this river (Figure 3). Inputs of protein-like components in downstream hardly depended on rain (p > 0.05), though their intensity decreased to some extent might be due to dilution effects (r = −0.177, p > 0.05) for precipitation. DOM components were less humified and aromatic and matured in downstream compared to the upstream (Supplementary Tables S2, S7). The molecular size and weight of DOM were also less in downstream than upstream of this river (Supplementary Tables S2, S7). Photo-irradiation and microbial activity might function intensely to decrease DOM molecular size and weight in the downstream.
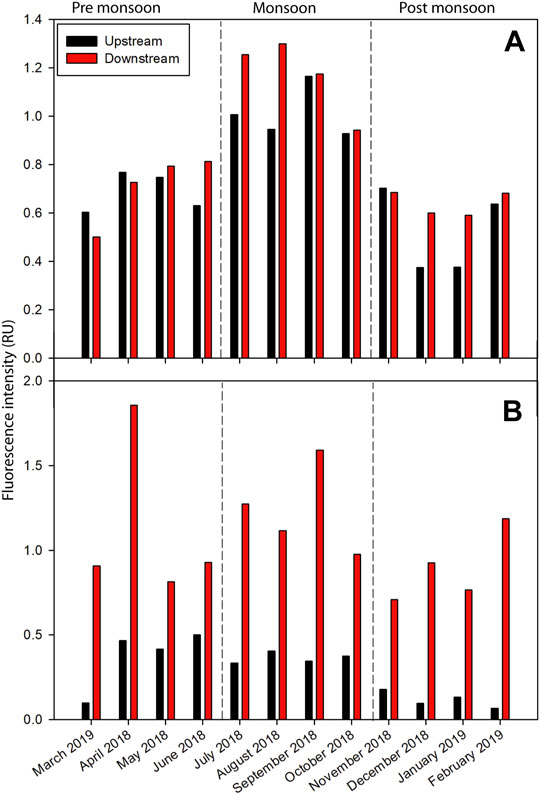
FIGURE 8. Comparison of DOM intensities between upstream and downstream of (A) Brahmaputra and (B) Ganges rivers. The fluorescence intensities in the upstream of Ganges and Brahmaputra rivers of Bangladesh were derived from Niloy et al. (2021a) and Niloy et al. (2022).
PARAFAC identified four DOM components (two humic- and two protein-like) in the upstream of the Brahmaputra River (Niloy et al., 2022). Total intensities of DOM were maximum in the monsoon and minimum in the post-monsoon (Figure 8A). The intensities of protein-like components were 0.8–3.3 times higher than those of the humic-like components (Supplementary Figure S5). DOM components came from both allochthonous and autochthonous sources, were matured, poorly humified, and less aromatic (Niloy et al., 2022). The relative molecular weight of DOM was maximum in the monsoon and minimum during post-monsoon (Niloy et al., 2022). However, the relative molecular size of DOM in the Brahmaputra river was slightly low in the pre-monsoon and monsoon, indicating that DOM components might be attached to other high weight and low size containing substances, debris, or metals during these times (Niloy et al., 2022). The concentration of anthropogenically derived tryptophan-like components was high and indicated water quality deterioration at intermediate/high levels due to intense microbial activity (Niloy et al., 2022). However, rainfall played a significant positive role in fluctuating humic-like moieties (r = 0.845, p < 0.01), and it had a weak negative influence on seasonal variation of protein-like components (r = −0.306, p > 0.05) (Niloy et al., 2022).
Downstream of Brahmaputra River, the PARAFAC analysis identified five components: three humic-like and two protein-like (Supplementary Figure S2). A terrestrial-derived and wastewater abundant humic-like component was added with the previously identified four DOM components in the downstream (Table 2). The Brahmaputra is a classic example of a braided river, and continuous river erosion and riverine island formation diverted the channel and anabranches in the pathways (Ullah et al., 2010; Islam et al., 2020). Local people cultivate crops and dwell with unhealthy sanitation, mostly in the grown-up large sandbars and islands of the Brahmaputra River (Ullah et al., 2010; Salam et al., 2019). The more agricultural cultivation or grasslands than the upstream could be the possible reason for adding another humic (C)-like natural DOM component downstream of the Brahmaputra River. The humic (C)-like component increased its intensity about 2–3 times downstream than the upstream (Figure 3B; Supplementary Figure S5). On the contrary, microbial-derived humic (M)-like, anthropogenically originated tryptophan- and tyrosine-like components had lower intensity in the downstream reaches of the Brahmaputra River than the upstream reaches (Figure 3B; Supplementary Figure S5). Such results indicated that natural agricultural and forest cover dominate and lower microbial and anthropogenic activities exist in the downstream of the Brahmaputra River than upstream. Total intensities of DOM were 0.8–1.6 times higher in the downstream than upstream (Figure 8A). Humic- and protein-like moieties were 0.9–1.7 and 0.6–1.9 times higher in the downstream than upstream, respectively (Figure 3B; Supplementary Figure S5). Rainfall played a strong role in fluctuating humic-like components (r = 0.922, p < 0.01) in the downstream similar to upstream (Supplementary Table S4). Conversely, unlike the upstream, a significant correlation between rainfall and protein fractions (r = 0.682, p < 0.05) indicated that protein-like components mostly came from the terrestrial washout by rain in the Brahmaputra River rather than from other sources such as household sewage and industrial discharge (Supplementary Table S4). Humic-like components also showed similar seasonal heterogeneity (r = 0.911, p < 0.01) in both streams, whereas protein-like components described unlike seasonal heterogeneity (r = 0.514, p > 0.05), showing intensities in descending order monsoon > pre-monsoon > post-monsoon and monsoon > post-monsoon > pre-monsoon in the upstream and downstream of the river (Figure 3; Supplementary Table S1; Supplementary Figures S4, S5). The decrease of protein-like components in the pre-monsoon might be due to dilution effects caused by rainfall, and this could be explained by the strong relation (r = 0.682, p < 0.05) between rainfall and the availability of protein moieties (Supplementary Table S4). Like the upstream, humic-like DOM components originated from allochthonous sources and were matured, poorly humified, and non-aromatic (Supplementary Tables S2, S7). The relative molecular weight was higher in downstream than upstream in the Brahmaputra River (Supplementary Tables S2, S7). However, like the upstream, the relative molecular weight of DOM was higher in the monsoon and pre-monsoon, while inversely, the relative molecular size of DOM was higher in the post-monsoon than in other seasons (Supplementary Tables S2, S7). Water quality was in the high-risk category due to the presence of tryptophan-like components throughout the year in both streams of the river, according to the method by Nowicki et al. (2019).
4 Conclusion
This study provided a precise figure about the insights of the DOM components in the downstream of the Ganges and the Brahmaputra rivers. Both natural and anthropogenically derived DOM prevailed in both rivers. The fluorescent intensity of DOM components was higher in the pre-monsoon and monsoon than in post-monsoon seasons in both rivers. DOM components were mostly from terrestrial sources in both rivers. The significant presence of detergent- and tryptophan-like DOM in the Ganges River indicated intense anthropogenic activities nearby its basin. On the contrary, the Brahmaputra River basin was mainly covered by forest and vegetation due to the dominant presence of humic-like components. The DPI and EMM identified sewerage water as the maximum DOM contributing source, followed by terrestrial plants > algae > soil > groundwater > industrial effluents. DOM components were matured and less aromatic. DOM molecules contained lower energy from the late pre-monsoon to the entire monsoon than the rest of the year. The downstream Ganges and the Brahmaputra River had more DOM than the upstream portion in Bangladesh. The deteriorated condition in the downstream warned about the severe health effects on living species and suggested taking prompt actions to control and treat anthropogenic sources of DOM before discharging into surface water.
Data Availability Statement
The original contributions presented in the study are included in the article/Supplementary Material; further inquiries can be directed to the corresponding author.
Author Contributions
ST and MS planned and designed the study. NN and MH collected data and analyzed samples. All authors wrote and reviewed the manuscript.
Conflict of Interest
The authors declare that the research was conducted in the absence of any commercial or financial relationships that could be construed as a potential conflict of interest.
Publisher’s Note
All claims expressed in this article are solely those of the authors and do not necessarily represent those of their affiliated organizations, or those of the publisher, the editors, and the reviewers. Any product that may be evaluated in this article, or claim that may be made by its manufacturer, is not guaranteed or endorsed by the publisher.
Acknowledgments
The authors would like to acknowledge the Organization for Women in Science for the Developing World (OWSD), a UNESCO program, hosted by The World Academy of Sciences (TWAS). The grant was provided to Dr. MS (Award Agreement No.: 4500384865) under the Early career fellowship program 2018. This project was further supported by the University Grants Commission (UGC), Bangladesh, and Jahangirnagar University Faculty of Mathematical & Physical Sciences Research Grant for FY (2020–2021) and provided to Dr. MS. Furthermore, this work was carried out with the aid of a grant from the UNESCO and the International Development Research Center (IDRC), Ottawa, Canada. The views expressed herein do not necessarily represent those of UNESCO, IDRC or its Board of Governors.
Supplementary Material
The Supplementary Material for this article can be found online at: https://www.frontiersin.org/articles/10.3389/feart.2022.821050/full#supplementary-material
References
Aktar, P., and Moonajilin, M. S. (2017). Assessment of Water Quality Status of Turag River Due to Industrial Effluent. Int. J. Eng. Inf. Syst. 1 (6), 105–118.
Anwar, J. (2006). Pollution in the Ganges Brahmaputra Delta Plain. Available at: http://www.sos-arsenic.net/english/environment/ganges.html (Accessed November 1, 2021).
Baghoth, S. A., Sharma, S. K., and Amy, G. L. (2011). Tracking Natural Organic Matter (NOM) in a Drinking Water Treatment Plant Using Fluorescence Excitation-Emission Matrices and PARAFAC. Water Res. 45, 797–809. doi:10.1016/j.watres.2010.09.005
Bhuyan, M. S., Bakar, M. A., Rashed-Un-Nabi, M., Senapathi, V., Chung, S. Y., and Islam, M. S. (2019). Monitoring and Assessment of Heavy Metal Contamination in Surface Water and Sediment of the Old Brahmaputra River, Bangladesh. Appl. Water Sci. 9, 1–13. doi:10.1007/s13201-019-1004-y
Chaves, R. C., Figueredo, C. C., Boëchat, I. G., de Oliveira, J. T. M., and Gücker, B. (2020). Fluorescence Indices of Dissolved Organic Matter as Early Warning Signals of Fish Farming Impacts in a Large Tropical Reservoir. Ecol. Indic. 115, 106389. doi:10.1016/j.ecolind.2020.106389
Chen, M., Zeng, C., Zhang, F., Kang, S., and Li, C. (2020). Characteristics of Dissolved Organic Matter from a Transboundary Himalayan Watershed: Relationships with Land Use, Elevation, and Hydrology. ACS Earth Space Chem. 4, 449–456. doi:10.1021/acsearthspacechem.9b00329
Coble, P. G. (1996). Characterization of Marine and Terrestrial DOM in Seawater Using Excitation-Emission Matrix Spectroscopy. Mar. Chem. 51, 325–346. doi:10.1016/0304-4203(95)00062-3
Coble, P. G., Green, S. A., Blough, N. V., and Gagosian, R. B. (1990). Characterization of Dissolved Organic Matter in the Black Sea by Fluorescence Spectroscopy. Nature 348, 432–435. doi:10.1038/348432a0
Cory, R. M., and Kaplan, L. A. (2012). Biological Lability of Streamwater Fluorescent Dissolved Organic Matter. Limnol. Oceanogr. 57, 1347–1360. doi:10.4319/lo.2012.57.5.1347
Gao, S.-J., Zhao, C., Shi, Z.-H., Zhong, J., Liu, J.-G., and Li, J.-Q. (2016). Spectroscopic Characteristics of Dissolved Organic Matter in Afforestation Forest Soil of Miyun District, Beijing. J. Anal. Methods Chem. 2016, 1–10. doi:10.1155/2016/1480857
Goldman, J. H., and Sullivan, A. B. (2017). Characteristics of Dissolved Organic Matter in the Upper Klamath River , Lost River , and Klamath Straits Drain , Oregon and California. U.S. Geol. Surv. Open File Rep. 21, 2017–1160. doi:10.3133/ofr20171160
Goletz, C., Wagner, M., Grübel, A., Schmidt, W., Korf, N., and Werner, P. (2011). Standardization of Fluorescence Excitation – Emission-Matrices in Aquatic Milieu. Talanta 85, 650–656. doi:10.1016/j.talanta.2011.04.045
Gruenheid, S., Huebner, U., and Jekel, M. (2008). Impact of Temperature on Biodegradation of Bulk and Trace Organics During Soil Passage in an Indirect Reuse System. Water Sci. Technol. 57, 987–994. doi:10.2166/wst.2008.207
Hansen, A. M., Kraus, T. E. C., Pellerin, B. A., Fleck, J. A., Downing, B. D., and Bergamaschi, B. A. (2016). Optical Properties of Dissolved Organic Matter (DOM): Effects of Biological and Photolytic Degradation. Limnol. Oceanogr. 61, 1015–1032. doi:10.1002/lno.10270
Haque, M. M., Niloy, N. M., Nayna, O. K., Fatema, K. J., Quraishi, S. B., Park, J.-H., et al. (2020). Variability of Water Quality and Metal Pollution Index in the Ganges River, Bangladesh. Environ. Sci. Pollut. Res. 27, 42582–42599. doi:10.1007/s11356-020-10060-3
He, Q., Gao, L., Wang, Z., Tang, Y., Pan, B., and Li, M. (2021). Fluorescence Characteristics of Dissolved Organic Matter in Several Independent Water Bodies: Possible Sources and Land-Use Effects. Environ. Sci. Pollut. Res. 28, 33241–33253. doi:10.1007/s11356-021-12972-0
Henderson, R. K., Baker, A., Murphy, K. R., Hambly, A., Stuetz, R. M., and Khan, S. J. (2009). Fluorescence as a Potential Monitoring Tool for Recycled Water Systems: A Review. Water Res. 43, 863–881. doi:10.1016/j.watres.2008.11.027
Hudson, N., Baker, A., and Reynolds, D. (2007). Fluorescence Analysis of Dissolved Organic Matter in Natural, Waste and Polluted Waters-A Review. River Res. applic. 23, 631–649. doi:10.1002/rra.1005
Islam, M. M., Islam, F., Akter, M. S., Kundu, G. K., Barman, A., and Khan, M. I. (2020). Transformative Adaptations to Climate Change: Cases from the Jamuna River Fishing Communities of Bangladesh. J. Fish. Environ. 44 (3), 1–18.
Kowalczuk, P., Durako, M. J., Young, H., Kahn, A. E., Cooper, W. J., and Gonsior, M. (2009). Characterization of Dissolved Organic Matter Fluorescence in the South Atlantic Bight with Use of PARAFAC Model: Interannual Variability. Mar. Chem. 113, 182–196. doi:10.1016/j.marchem.2009.01.015
Liao, Z.-l., Zhao, Z.-c., Chen, H., and Wu, J. (2021). Quantitative Source Apportionment of Dissolved Organic Matters in Wet Weather Overflows of Storm Drainage Systems Based on Degradation Potential Index and End Member Mixing Model. Sci. Total Environ. 792, 148493. doi:10.1016/j.scitotenv.2021.148493
Liu, T., Wang, X., Zhu, E., Liu, Z., Zhang, X., Guo, J., et al. (2021). Evolution of the Dissolved Organic Matter Composition along the Upper Mekong (Lancang) River. ACS Earth Space Chem. 5, 319–330. doi:10.1021/acsearthspacechem.0c00292
Mahanta, C., Zaman, A. M., Newaz, S. M. S., Rahman, S. M. M., Rahman, S. M. M., Choudhury, R., et al. (2014). Physical Assessment of the Brahmaputra River. Dhaka, Bangladesh: IUCN, International Union for Conservation of Nature.
Mann, P. J., Davydova, A., Zimov, N., Spencer, R. G. M., Davydov, S., Bulygina, E., et al. (2012). Controls on the Composition and Lability of Dissolved Organic Matter in Siberia's Kolyma River Basin. J. Geophys. Res. 117, 1–15. doi:10.1029/2011jg001798
Mostofa, K. M. G., Wu, F., Liu, C.-Q., Fang, W. L., Yuan, J., Ying, W. L., et al. (2010). Characterization of Nanming River (Southwestern China) Sewerage-Impacted Pollution Using an Excitation-Emission Matrix and PARAFAC. Limnology 11, 217–231. doi:10.1007/s10201-009-0306-4
Munia, H. A., Guillaume, J. H. A., Wada, Y., Veldkamp, T., Virkki, V., and Kummu, M. (2020). Future Transboundary Water Stress and its Drivers under Climate Change: A Global Study. Earth's Future 8, 0–3. doi:10.1029/2019EF001321
Murphy, K. R., Hambly, A., Singh, S., Henderson, R. K., Baker, A., Stuetz, R., et al. (2011). Organic Matter Fluorescence in Municipal Water Recycling Schemes: Toward a Unified PARAFAC Model. Environ. Sci. Technol. 45, 2909–2916. doi:10.1021/es103015e
Nelson, N. B., and Gauglitz, J. M. (2016). Optical Signatures of Dissolved Organic Matter Transformation in the Global Ocean. Front. Mar. Sci. 2, 1–15. doi:10.3389/fmars.2015.00118
Niloy, N. M., Haque, M. M., and Tareq, S. M. (2021a). Characteristics, Sources, and Seasonal Variability of Dissolved Organic Matter (DOM) in the Ganges River, Bangladesh. Environ. Process. 8, 593–613. doi:10.1007/s40710-021-00499-y
Niloy, N. M., Haque, M. M., and Tareq, S. M. (2021b). Characterization of Dissolved Organic Matter at Urban and Industrial Rainwater of Bangladesh by Fluorescence Spectroscopy and EEM-PARAFAC Modeling. Environ. Challenges 5, 100250. doi:10.1016/j.envc.2021.100250
Niloy, N. M., Haque, M. M., and Tareq, S. M. (2021c). Fluorescent Whitening Agents in Commercial Detergent: A Potential Marker of Emerging Anthropogenic Pollution in Freshwater of Bangladesh. Environ. Nanotechnol. Monit. Manag. 15, 100419. doi:10.1016/j.enmm.2020.100419
Niloy, N. M., Haque, M. M., and Tareq, S. M. (2022). Temporal Changes in Hydrochemistry and DOM Characteristics of the Brahmaputra River: Implication to the Seasonality of Water Quality. Environ. Sci. Pollut. Res. 29, 35165–35178 doi:10.1007/s11356-022-18618-z
Nowicki, S., Lapworth, D. J., Ward, J. S. T., Thomson, P., and Charles, K. (2019). Tryptophan-Like Fluorescence as a Measure of Microbial Contamination Risk in Groundwater. Sci. Total Environ. 646, 782–791. doi:10.1016/j.scitotenv.2018.07.274
Panigrahi, S. K., and Mishra, A. K. (2019). Inner Filter Effect in Fluorescence Spectroscopy: As a Problem and as a Solution. J. Photochem. Photobiol. C Photochem. Rev. 41, 100318. doi:10.1016/j.jphotochemrev.2019.100318
Pang, Y., Wang, K., Sun, Y., Zhou, Y., Yang, S., Li, Y., et al. (2021). Linking the Unique Molecular Complexity of Dissolved Organic Matter to Flood Period in the Yangtze River Mainstream. Sci. Total Environ. 764, 142803. doi:10.1016/j.scitotenv.2020.142803
Papa, F., Bala, S. K., Pandey, R. K., Durand, F., Gopalakrishna, V. V., Rahman, A., et al. (2012). Ganga-Brahmaputra River Discharge from Jason-2 Radar Altimetry: An Update to the Long-Term Satellite-Derived Estimates of Continental Freshwater Forcing Flux into the Bay of Bengal. J. Geophys. Res. 117, a–n. doi:10.1029/2012JC008158
Park, J.-H., Nayna, O. K., Begum, M. S., Chea, E., Hartmann, J., Keil, R. G., et al. (2018). Reviews and Syntheses: Anthropogenic Perturbations to Carbon Fluxes in Asian River Systems - Concepts, Emerging Trends, and Research Challenges. Biogeosciences 15, 3049–3069. doi:10.5194/bg-15-3049-2018
Porcal, P., Dillon, P. J., and Molot, L. A. (2015). Temperature Dependence of Photodegradation of Dissolved Organic Matter to Dissolved Inorganic Carbon and Particulate Organic Carbon. Plos One 10, e0128884. doi:10.1371/journal.pone.0128884
Rahman, M., Islam, M., and Khan, M. (2017). Status of Heavy Metal Pollution of Water and Fishes in Balu and Brahmaputra Rivers. Prog. Agric. 27, 444–452. doi:10.3329/pa.v27i4.32129
Rahman, M. M., Ghosh, T., Salehin, M., Ghosh, A., Haque, A., Hossain, M. A., et al. (2020). “Ganges-Brahmaputra-Meghna Delta, Bangladesh and India: A Transnational Mega-Delta,” in Deltas in the Anthropocene. Editors R. J. Nicholls, N. Adger, C. W. Hutton, and S. E. Hanson (Springer Nature Switzerland AG), 23–51. doi:10.1007/978-3-030-23517-8_2
Riedel, T., Zark, M., Vähätalo, A. V., Niggemann, J., Spencer, R. G. M., Hernes, P. J., et al. (2016). Molecular Signatures of Biogeochemical Transformations in Dissolved Organic Matter from Ten World Rivers. Front. Earth Sci. 4, 1–16. doi:10.3389/feart.2016.00085
Salam, M. A., Khan, M. S., and Sarker, M. A. H. (2019). Impacts and Coping Techniques to Flood : the Case Study of Two Char Lands of Jamuna River in Sirajgonj District, Bangladesh. Int. Res. J. Environ. Sci. 8 (3), 53–61.
Salve, P. R., Lohkare, H., Gobre, T., Bodhe, G., Krupadam, R. J., Ramteke, D. S., et al. (2012). Characterization of Chromophoric Dissolved Organic Matter (CDOM) in Rainwater Using Fluorescence Spectrophotometry. Bull. Environ. Contam. Toxicol. 88, 215–218. doi:10.1007/s00128-011-0424-7
Seo, M., Lee, H., and Kim, Y. (2019). Relationship between Coliform Bacteria and Water Quality Factors at Weir Stations in the Nakdong River, South Korea. water 11, 1171. doi:10.3390/w11061171
Sharma, C., Shukla, A. K., and Zhang, Y. (2021). Climate Change Detection and Attribution in the Ganga-Brahmaputra-Meghna River Basins. Geosci. Front. 12, 101186. doi:10.1016/j.gsf.2021.101186
Shi, G., Peng, C., Wang, M., Shi, S., Yang, Y., Chu, J., et al. (2016). The Spatial and Temporal Distribution of Dissolved Organic Carbon Exported from Three Chinese Rivers to the China Sea. PLoS ONE 11, e0165039. doi:10.1371/journal.pone.0165039
Steckler, M. S., Oryan, B., Wilson, C. A., Grall, C., Nooner, S. L., Mondal, D. R., et al. (2022). Synthesis of the Distribution of Subsidence of the Lower Ganges-Brahmaputra Delta, Bangladesh. Earth-Science Rev. 224, 103887. doi:10.1016/j.earscirev.2021.103887
Stedmon, C. A., and Bro, R. (2008). Characterizing Dissolved Organic Matter Fluorescence with Parallel Factor Analysis: A Tutorial. Limnol. Oceanogr. Methods 6, 572–579. doi:10.4319/lom.2008.6.57210.4319/lom.2008.6.572b
Stedmon, C. A., Markager, S., and Bro, R. (2003). Tracing Dissolved Organic Matter in Aquatic Environments Using a New Approach to Fluorescence Spectroscopy. Mar. Chem. 82, 239–254. doi:10.1016/S0304-4203(03)00072-0
Stedmon, C. A., and Markager, S. (2005a). Resolving the Variability in Dissolved Organic Matter Fluorescence in a Temperate Estuary and its Catchment Using PARAFAC Analysis. Limnol. Oceanogr. 50, 686–697. doi:10.4319/lo.2005.50.2.0686
Stedmon, C. A., and Markager, S. (2005b). Tracing the Production and Degradation of Autochthonous Fractions of Dissolved Organic Matter by Fluorescence Analysis. Limnol. Oceanogr. 50, 1415–1426. doi:10.4319/lo.2005.50.5.1415
Tareq, S. M., Rahaman, M., Rikta, S., Islam, S. N., and Sultana, M. S. (2013). Seasonal Variations in Water Quality of the Ganges and Brahmaputra River, Bangladesh. Jahangirnagar Univ. Environ. Bull. 2, 71–82. doi:10.3329/jueb.v2i0.16332
The Himalayan Climate and Water Atlas (2015). The Ganges River Basin. Available at: https://www.grida.no/resources/6685 (Accessed November 1, 2021).
Uddin, M. J., and Jeong, Y.-K. (2021). Urban River Pollution in Bangladesh during Last 40 years: Potential Public Health and Ecological Risk, Present Policy, and Future Prospects toward Smart Water Management. Heliyon 7, e06107. doi:10.1016/j.heliyon.2021.e06107
Ullah, H., Islam, M. N., and Malak, M. A. (2010). Charland Dynamics of the Brahmaputra-Jamuna River in Bangladesh. Jahangirnagar Rev. Part II: Social Sci. XXXIV, 167–184. doi:10.13140/RG.2.1.3324.3282
Wagner, S., Riedel, T., Niggemann, J., Vähätalo, A. V., Dittmar, T., and Jaffé, R. (2015). Linking the Molecular Signature of Heteroatomic Dissolved Organic Matter to Watershed Characteristics in World Rivers. Environ. Sci. Technol. 49, 13798–13806. doi:10.1021/acs.est.5b00525
Wu, J., Zhang, H., He, P.-J., and Shao, L.-M. (2011). Insight into the Heavy Metal Binding Potential of Dissolved Organic Matter in MSW Leachate Using EEM Quenching Combined with PARAFAC Analysis. Water Res. 45, 1711–1719. doi:10.1016/j.watres.2010.11.022
Wünsch, U. J., and Murphy, K. (2021). A Simple Method to Isolate Fluorescence Spectra from Small Dissolved Organic Matter Datasets. Water Res. 190, 116730. doi:10.1016/j.watres.2020.116730
Yang, L., Chang, S.-W., Shin, H.-S., and Hur, J. (2015). Tracking the Evolution of Stream DOM Source during Storm Events Using End Member Mixing Analysis Based on DOM Quality. J. Hydrology 523, 333–341. doi:10.1016/j.jhydrol.2015.01.074
Yang, L., Zhang, J., and Yang, G.-P. (2021). Mixing Behavior, Biological and Photolytic Degradation of Dissolved Organic Matter in the East China Sea and the Yellow Sea. Sci. Total Environ. 762, 143164. doi:10.1016/j.scitotenv.2020.143164
Keywords: Dissolved organic matter, fluorescence spectroscopy, excitation-emission matrix, parallel factor analysis, anthropogenic activities
Citation: Niloy NM, Shammi M, Haque MM and Tareq SM (2022) Investigating Dissolved Organic Matter Dynamics in the Downstream Reaches of the Ganges and Brahmaputra Rivers Using Fluorescence Spectroscopy. Front. Earth Sci. 10:821050. doi: 10.3389/feart.2022.821050
Received: 23 November 2021; Accepted: 04 May 2022;
Published: 20 June 2022.
Edited by:
Francien Peterse, Utrecht University, NetherlandsCopyright © 2022 Niloy, Shammi, Haque and Tareq. This is an open-access article distributed under the terms of the Creative Commons Attribution License (CC BY). The use, distribution or reproduction in other forums is permitted, provided the original author(s) and the copyright owner(s) are credited and that the original publication in this journal is cited, in accordance with accepted academic practice. No use, distribution or reproduction is permitted which does not comply with these terms.
*Correspondence: Mashura Shammi, bWFzaHVyYTkyNkBqdW5pdi5lZHU=; Shafi M. Tareq, c210YXJlcUBqdW5pdi5lZHU=
†ORCID: Mashura Shammi, orcid.org/0000-0001-5449-4761; Shafi M. Tareq, orcid.org/0000-0002-6417-3846