 D. Toma-Danila
 A. Tiganescu
 D. D’Ayala
 I. Armas
 L. Sun
- 1National Institute for Earth Physics, Ilfov, Romania
- 2Academy of Romanian Scientists, Bucharest, Romania
- 3Department of Civil, Environmental and Geomatic Engineering (EPICentre), University College London, London, United Kingdom
- 4Faculty of Geography, University of Bucharest, Bucharest, Romania
Earthquakes can generate a significant number of casualties within seconds, as well as high economic losses. The lack of rapid and coordinated emergency intervention can contribute to much greater losses. In this paper we develop a framework taking advantage of the ArcGis Network Analyst extension, able to account for post-earthquake conditions and reflect travel times. By combining 1) network characteristics with 2) direct seismic damage information, 3) models to determine road obstruction potential, 4) traffic information and time-dependent post-earthquake modeling but also 5) emergency intervention facilities (hospitals or fire stations) and considerations regarding their functional limitations, this framework can provide important support for the management of emergency intervention but also for risk reduction planning. Main results consist of maps showing travel times for various scenarios and moments after an earthquake, inaccessible areas, vital roads for access or an identification of important facilities. As case study we chose Bucharest, one of Europe’s most endangered capitals considering the seismic risk level. The city was and could be considerably affected by earthquakes in the Vrancea Seismic Zone, being characterized by a high number of vulnerable buildings and by one of the greatest typical traffic congestion levels in the world. Compared to previous network studies for Bucharest, the new approach is more complex and customable, providing means for real-time integration and time-dependent analysis. Results, for a worst-case scenario, prove that the risks could be even greater than expected, but also what should be done to mitigate them, such as the construction of a new hospital in the western part of the city, ensuring safe delimited routes for emergency vehicles or expanding the treatment capacity of actual hospitals—some of which also need seismic retrofitting. Results of this study will be integrated in the revised version of the National Conception for Post-Earthquake Response—an operational framework which will lead to risk mitigation through the improvement of post-disaster reaction.
Introduction
Transportation networks are strategically crucial to the post-shock recovery and resilience. As demonstrated by several recent real-world seismic events (among which Wenchuan, China, 2008; Haiti, 2010; Maule, Chile, 2010; Tohoku, Japan, 2011; Gorka, Nepal, 2015; Central Italy, 2016 or Sulawesi, 2018), road networks have turned out to be vulnerable both directly and indirectly, contributing to significant additional losses. Problems can vary depending on location (urban or rural), scale (structural or systemic) and damage type (direct or indirect). Of particular relevance to the improvement of emergency intervention management is the time-dependent status of the systems considered and the quality and quantity of information relating to such status. This usually increases and changes in nature as time from the disruptive event elapses but can also be affected by secondary events as time progresses, overlapping the immediate response and recovery phases. An adaptive time-dependent framework for analyzing emergency intervention travel times will enable relevant stakeholders to identify specific risks of interest and formulate relevant coordinated demands for preparedness and response actions.
In order to mitigate the risks due to delayed response, a good understanding of intervention capabilities as well as travel times under various conditions is needed. The possibility of integrating live data regarding traffic, incidents or the status of emergency facilities and vehicles—taking advantage of recent technological progress (from IoT devices to big data analysis but also with regards to crowdsourcing, as described in Finazzi, 2020), should be one of the key inputs to be considered in the methodological development. By analyzing recent articles in the field of study, among which Franchin et al. (2006), Pinto et al. (2012), Miller (2014), Jenelius and Mattsson (2015), Hirokawa and Osaragi (2016), Hackl et al. (2018), or Rohr et al. (2020) and evaluating recent earthquakes, we identified some of the main aspects to consider when modeling travel times after earthquakes, in order to evaluate the performance of the rapid response:
- Medical treatment facilities (such as hospitals), characterized by location, structural or functional vulnerabilities (including back-up systems in case of emergencies or reach-time to work place for personnel), specialties (more or less relevant for specific emergencies), staff characteristics, number of beds, equipment, ambulances etc.;
- Facilities for emergency intervention (such as fire-stations or operative centers), characterized by location, structural or functional vulnerabilities, number and type of vehicles (with various features), staff characteristics, equipment etc.
- Directly affected infrastructure components (from bridges to traffic-lights - also due to blackouts) and road incidents, all with implications on traffic flow; these could be reported in the various applications currently available, making a real difference—if data communication would still be functional;
- Affected areas where intervention might be needed, number of potentially affected people, demand for specific rescue forces and on-site accessibility for rescue vehicles;
- Identification of roads potentially obstructed by building debris, based on street characteristics (Figures 1A,B illustrates some of the problems in Bucharest, right after the 4 March 1977 earthquake);
- The potential effects of aftershocks and the multi-hazard and multi-risk dimension;
- Traffic pattern changes: A modelling of initial traffic values and post-earthquake modifications (using the previously mentioned aspects), which can be related to multiple causes such as the people desire to ensure that their relatives or assets are safe, people evacuating affected areas or entering them with rescue or transit purposes, people in need to reach their jobs as responsible in emergency situations etc. In many cases, post-earthquake traffic is characterized by the violation of circulation rules. For a real account of the situation, live data crowd-sourced or from emergency vehicle’s GPS devices and traffic monitoring devices would facilitate a good understanding of the traffic status and proper management decisions, as well as validation for traffic models. The analysis could also account for various traffic management decisions.
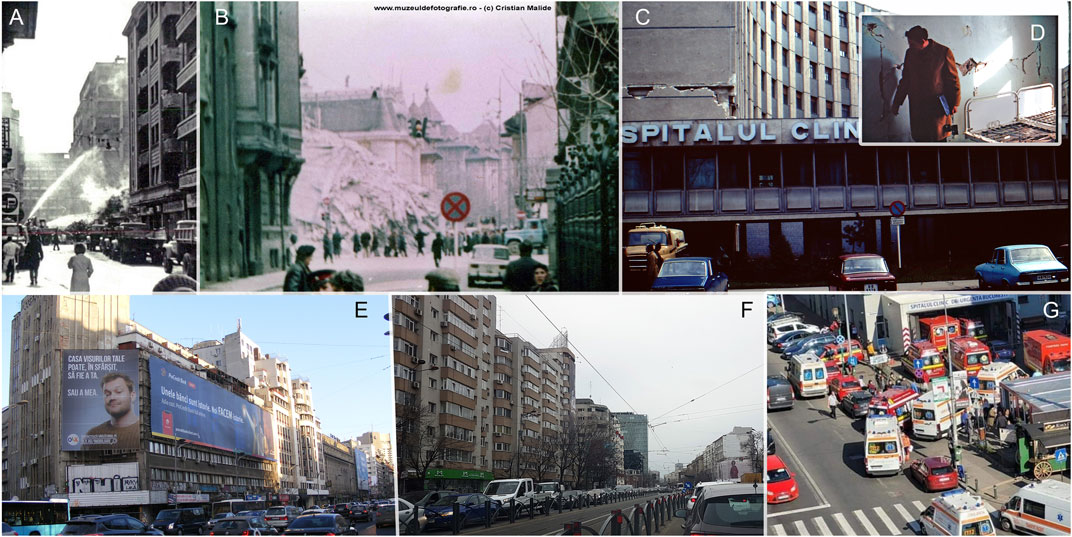
FIGURE 1. Damage due to the 4 March 1977 earthquake in Romania, leading to the blockage of streets [(A,B); source: Malide Cristian/muzeuldefotografie. ro] and to Floreasca Clinical Emergency Hospital evacuation (C,D). The figure also presents actual problems in Bucharest: vulnerable buildings (E) and traffic congestion (E,F), the importance of delimited tramway lines accessible also to emergency vehicles (F) and ambulance queue formed in front of the Floreasca Clinical Emergency Hospital due to multiple COVID-19 cases (G) (source: Lapovita Ana).
Given that hospitals play one of the most important roles in post-earthquake situations—on them depending the save of many lives in express need of medical care, we consider as a necessity to focus on these facilities and travel times from and toward them. Recent experiences in our case study area Bucharest but also in other areas highlight important aspects to consider, regarding the risks of medical treatment facilities:
- Structural and non-structural damage of hospitals, as well as limited patient treatment capacity and shortage of medical personnel are significant threats. These can render a hospital not functional at some point after the earthquake and lead to the necessity of a viable alternate solution. That is why in an important performance indicator should refer to the availability of other hospitals to take over the rescue effort. As real experiences in Bucharest, we mention that after the 4 March 1977 Vrancea earthquake, the 1,500 patients of the Floreasca Clinical Emergency Hospital needed to be evacuated 1 day after the earthquake, given that after rapid structural inspection the building was considered unsafe (Figures 1C,D).
- Not all hospitals can cure typical wounds due to earthquakes. As Hotz et al. (2011) shows, for the Haiti earthquake in 2010 the most common injury diagnoses due to earthquakes are fractures/dislocations, wound infections, and head, face, and brain injuries. The most common injury-related surgical procedures were wound debridement/skin grafting, treatment for orthopedic trauma, and surgical amputation. In case of fires due to earthquakes, also burns will need to be treated.
- The mistreating of patients with medical problems (example: The case of patients with severe burns affected by nosocomial infections, after the Colectiv Club fire in Bucharest—Marica, 2017)
- The chaos in and around the hospitals could be a significant issue, right after earthquakes. In the case of Floreasca Clinical Emergency Hospital, located close to affected areas, in the first hour following the 1977 earthquake road access was very difficult and had to be handled by volunteers (Buhoiu, 1977); also, the COVID-19 pandemic showed this feature during the peak of its waves (Figure 1G).
- Additional risk in the context of the COVID-19 pandemic. Some hospitals or some of their sections are devoted, starting with 2020, to the treatment of COVID-19 patients only. Many hospitals are overcrowded especially during surges, so the collapse and potential fire outbreak (with increased vulnerability due to substances for ventilation) could lead to multiple victims—not to mention the loss of vital medical personnel. In 2020 and 2021, fires occurred in 11 hospitals in Romania (Milonean, 2021), especially in the intensive care units—without the contribution of earthquakes. In case of hospital evacuation, the limited relocation capabilities, the potential mix of patients and the neglecting of pandemic rules (sometime forced by the circumstance, as earthquake are hazards of surprise) can lead to a significant increase of COVID-19 cases. Hygiene problems can also be a major issue. The recent experience of the March 2020 earthquake in Croatia was documented to not have caused a significant increase in COVID-19 cases following the event (Čivljak et al., 2020), although many hospitals needed to be evacuated, among the patients being 22 persons confirmed with COVID-19. The Haiti earthquake in August 2021 showed a different facet: that a large number of medical facilities destroyed (66 in Grand’Anse, Nippes and Sud, following this event) can lead to lack of access to basic services—for 34% of the people in earthquake affected-areas (Bagaipo and Janoch, 2021) and as such to limited vaccination rates; the consequences are yet to be evaluated. The analysis of the Epirus and Samos earthquakes but also the Evia flood and Ianos storm in Greece, in 2020, has shown no major contribution to the increase in the number of COVID-19 cases (Mavroulis et al., 2021), but as authors mention, various circumstances and number of casualties can have high impact on the rate.
In the face of increased exposure, climate change or unpredictable hazards such as earthquakes (which can trigger other hazards), societies have ever complex and bigger challenges in order to improve resilience. As cities, their infrastructures and the means of transportation constantly change, travel time and the analysis of implications on people, economy and development needs to be a continuous effort. Many cities have been significantly affected by earthquakes—Bucharest, capital of Romania, being one of them. Lessons of the past have not necessarily been learned. Much has changed since the previous major events in the Vrancea Zone, on 10 November 1940 (Mw 7.7) and 4 March 1977 (Mw 7.4)—the latest leading to the collapse of 32 moderate and high-rise buildings in the city, the death of 1,424 persons (90% out of the national total) and a 70% percentage of the total economic losses. Traffic is now a significant problem (Figures 1E,F)—Bucharest being ranked in terms of typical congestion level on the 11th place by INRIX (2021) out of 1,000+ cities, after being on the 2nd place in 2020, and on the 18th place by TomTom (2020) out of 416 world-wide. The very high seismic vulnerability of many buildings (including hospitals and fire stations), accompanied by limited access for emergency intervention in many areas due to the high number of cars parked illegally, could be the recipe for a greater disaster. Recent studies (such as Ianoş et al., 2017, Pavel et al., 2018, Toma-Danila, 2018, or Toma-Danila et al., 2020) have showed the need to improve emergency intervention access and planning in Bucharest.
In this article, our objective is to make additional steps toward a standardized and flexible time-dependent analysis, with applicability in legal procedures and near-real time implementation. New modeling components are added, such as the impact of delimited routes recently introduced for tramways but also emergency intervention vehicles (Figure 1F), a larger dataset of vulnerable buildings in Bucharest, more recent and reliable traffic data, a detailed dataset regarding hospitals and their importance in case of earthquakes as well as a quicker procedure for integrating OpenStreetMap road data and traffic values (with applicability to many other study areas).
The analysis, which will contribute to a new version of the Network-Risk toolbox (with the previous presented in Toma-Danila et al., 2020), is built upon ArcGIS with the Network Analyst extension. Its objective is the improvement of emergency intervention management in Romania, reflecting the need for less vulnerable and new hospitals, seismic retrofitting of residential buildings and traffic management planning in post-earthquake situations but also in typical conditions. Results are shaped to fit the needs of the National Conception for Post-Earthquake Response—an operational procedure used by the General Inspectorate for Emergency Situations in Romania, aimed to ensure a proper planning of intervention in post-earthquake conditions, which will be soon revised based on our input. As an additional connection, our analysis can be used to verify if the time frame mentioned in the National Law 95/2006 is eloquent in crisis situations. This states that the organization of qualified first aid services must ensure a maximum reach time (counted from the emergency call time) not exceeding 8 min in urban areas, for more than 90% of cases, and 12 min in rural areas, for more than 75% of cases.
Methods and Data
Flowchart of the Framework
When developing a decision-support system based on the analysis of travel times, multiple inputs and methodologies need to be considered. As Figure 2 shows, we refer in our framework to the following inputs:
- Road networks: we expand on this type of transportation network given that it is still the most used for the emergency intervention access. However, it could easily be replaced by railways or waterways. Off-roads can also be defined as well as multi-modal transportation.
- Traffic scenarios: Whether typical, specific or real-time data;
- Data regarding buildings and infrastructures damaged in various degrees by the mainshock and aftershocks (estimated or validated), but also by other types of hazards (such as tsunamis or landslides);
- The implication of building and infrastructure damage (as well as triggered hazards) on road network functionality loss, through an evaluation of debris potential to block the roads and changes in traffic patterns;
- Various facilities (hospitals, fire stations) with different functionalities but also resilience indicators;
- Various emergency units’ availability over time and restrictions (such as width of a street for access);
- Origins and destinations for economic activities, in order to further calculate the economic impact of network disruptions. Cost-benefit analysis could also be considered, with regards to aspects such as the suitability of building a new hospital versus consolidating an existing one, including location-based criteria.
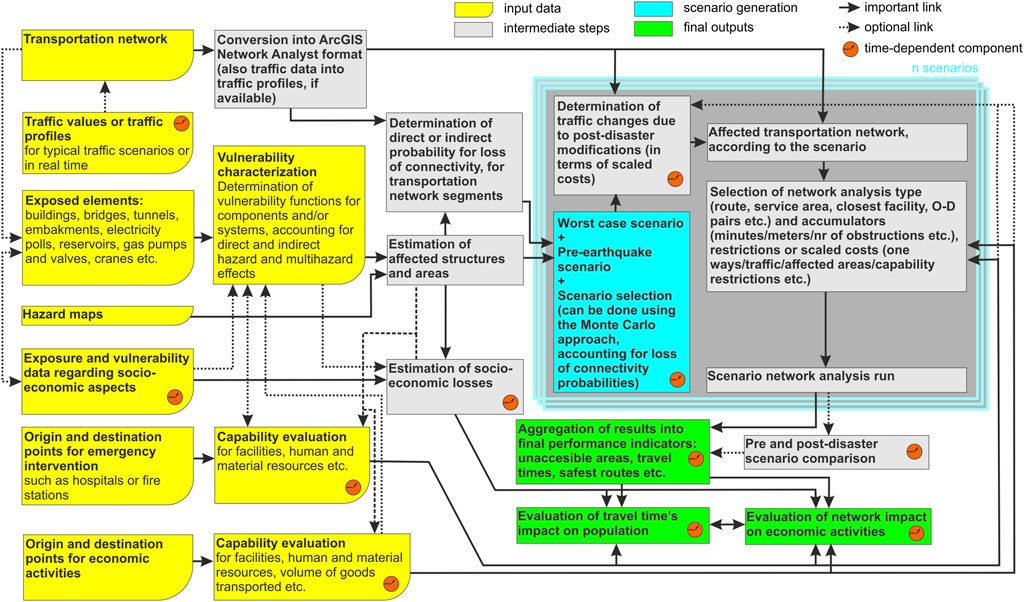
FIGURE 2. Flowchart of the framework, including time-dependent component classifications (modified from Toma-Danila et al., 2020).
The framework described in this article expands and improves the framework presented in Toma-Danila et al. (2020), making it also significantly different from other frameworks such as Pinto et al. (2012), Hirokawa and Osaragi (2016), or Rohr et al. (2020). Our approach also builds upon the previous work of Sun et al. (2021), novelties consisting of:
- The use of the historical traffic feature (ESRI, 2021; compared to using individual columns for cost computations), therefore providing an easier time-dependent analysis– both easy to define using traffic profiles and continuous (enabling simulations for earthquakes at any hour with limited amount of parameter recalculations);
- A new approach for calculating which road segments are partially of fully blocked by building debris;
- For network analysis, we now recommend and use the concept of barriers and scaled costs, which is more straight-forward than the previous ways of using special columns with times for each time interval and additional cost definitions (which could still be used however for tasks such as counting how many difficult to cross areas will be encountered);
- A computer-assisted methodology for converting rapidly free OpenStreetMap road data into the ArcGIS network format.
The framework is tested in ArcGIS with the Network Analyst extension—a popular commercial choice for complex network modeling. Among the recent studies relying on it, partially similar to our approach, we mention Sevtsuk and Mekonnen (2012), Shahabi and Wilson (2014), or Rohr et al. (2020). ArcGIS uses as shortest-path routing algorithms the widely used Dijkstra algorithm (ESRI, 2021), which provides a good balance between computational time and accuracy (Fan and Shi, 2010); optimized approaches such as hierarchy preferences are a good feature for testing large network datasets. The integration of other algorithms such as A*, Bellman-Ford, Floyd–Warshall or Johnson would be a good addition for research—ArcGIS’s Python script compatibility setting good premises. We chose ArcGIS due to its already available spatial analysis and network modeling functionalities but also GIS representation capabilities, which allowed us to test multiple input data setups, but also because it eases the use and customization for other interested researchers. ArcGIS’s Network Analyst extension also has the option to account for live traffic—by incorporating speed values from dynamic traffic format (DTF) files. Nevertheless, our framework could be also embedded using QGIS (making use of the QNEAT3 plugin) or Matlab’s graph and network algorithms.
Input Data for Bucharest
The data used in this study consists of:
- OpenStreetMap (OSM) vector road network of Bucharest and surroundings (Figure 2) from October 2021, downloaded from the Geofabrik GIS Data Portal (http://download.geofabrik.de) and reprocessed in ArcGis Network Analyst format through an almost fully automated procedure described in the Network-risk toolbox manual (Toma-Danila and Tiganescu, 2021). Compared to our previous studies (Toma-Danila et al., 2020 or; Toma-Danila, 2018), which used OSM road data from January 2016, October 2021 data has some important additions such as the A3 highway, the Nicolae Grigorescu passage or the Ciurel Passage. The chosen road network extent is also larger, allowing the analysis of many cities close to Bucharest, with significant dependencies on it. Given that emergency intervention vehicles can legally circulate on the asphalted specially delimited tramway lines (Figure 1F)—which creates a separate and generally safe (therefore faster) alternative access route, we identified and included these segments in the road network (Figure 3).
- Typical traffic is still a major issue (TomTom, 2020)—also in the COVID-19 period (INRIX, 2021), in which, except for lock-down intervals, people used cars more often, given considerations regarding an increased exposure in public transport vehicles. Measures taken in the last years, such as stricter regulations for parking space in the city center, opening of underground parking lots and installation of pavement blockers have reduced the amount of traffic lanes blocked by illegal parking, but still there are significant issues limiting the road’s functional space (too many cars and to less care about the law). As typical traffic data we used Area Analysis Data from TomTom Traffic Statistics available via TomTom’s MOVE portal (TomTom, 2021), averaged for the 1 to 21 April 2019 (with orthodox Easter being on 28 April 2019 so no major influence of holidays being induced). Data was available only for the 1-3 Local Time (LT), 8-10 LT and 16-18 LT intervals. To differentiate between weekdays and weekends we used as proxy 0.6 respectively 1.2 multiplication factors to average speeds, deduced from result comparison with Google Maps typical traffic queries for representative routes. Given that TomTom road data for which traffic data is available is different from OSM data (including only important roads), we used the near function in ArcGis to associate the closest average speed values to the OSM road segments (for segments closer than 200 m), giving satisfactory results. For other segments we applied the OSM maximum speed and for tramway road-accessible segments we used the 50 km/h speed. In order to generate 24/7 profiles in ArcGIS, we relied on the TomTom values but also adjusted some profiles based on local knowledge and Google Maps traffic verification for some time intervals.
- A new dataset regarding all hospitals (both public and private) in Bucharest and Ilfov nearby county– a significant extension from the dataset used in previous studies such as Toma-Danila (2018) and Toma-Danila et al. (2020). This also provides information regarding treatment capabilities, in earthquake emergency situations or not. Based on it and the feedback of people involved in disaster medicine we classified hospitals in terms of importance in case of earthquakes, considering both treatment capacity, available personnel and an expert-based evaluation of typical destinations for ambulances. For some hospitals, an evaluation of seismic vulnerability is provided. Currently, among the hospitals acknowledged by expertise to have significant seismic vulnerability in Bucharest (ISUBIF, 2021) are the Bagdasar-Arsenie Emergency Hospital, the Gorgos Psychiatry Hospital (Titan) and the Bucur Maternity—in seismic risk class (SRC) I—the greatest probability of collapse, the Fundeni Clinical Institute’s B building, housing 1,000 patients and 2000 medical personnel, with SRC II (still considerable collapse probability) and the Floreasca Hospital’s A building—with SRC II. For many hospitals we don’t have public information regarding the results of seismic evaluation.
- Location of (mostly residential) buildings individually evaluated by engineers and classified in SRC I and II (out of IV) or urgency categories (older classification), on official lists from the Municipal Administration for the Consolidation of Buildings with Seismic Risk (AMCCRS), georeferenced by RE:RISE and geo-spatial.org (2021). These are not all highly vulnerable buildings in Bucharest, still they represent a significant typology of buildings which were affected during the 1977 earthquake: high-rise reinforced concrete buildings built before 1940. As the National Census in 2011 shows, there are at least 31,430 residential buildings older than 1947 in Bucharest. Out of these, 295 have at least 6 floors—category shown to be highly vulnerable during the 1940 and 1977 Vrancea earthquakes (Toma-Danila and Armas, 2017). 263 are on the AMCCRS list—115 being in SRC I, 110 in SRC II, 15 in SRC III and 23 being consolidated. Additionally, 26,349 buildings are constructed between 1947 and 1960. The first compulsory seismic design code was introduced in 1963, so the scale of the disaster could be considerable (Figure 4B provides glimpses of the situation).
- For determining the road obstruction potential due to building collapse, we calculated the debris footprint of buildings in SRC I and II and in urgency categories. We used the empirical equation in WP6 of the RISK-UE Project (as mentioned in Franchin et al., 2011), which was determined based on the observations done after the Kocaeli 1999 earthquake for collapsed RC buildings (representative typology also for Bucharest): Debris footprint (meters) = ⅔ * number of floors. This provided satisfactory results, as Figure 5 shows and also easy implementation for multiple scenarios runs. By converting road polylines into polygons based on their number of lanes and hierarchy we were able to partially automate the process of detecting full or partial obstruction due to building debris. This was done firstly by accounting that some road segments completely blocked by debris split into segments; therefore, by using the ArcGIS erase and intersect functions, identifying afterward the duplicate segments, we found the fully or partially obstructed road segments. We also verified if there are missing segment (completely covered in debris) and re-added them. More complex equations, considering also adjacency of buildings or debris footprint for different building damage states, such as Argyroudis et al. (2015), Zanini et al. (2017) or Yu and Gardoni (2021) will soon be tested in a future paper, also with on-field analysis.
- For bridges, tunnels and passages in Bucharest we did not have damage potential reports available; by applying typical fragility functions from the Syner-G Project, we showed in Toma-Danila et al. (2020) that limited complete damage is expected in Bucharest—as the 1977 earthquake showed. However, by using visual inspection and warning issued also in mass-media, some structures can be considered to a greater degree prone to seismic damage: The Constanta passage but also the Basarab passage, which is relatively new but poorly maintained and due to its long span can have both structural and traffic problems leading to blockage. We tested what could be the travel time impact if these structures collapse.
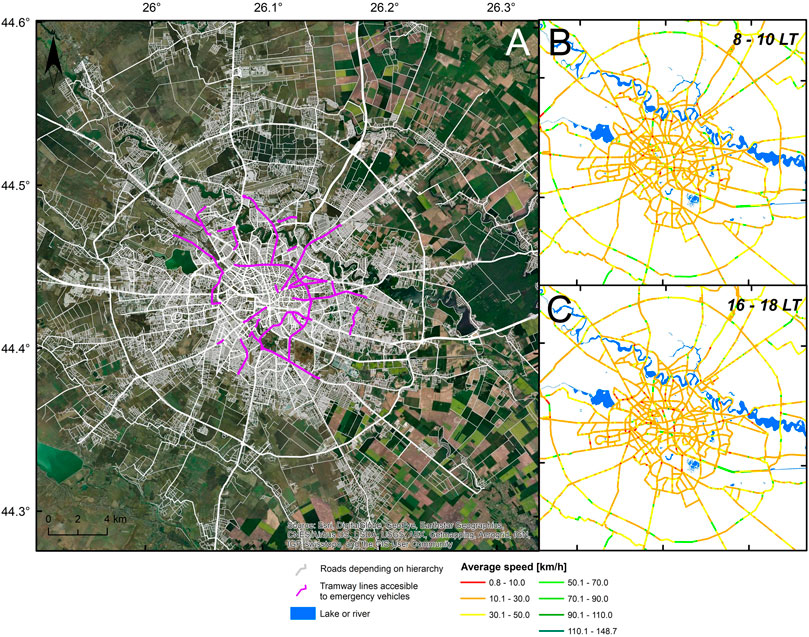
FIGURE 3. OSM road network for Bucharest and surroundings, used in this study (A) and typical traffic values according to TomTom data (B,C), showing the TomTom less complex road network, comprising of higher hierarchy roads.
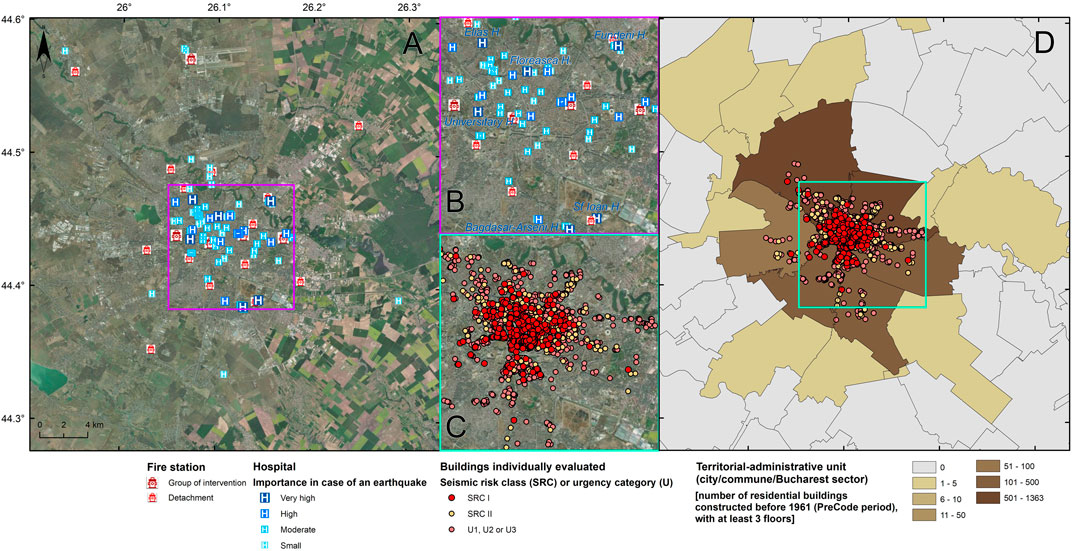
FIGURE 4. Location of hospitals and fire-stations (A) and residential buildings with SRC I, II and in urgency categories as well as number of residential buildings constructed before 1961, with at least 3 floors, according to the 2011 National Data Census, at city/commune/sector level (D). The zoom windows (B,C) show the city center and the names of very important hospitals (B).
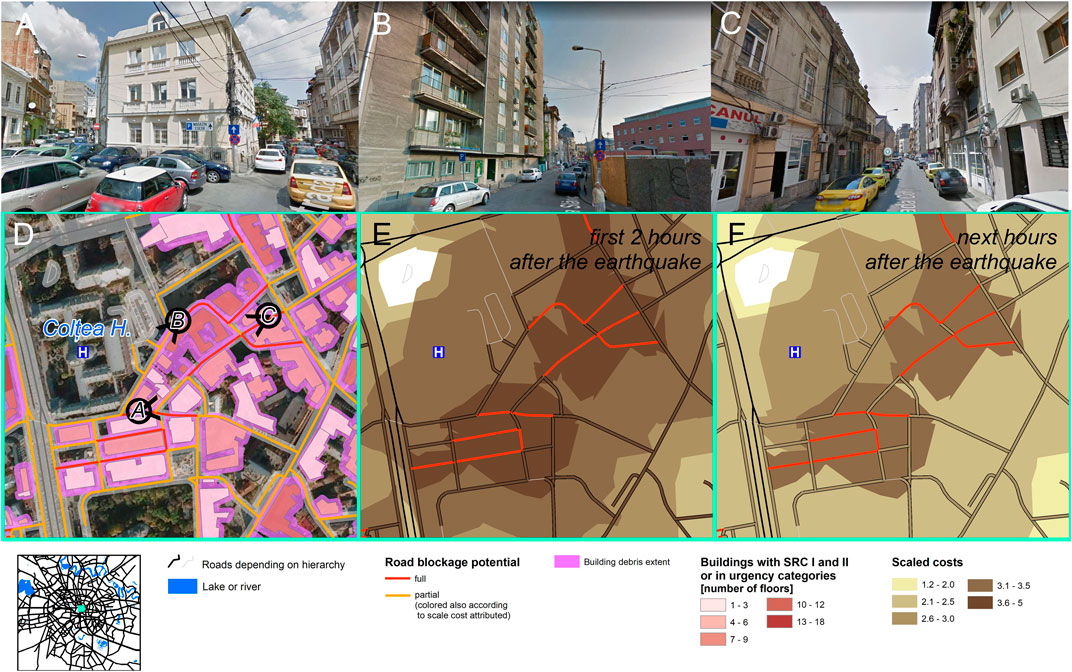
FIGURE 5. An example of results of the automatic determination of fully or partially blocked road segments due to building debris (D) for a central area near the Coltea Hospital, and exemplification of the real situation [(A–C)—source: Google Street View). Scaled costs calculated using Table 1 are also represented (E,F).
In order to facilitate the replicability, improvement and integration of data in other studies, both OSM Bucharest network road data in the ArcGIS network format and data regarding hospitals and fire stations in Bucharest and Ilfov county can be retrieved from Mendeley Data (Toma-Danila, 2021a; Toma-Danila, 2021b; Toma-Danila, 2021c).
Modeling Post-earthquake Traffic
This task is one of the most difficult given the many modeling parameters and uncertainties. Detailed procedures have been tested through the time, in studies such as Feng et al. (2021) or Aydin et al. (2018), but still validation with real post-earthquake data is limited. Among the complex systems we mention MATSIM or Simulation of Urban Mobility (SUMO), which was recently used in Costa et al. (2020). The Freeways video game (Captain Games, 2017) and its logic might also provide interesting insights on the problem and solutions. All post-earthquake traffic modeling results can be incorporated in our methodology—in the form of polygons with various scaled costs increasing the time needed to travel in a specific area. For this study we chose to test a basic yet flexible methodology, following the next steps:
a) Selection of buildings affected by the earthquakes (Monte Carlo approach can be used, as in Toma-Danila et al., 2020);
b) Determination of road segments affected by debris completely or partially;
c) calculation of service areas around these segments in terms of meters. If desired, a differentiation between completely and partially affected segments can be made - as traffic might be more influenced near completely blocked road segments. We used service areas of 100, 200, 300, 400 and 500 m.
d) calculation of service areas around hospitals, with variable meter distance depending on hospital importance. We used 200 m for most important hospitals and 100 m for the others.
e) use of the ArcGIS union function to merge all service area polygons (explode multipart features if needed) and assign scaled cost values in a specific column. We used the costs in Table 1, after consultations with emergency stakeholders (future incidents—not necessarily earthquakes—could help validate these assumptions, so we will find new solutions for determining analytically these costs). In polygons with multiple scaled costs from different sources we calculated the maximum scaled cost and added an additional cost depending on scaled costs from multiple sources of traffic. Then we summed all potential values (with minimum 4 and maximum 11). For values greater than 7.5 (a highly congested area, judging by the scores) we added to the maximum value 0.5 and for values between 6.5 and 7.4 we added 0.3.
f) Run of Route, Service Area, Closest Facility or O-D cost matrix analysis for hospitals of various importance, with scaled costs for the previously determined service area polygons. Also add to these polygons lines/polygons for road segments affected by buildings: completely blocked segments as restrictions and partially blocked segments with a scaled cost of 5 for the first 2 hours after the earthquake and 3 for the next hours.
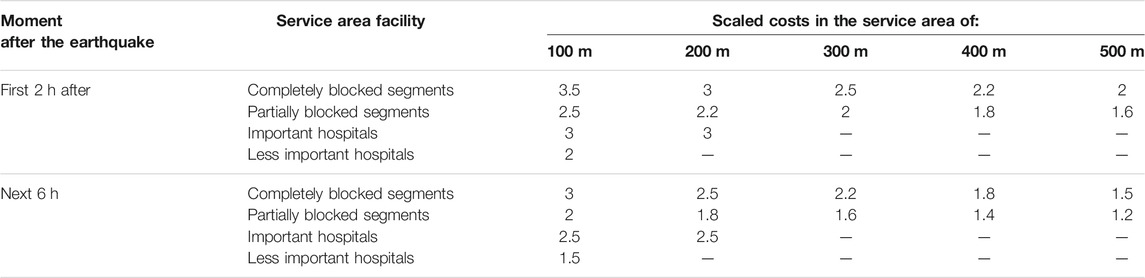
TABLE 1. Scaled costs considered for Bucharest.
Results for Bucharest
Our study presents a new framework, emphasizing with practical examples its potential. Given that the challenges for Bucharest are significant—both in terms of scale (a 2 million people city plus the surroundings) and risks, our study aims to contribute directly to improving emergency intervention management, fitting within the National Conception for Post-Earthquake Response. As such, we organize our results in subchapters that provide direct answers to questions often asked by emergency responders and planners—relevant also for many other cities.
Which Areas Could Become Inaccessible?
By using service area analysis with detailed generation of polygons, for a greater-than-expected sole break (we used 300 min), areas inaccessible to reach can be identified. For the generation of Figure 6 (and most of the following figures), we considered a worst-case scenario in which all buildings in SRC I, II and urgency categories are considered to be affected, even though in reality the chances are quite few—at least for complete collapse; however, it is to be kept in mind that beside buildings on the AMCCRS list there are much more vulnerable buildings in Bucharest, as demonstrated above. Given that we had two classifications of building debris impact (fully or partially blocking the roads), we run the analysis and represented the results differently. Given the methodological limitations (the empirical equation for debris area calculation, not considering the adjacency of other buildings—epistemic uncertainty, as Figure 5B shows for a segment considered to be partially blocked), but also aleatory uncertainty, it is safer to consider a wider extent of the inaccessible area and not just the red polygons. In this way, a significant potentially inaccessible area in eastern part of the city center can be identified, but also other areas relatively great in size (the minibox of Figure 5).
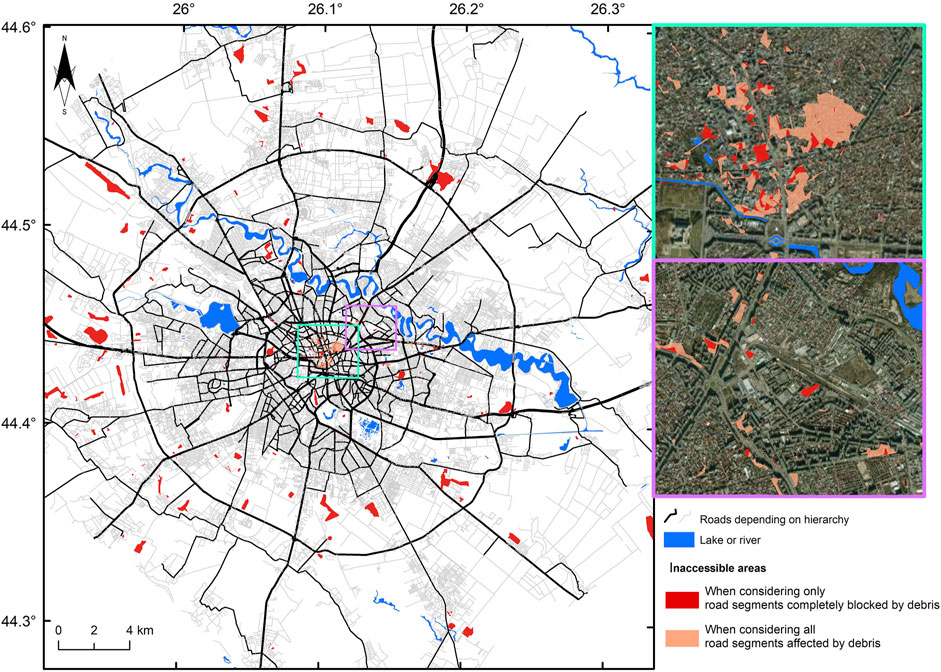
FIGURE 6. Map showing the potentially inaccessible areas, for the worst-case scenario—all SRC I, II and urgency categories buildings collapsing.
How long would it take for ambulances and fire trucks to reach a location (or vice versa)?
Results of our methodology can show which areas are harder to reach by firefighters or ambulances—therefore having an increased potential of fire spreading or risk for emergency victims (when making correlations with graphs such as the golden-hour medicine time—Hekimoglu et al., 2013 or Goncharov, 1997).
Although our analysis can be performed for any time interval, we chose for this article the following representative scenarios, in order to reflect both the city’s maximum risk compared to minimum:
- Earthquakes occurring at 2 (a.m.) LT and 8 (a.m.) LT, on a typical weekday;
- Time-dependent snapshot of the situation 3 h after the earthquake (at 5 and 11 LT)
- For the same time intervals, we computed travel times in no earthquake conditions, in order to facilitate comparison (Figure 7);
- Service Area analysis was performed with hierarchy enabled (given that preference for main roads is most possible also for moderate or large-size emergency intervention vehicles), no one-way restrictions, generalized polygons, toward facilities for hospitals of very high and high importance in case of earthquakes (Figure 7) and away facilities for fire-stations (Figure 8).
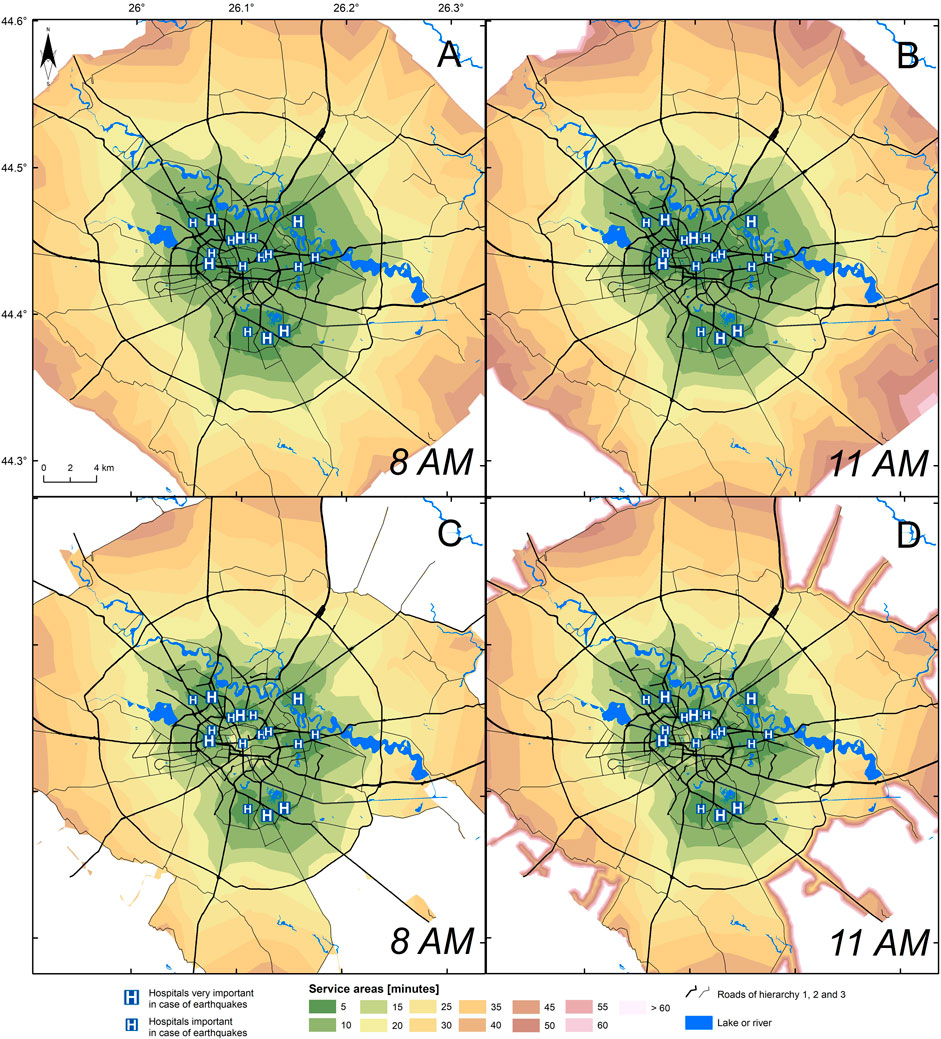
FIGURE 7. Maps showing Service Area times for hospitals with very high and high importance in case of earthquakes, in pre-earthquake (A,B) and post-earthquake (C,D) conditions, for an earthquake occurring at 8 LT on a typical weekday.
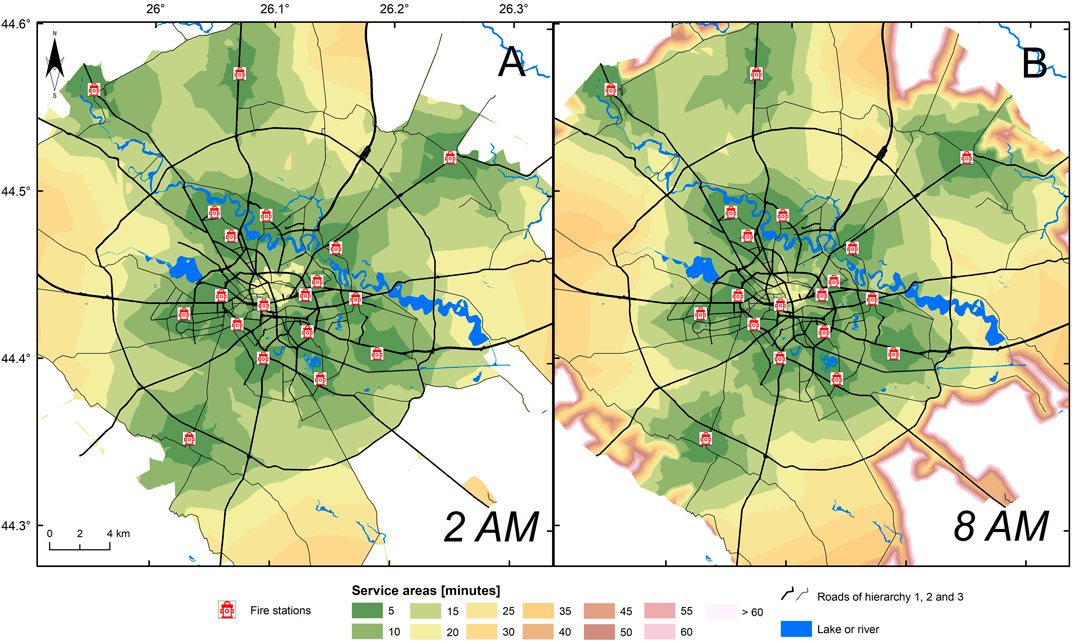
FIGURE 8. Maps showing Service Area times for fire stations, in post-earthquake conditions, for an earthquake occurring at 2 LT (A) and at 8 LT (B) on a typical weekday.
In order to show the importance of safe routes for emergency intervention vehicles (such as the tramway line segments in Bucharest), we performed a Service Area analysis for the highly important emergency hospital Floreasca, located near such safe routes. Figure 9 shows the time-travel differences between using and not using these safe routes, for the earthquake occurring at 8 LT described above.
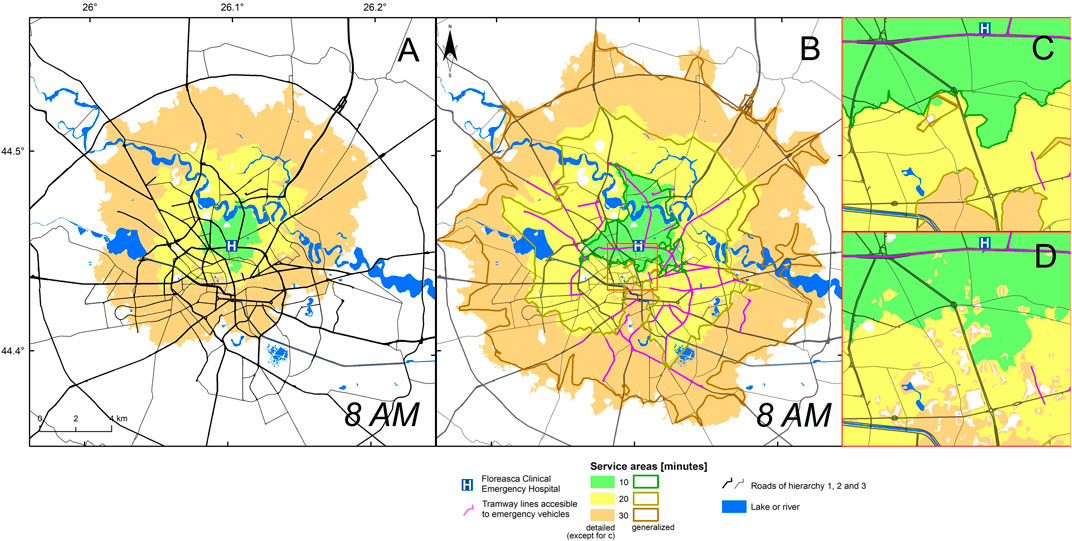
FIGURE 9. Maps showing service areas for the Floreasca Clinical Emergency Hospital, in post-earthquake conditions, for an earthquake occurring at 8 LT on a typical weekday, without (A) and with (B) the asphalted specially delimited tramway lines. The zoom maps show service areas polygons created by ArcGIS with the generalized (C) and detailed (D) option.
As reflected by Figure 9, the generalization of Service Area polygons in ArcGIS smooths the shapes (and also improves the computational demands) but the results fail to show small road segments becoming not accessible due to building debris and sudden increases in traffic values. For decision makers, an additional layer such as the one in Figure 6 should be overlayed.
Most vulnerable areas in case of an earthquake, due to limited connectivity, can be identified by service area analysis. Various emergency facilities and their characteristics can be considered (such as treatment capacity), but also considerations regarding second or third best available choices, as indicators of backup and resilience. Maps showing systemic resilience can be developed, using an index such as the one in Toma-Danila et al. (2020). In this study we however chose to present, in the context of time-dependent analysis, an example based on Closest Facility analysis and timeline graphs (Figure 10) for a highly representative area: Calea Victoriei, in front of the 95 and 101 adjacent buildings with SRC I, which were affected by the 1940 and 1977 earthquakes and which are located in the city center, near many other vulnerable buildings. Both the area and representative routes can be seen in Figure 11.
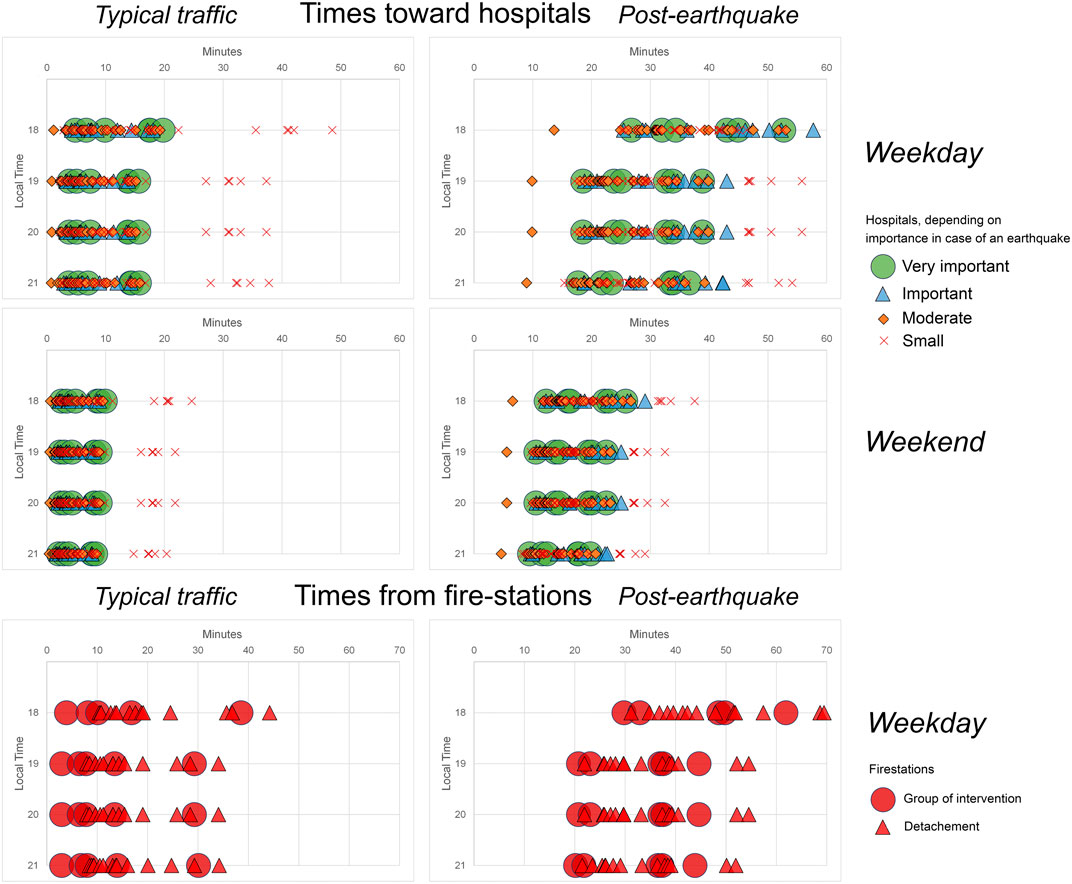
FIGURE 10. Graphs showing the time between the Calea Victoriei 95-101 location and hospitals and fire stations, for typical traffic (at 18—21 LT on a typical weekday and weekend) and post-earthquake traffic, for an earthquake occurring at 18 LT
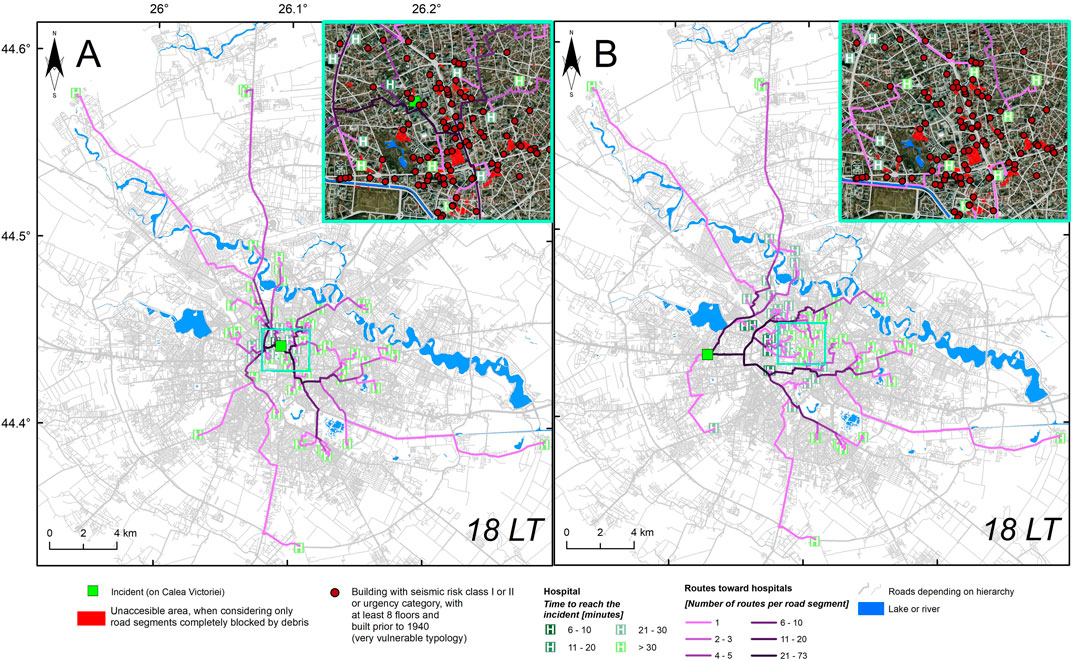
FIGURE 11. Maps showing safest and fastest routes toward hospitals, for two representative locations: Calea Victoriei 95—101 (A) and Iuliu Maniu Bd. 55 (B), in the case of an earthquake occurring at 18 LT on a typical weekday. Maps also show the number of roads overlapping per road segment.
Which would be the most important roads in emergency situations?
For identifying which are the most transited road segments in order to provide the quickest access to facilities (we used in our analysis all hospitals), we recommend the following steps in ArcGIS:
- Perform Closest Facility Analysis on a greater than 1 number of facilities to find;
- Run the identity function, between road segments and results of the Closest Facility Analysis
- Perform a query to keep only common segments
- Run the summary statistics function in ArcGIS for counting how many overlapping segments exist
- Make a join between the road network and the resulted table to map the values.
For a demonstration, we considered for the analysis two representative locations as incident point: Calea Victoriei 95–101 (in the city center) and Iuliu Maniu Bd. 55 in the Militari neighbourhood, near the Veteranilor Market, an area far from hospitals but where a high-rise building collapsed during the 1977 earthquake and others are on the AMCCRS lists. The first location is near inaccessible areas, still our analysis shows that, for our worst-case scenario, routes are available to all hospitals. Figure 11 shows routes critical (considering also hierarchy) for minimum access times to hospitals can be seen. A discrimination or weighting depending on hospital importance, showing also second-best routes and a graph comparison such as in Figure 10 can be further performed. Some branches, with darker colors, are clear—indicating a route important for access to multiple hospitals. There are also similar routes between Figures 11A,B; for multiple locations, a count of multiple routes would be very useful.
This procedure could be also relevant for multiple routes calculated between affected buildings and closest hospitals or fire stations, as it was done in Toma-Danila et al. (2020).
Bridges, tunnels and passages are important structures which enable a fast connection, crossing or bypassing critical points. If these, due to direct damage or other incidents (such as accidents), would become unsafe, what would be the implications on travel times? By using route analysis, we tested what would happen in low traffic condition, without any other post-earthquake scaled costs, if the Constanta and Basarab passages would be closed (Figure 12). As mentioned earlier, these structures have a relatively high potential of disruption in case of an earthquake. It can be observed that minimal transit times increase greatly in the case of the Constanta passage (with more than 5 min and more than double the distance)—showing that this is a critical point. In the case of the Basarab passage, there are more than 2 min of extra time; also, multiple routes, slightly higher in times, are available given the greater density of roads. However, post-earthquake traffic and the first-hours chaos could greatly increase the times.
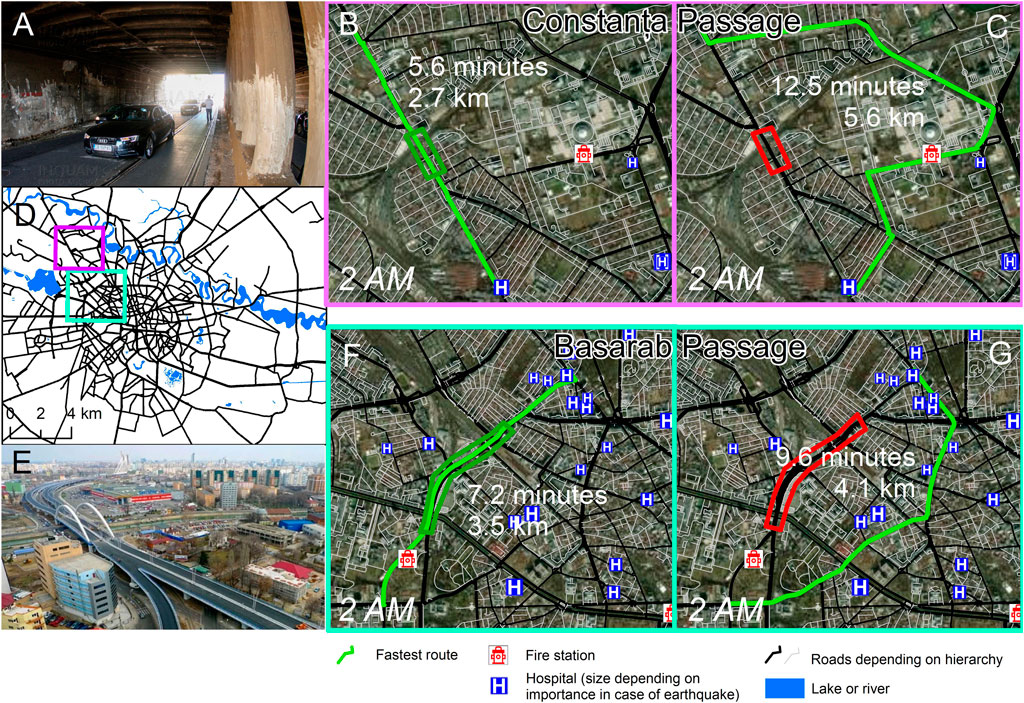
FIGURE 12. Maps showing the time between representative points, when connected by the Constanta Passage (A,B) and Basarab Passage (E,F) and not connected by these structures (C,G), In no earthquake conditions, at 2 LT on a typical weekday. (D) shows the areas of the passages within Bucharest.
Discussion
Figures in this paper are just a selection aimed to show the main capabilities of our framework; within the National Conception for Post-Earthquake Response, we will provide more detailed figures for multiple time intervals, enabling a practical use of this tool in decision making. Our results can also contribute to the development of systemic vulnerability functions reflecting for example the delay potential in case of various earthquakes or functions reflecting hospital resilience (for example, for various time windows and earthquake loss scenarios, a function reflecting the number of patients, considering travel times), with links to the work of Sun et al. (2021). These could be developed in future studies, although due to the complexity of the modeling and the multiple sources of uncertainty, as well as the continuously updating input data, we think that the scenario-based approach presented in this paper can be more suitable for emergency management planning and in near-real time situations. Various scenarios for decision-based risk mitigation measures can be tested using our framework: The impact of imposing of traffic restrictions and of opening or reopening of specific road segments, at different times after the earthquake. The analysis could also be expanded to other types of transportation networks such as railways, in relation with evaluations regarding the utility of earthquake early-warning systems, as explained in Minson et al. (2021). When using electric, pipeline, gas or water pipeline networks, an approach such as ours could integrate resilience frameworks such as Leandro et al. (2021).
In order to enable near-real time implementation, it would require to embed (preferably automatically) in a system using our framework:
- Real traffic data, from providers such as Waze or from monitored emergency vehicles;
- Continuous updates of affected areas and how many emergency vehicles and of which type they require (can be also taken by drones);
- Continuous updates regarding hospital number of patients.
For time-dependent and real-time data integration capabilities, additional challenges can arise:
- Real data, regarding affected buildings and infrastructure or traffic incidents, continuously updates, therefore new information must be easily integrated; this data can also refer to the evolution of rescue activities and need of additional forces on sites, results of rapid structural inspection, repair works and their evolution, emergency facilities lack of functionality etc.
- No data doesn’t necessarily mean that the situation is good; in earthquake situations for example, the “doughnut effect” (Bossu et al., 2017) should be accounted for, otherwise less affected areas could be prioritized for intervention in the detriment of severely affected areas.
- Multiple sources of data need to be easily transferable in a network-modeling system; for example, in case of traffic data, different road datasets not joinable with between them (and a mistreating of from-to and to-from data) can lead to wrong travel times.
- Computational demands for complex network models could be extensive, therefore a selection of computational time-effective performance indicators needs to be performed.
- The impact of management actions (such as building instrumentation, mobile hospital deployment or establishment of dedicated emergency intervention routes) should be considered both in simulation and in real time.
What Could Be Improved Regarding Hospitals?
Some hospitals, due to their location close to affected areas but also due to treatment capacity and acknowledgment in the mental perception of citizens could be, in the first hours after an earthquake, much more crowded than others. This would be the case of the Floreasca and University Clinical Emergency Hospitals, which are both renowned institutions in emergency medicine and close to the city center. As Figure 9 shows, Floreasca Hospital (but also disaggregated data of Figure 7 for both hospitals) has a relatively good time coverage of all of Bucharest for the considered scenario, meaning that within an hour or two after the earthquake it could become overcrowded. Also, central locations such as Coltea Hospital would be highly busy—given the adjacency to the vulnerable city center and many hard-to-reach areas. In this area, the installation of a mobile hospital would be a good option and our type of analysis can and has served to the identification of reliable locations (Armas et al., 2020).
Given that in the western part of the city there are no hospitals with at least moderate importance capabilities in case of earthquakes (with higher reach time as shown by Figure 7), the need to build a hospital in this area is major, considering also the high seismic loss estimates shown in Toma-Danila and Armas (2017) and the multiple vulnerable buildings shown especially in the Militari neighborhood in Figure 4.
Conclusion
In the last years, multiple studies have started to analyze the direct and indirect effects of earthquakes on road networks, with a focus on the emergency intervention travel times between hospitals and affected areas. However, not many of them accounted for the time-dependent evolution of the situation, setting also premises for near real-time implementation. In this article we make steps forward, creating and testing a flexible framework which relies on already available and widely used GIS software (ArcGIS with Network Analyst extension). The framework links various relevant aspects reflected by real situations, such as traffic issues in post-earthquake situations, the impact of building debris on road networks but also characteristics of emergency facilities such as hospitals—important to consider as also reflected by the COVID-19 pandemic period. By using traffic profiles, scaled costs and restrictions to influence the typical traffic times we showed an easier yet satisfactory methodology of incorporating evolutionary traffic modelling and road blockages in the analysis.
As showed in this article, some of the outcomes of our framework, especially when implemented in near-real time, are that it:
- Plays an important role in post-earthquake traffic management, indicating roads that need to be accessible and areas where police intervention is needed to allow a decrease of travel times between affected areas and critical hospitals;
- Lets rescuers know which hospital they should send victims and on which route;
- Has a role in decision making, enabling the understanding of which hospitals to expand and where to place mobile hospitals not just in terms of adjacency to affected areas but also considering easy access to it.
Results will contribute to a more relevant National Conception for Post-Earthquake Response, indicating the actual risks due to high travel times in emergency situations and in reducing these risks through the need of seismic retrofitting (for residential buildings but also for hospitals and infrastructure elements), traffic management and increased capacities for critical hospitals or the construction of new facilities in specific areas (such as western Bucharest).
Given that the risk of Bucharest is significant and not easy to evaluate, also due to limited data available, we provide through this study also relevant GIS datasets regarding roads (based on OSM data), hospitals and fire stations. Also, through the version 2 of the Network-Risk toolbox (Toma-Danila, 2021a) we introduce a partially-automated and rapid methodology for the conversion of this data in ArcGIS format, which will facilitate the implementation of our analysis in many other case study areas.
Data Availability Statement
The datasets presented in this study can be found in online repositories (Toma-Danila 2021a, b and c). The names of the repository/repositories and accession number(s) can be found in the article/Supplementary Material.
Author Contributions
DT-D had the idea of the study and coordinated it, gathering also feedback from stakeholders interested in the outcomes of the study and creating all the figures. The analysis framework was defined by DT-D, DD’A, LS, and IA, while the modelling and software implementation was performed by DT-D and AT. DD’A, LS and IA provided important feedback on the state-of-the art and on the innovative potential of the study and considerably helped in structuring the document.
Funding
This study was supported by the following sources: Post-doctoral scholarship from the Academy of Romanian Scientists, Romania, for DT-D. TURNkey Project (Towards more Earthquake-resilient Urban Societies through a Multi-sensor-based Information System enabling Earthquake Forecasting, Early Warning and Rapid Response actions), financed by the European Union, H2020 Grant Agreement ID 821046, 2019-2022. PRE-QUAKE Project (Preparing for the next major earthquake: exploring new scientific opportunities), financed by the Romanian Ministry of Education and Research, CNCS—UEFISCDI, within PNCDI III, number PN-III-P1-1.1-PD-2019-0969, 2020-2022.
Conflict of Interest
The authors declare that the research was conducted in the absence of any commercial or financial relationships that could be construed as a potential conflict of interest.
Publisher’s Note
All claims expressed in this article are solely those of the authors and do not necessarily represent those of their affiliated organizations, or those of the publisher, the editors and the reviewers. Any product that may be evaluated in this article, or claim that may be made by its manufacturer, is not guaranteed or endorsed by the publisher.
Acknowledgments
We want to thank the OSM initiative and the TomTom (2021) team for providing highly detailed and accurate free datasets. Also, the experts in the emergency intervention and medical field which contributed to the hospital dataset and to the shape of the results and the RE:RISE and geo-spatial.org “După cutremur” initiative.
References
Argyroudis, S., Selva, J., Gehl, P., and Pitilakis, K. (2015). Systemic Seismic Risk Assessment of Road Networks Considering Interactions with the Built Environment. Computer-Aided Civil Infrastructure Eng. 30 (7), 524–540. doi:10.1111/mice.12136
Armas, I., Toma-Danila, D., Popovici, D., and Mocanu, R. (2020). Identifying Optimal Locations for mobile First Aid Facilities in Bucharest, Accounting for Seismic Risk. GeoP 5 (1), 7–14. doi:10.5719/GeoP.5/1
Axhausen, K. W., Nagel, K., and Axhausen, K. W. (2016). The Multi-Agent Transport Simulation MATSim. London: Press U. doi:10.5334/baw
Aydin, N. Y., Duzgun, H. S., Heinimann, H. R., Wenzel, F., and Gnyawali, K. R. (2018). Framework for improving the resilience and recovery of transportation networks under geohazard risks. Int. J. Disaster Risk Reduct. 31 832–843. doi:10.1016/j.ijdrr.2018.07.022
Bagaipo, J., and Janoch, E. (2021). How the Earthquake in Haiti Affected Access to COVID-19 Vaccine. CARE Website. Available at: https://www.care.org/news-and-stories/health/how-the-earthquake-in-haiti-affected-access-to-covid19-vaccine/(Accessed December 4, 2021).
Bossu, R., Landès, M., Roussel, F., and Steed, R. (2017). Felt Reports for Rapid Mapping of Global Earthquake Damage: The Doughnut Effect? Seismological Res. Lett. 89 (1), 138–144. doi:10.1785/0220170129
Buhoiu, A. (1977). “4 Martie 1977. Secunde Tragice, Zile Eroice. Din Cronica Unui Cutremur,” in Seria „Reporter XX” (In Romanian). Editor Junimea (Iasi, Romania: Iași).
Captain Games (2017). Freeway Video Game. Available at: https://captaingames.itch.io/freeways (Accessed December 5, 2021).
Čivljak, R., Markotić, A., and Capak, K. (2020). Earthquake in the Time of COVID-19: The story from Croatia (CroVID-20). J. Glob. Health 10 (1). doi:10.7189/jogh.10.010349
Costa, C., Figueiredo, R., Silva, V., and Bazzurro, P. (2020). Application of Open Tools and Datasets to Probabilistic Modeling of Road Traffic Disruptions Due to Earthquake Damage. Earthquake. Engng. Struct. Dyn. 49, 1236–1255. doi:10.1002/eqe.3288
ESRI (2021). ArcMap Network Analyst Extension Help Webpage on Historical Traffic. Available at: https://desktop.arcgis.com/en/arcmap/latest/extensions/network-analyst/traffic-historical-10-1-and-later.htm (Accessed November 22, 2021).
Fan, D., and Shi, P. (2010). Improvement of Dijkstra's Algorithm and its Application in Route Planning. Seventh Int. Conf. Fuzzy Syst. Knowledge Discov., 1901–1904. doi:10.1109/FSKD.2010.5569452
Feng, X., Zhang, Y., Qian, S., and Sun, L. (2021). The Traffic Capacity Variation of Urban Road Network due to the Policy of Unblocking Community, Complexity. Struct. Infrastructure Eng. 9292389–1129. doi:10.1155/2021/9292389
Finazzi, F. (2020). The Earthquake Network Project: A Platform for Earthquake Early Warning, Rapid Impact Assessment, and Search and Rescue. Front. Earth Sci. 8, 243. doi:10.3389/feart.2020.00243
Franchin, P., Cavalieri, F., Pinto, P., Lupoi, A., Vanzi, I., Gehl, P., et al. (2011). General Methodology for Systemic Vulnerability Assessment, D2.1 of the SYNER-G Project. Available at: http://www.vce.at/SYNER-G/files/dissemination/deliverables.html (Accessed December 5, 2021).
Franchin, P., Lupoi, A., and Pinto, P. E. (2006). On the Role of Road Networks in Reducing Human Losses after Earthquakes. J. Earthquake Eng. 10, 195–206. doi:10.1080/13632460609350593
Goncharov, S. F. (1997). “Medical Consequences of Earthquake Disasters in Russia; Earthquake and People's Health,” in Proceedings of the WHO Symposium (Japan: Kobe).
Hackl, J., Lam, J. C., Heitzler, M., Adey, B. T., and Hurni, L. (2018). Estimating Network Related Risks: A Methodology and an Application in the Transport Sector. Nat. Hazards Earth Syst. Sci. 18, 2273–2293. doi:10.5194/nhess-18-2273-2018
Hekimoglu, Y., Melez, I. E., Canturk, G., Erkol, Z., Canturk, N., Dizdar, M. G., et al. (2013). Evaluation of the Deaths Secondary to Entrapment under the Debris in the Van Earthquake. Egypt. J. Forensic Sci. 3, 44–47. doi:10.1016/j.ejfs.2013.02.001
Hirokawa, N., and Osaragi, T. (2016). Earthquake Disaster Simulation System: Integration of Models for Building Collapse, Road Blockage, and Fire Spread. J. Disaster Res. 11 (2). doi:10.20965/jdr.2016.p0175
Hotz, G., Ginzburg, E., Wurm, G., DeGennaro, V., Andrews, D., Basavaju, S., et al. (20112010). Post-earthquake Injuries Treated at a Field Hospital - Haiti. Morbidity Mortality Weekly Rep. 59 (51-52), 1673–1677.
Ianoş, I., Merciu, G.-L., Merciu, C., and Pomeroy, G. (2017). Mapping Accessibility in the Historic Urban Center of Bucharest for Earthquake Hazard Response. Nat. Hazards Earth Syst. Sci. Discuss. doi:10.5194/nhess-2017-13
INRIX (2021). 2021 INRIX Global Traffic Scorecard. Prepared by Pishue B. Available at: https://inrix.com/scorecard/(Accessed December 9, 2021).
ISUBIF (Bucharest-Ilfov Inspectorate for Emergency Situations) (2021). The Plan for Analysis and Coverage of Risks (in Romanian: Planul de Analiză şi Acoperirea Riscurilor). Available at: https://isubif.ro/local/planul-de-acoperire-si-analiza-a-riscurilor-bucuresti/(Accessed December 9, 2021).
Jenelius, E., and Mattsson, L.-G. (2015). Road Network Vulnerability Analysis: Conceptualization, Implementation and Application. Comput. Environ. Urban Syst. 49, 136–147. doi:10.1016/j.compenvurbsys.2014.02.003
Leandro, J., Cunneff, S., and Viernstein, L. (2021). Resilience Modeling of Flood Induced Electrical Distribution Network Failures: Munich, Germany. Front. Earth Sci. 9, 572925. doi:10.3389/feart.2021.572925
Lopez, P. A., Wiessner, E., Behrisch, M., Bieker-Walz, L., Erdmann, J., Flotterod, Y.-P., et al. (2018). “Microscopic Traffic Simulation Using SUMO,” in 21st International Conference on Intelligent Transportation Systems (ITSC). Vol 2018-Novem (Maui, HI, 2575–2582. doi:10.1109/ITSC.2018.8569938
Marica, I. (2017). Report on 2015 Bucharest Club Tragedy Unveils Healthcare System Problems. Available at: https://www.romania-insider.com/report-2015-colectiv-club-tragedy (Accessed December 9, 2021).
Mavroulis, S., Mavrouli, M., and Lekkas, E. (2021). Geological and Hydrometeorological Hazards and Related Disasters amid COVID-19 Pandemic in Greece: Post-disaster Trends and Factors Affecting the COVID-19 Evolution in Affected Areas. Saf. Sci. 138, 105236. doi:10.1016/j.ssci.2021.105236
Miller, M. K. (2014). Seismic Risk Assessment of Complex Transportation Networks. PhD Thesis. Stanford, USA: Stanford University.
Milonean, I. (2021). 11 incendii în mai puțin de un an în spitalele din România. Cele mai mari tragedii au fost în secțiile ATI care tratează pacienții cu COVID în stare gravă (in Romanian). G4Media. Available at: https://www.g4media.ro/zece-incendii-in-mai-putin-de-un-an-in-spitalele-din-romania-cele-mai-mari-tragedii-au-fost-in-sectiile-ati-care-trateaza-pacientii-cu-covid-in-stare-grava.html (Accessed December 9, 2021).
Minson, S. E., Cochran, E. S., Wu, S., and Noda, S. (2021). A Framework for Evaluating Earthquake Early Warning for an Infrastructure Network: An Idealized Case Study of a Northern California Rail System. Front. Earth Sci. 9, 620467. doi:10.3389/feart.2021.620467
Moroux, P., Bertrand, E., Bour, M., LeBrun, B., Depinois, S., and Masure, P. (2004). “Risk-UE Team: The European Risk-UE Project,” in Proceedings of the 13th WCEE (Vancouver, Canada. An Advanced Approach to Earthquake Risk Scenarios.
Pavel, F., Calotescu, I., Vacareanu, R., and Sandulescu, A.-M. (2018). Assessment of Seismic Risk Scenarios for Bucharest, Romania. Nat. Hazards 93, 25–37. doi:10.1007/s11069-017-2991-3
Pinto, P. E., Cavalieri, F., Franchin, P., and Lupoi, A. (2012). Systemic Vulnerability and Loss for Transportation Systems, D5.5 of the SYNER-G Project. Available at: http://www.vce.at/SYNER-G/files/dissemination/deliverables.html (Accessed December 9, 2021).
RE:RISE, and geo-spatial.org (2021). “After the Earthquake” (In Romanian: După Cutremur) Initiative. Available at: https://www.dupacutremur.ro/(Accessed December 9, 2021).
Rohr, A., Priesmeier, P., Tzavella, K., and Fekete, A. (2020). System Criticality of Road Network Areas for Emergency Management Services-Spatial Assessment Using a Tessellation Approach. Infrastructures 5 (11), 99. doi:10.3390/infrastructures5110099
Sevtsuk, A., and Mekonnen, M. (2012). Urban Network Analysis. A New Toolbox for ArcGIS. Revue internationale de géomatique 22, 287–305. doi:10.3166/rig.22
Shahabi, K., and Wilson, J. P. (2014). CASPER: Intelligent Capacity-Aware Evacuation Routing. Comput. Environ. Urban Syst. 46, 12–24. doi:10.1016/j.compenvurbsys.2014.03.004
Sun, L., D'Ayala, D., Fayjaloun, R., and Gehl, P. (2021). Agent-based Model on Resilience-Oriented Rapid Responses of Road Networks under Seismic hazard. Reliability Eng. Syst. Saf. 216, 108030. doi:10.1016/j.ress.2021.108030
Toma-Danila, D. (2018). A GIS Framework for Evaluating the Implications of Urban Road Network Failure Due to Earthquakes: Bucharest (Romania) Case Study. Nat. Hazards 93, 97–111. doi:10.1007/s11069-017-3069-y
Toma-Danila, D., and Armaş, I. (2017). Insights into the Possible Seismic Damage of Residential Buildings in Bucharest, Romania, at Neighborhood Resolution. Bull. Earthquake Eng. 15, 1161–1184. doi:10.1007/s10518-016-9997-1
Toma-Danila, D., Armas, I., and Tiganescu, A. (2020). Network-risk: an Open GIS Toolbox for Estimating the Implications of Transportation Network Damage Due to Natural Hazards, Tested for Bucharest, Romania. Nat. Hazards Earth Syst. Sci. 20 (5), 1421–1439. doi:10.5194/nhess-20-1421-2020
Toma-Danila, D. (2021c). Firestations in Bucharest and Ilfov (Romania). London, UK: Mendeley Data, V1. doi:10.17632/rtd94h6m4k.1
Toma-Danila, D. (2021b). Hospitals in Bucharest and Ilfov (Romania). London, UK: Mendeley Data, V1. doi:10.17632/b6mfpp6v7w.1
Toma-Danila, D. (2021a). Network-risk Framework for ArcGIS (V1 and V2; Bucharest Road Network Data Included). London, UK: Mendeley Data, V1. doi:10.17632/wp69xrf2c5
Toma-Danila, D., and Tiganescu, A. (20212021). Network-risk Toolbox for ArcGIS User Manual. Available at: http://www.infp.ro/network-risk (Accessed December 9, 2021).
TomTom (2021). Road Analytics Product Webpage. Available at: https://www.tomtom.com/products/road-traffic-data-analytics/(Accessed December 9, 2021).
TomTom (2020). TomTom Traffic index. Available at: https://www.tomtom.com/en_gb/traffic-index/ranking/(Accessed December 9, 2021).
Yu, Y.-C., and Gardoni, P. (2022). Predicting Road Blockage Due to Building Damage Following Earthquakes. Reliability Eng. Syst. Saf. 219, 108220. doi:10.1016/j.ress.2021.108220
Keywords: seismic risk, infrastructure, GIS, emergency management, Bucharest, network, time-dependent, earthquake
Citation: Toma-Danila D, Tiganescu A, D’Ayala D, Armas I and Sun L (2022) Time-Dependent Framework for Analyzing Emergency Intervention Travel Times and Risk Implications due to Earthquakes. Bucharest Case Study. Front. Earth Sci. 10:834052. doi: 10.3389/feart.2022.834052
Received: 12 December 2021; Accepted: 19 January 2022;
Published: 11 February 2022.
Edited by:
Irasema Alcántara-Ayala, National Autonomous University of Mexico, MexicoReviewed by:
Mohamad Aulady, Institut Teknologi Adhi Tama Surabaya, IndonesiaMarco Neri, National Institute of Geophysics and Volcanology, Italy
Copyright © 2022 Toma-Danila, Tiganescu, D’Ayala, Armas and Sun. This is an open-access article distributed under the terms of the Creative Commons Attribution License (CC BY). The use, distribution or reproduction in other forums is permitted, provided the original author(s) and the copyright owner(s) are credited and that the original publication in this journal is cited, in accordance with accepted academic practice. No use, distribution or reproduction is permitted which does not comply with these terms.
*Correspondence: D. Toma-Danila, dG9tYUBpbmZwLnJv