 Lushan Wang1,2,3
 Ke Fan2*
- 1Institute of Atmospheric Physics, Chinese Academy of Sciences, Beijing, China
- 2School of Atmospheric Sciences, Sun Yat-sen University, and Southern Marine Science and Engineering Guangdong Laboratory (Zhuhai), Zhuhai, China
- 3University of the Chinese Academy of Sciences, Beijing, China
A blizzard struck Northeast China in November 2020, and the maximum daily snowfall broke its record since 1961. The synoptic and climatic conditions and the predictability of this extreme snowstorm event are examined by using the daily National Centers for Environmental Prediction (NCEP) reanalysis and the second version of the NCEP Climate Forecast System (CFSv2). The results show that an anomalous anticyclone over Japan and an anomalous cyclone in South China supplied abundant moisture and the rapidly enhanced Siberian high triggered the snowstorm. Before the snowstorm, the positive North Pacific Oscillation (NPO) and North Atlantic Oscillation (NAO) were essential for the accumulated water vapor. In addition, we find that the monthly NPO index and NAO index in November 2020 are both extremely strong compared to 1979–2019, and their combination converges to create the extreme snowstorm-related atmospheric circulation. The positive NPO and NAO together induce an anomalous anticyclone in Japan, which provides southerly water vapor transport to Northeast China. The midlatitude North Pacific warm sea surface temperature (SST) contributes to the positive NPO, and the Atlantic SST anomalies impact the positive NAO. However, the La Niña condition in 2020 might not be a key factor influencing the snowstorm. Finally, the subseasonal–seasonal skillful prediction of the snowfall can be made up to 3 days in advance. The CFSv2 had limited skill in forecasting the snowfall, NAO and NPO in November 2020. Improved predictability of extreme snowfall events is still needed.
Introduction
Snowstorms pose risks to human activities and agricultural productivity and can greatly disrupt transportation, resulting in widespread energy supply outages. An extreme snowstorm struck Northeast China on 19 November 2020 and reached the maximum daily snowfall in November since 1961 (Figures 1C, 2B). 1The related synoptic and climatic conditions are still unknown. According to the IPCC, (2021) AR6 Report (2021), snowfall has increased in mean intensity in Northeast China since the 1960s. In addition, snowstorms have occurred more frequently in November in this region during recent decades (Bai et al., 2019). As the major corn-producing region of the country, Northeast China will be more vulnerable to a higher frequency of snowstorms. Therefore, accurately predicting the time and amount of extreme snowstorms is needed to minimize the damage.
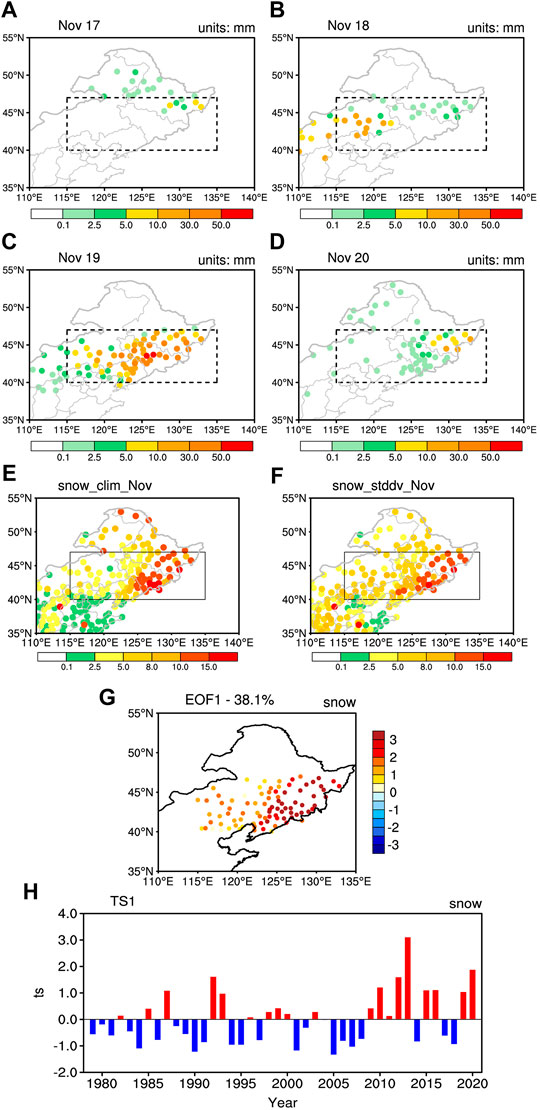
FIGURE 1. Observed daily snowfall (unit: mm) over Northeast China on (A) 17 November, (B) 18 November, (C) 19 November, and (D) 20 November 2020. (E) the climatology of the November-mean snowfall (unit: mm). (F) the standard deviations of the November-mean snowfall (unit: mm). Black rectangles indicate the averaging area for the snowfall index. (G) the spatial pattern of the leading EOF mode of November snowfall in 40°N–47°N, east of 115°E in China; (H) corresponding time series of the leading EOF mode.
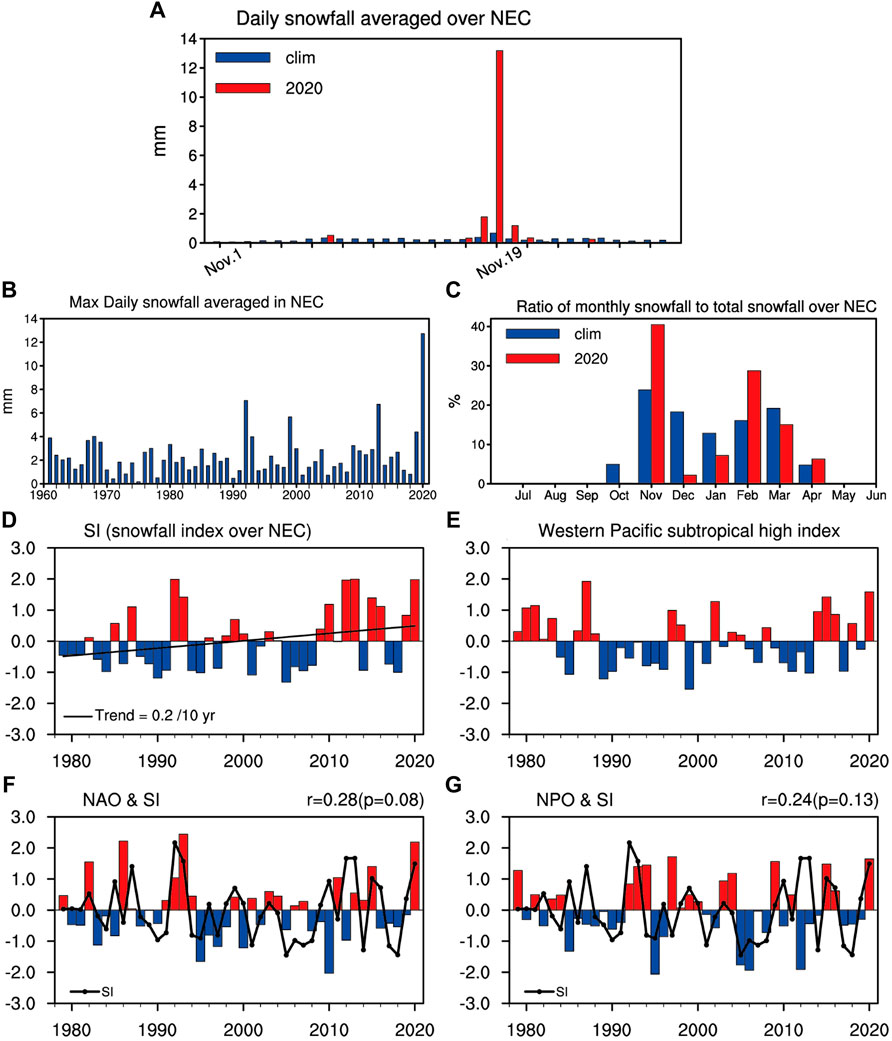
FIGURE 2. (A) Time series of mean daily snowfall in Northeast China in November 2020 and its corresponding climatology. (B) the maximus daily snowfall in November during 1961–2020. (C) Average ratios of monthly snowfall to total snowfall in Northeast China for each month. (D-G) Normalized time series of (D) mean snowfall index averaged in Northeast China, (E) western Pacific subtropical high (WPSH) index, (F) North Atlantic Oscillation (NAO) index, and (G) North Pacific Oscillation (NPO) index during November 1970–2020. The black line in (D) represents the linear line. The black line in (F,G) represents the snowfall index averaged over Northeast China.
Research studies of the synoptic and climatic conditions associated with heavy snowfall in Northeast China have focused mainly on spatiotemporal analysis (Dong et al., 2010; Liu et al., 2010; Chen et al., 2012) or case studies (Sun et al., 2009; Wang et al., 2011; Xin et al., 2011; Jiang et al., 2014). For instance, early work indicated that cold-air outbreaks, warm and moist air mass, convective instability, the right entrance region of an upper-level jet stream, diabatic processes, cyclogenetic lift, and upward motion are essential synoptic conditions of snowstorms (Uccellini and Johnson, 1979; Mote et al., 1997). Cold air outbreaks over East Asia are closely related to the Siberian high (Ding and Krishnamurti, 1987). In addition, an intensified and southeastward-shifted Siberian high can cause large water vapor convergence over eastern Northeast China, resulting in snowstorms (Wang et al., 2011). Warmer regional air temperatures, an increased water vapor budget, and increased instability of atmospheric layers are conducive to an increased frequency of heavy snowfall events in Northeast China, as compared with colder regional air temperatures and less water vapor in light snowfall events (Wang et al., 2020). The release of conditional instability and inertial instability within a weak convection environment is responsible for snowband maintenance (Li N. et al., 2021). A low-level jet provides the necessary water vapor and release of unstable convective energy (Hu and Zhou, 2005).
The North Atlantic oscillation (NAO) and the North Pacific Oscillation (NPO) are the dominant modes of atmospheric variability over the Northern Hemisphere (Rogers, 1981). Recent studies have paid attention to the remote influence of the NAO on East Asia. For example, Watanabe (2004) argued that the NAO signal might extend towards East Asia and the North Pacific along the Asian jet waveguide. The NAO has been linked to subseasonal, interannual, and multidecadal changes in atmospheric circulation and precipitation over East Asia. The NAO generates a significant climate response over East Asia at subseasonal timescales via eastward-propagating quasi-stationary Rossby waves instigating over the Atlantic and terminating in the northeastern Pacific region (Bollasina and Messori, 2018). The negative phase of the NAO leads to less wintertime precipitation in North China owing to the enhanced pressure gradient and anomalous westerly winds (Huang et al., 2013). The winter NAO leads to a decreasing trend in winter East Asian surface air temperature on the multidecadal variability with the greatest significant positive correlation at the lead time of 15 years (Li J. et al., 2021). Meanwhile, the link between the NAO and the East Asian climate might be unstable. The NAO signal moves eastwards via a zonally oriented wave train, where it modulates the atmospheric circulation structure and thus results in a nonstationary relationship between the NAO and midlatitude East Asian precipitation (Xu et al., 2016). Despite significant progress in the understanding of the influence of NAO, there is still a large gap in our knowledge about the impact of NAO on extreme snowfall in Northeast China.
Many studies have investigated the possible influence of the NPO on the East Asian climate. For instance, Wang et al. (2007) showed that the NPO has a close relationship with the East Asian climate when anomalous stationary waves propagate from the subtropical-central Pacific to the northern Pacific. The impact of the winter NPO on the surface air temperature variations over Eurasia is significant when the anticyclonic anomaly associated with the NPO index over the North Pacific midlatitudes shifts westward and pronounced northerly wind anomalies appear around Lake Baikal (Chen and Song, 2018). Lian et al. (2013) revealed the configuration of the Pacific polar vortex, NPO, North Pacific westerly drifts, and El Nino–Southern Oscillation (ENSO) insofar as the combined effect of these factors determines the size of the Pacific polar vortex in spring, which in turn determines the phase of the NPO anomaly. However, these studies rarely discuss the influence of the NPO on East Asian extreme snowfall.
Heavy snowfalls are highly sensitive to heat and moisture fluxes over the ocean when an air mass moves from the ocean into the land (Kim et al., 2020). Sea surface temperature (SST) modulates the intensity of the moisture and turbulent heat (sum of the sensible and latent heat) fluxes and the consequent convection, thereby acting as the source of energy for the formation of heavy snowfall (Kim and Jin, 2016). However, these studies focus on heavy snowfall in eastern Korea. As the warming SST over the North Pacific can invoke an anticyclonic anomaly over large parts of East Asia associated with the anomalous southeasterly over Northeast China, the surface is subsequently warmed, the water vapor content increases, and snowfall events intensify (Feng and Chen, 2016). ENSO exhibits the greatest influence on the interannual variability of global- and regional-scale precipitation (Ropelewski and Halpert, 1987). ENSO can affect the East Asian climate through an anomalous lower-tropospheric anticyclone or cyclone located in the western North Pacific (Wang et al., 2000). The ENSO cycle has been shown to have significant impacts on winter precipitation over southern China (Zhou and Wu, 2010; Jia and Ge, 2017). Negative Niño3.4 SST is linked to increased precipitation over northern China owing to the western Pacific subtropical high (WPSH) being situated farther north than normal in La Niña winter (Wen et al., 2009). To the best of our knowledge, there are limited results in the literature regarding how the oceanic conditions impact the extreme snowfall in Northeast China.
It is challenging to improve the subseasonal prediction skill for extreme snowstorms. Combining regional snowfall data with an ever-improving ability to forecast the warm and cold phases of ENSO is one way to improve seasonal snowfall forecasts (Smith and O'Brien, 2001). More recently, the year-to-year increment approach was employed to enhance the skill for the seasonal prediction of heavy snow (Fan and Tian, 2013). Meanwhile, the World Weather Research Program/World Climate Research Program has established the Subseasonal to Seasonal Prediction project (S2S) towards better understanding the forecast skills of current dynamic models and improving them at the subseasonal-to-seasonal timescale (Vitart et al., 2017). However, the predictability of intense snowstorms in Northeast China on subseasonal-to-seasonal timescales remains an open question.
The aim of this study was to document the causes and predictability of an intense snowstorm that occurred in Northeast China in November 2020. Following this introduction, Section 2 introduces the datasets and methods employed in the study. Section 3 outlines the large-scale atmospheric anomalies and the physical mechanisms related to the positive-phase NAO and NPO. Section 4 discusses the predictability of the snowstorm and its climatic and synoptic conditions. Section 5 provides conclusions and some further discussions.
Data and Methods
Data
Daily snowfall data were obtained from the China Meteorological Administration during 1961–2020. This study classified snowfall into four levels according to the China Meteorological Administration: light snow with less than 2.5 mm in 24 h, moderate with 2.5–5 mm in 24 h, heavy snowstorms with 5–10 mm in 24 h, and snowstorms with exceeding 10 mm in 24 h. The reanalysis data were from the daily National Centers for Environmental Prediction (NCEP) at a 2.5° × 2.5° resolution (Kalnay et al., 1996) and the Hadley Centre Global Sea Ice and SST dataset at a 0.5° × 0.5° resolution from 1979 to 2020 (Rayner et al., 2003). The forecasts from the version 2 of the NCEP Climate Forecast System (CFSv2) were utilized in this study. The model output was downloaded to examine the ability to predict the atmospheric circulations and SST in November. The atmospheric component of the model is NCEP Global Forecast System at T126 resolution (about 100 km) with 64 vertical levels, which is coupled to the ocean model, land surface model, and sea ice model (Saha et al., 2014). For its ocean component, the CFSv2 uses the GFDL Modular Ocean Model version 4p0d (Griffies et al., 2004). In the present study, we used real-time CFSv2 from 16 member ensembles starting from 1 October to 30 November at daily intervals for the year 2020. The real-time operational forecasts obtain their initial conditions from the real-time operational Climate Data Assimilation System, version 2. The real-time S2S product released by NCEP was applied to investigate the forecast skill for snowfall and its related atmospheric circulations during this event.
The detailed definitions of the climate indices used in this study are as follows. The NAO index was provided by the NOAA Climate Prediction Center, which was defined by applying the rotated principal component analysis technique to monthly mean standardized 500-hPa geopotential height (HGT) anomalies in the analysis region (20°-90°N). The NPO index was defined by the principal component time series corresponding to the second empirical orthogonal function (EOF) mode of monthly mean sea surface pressure (SLP) anomalies over (20°–60°N, 120°E–80°W). The Siberian high index was computed by SLP averaged over (40°–60°N, 70°–120°E). The western Pacific subtropical high (WPSH) index was calculated by the standardized area of the 5,880 gpm contour at 500-hPa over East Asia and the western Pacific (10°–90°N, 110°–180°E). The Niño 3.4 index was calculated by sea surface temperature (SST) averaged over East Central Tropical Pacific (5°S–5°N, 170°–120°W). The North Pacific SST index was defined by SST averaged over mid–high latitude North Pacific (20°–70°N, 120°–160°E). The North Atlantic SST index was defined by the principal component time series corresponding to the first EOF mode of monthly mean SST anomalies over (10°–70°N, 0°–80°W).
Methods
The climatology was defined by the arithmetic mean of each variable from 1979 to 2019.
The vertically integrated moisture flux vector Q can be expressed as
In which the zonal component is
and the meridional component is
where
The wave activity flux for diagnosing the propagation of Rossby waves is calculated using the following formula (Takaya and Nakamura, 2001)
in which
Regression analysis, composite analysis, and correlation analysis were the main methods employed. The Student’s t-test was used for testing the statistical significance.
Results
Spatiotemporal Features of the Extreme Snowfall Event
Figure 1 shows the spatial changes of snowfall over Northeast China during 17–20 November 2020. Light and moderate snow fell over the north of Northeast China on 17 November (Figure 1A), and then the snowfall enhanced and shifted southwards on 18 November (Figure 1B). Following this, the snowstorm burst through Northeast China on 19 November, with maximum accumulated amounts in excess of 50 mm (Figure 1C). Finally, the snowstorm eased on 20 November (Figure 1D). Note that Figure 1C shows that the snowstorm clustered in 40°N–47°N, east of 115°E in China. Meanwhile, the November-mean snowfall has a large climatology and the maximum standard deviation in this region (Figures 1E,F). Furthermore, the spatial pattern of November snowfall has similar signals in this region by applying empirical orthogonal function (EOF) analysis (Figure 1G). Therefore, we chose the exact range of Northeast China as the research region (Figure 1C). Figure 2A shows the time series of daily snowfall over Northeast China in November 2020 and its corresponding climatology. Compared with the climatological daily-mean snowfall on 19 November near 0.68 mm, the amount of snowfall in this snowstorm event is extraordinary, which is 13.17 mm (Figure 2A). Notably, the result shows the snowfall on 19 November 2020 was the maximum daily snowfall in November since 1961. Climatologically, November snowfall accounted for 24% during 1979–2019, while it grew drastically to 40.5% in 2020 (Figure 2C). The November-mean snowfall in 2020 was in the top 3 years during 1979–2020 (Figure 2D). Thus, two questions arise: Why did this snowstorm happen on 19 November 2020? And what were the climatic conditions in November 2020? To answer these questions, Figure 3 presents the synoptic evolution of the atmospheric circulation.
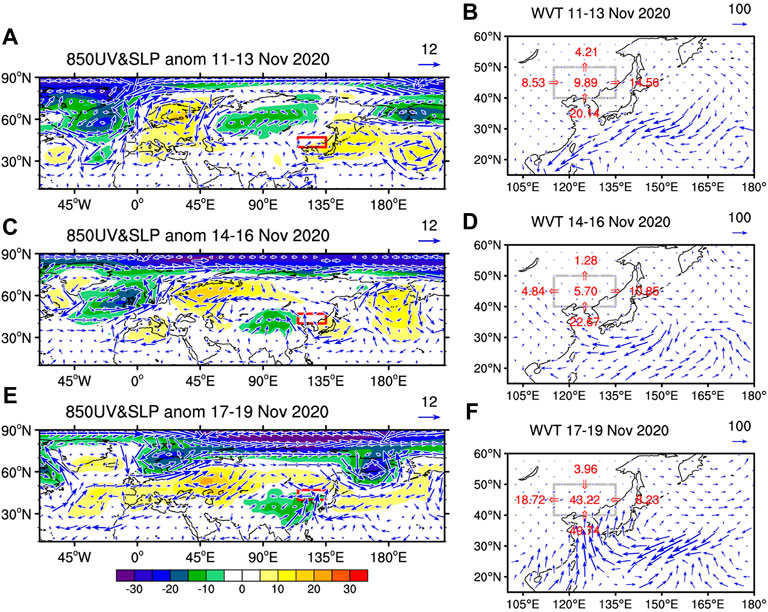
FIGURE 3. Evolution of the anomalous sea level pressure (SLP) (shading; unit: hPa), 850-hPa winds (blue arrows; unit: m s−1), vertically integrated water vapor transport (WVT) (vectors; unit: kg m−1 s−1), and WVT budget on (A,B) 11–13 November, (C,D) 14–16 November, and (E,F) 17–19 November 2020.
Synoptic Evolution
On 11–13 November 2020 (Figure 3A), the anomalous large-scale features represented the typical characteristics of a weak East Asian winter monsoon. A negative SLP in Siberia indicated a relatively weaker Siberian high. The anomalous southerly wind prevailed along the eastern flank of the weakened Siberian high. A positive NAO-like pattern was presented in the North Atlantic, with negative SLP anomalies occurring over Greenland and positive SLP anomalies residing over Europe. There is an anti-phase relationship between the NAO and the Siberian high (Wu and Huang, 1999). In addition, a strong anomalous high crossed over the midlatitude North Pacific to Japan, which was associated with a positive NPO pattern. Climatologically, cold and dry airflow and northwesterly water vapor transport (WVT) are situated over Northeast China during the cold season. However, in this case, the anomalous high over the midlatitude North Pacific and anomalous low over Siberia reduced the pressure difference between the ocean and Eurasia, resulting in anomalous southerly winds in East Asia. Therefore, abundant moisture was transported from the ocean to Northeast China, and the positive WVT budgets dominated the entire troposphere in the region a week before the snowstorm (Figure 3B). On 14–16 November 2020 (Figure 3C), the atmospheric circulation changed from a zonal to a meridional pattern. The positive NAO pattern moved southeastwards, and negative SLP anomalies were apparent in northwestern China. Downstream, the anomalous high over the midlatitude North Pacific enhanced, and the anticyclonic anomaly over Japan intensified. Therefore, the anomalous southerly winds and southerly WVT continued (Figure 3D), resulting in a warm temperature advection anomaly and increased precipitable water for the entire atmosphere over Northeast China (Figures 4A,E).
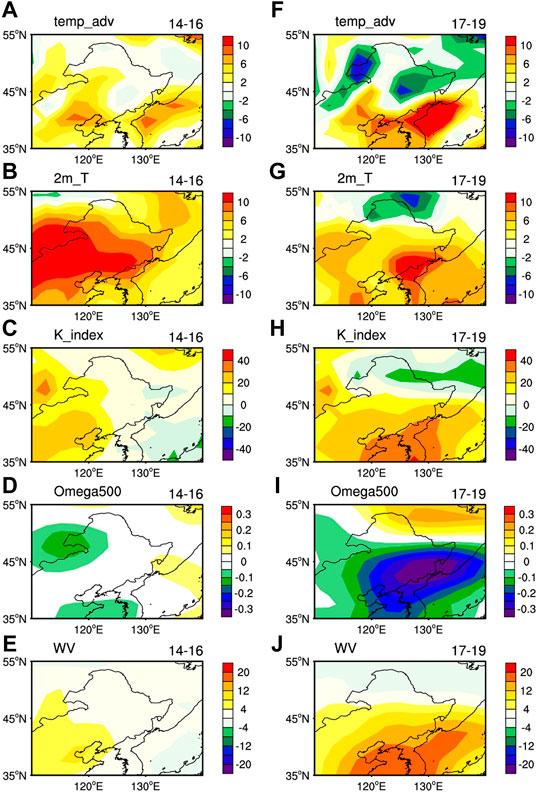
FIGURE 4. Horizontal temperature advection (unit: K day−1), temperature (unit: °C), K-index (unit: °C), 500-hPa Omega (unit: 10–2 Pa s−1), and precipitable water for the entire atmosphere (kg m−2) during (A–E) 14–16 November 2020 and (F–J) 17–19 November 2020.
On 17–19 November 2020 (Figure 3E), the atmospheric meridional pattern intensified. Firstly, the NAO-like pattern disappeared and the tropospheric polar vortex moved to the Eurasian continent. Then, the Siberian high was enhanced. Thus, the cold air invaded Northeast China. Hence, negative temperature advection and cold surface temperature anomalies presented in Northeast China (Figures 4F,G). Furthermore, an anomalous low developed in the south of China, resulting in anomalous southerly winds and strong ascending motion anomalies. Also, the positive-phase NPO intensified and there were enhanced anticyclone anomalies over Japan, favoring anomalous southerly winds and southerly WVT (Figure 3F). Hence, the amount of precipitable water in the entire atmosphere increased (Figure 4J). The atmospheric boundary layer was in relatively unstable because of the warm and moist conditions (Figure 4H), which produced ascending motion anomalies over Northeast China (Figure 4I).
Climate Condition: Large-Scale Atmospheric Anomalies
From the above analysis, the warm conditions related to the weak Siberian high and the midlatitude North Pacific anticyclone were essential for the accumulation of moisture and enhancing the instability of atmospheric layers over Northeast China. But what were the climatic conditions in November 2020? Figure 5 shows that a positive-phase of NAO pattern presented over the North Atlantic, with negative anomalies of SLP and 500-hPa geopotential height (HGT) over Greenland, and positive anomalies over the midlatitude Northwest Atlantic Ocean and Europe (Figures 5A,B). In addition, a positive-phase NPO was clear, which involved a north–south dipole pattern in the North Pacific with a negative SLP and 500-hPa HGT center over the Chukchi Highlands and a positive center spanning the central latitudes of the North Pacific between 30°N and 45°N (Figures 5A,B). The low-level horizontal wind anomaly pattern showed an anomalous cyclone covering East Siberia, resulting in northerly anomalies prevailing in the north of Northeast China (Figure 5C). A strong anomalous anticyclone controlled the eastern North Pacific and extended to Japan, corresponding to the anomalous southerly winds and WVT in the south of Northeast China (Figure 5D). Thus, more warm air and moisture were transported from the central latitudes of the North Pacific to Northeast China.
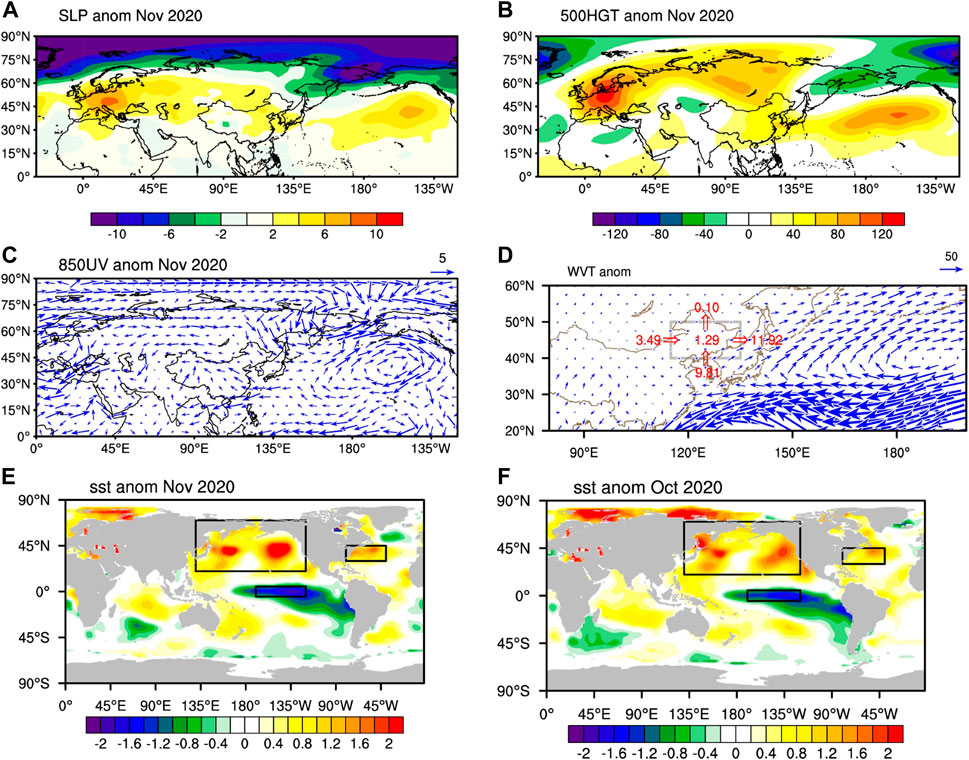
FIGURE 5. The anomalous (A) SLP (unit: hPa), (B) 500-hPa geopotential height (HGT) (unit: gpm), (C) 850-hPa winds (unit: m s−1), (D) vertically integrated WVT (unit: kg m−1 s−1) and WVT budget; (E) sea surface temperature (SST) (unit: °C) in November 2020; (F) SST in October 2020. Anomalies are the departure from the 1979–2019 base period monthly means.
The synchronous NAO index was the second largest positive anomaly since the year 1979 and even ranked in the top 3 after detrending (Figure 2F). The change in the NAO from 1979 to 2020 was quite like that of the snowfall index in Northeast China (Figure 2F). The correlation coefficient between the NAO and snowfall index was 0.28 (Table 1), significant at the 90% level. The synchronous NPO index was the largest positive anomaly since the year 1979 and even ranked in the top 2 after detrending (Figure 2G). The correlation coefficient between the NPO and snowfall index was 0.24 (Table 1), though it was not significant at the 90% level. Note that the correlation coefficient between the NPO and NAO was 0.44 (Table 1), significant at the 90% level.

TABLE 1. Correlation coefficients between the snowfall index (SI) and climate indices.
Impact of Positive-phase NAO and NPO
This section investigates the connection between the climate in Northeast China and the positive-phase NAO and NPO patterns. Two key processes were important: the downstream extension of the NAO and the upstream effect of the NPO.
Figure 6 demonstrates that the positive-phase NAO was responsible for the warm and moist conditions in Northeast China by means of the Rossby wave activity flux and linear regression analysis of the observed monthly anomalies. The NAO signal can extend towards East Asia and the North Pacific, chiefly via quasi-stationary wave propagation of upper-tropospheric anomalies along the Asian jet (Watanabe, 2004). From the Rossby wave activity shown in Figure 6A, a Rossby wave train propagated from the North Atlantic to East Asia. An anomalous high of 500-hPa HGT was clear over Japan (Figure 6B). Corresponding to this anomalous high, the significantly anomalous 850-hPa southerly over the eastern coast of East Asia transported moisture northwards (Figure 6C). Hence, there were increased precipitable water contents in Northeast China (Figure 6D), corresponding to the region being wetter in 2020 (Figure 6E).
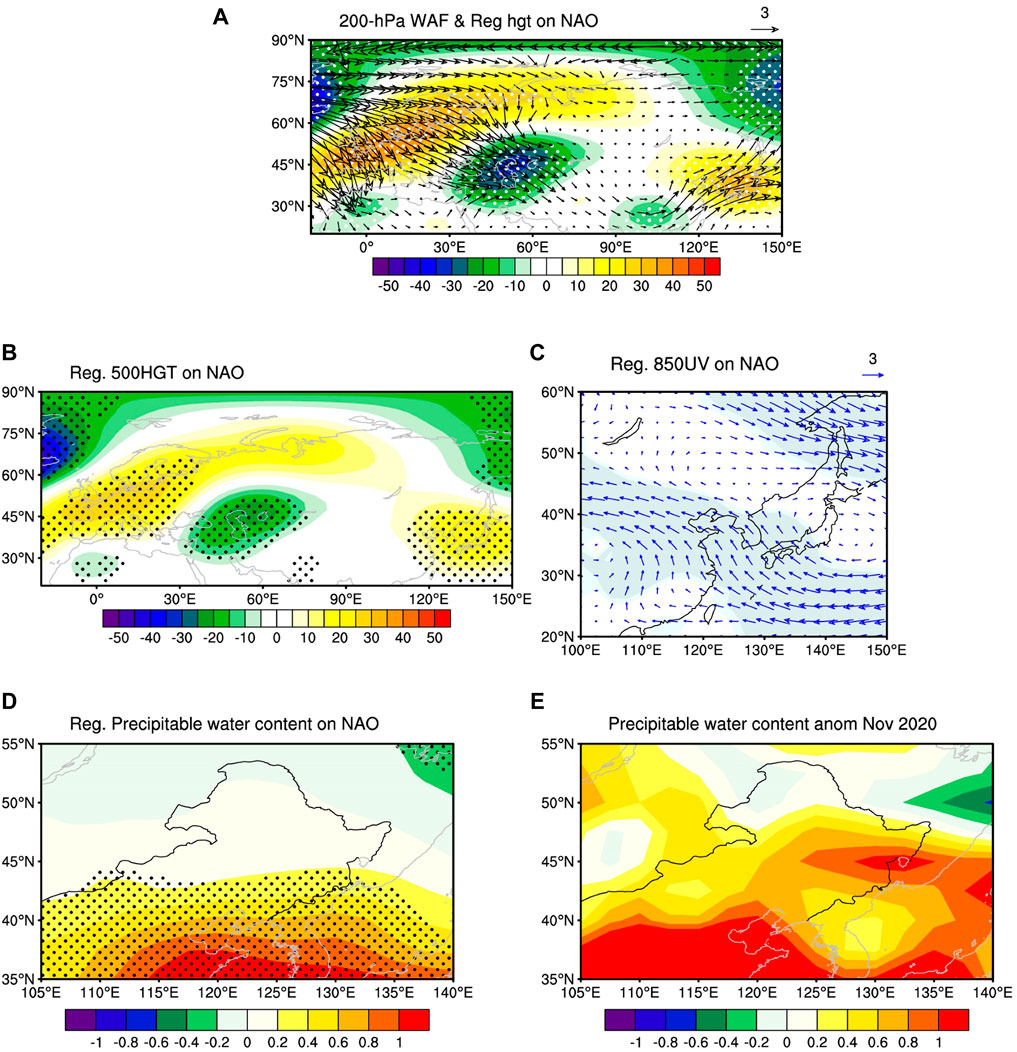
FIGURE 6. (A) Rossby wave activity flux (vectors; unit: m2 s−2) and regression of 200-hPa HGT (contours; unit: gpm), (B) 500-hPa HGT (unit: gpm), (C) 850-hPa winds (unit: m s−1), and (D) precipitable water (unit: mm) on the NAO-index for November during 1979–2019. (E) Anomalous precipitable water in November 2020. Regions above the 90% significance level are dotted in (A,B,D) and shaded in (C).
The NPO is characterized by a north–south seesaw pattern of SLP between the high latitudes and subtropics of the North Pacific (Rogers, 1981). The NPO has a pronounced influence on East Asian winter monsoon activity and surface air temperature variations over East Asia (Wang et al., 2007). The positive phase of NPO is associated with a weaker East Asian winter monsoon, inducing southerly winds anomalies in China. Significant and positive SLP and 500-hPa HCT signals appeared in East Asia (Figures 7A,B). The anomalous anticyclone confined to East Asia induced anomalous southerly WVT in Northeast China (Figure 7C), leading to increased precipitation in this region.
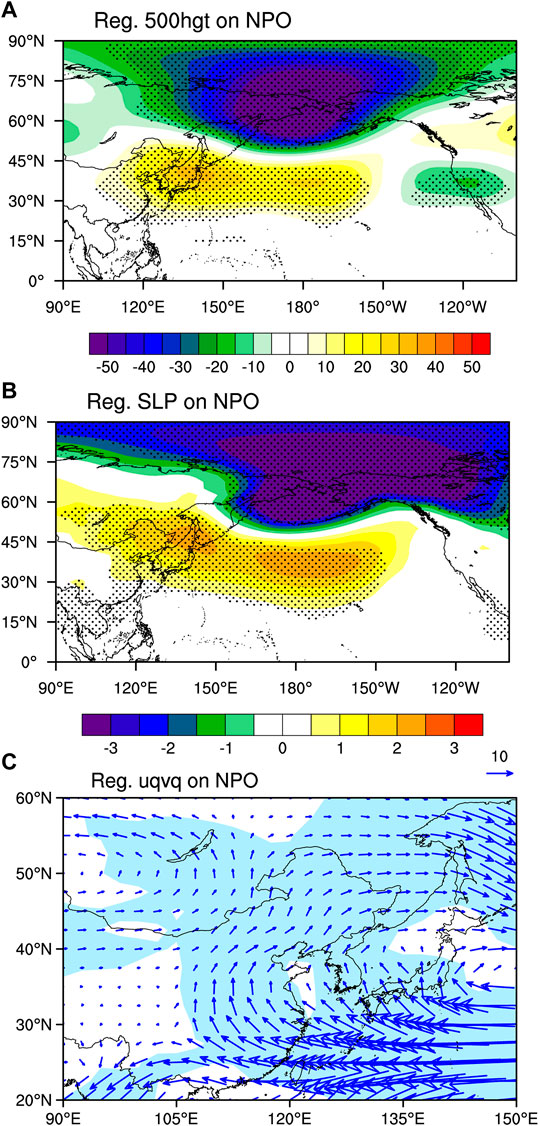
FIGURE 7. Regression of (A) 500-hPa HGT (unit: gpm), (B) SLP (unit: hPa), and (C) vertically integrated WVT (unit: kg m−1 s−1) on the NPO index for November during 1979–2019. Regions above the 90% significance level are dotted in (A,B) and shaded in (C).
Role of SST in the North Pacific and North Atlantic
This section focuses on the ocean’s role in forcing atmospheric circulation. Firstly, the role of warm SST in forcing North Pacific atmospheric circulation is demonstrated.
Figures 5E,F show that there are remarkable positive SSTA in the midlatitude North Pacific in October and November 2020. The regression of November SLP and 500-hPa geopotential height onto the North Pacific SST index in October shows that an anomalous equivalent barotropic meridional seesaw pattern over North Pacific (Figures 8B,D). This pattern strongly resembles the NPO pattern. Previous observational analysis has demonstrated that warm SSTAs in the midlatitude North Pacific tend to induce an equivalent barotropic high, and this process might be attributable to the air–sea coupling feedback (Révelard et al., 2018). Atmospheric general circulation model experiments have proven that local SSTAs can affect the midlatitude atmospheric variability through transient eddy vorticity forcing (Tao et al., 2020). Climatologicall, the midlatitude North Pacific features large SST meridional gradients in winter. The effect of such a large SST gradient in the oceanic front zone can propagate from the lower to the upper troposphere, bringing an indirect influence on atmospheric circulation (Feliks et al., 2004). Fang and Yang (2016) investigated the dynamical processes of atmospheric response to the midlatitude SST anomalies (SSTA) where the meridional SST gradient and the atmospheric transient eddy are the indispensable ingredients. This theory can be interpreted as follows (Fang and Yang, 2016). The SST warming in midlatitude North Pacific tends to increase the meridional SST gradient in mid–high latitude, thus enhancing the low-level atmospheric meridional temperature gradient and thus the low-level atmospheric baroclinicity tend to be strengthened, inducing more active transient eddy activities that increase transient eddy vorticity forcing. The vorticity forcing that dominates the total atmospheric forcing tends to produce an equivalent barotropic atmospheric high pressure in midlatitude North Pacific. In the present work, we calculate the meridional SST gradient and atmospheric transient eddy. It shows that the meridional SST gradient and transient eddy vorticity forcing are significantly increased around the 45°N (Figures 8A,C). Therefore, the atmospheric anomalies are further modified to the NPO-like diploe due to the eddy vorticity feedback, which illustrate the atmospheric response to the midlatitude SSTA in the view of dynamic coupling.
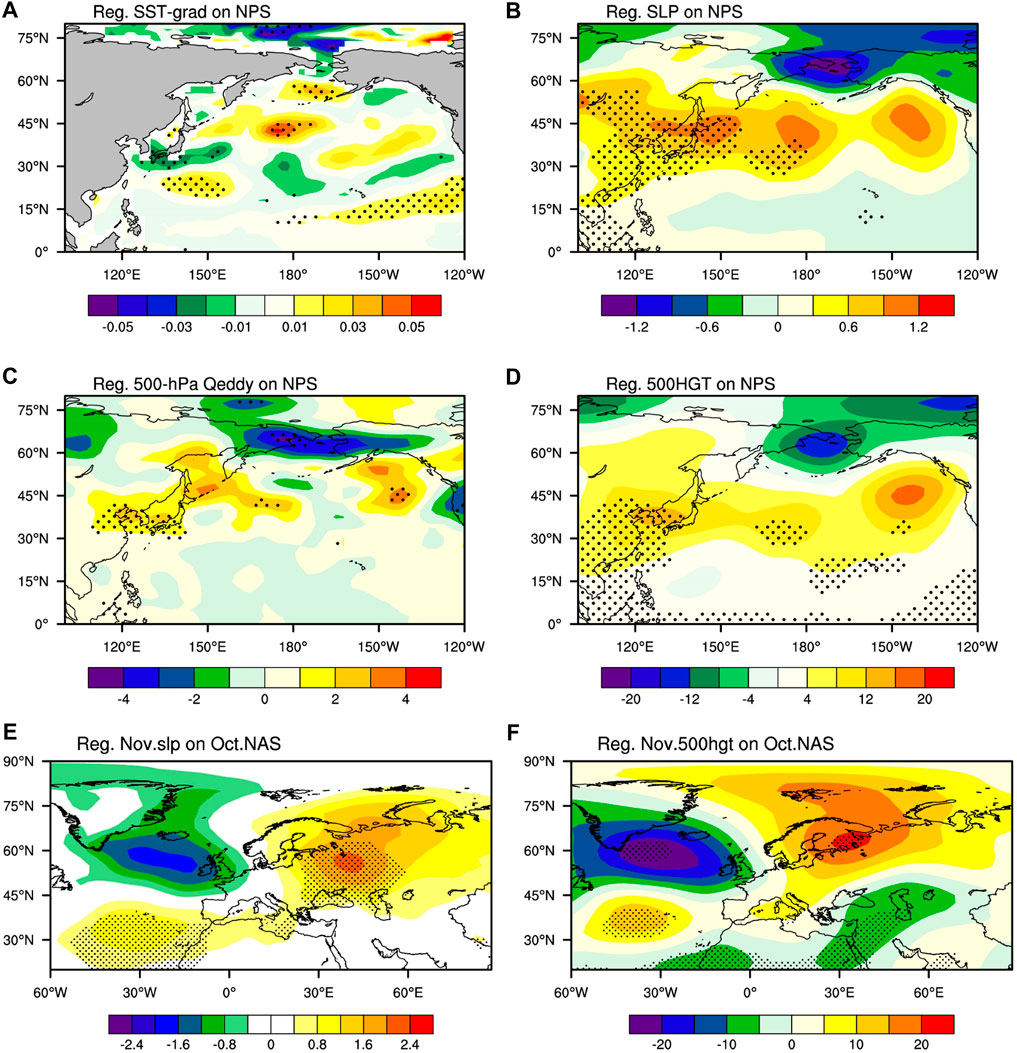
FIGURE 8. Regression of the November (A) SST gradient (unit: °C km−1), (B) SLP (unit: hPa), (C) 500-hPa transient eddy vorticity forcing (unit: day−1), and (D) 500-hPa HGT (unit: gpm) on the October North Pacific SSTA index during 1979–2019. Regression of the November (E) SLP, (F) 500-hPa HGT on the October North Atlantic SSTA index. Regions above the 90% significance level are dotted. Regions above the 90% significance level are dotted.
Secondly, we investigate the ENSO’s relo in this snowstorm. The intensity of La Niña in November 2020 was moderately ranked fifth among the eleven strongest La Niña years from 1979 to 2020 (Figure 9C). We performed a composite analysis to illustrate the WVT and atmospheric anomalies related to La Niña years (Figure 9). Figure 9A shows that during strong La Niña years, an obvious positive SSTA could be detected in the western and subtropical North Pacific, with a negative SSTA in the eastern Pacific. Meanwhile, clear negative 500-hPa HGT and SLP anomalies occupied Japan (Figures 9E,F), and an anomalous cyclone was centered over Japan (Figure 9D). This environment was favorable for anomalous northerlies and northerly WVT to penetrate Northeast China (Figure 9B), which was opposite to the southerly anomalies in this region in November 2020. Previous research has also revealed that La Niña accompanied a strong East Asian winter monsoon (Wang et al., 2000). Our findings also revealed that the correlation coefficient between the WPSH and Niño3.4 was 0.35, significant at the 95% confidence level (Table 1). The WPSH in November 2020 was the second strongest during 1970–2020 (Figure 2E). But why were the warm conditions over Northeast China operating under a La Niña condition in November 2020? One explanation is that the effects of La Niña and the positive-phase NPO on the East Asian trough were offset, leading to a weak response of the East Asian trough to La Niña events (Ao and Sun, 2016). Hence, the La Niña condition alone could hardly have resulted in the moist conditions over Northeast China.
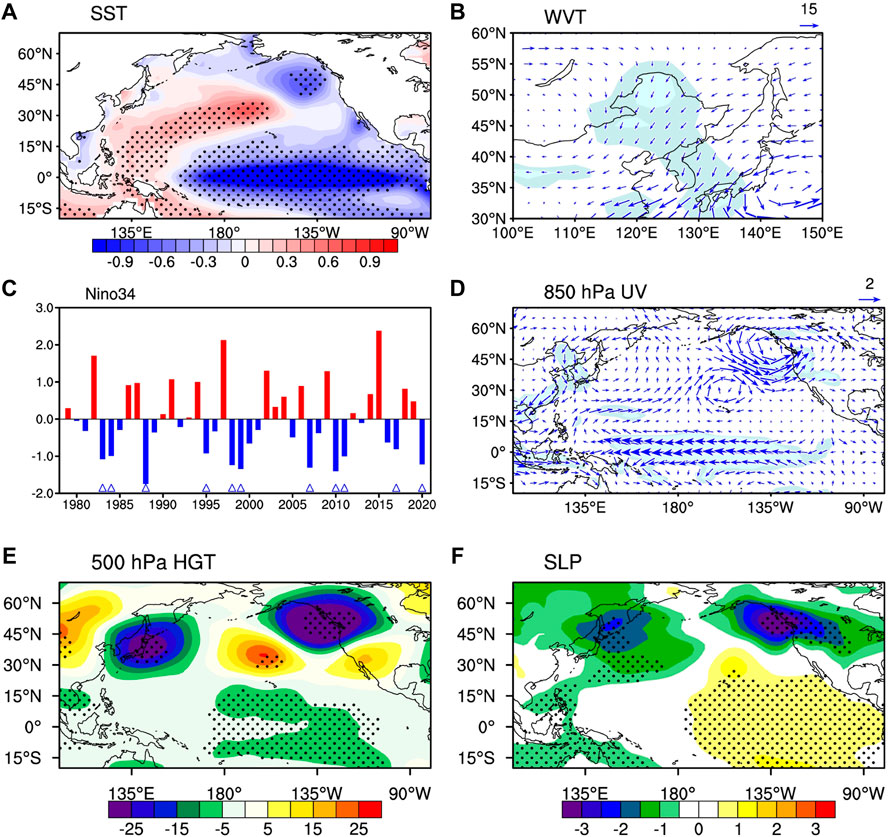
FIGURE 9. Composite differences in monthly mean (A) SST (unit: °C), (B) vertically integrated WVT (vectors; unit: kg m−1 s−1), (C) time series of normalized Niño3.4 SST, (D) 850-hPa winds (vectors; unit: m s−1), (E) 500-hPa HGT (unit: gpm), and (F) SLP (unit: hPa). The gray shading in (B, D) denotes where the anomalies are significant at the 90% confidence level. Stippling in (A,E,F) denotes where the anomalies are significant at the 90% confidence level. The differences are between the eight strongest La Niña years (1983, 1984, 1988, 1995, 1998, 1999, 2007, 2010, 2011, and 2017) and the climatology for November.
Furthermore, the North Atlantic Ocean’s role in forcing NAO is investigated. Rodwell et al. (1999) have demonstrated that North Atlantic SSTA can lead to local changes in surface evaporation, precipitation, and atmospheric heating that tend to reinforce the thermal and geopotential structure of the NAO via using a general circulation model. Watanabe and Kimoto (2000) have addressed that the positive SSTA in the midlatitude band around 40°N effectively excites the positive phase of the NAO. A dipolar anomaly, with warm SST southeast of Newfoundland and cold SST to the northeast and southeast, precedes a positive phase of the NAO (Czaja and Frankignoul, 2002). Here we defined a North Atlantic SSTA index according to the time series of the first EOF mode of October SSTA at 10°N–70°N and 0–80°W. The regression map of SLP and 500-hPa geopotential height on the North Atlantic SSTA index show a near-equivalent barotropic vertical structure with negative anomalies near Iceland and positive anomalies around the Azores, which strongly resembles the positive phase of NAO (Figures 8E,F).
To identify the independent linkage of the different ocean, we plot the partial correlations of the SSTA index with the 500-hPa HGT anomalies. When the possible liner influences of the North Pacific SSTA and La Niña were removed, a positive NAO pattern was clear from the partial correlations of the North Atlantic SSTA index with the 500-hPa HGT anomalies (Figure 10D). In addition, the mid-tropospheric anomalous anticyclone extending over the midlatitude North Pacific to Northeast China existed after removing the contribution from the North Atlantic SSTA and La Niña (Figure 10B). This indicates that the effect of North Pacific SSTA and North Atlantic on atmospheric anomalies are independent.
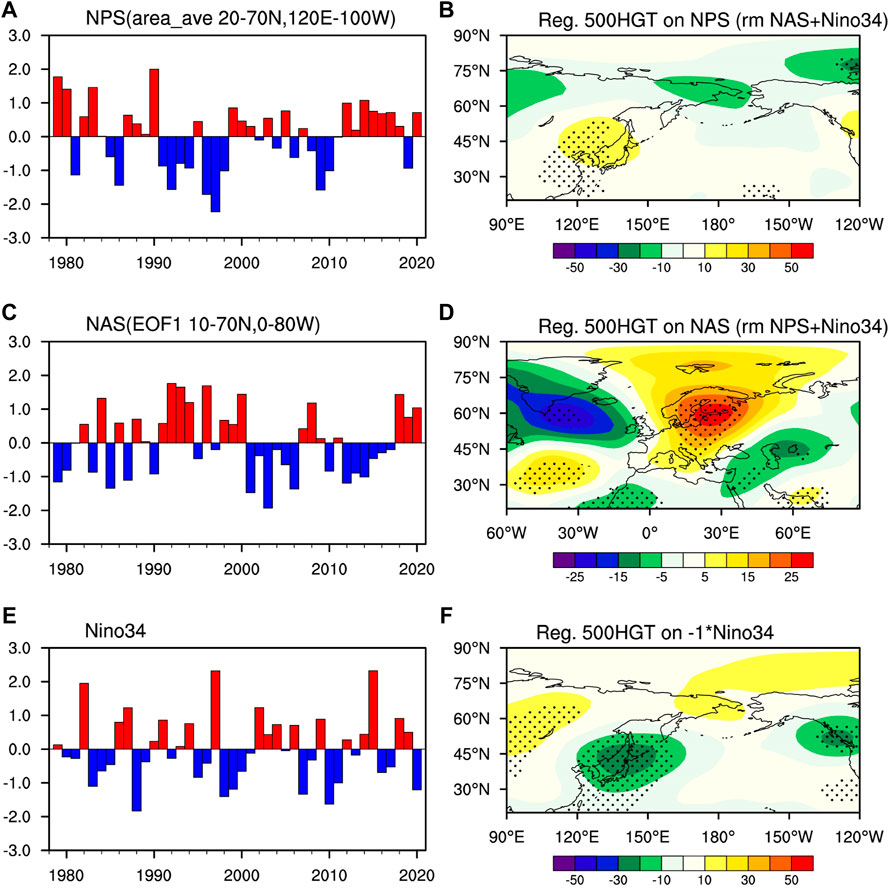
FIGURE 10. Normalized time series of the October (A) North Pacific SST index, (C) North Atlantic SST index, and (E) Niño3.4 index. Partial correlations of the October (B) North Pacific SST index, (D) North Atlantic SST index, and (F) Niño3.4 index (multiply by −1) with the November 500-hPa HGT during 1979–2020. Regions above the 90% significance level are dotted.
Forecast Skill of the CFSv2 S2S Model
This section assesses the forecast skill for this extreme snowstorm event and its related circulations. Figure 11 shows snowfall in the Northeast China from the observation and ensemble mean forecast of CFSv2 S2S model. The maximum snowfall was located in the east of Northeast China on 19 November 2020 (Figure 11A). The CFSv2 S2S model was able to capture the main features of the snowfall over Northeast China at a 1–2-days lead time (Figures 11B,C), whereas the snowfall was largely underestimated in this model at the lead time of 3 days (Figure 11D). Beyond that, the CFSv2 S2S model showed insufficient predictive ability at longer lead times of one to 2 weeks ahead (Figures 11E,F). A common benchmark to measure the precipitation prediction skill has been scalar metrics, such as the spatial anomaly correlation coefficient (ACC) between observations and predictions as a function of forecast lead time (Liu et al., 2020). Taking ACC = 0.2 (90% confidence level) as the threshold of useful skill, the useful forecast was limited to a lead time of about 1–3 days in the CFSv2 S2S model (Figure 11G). The ACC decreased from 0.5 to below −0.3 with increasing lead time (Figure 11G), indicating that the skill of the CFSv2 S2S model for extreme snowfall over Northeast China is deficient.
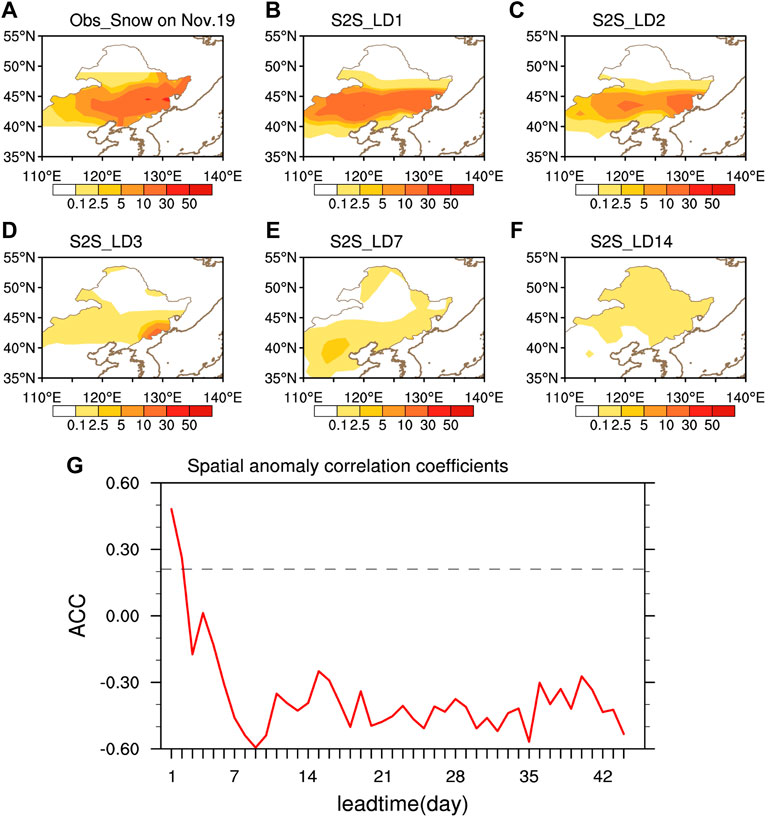
FIGURE 11. The (A) observed snowfall (unit: mm) on 19 November 2020 and (B–F) forecast ensemble mean snowfall (unit: mm) of 16 members for lead times of (B) 1 day, (C) 2 days, (D) 3 days, (E) 7 days, and (F) 14 days (G) Spatial ACC between observed and predicted snowfall of the ensemble mean from the CFSv2 S2S model over Northeast China on 19 November 2020 as a function of forecast lead in days. The dotted line indicates the spatial correlation coefficients significant at the 90% confidence level.
To understand why the skill forecast of the snowstorm is low at the lead of a week and 2 weeks (Figures 11E,F), we investigated the predictability of the lower-tropospheric synoptic circulation and WVT related to snowstorm using the CFSv2 S2S model. The CFSv2 S2S model was able to forecast the NAO and NPO patterns at lead time of 3 days (Figures 12B–D) but failed at lead times of a week and 2 weeks (Figures 12E,F). Due to the suddenly enhanced Siberian high being a trigger for this event (Figure 12A), we compare the observation and the forecast of the Siberian high index in November (Figure 12M). The prediction result of the Siberian high index at different lead times shows that it is closer to the observation at 1–3 days of lead, while the biases become larger at the lead time of 7 and 14 days. In addition, the forecast of vertically integrated WVT can capture the anomalous southerly WVT in the Northeast China at lead time of 3 days (Figures 12H–J) but was limited for the anomalous anticyclone over midlatitude North Pacific at lead of a week and 2 weeks (Figures 12K,L). Hence, the prediction skill of the extreme snow event may be on the 1–3 days weather forecast rather than climate prediction for CFSv2.
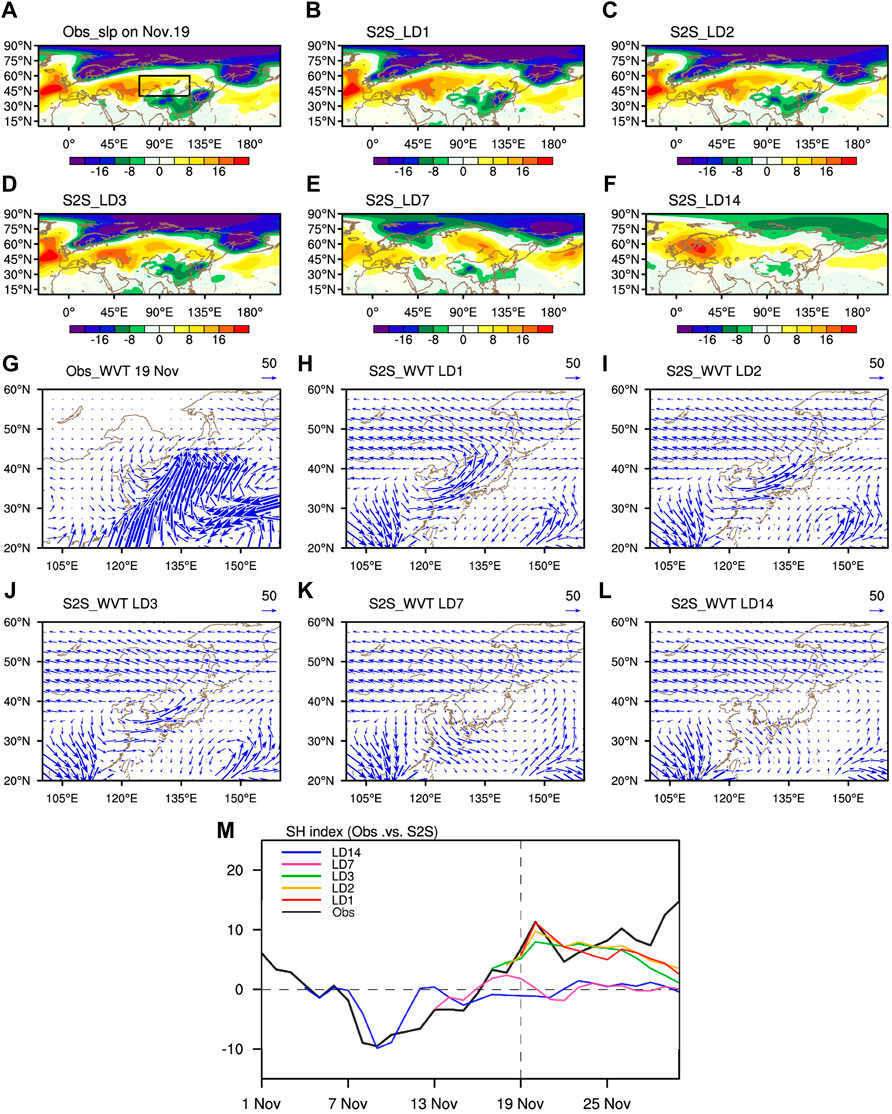
FIGURE 12. The (A) observed SLP (unit: hPa) during 19 November 2020 and (B–F) forecast ensemble mean SLP of 16 members for lead times of (B) 1 day, (C) 2 days, (D) 3 days, (E) 7 days, and (F) 14 days. Black rectangles indicate the averaging area for the Siberian high index. (G–L) As in (A–F) but for the anomalous WVT. (M) temporal evolution of the Siberian high index in November 2020 (black solid curve) and the predicted results with different leads.
Due to the monthly NPO and NAO together playing an important role in providing a supportive atmospheric background, we evaluated the 1-month-lead prediction using CFSv2. From the spatial ACCs between the observation and the ensemble prediction from 1982 to 2020 (Figure 13A), CFSv2 showed a very limited predictive skill for SLP over the mid–high-latitude Northern Hemisphere. The positive-phase NPO and NAO were the strongest and most crucial climatic systems for the snowstorm in November 2020 (Figure 13B). However, CFSv2 underestimated the SLP anomalies over the midlatitude North Pacific and Europe and overestimated the SLP over the Arctic in November 2020 (Figures 13C,D). Figure 14 shows the time series of the November NAO and NPO index derived from the observation and one-month-lead CFSv2 ensemble mean. The correlation coefficient between the observed and predicted NAO (NPO) index was only 0.19 (0.16) during 1982–2020, below the 90% significance level. In particular, in 2020, the predictions of the NAO index and NPO index were both opposed to the observation. The limited prediction skill for the NAO and NPO in CFSv2 suggests that the sources of NAO and NPO predictability may not be well represented in the model. Moreover, although CFSv2 predicted the tropical SSTA from 1982 to 2020 (Figure 13E), it underestimated the SSTA over the midlatitude North Pacific and North Atlantic in November 2020 (Figures 13G,H).
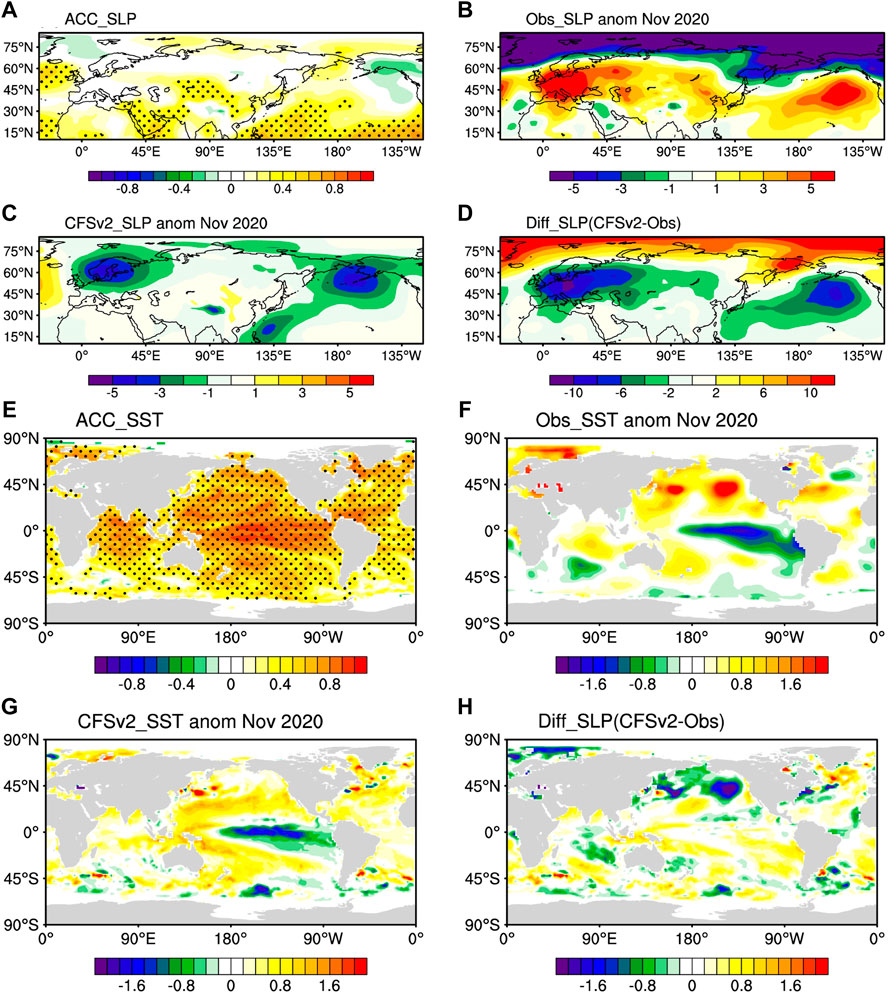
FIGURE 13. (A) Correlation coefficient between observations and the one-month-lead forecast during 1982–2020. (B,C) The anomalous SLP (unit: hPa) from (B) observations and (C) the one-month-lead forecast of CFSv2 in November 2020. (D) Difference between the one-month-lead forecast and observations. (E–H) As in (A–D) but for the anomalous SST (unit: °C) fields. Regions above the 90% significance level are dotted.
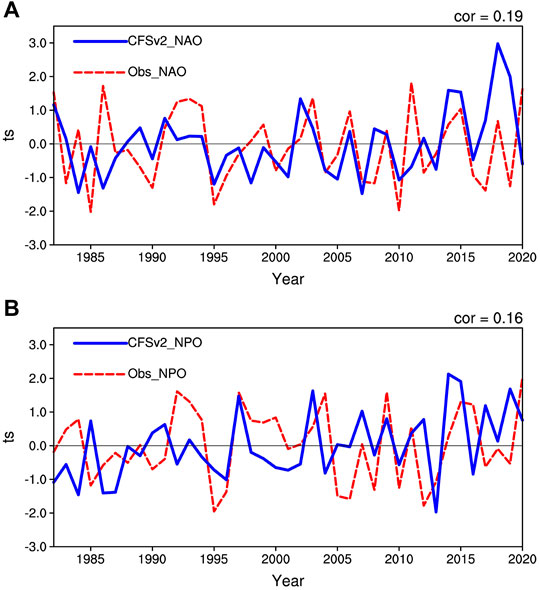
FIGURE 14. Time series of the (A) November NAO index in the observation and the one-month-lead forecast of the CFSv2 ensemble mean and (B) November NPO index in the observation and the one-month-lead forecast of the CFSv2 ensemble mean.
Conclusion and Discussion
This paper has revealed that the positive NAO and NPO were important patterns for the extreme snowstorm that occurred over Northeast China on 19 November 2020. On the synoptic scale (daily evolution), the anticyclonic anomalies over Japan associated with the positive-phase NPO played a crucial role in the accumulated water vapor prior to the snowstorm, and then the rapidly intensified Siberian high triggered this snowstorm. On the climatic scale (monthly averaged), the positive-phase NAO was significantly positively correlated with the warm conditions over Northeast China through a wave-train downstream extension, and the positive-phase NPO was responsible for the southerly WVT from the ocean to Northeast China. The phase-locked climatic and synoptic conditions strengthened the atmospheric anomalies. Next, we discussed the role of SST, revealing that the warm midlatitude North Pacific SSTA favored the maintenance of anticyclonic anomalies over Japan. The warm midlatitude North Pacific SSTA favored the positive phase of the NAO, while the La Niña event might not have been a key factor influencing the snowstorm. Another important conclusion is that CFSv2 showed limited predictive ability for the SLP and SST anomalies, and extreme snowfall in November 2020.
Finally, it is important to discuss the limitations of the present results. Since the NAO and the NPO were significantly correlated. We have computed the partial correlations between SI and NAO (exclusion of NPO effect) and between SI and NPO (exclusion of NAO effect). The result showed that the partial correlation between the NPO and snowfall index is reduced and insignificant (r = 0.13) with the influence of the NAO excluded. Moreover, the partial correlation between the NAO and snowfall index is reduced and becomes insignificant (r = 0.20) with the influence of the NPO excluded. It implied that the collaboration of the positive NAO and the positive NPO is important for the extreme snowstorm. The November snowstorm cases in other years, such as 2012 and 2013, maybe induced by the synoptic anomalies. Several snowfall cases were occurring in 2012 and 2013 with relatively moderate amounts of snowfall, and their related atmospheric anomalies are either the negative NAO and NPO or the postive NAO and the negative NPO (figures not shown). This implied that the climatic conditions of normal snowstorm events differ from the extreme snowstorms. The factors are worth further research.
The diminishing sea-ice cover in autumn has been linked to snowy winters in Eurasia (Liu et al., 2012; Li and Wang, 2013). However, the response of the extreme snowfall events and related dynamics are still unclear. The reduced sea-ice cover has the potential to contribute to a shift to a negative AO/NAO phase (Jaiser et al., 2012). Increased Eurasian snow cover in autumn dynamically forces negative AO conditions the following winter (Cohen et al., 2012). Therefore, further investigation into the impacts of sea ice and snow cover are needed. Other issues about this snowstorm case that have not been fully addressed in this study include the stratospheric climatic systems and their relationship with this event and snowstorms in general. The vertical component of lower-stratospheric wave activity over Eurasia is closely related to the subsequent development of hemisphere-wide surface circulation anomalies (Cohen et al., 2007). Although Rosenblum and Sanders (1974) argued that the anthropogenic heat source cannot be the primary cause of the cyclogenesis of a snowstorm event, recent studies have proven that human influence on changes in snowfall are detectable (Chen et al., 2020). Therefore, the potential anthropogenic contribution to heavy snowfall events is an interesting topic for future work.
Data Availability Statement
The original contributions presented in the study are included in the article/Supplementary Material, further inquiries can be directed to the corresponding author.
Author Contributions
KF contributed to conception and design of the study. LW drafted the work. All authors have the equal contributions to analysis of data and revision the work and to approve of publication.
Funding
This study was funded by the National Natural Science Foundation of China (NSFC) (Grant Nos. 42088101 and 41730964) and the Innovation Group Project of the Southern Marine Science and Engineering Guangdong Laboratory (Zhuhai) (Grant No. 311021001).
Conflict of Interest
The authors declare that the research was conducted in the absence of any commercial or financial relationships that could be construed as a potential conflict of interest.
Publisher’s Note
All claims expressed in this article are solely those of the authors and do not necessarily represent those of their affiliated organizations, or those of the publisher, the editors and the reviewers. Any product that may be evaluated in this article, or claim that may be made by its manufacturer, is not guaranteed or endorsed by the publisher.
Acknowledgments
We are grateful to the editors and reviewers for their insightful comments.
Footnotes
1Natural disasters over China in November (2020) This event affected a population of 288,000 in Northeast China, and the area of crop damage exceeded 800 ha, and caused heavy destruction of buildings around 3 million square meters, with direct economic losses of RMB 700 million.
References
Ao, J., and Sun, J. (2016). Decadal Change in Factors Affecting winter Precipitation over Eastern China. Clim. Dyn. 46 (1-2), 111–121. doi:10.1007/s00382-015-2572-7
Bai, L., Shi, C., Shi, Q., Li, L., Wu, J., Yang, Y., et al. (2019). Change in the Spatiotemporal Pattern of Snowfall during the Cold Season under Climate Change in a Snow‐dominated Region of China. Int. J. Climatol 39 (15), 5702–5719. doi:10.1002/joc.6182
Bollasina, M. A., and Messori, G. (2018). On the Link between the Subseasonal Evolution of the North Atlantic Oscillation and East Asian Climate. Clim. Dyn. 51 (9-10), 3537–3557. doi:10.1007/s00382-018-4095-5
Chen, C., Wang, P., Yang, X., and Li, H. (2012). Classification and Features of Spatio-Temporal Variation of Snowstorms in Northeast China. Scientia Geographica Sinica 32 (10), 1275–1281. doi:10.13249/j.cnki.sgs.2012.010.1275
Chen, H., Sun, J., and Lin, W. (2020). Anthropogenic Influence Would Increase Intense Snowfall Events over Parts of the Northern Hemisphere in the Future. Environ. Res. Lett. 15 (11), 114022. doi:10.1088/1748-9326/abbc93
Chen, S., and Song, L. (2018). Impact of the Winter North Pacific Oscillation on the Surface Air Temperature over Eurasia and North America: Sensitivity to the Index Definition. Adv. Atmos. Sci. 35 (6), 702–712. doi:10.1007/s00376-017-7111-5
Cohen, J., Barlow, M., Kushner, P. J., and Saito, K. (2007). Stratosphere-troposphere Coupling and Links with Eurasian Land Surface Variability. J. Clim. 20 (21), 5335–5343. doi:10.1175/2007jcli1725.1
Cohen, J. L., Furtado, J. C., Barlow, M. A., Alexeev, V. A., and Cherry, J. E. (2012). Arctic Warming, Increasing Snow Cover and Widespread Boreal winter Cooling. Environ. Res. Lett. 7 (1), 014007. doi:10.1088/1748-9326/7/1/014007
Czaja, A., and Frankignoul, C. (2002). Observed Impact of Atlantic SST Anomalies on the North Atlantic Oscillation. J. Clim. 15 (6), 606–623. doi:10.1175/1520-0442(2002)015<0606:Oioasa>2.0.Co;2
Ding, Y., and Krishnamurti, T. N. (1987). Heat Budget of the Siberian High and the Winter Monsoon. Mon. Wea. Rev. 115 (10), 2428–2449. doi:10.1175/1520-0493(1987)115<2428:hbotsh>2.0.co;2
Dong, X., Zhou, S., Hu, Z., Wang, C., and Wang, X. (2010). Characteristics of Spatial and Temporal Variation of Heavy Snowfall in Northeast China in Recent 50 Years. Meteorol. Monthly 36 (12), 74–79. doi:10.7519/j.issn.1000-0526.2010.12.011
Fan, K., and Tian, B. (2013). Prediction of Wintertime Heavy Snow Activity in Northeast China. Chin. Sci. Bull. 58 (12), 1420–1426. doi:10.1007/s11434-012-5502-7
Fang, J., and Yang, X.-Q. (2016). Structure and Dynamics of Decadal Anomalies in the Wintertime Midlatitude North Pacific Ocean-Atmosphere System. Clim. Dyn. 47 (5-6), 1989–2007. doi:10.1007/s00382-015-2946-x
Feliks, Y., Ghil, M., and Simonnet, E. (2004). Low-Frequency Variability in the Midlatitude Atmosphere Induced by an Oceanic Thermal Front. J. Atmos. Sci. 61 (9), 961–981. doi:10.1175/1520-0469(2004)061<0961:lvitma>2.0.co;2
Feng, Y., and Chen, H.-P. (2016). Warming over the North Pacific Can Intensify Snow Events in Northeast China. Atmos. Oceanic Sci. Lett. 9 (2), 122–128. doi:10.1080/16742834.2016.1133072
Griffies, S. M., Harrison, M. J., Pacanowski, R. C., Rosati, A., and Slater, R. (2004). A Technical Guide to MOM4.
Hu, Z., and Zhou, W. (2005). Cast Study on the Genesis of a Snowstorm over the Northeast Region in China. J. Nanjing Inst. Meteorology 28 (5), 599–684.
Huang, W., Chen, F., Feng, S., Chen, J., and Zhang, X. (2013). Interannual Precipitation Variations in the Mid-latitude Asia and Their Association with Large-Scale Atmospheric Circulation. Chin. Sci. Bull. 58 (32), 3962–3968. doi:10.1007/s11434-013-5970-4
IPCC (2021). Climate Change 2021: The Physical Science Basis. Contribution of Working Group I to the Sixth Assessment Report of the Intergovernmental Panel on Climate Change. Cambridge University Press. (In press).
Jaiser, R., Dethloff, K., Handorf, D., Rinke, A., and Cohen, J. (2012). Impact of Sea Ice Cover Changes on the Northern Hemisphere Atmospheric winter Circulation. Tellus A: Dynamic Meteorology and Oceanography 64 (1), 11595. doi:10.3402/tellusa.v64i0.11595
Jia, X., and Ge, J. (2017). Interdecadal Changes in the Relationship between ENSO, EAWM, and the Wintertime Precipitation over China at the End of the Twentieth Century. J. Clim. 30 (6), 1923–1937. doi:10.1175/jcli-d-16-0422.1
Jiang, D., Min, J., and Qiao, X. (2014). The Dynamical Mechanism Analysis of an Extraordinary Snowstorm over the South of Northeast. Trans. Atmos. Sci. 37 (5), 605–612.
Kalnay, E., Kanamitsu, M., Kistler, R., Collins, W., Deaven, D., Gandin, L., et al. (1996). The NCEP/NCAR 40-Year Reanalysis Project. Bull. Amer. Meteorol. Soc. 77, 437–471. doi:10.1175/1520-0477(1996)077<0437:tnyrp>2.0.co;2
Kim, T., and Jin, E. K. (2016). Impact of an Interactive Ocean on Numerical Weather Prediction: A Case of a Local Heavy Snowfall Event in Eastern Korea. J. Geophys. Res. Atmos. 121 (14), 8243–8253. doi:10.1002/2016jd024763
Kim, T., Kim, Y., Moon, J.-H., and Jin, E. K. (2020). Dynamical Response of Atmospheric Circulation to below-normal East Sea Sea Surface Temperatures Associated with Heavy Snowfall in Eastern Korea. Environ. Res. Lett. 15 (7), 074024. doi:10.1088/1748-9326/ab8dd9
Li, F., and Wang, H. (2013). Autumn Sea Ice Cover, Winter Northern Hemisphere Annular Mode, and Winter Precipitation in Eurasia. J. Clim. 26 (11), 3968–3981. doi:10.1175/Jcli-D-12-00380.1
Li, J., Xie, T., Tang, X., Wang, H., Sun, C., Feng, J., et al. (2021a). Influence of the NAO on Wintertime Surface Air Temperature over East Asia: Multidecadal Variability and Decadal Prediction. Adv. Atmos. Sci. 1, 1. doi:10.1007/s00376-021-1075-1
Li, N., Jiao, B., Ran, L., Shen, X., and Qi, Y. (2021b). On the Mechanism of a Terrain-Influenced Snow Burst Event during Midwinter in Northeast China. Adv. Atmos. Sci. 38 (5), 800–816. doi:10.1007/s00376-020-0104-9
Lian, Y., Shen, B., Li, S., Zhao, B., Gao, Z., Liu, G., et al. (2013). Impacts of Polar Vortex, NPO, and SST Configurations on Unusually Cool Summers in Northeast China. Part I: Analysis and Diagnosis. Adv. Atmos. Sci. 30 (1), 193–209. doi:10.1007/s00376-012-1258-x
Liu, B., Yan, Y., Zhu, C., Ma, S., and Li, J. (2020). Record‐Breaking Meiyu Rainfall Around the Yangtze River in 2020 Regulated by the Subseasonal Phase Transition of the North Atlantic Oscillation. Geophys. Res. Lett. 47 (22), 1. doi:10.1029/2020gl090342
Liu, J., Curry, J. A., Wang, H., Song, M., and Horton, R. M. (2012). Impact of Declining Arctic Sea Ice on winter Snowfall. Proc. Natl. Acad. Sci. 109 (11), 4074–4079. doi:10.1073/pnas.1114910109
Liu, Y., Yu, H., Ren, G., and Zhou, J. (2010). Temporal and Spatial Variation Characteristics of the Snow Storms in Heilongjiang Province during 1961-2006. Climatic Environ. Res. 15 (4), 470–478.
Mote, T. L., Gamble, D. W., Underwood, S. J., and Bentley, M. L. (1997). Synoptic-scale Features Common to Heavy Snowstorms in the Southeast United States. Wea. Forecast. 12 (1), 5–23. doi:10.1175/1520-0434(1997)012<0005:ssfcth>2.0.co;2
Natural disasters over China in November (2020). Ministry of Emergency Management of the People's Republic of China. [Online]. Available: https://www.mem.gov.cn/xw/bndt/202012/t20201203_373234.shtml (Accessed November 18th, 2021 2021).
Rayner, N. A., Parker, D. E., Horton, E. B., Folland, C. K., Alexander, L. V., Rowell, D. P., et al. (2003). Global Analyses of Sea Surface Temperature, Sea Ice, and Night marine Air Temperature since the Late Nineteenth century. J. Geophys. Research-Atmospheres 108 (D14), 440710. doi:10.1029/2002jd002670
Révelard, A., Frankignoul, C., and Kwon, Y.-O. (2018). A Multivariate Estimate of the Cold Season Atmospheric Response to North Pacific SST Variability. J. Clim. 31 (7), 2771–2796. doi:10.1175/jcli-d-17-0061.1
Rodwell, M. J., Rowell, D. P., and Folland, C. K. (1999). Oceanic Forcing of the Wintertime North Atlantic Oscillation and European Climate. Nature 398 (6725), 320–323. doi:10.1038/18648
Rogers, J. C. (1981). The North Pacific Oscillation. J. Climatol. 1 (1), 39–57. doi:10.1002/joc.3370010106
Ropelewski, C. F., and Halpert, M. S. (1987). Global and Regional Scale Precipitation Patterns Associated with the El Niño/Southern Oscillation. Mon. Wea. Rev. 115 (8), 1606–1626. doi:10.1175/1520-0493(1987)115<1606:garspp>2.0.co;2
Rosenblum, H. S., and Sanders, F. (1974). Meso-Analysis of a Coastal Snowstorm in New England. Mon. Wea. Rev. 102 (6), 433–442. doi:10.1175/1520-0493(1974)102<0433:maoacs>2.0.co;2
Saha, S., Moorthi, S., Wu, X., Wang, J., Nadiga, S., Tripp, P., et al. (2014). The NCEP Climate Forecast System Version 2. J. Clim. 27 (6), 2185–2208. doi:10.1175/jcli-d-12-00823.1
Smith, S. R., and O'Brien, J. J. (2001). Regional Snowfall Distributions Associated with ENSO: Implications for Seasonal Forecasting. Bull. Amer. Meteorol. Soc. 82 (6), 1179–1191. doi:10.1175/1520-0477(2001)082<1179:rsdawe>2.3.co;2
Sun, J., Wang, H., and Yuan, W. (2009). A Preliminary Investigation on Causes of the Catastrophic Snowstorm in March,2007 in the Northeastern Parts of China. Acta Meteorologica Sinica 67 (3), 469–477.
Takaya, K., and Nakamura, H. (2001). A Formulation of a Phase-independent Wave-Activity Flux for Stationary and Migratory Quasigeostrophic Eddies on a Zonally Varying Basic Flow. J. Atmos. Sci. 58 (6), 608–627. doi:10.1175/1520-0469(2001)058<0608:afoapi>2.0.co;2
Tao, L., Yang, X.-Q., Fang, J., and Sun, X. (2020). PDO-related Wintertime Atmospheric Anomalies over the Midlatitude North Pacific: Local versus Remote SST Forcing. J. Clim. 33 (16), 6989–7010. doi:10.1175/jcli-d-19-0143.1
Uccellini, L. W., and Johnson, D. R. (1979). The Coupling of Upper and Lower Tropospheric Jet Streaks and Implications for the Development of Severe Convective Storms. Mon. Wea. Rev. 107 (6), 682–703. doi:10.1175/1520-0493(1979)107<0682:tcoual>2.0.co;2
Vitart, F., Ardilouze, C., Bonet, A., Brookshaw, A., Chen, M., Codorean, C., et al. (2017). The Subseasonal to Seasonal (S2s) Prediction Project Database. Bull. Am. Meteorol. Soc. 98 (1), 163–173. doi:10.1175/Bams-D-16-0017.1
Wang, B., Wu, R., and Fu, X. (2000). Pacific-east Asian Teleconnection: How Does ENSO Affect East Asian Climate? J. Clim. 13 (9), 1517–1536. doi:10.1175/1520-0442(2000)013<1517:peathd>2.0.co;2
Wang, H., Yu, E., and Yang, S. (2011). An Exceptionally Heavy Snowfall in Northeast china: Large-Scale Circulation Anomalies and Hindcast of the NCAR WRF Model. Meteorol. Atmos. Phys. 113, 11–25. doi:10.1007/s00703-011-0147-7
Wang, L., Chen, W., and Huang, R. (2007). Changes in the Variability of North Pacific Oscillation Around 1975/1976 and its Relationship with East Asian winter Climate. J. Geophys. Res. 112 (D11), 1. doi:10.1029/2006jd008054
Wang, L., Fan, K., and Xu, Z. (2020). Comparison of the Causes of High-Frequency Heavy and Light Snowfall on Interannual Timescales over Northeast China. Atmosphere 11 (9), 936. doi:10.3390/atmos11090936
Watanabe, M. (2004). Asian Jet Waveguide and a Downstream Extension of the North Atlantic Oscillation. J. Clim. 17 (24), 4674–4691. doi:10.1175/Jcli-3228.1
Watanabe, M., and Kimoto, M. (2000). Atmosphere-ocean thermal Coupling in the North Atlantic: A Positive Feedback. Q.J R. Met. Soc. 126 (570), 3343–3369. doi:10.1002/qj.49712657017
Wen, M., Yang, S., Kumar, A., and Zhang, P. (2009). An Analysis of the Large-Scale Climate Anomalies Associated with the Snowstorms Affecting China in January 2008. Monthly Weather Rev. 137 (3), 1111–1131. doi:10.1175/2008mwr2638.1
Wu, B., and Huang, R. (1999). Effects of the Extremes in the North Atlantic Oscillation on East Asia Winter Monsoon. Chin. J. Atmos. Sci. 1 (06), 641–651. doi:10.1016/j.earscirev.2016.10.014
Xin, S. U. N., Xiangning, C. A. I., Chuanlei, C., Xuxuan, J. I. A., and Xiaoshi, Q. (2011). Analysis of the 4 March 2007 Heavy Snowstorm in Northeast China. Meteorol. Monthly 37 (7), 863–870.
Xu, T., Shi, Z., Wang, H., and An, Z. (2016). Nonstationary Impact of the winter North Atlantic Oscillation and the Response of Mid-latitude Eurasian Climate. Theor. Appl. Climatol 124 (1-2), 1–14. doi:10.1007/s00704-015-1396-z
Keywords: extreme snowstorm event, northeast China, synoptic and climate condition, NPO, NAO, subseasonal-seasonal climate predictability
Citation: Wang L and Fan K (2022) Synoptic and Climatic Conditions of an Extreme Snowstorm Event Over Northeast China and Its Climate Predictability. Front. Earth Sci. 10:835061. doi: 10.3389/feart.2022.835061
Received: 14 December 2021; Accepted: 14 January 2022;
Published: 04 February 2022.
Edited by:
Fahu Chen, Institute of Tibetan Plateau Research (CAS), ChinaReviewed by:
Jie Chen, Lanzhou University, ChinaGuolin Feng, National Climate Center, China
Pang-chi Hsu, Nanjing University of Information Science and Technology, China
Copyright © 2022 Wang and Fan. This is an open-access article distributed under the terms of the Creative Commons Attribution License (CC BY). The use, distribution or reproduction in other forums is permitted, provided the original author(s) and the copyright owner(s) are credited and that the original publication in this journal is cited, in accordance with accepted academic practice. No use, distribution or reproduction is permitted which does not comply with these terms.
*Correspondence: Ke Fan, ZmFuazhAbWFpbC5zeXN1LmVkdS5jbg==