 C. Lambert
 M. Larocque
 S. Gagné
 M. Garneau
- 1Department of Earth and Atmospheric Sciences, Université du Québec à Montréal, Montreal, QC, Canada
- 2Geotop Research Center, Université du Québec à Montréal, Montreal, QC, Canada
- 3GRIL Research Center, Université du Québec à Montréal, Montreal, QC, Canada
- 4Department of Geography, Université du Québec à Montréal, Montreal, QC, Canada
The conditions in which groundwater inflow occurs in boreal peatlands and its contribution to peatland water balance are still poorly understood. The objectives of this research were to quantify the hydrological connectivity between a surficial aquifer and a peatland, and to identify the controlling factors in boreal peatlands of north-central Quebec (Canada). The peatlands were instrumented with piezometers and groundwater levels were monitored during two growing seasons. Hydraulic conductivities were measured on peat cores and in situ, groundwater inflows and outflows were calculated using the Darcy equation. The peatland water budgets were simulated for the two peatlands with a steady-state groundwater flow model to verify flow hypotheses, to quantify unmeasured flows and to explore recharge scenarios leading to changes in connectivity. The two peatlands have contrasted water budgets, with recharge representing the largest inflow (78%) and subsurface runoff representing the largest outflow (85%) the peatland with the smallest catchment area (Misask). The peatland with the largest catchment area (Cheinu) is also located downgradient within the regional watershed. Its inflows are dominated by groundwater (56%) and its outflows are mostly towards subsurface runoff (74%). The two peatlands are in conditions of precipitation excess and a recharge reduction would not affect their peatland heads markedly (<10 cm). However, recharge changes could induce larger modifications in groundwater inflows and outflows for the peatland with a larger catchment area. The dominating peatland hydrological functions are thus contrasted at the two sites, and it is hypothesized that the water table depths thresholds triggering changes between storage, transmission and runoff functions are also different. Although further studies remain to be done to understand how hydrological conditions change through time, and ultimately what are the long-term impacts of a changing climate on hydrology, vegetation and carbon accumulation, this work shows that understanding peatland hydrology requires to consider hydrological conditions beyond the peatland limits.
1 Introduction
Peatlands cover 12–17% of Canada (Tarnocai et al., 2000) and approximately 9–12% of the province of Quebec (Payette and Rochefort, 2001). Canadian boreal peatlands correspond to almost half of the Earth’s wetland cover (Richardson et al., 2021). In the north-central region of Quebec, peatlands are mostly characterized by poor fens dominated by a succession of elongated strings and pool microforms parallel to the slope (Payette and Rochefort, 2001; Robitaille et al., 2021) comparable to Fennoscandia and northwestern Russia boreal aapa mires (Seppälä and Koutaniemi, 1985; Foster and Fritz, 1987).
Peatland hydrology has received much scientific attention over the past decades (Whittington and Price, 2006; Spence et al., 2011; Waddington et al., 2015; Goodbrand et al., 2019). Their carbon storage capacity is another focus of many studies (Yu, 2011; Gallego-Sala et al., 2018; Loisel et al., 2021). Peatland resilience to natural and anthropic disturbances such as drainage (e.g., Menberu et al., 2018; Harris et al., 2020), roads (Saraswati et al., 2020; Elmes et al., 2021), fires (Bourgeau-Chavez et al., 2020; Nelson et al., 2021), and climate change is also of growing concern. According to some climate projections, northern peatlands will experience an increase in vapor pressure deficit (Yuan et al., 2019), resulting in increased evapotranspiration that could exceed that of the surrounding boreal forest (Helbig et al., 2020). However in Eastern Canada, and more specifically in northern Quebec (Canada), climate projections for the middle of the 21st century predict a warmer and wetter climate (Ouranos, 2015). Generally speaking, these conditions can lead to important changes in groundwater recharge (Ireson et al., 2015; Schneider et al., 2016), which can affect water table depths, and consequently impact the influx of groundwater to peatlands (e.g., Hokanson et al., 2020).
Although peatland hydrological functions have been the subject of few quantitative studies, it has been shown that peatlands can recharge the aquifer, store and transmit water, and sustain discharge to rivers and streams (cf. Goodbrand et al., 2019). It is recognized that these flows can be highly variable depending on the geological and climatic contexts (Kløve et al., 2014). Groundwater flow models have been used to quantify flows exchanged between aquifers and peatlands, showing that groundwater inflow can represent up to 50% of the peatland water budget in southern Quebec (Bourgault et al., 2014; Levison et al., 2014). However, aquifer-peatland hydrological connectivity is still poorly documented, especially in boreal peatlands that have been relatively seldomly studied in northern Canada. Sensitivity of aquifer-peatland connectivity to recharge has been addressed in the scientific literature with groundwater flow models that explicitly represent the hydrogeological characteristics of both the geological media and the organic deposits (e.g., Bourgault et al., 2014; Levison et al., 2014; Rossi et al., 2014; Thompson et al., 2015; Li et al., 2019). Autio et al. (2020) summarize studies that have used integrated surface-subsurface flow models including peatlands to study this connectivity. These authors report that peat properties and landscape topography are crucial parameters in models aimed at quantifying interactions between surface and subsurface reservoirs.
The objectives of this research were to quantify aquifer-peatland hydrological connectivity and identify controlling factors in boreal peatlands of north-central Quebec (Canada). Groundwater levels were monitored over two growing seasons, peat and aquifer hydraulic conductivities were measured in situ and in laboratory conditions, groundwater inflows and outflows were calculated using field measured data. Groundwater flow models were built to verify flow hypotheses, to quantify unmeasured flows and to explore recharge scenarios leading to changes in connectivity.
2 Materials and Methods
2.1 Study Sites
2.1.1 Geology
The two studied peatlands are located in the north-central region of Quebec (eastern Canada), near the Stornoway Inc. diamond mine (named Renard mine). The retreat of the Laurentide Ice Sheet occurred between 7,800 and 7,450 cal BP (Dyke et al., 2003). Surface deposits are dominated by sandy to silty (including boulders) glacial till showing elongated erosional (drumlins) forms associated with subparallel eskers oriented at N220° (Lamarche and Hébert, 2020). Available drilling data show that glacial till can reach 30 m (Desbiens, 2008) and glaciofluvial deposits can exceed 40 m (Lamarche and Hébert, 2020). Surface deposits are highly permeable and there are no marine or lacustrine deposits. The vertical stratigraphy is known precisely, but considering the post-glacial environment, it is probably not highly complex and does not lead to large vertical heterogeneity. The hydraulic properties of Quaternary deposits and underlying bedrock have not been measured prior to this study. The surficial aquifer is unconfined, and the water table is expected to be shallow throughout the region, as indicated by data from a 5 m-deep well in the granular aquifer (aquifer depth unknown; average water table depth 35 cm).
2.1.2 Misask and Cheinu Peatlands
Peatlands in the region developed in depressions of the Precambrian Shield. The Misask (52° 43′ 27″ N, 72° 12′ 50″ W) and Cheinu (52° 38′ 48″ N, 72° 11′ 31″ W) peatlands (unofficial names) are located at the ecotone between the open (taiga) and closed boreal forest biomes (Figure 1). Peat accumulation initiated ca. 6,430 and 6,560 cal BP (Robitaille et al., 2021), suggesting early post-glacial initial vegetation cover. This region represents the biogeographic limit of ombrotrophic peatlands, which dominate the boreal region and are gradually replaced by oligotrophic patterned fens with abundant pools moving northwards (Payette and Rochefort, 2001). Both peatlands show a minerotrophic surface pattern with alternating elongated strings and pools parallel to the slope, and have undergone recent ombrotrophication over the past decades (Robitaille et al., 2021). Surface vegetation is generally dominated by Sphagnum moss species, with local changes controlled by microtopography with herbaceous species (Carex spp. and Trichophorum cespitosum) mainly found in depressions while ericaceous species (Chamaedaphne calyculata and Kalmia angustifolia) are found in strings (Robitaille et al., 2021). Peripheral minerotrophic areas are characterized by thinner peat (<1 m), with black spruce (Picea mariana) and larch (Larix laricina) and show recent and ongoing paludification.
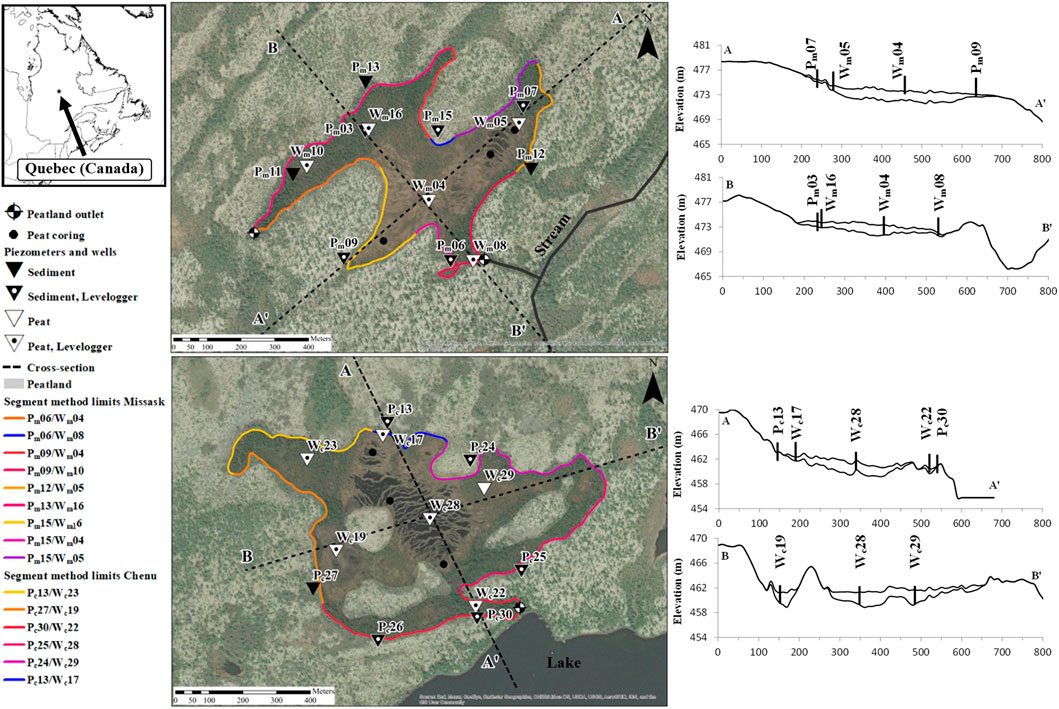
FIGURE 1. Location of the studied peatlands, location of wells (W) and piezometers (P), contour sections used in the Darcy flow calculation, and peatland transects at a) the Misask (m) peatland and b) the Cheinu c) peatland.
A detailed digital elevation model (DEM) was produced using photogrammetric data from a drone survey (Stornoway Mine, unpublished data). Elevations within the peatlands and for all the piezometers were measured using a differential global positioning system (DGPS). The vertical precision of the DGPS data is estimated to be 1 cm in static mode (USGS, 2021). The photogrammetric DTM was geo-referenced to match the DGPS survey with respective XY error and Z error of 0.004 and 0.005 m (Misask) and 0.005 and 0.006 (Cheinu).
Data show that the studied peatlands developed in local depressions created by the drumlin and moraine landscape. These depressions are underlain by boulders and sand-filled interstices inherited from excessive till leaching (Dionne, 1978), which represent an unusually permeable substratum for peatland development. The Misask peatland (0.102 km2) developed in a relatively flat landscape (immediate uphill slope 0.5%) and the peat surface has an average slope of 1%. Shallow pools covering approximately 10% of its total area, are found exclusively in the eastern portion of the peatland. The Cheinu peatland (0.147 km2) developed in a deeper bowl-shaped depression located at the base of a 6.7% slope. The peatland surface has an average slope of 0.5%. The Cheinu peatland shows well-developed pools, perpendicular to the slope and covering 60% of the area. Robitaille et al. (2021) reported a mean peat thickness of 0.71 and 0.87 m for Misask and Cheinu respectively. Maximum peat thickness is reached in the central patterned area of the Misask site (2.08 m) and in the southwest floating moss-mat area of the Cheinu site (3.28 m) (Table 1).
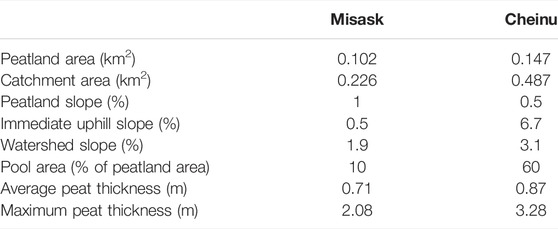
TABLE 1. Characteristics of the Misask and Cheinu peatlands
Located in the upper part of the large Eastmain River watershed (46,000 km2), the peatlands are also included within the Misask River watershed, an important tributary of the Eastmain River. Their respective catchment areas cover 0.226 km2 (Misask) and 0.487 km2 (Cheinu), ranging in altitude between 483 and 468 m for Misask (average slope 1.9%) and 482 and 455 m for Cheinu (average slope 3.1%). The peatland watersheds show successions of small kettle lakes connected to minor streams. Permanent outflows are present at the two peatlands in the shallower paludified areas dominated by bryophytes and black spruce. The eastern outlet of the Misask site feeds a small intermittent stream and a second outlet also runs south (Figure 1). Narrow paludified areas in the southern portion of the Cheinu peatland contribute to a 1.8 m-wide outlet stream that flows into the downstream lake.
2.1.3 Meteorological Conditions
Meteorological data were obtained from a weather station located approximately 15 km north, at the Stornoway mine. Between 2017 and 2019, annual precipitation (P) varied between 779 and 821 mm yr−1 (mean 797 mm yr−1). The average annual temperature was −3.0°C, with snow occurring between mid-October and May. The potential evapotranspiration rate (PET) was calculated using the equation of Oudin et al. (2005), based on the mean daily air temperature, and the estimate of Morton (1983) of extraterrestrial radiation. Annual PET for 2017 to 2019 ranged between 341 and 372 mm yr−1 (mean 360 mm yr−1). Documented evapotranspiration rates in northern peatlands have been found to be equivalent to or slightly lower than PET (e.g., Wu et al., 2010).
2.2 Peatland Instrumentation and Monitoring
Between June 2018 and October 2019, the peatlands were instrumented with five piezometers set in the mineral deposit (Pm or Pc, “m” stands for Misask and “c” stands for Cheinu; Figure 1) and five observation wells within the peatlands (Wm or Wc; Figure 1), each equipped with water level loggers (Solinst) recording hourly. The piezometers consisted of 25 mm-diameter PVC tubes with 0.3 m-long screens at their base. The wells were made of similar pipes but were screened from top to bottom within the peat deposits. A barometer (Solinst) was installed at the Cheinu site for barometric compensation. In the Misask and Cheinu peatlands respectively, five and eight additional non-instrumented piezometers and wells were used for manual head measurements during each field visit (June, July, and September 2018, and June and September 2019).
At each site, a metal rod was inserted through the peat (lawn) and fixed into the underlying mineral deposit to estimate peat contraction and expansion between field campaigns. The variation in measured seasonal peat elevations was negligible, with a maximum of 1 cm (Misask) and 2.5 cm (Cheinu).
2.3 Hydraulic Conductivities
Two marginal and one central 1 m peat cores were collected at the deepest locations of each peatland (Figure 1) using a Box corer (Jeglum et al., 1992). The cores were wrapped and brought to the laboratory, where they were kept at 4°C until further analysis. The cores were later cut with a serrated knife into 8 cm × 8 cm x 8 cm cubes. Vertical and horizontal peat hydraulic conductivities were measured using the Modified Cube Method (MCM; Beckwith et al., 2003), following the instructions of Rosa and Larocque (2008).
Slug tests were performed in the piezometers located in the surrounding glacial till and in the fluvioglacial deposits to estimate their hydraulic conductivities. Falling-head tests were conducted by adding a volume of water (i.e., from 10 to 90 ml, depending on recovery time), or by using the logger as a slug, in the PVC tube with recording frequency set to a 2 s interval. Two or three slug tests were performed for each piezometer and the results were interpreted using the Hvorslev (1951) method.
2.4 Peatland Inflows and Outflows
Elevations of all piezometers and wells, of the surrounding water bodies, as well as data from three existing observation wells at the Renard Mine airport, were extracted from the DEM-derived topographical data. Horizontal hydraulic gradients were calculated between neighboring peatland well and mineral piezometer pairs to estimate groundwater flows between the aquifer and the peatland using Darcy’s Law and the segment method (Rosenberry and LaBaugh, 2008):
where qA-P is the unitary flow exchanged horizontally between the peat and the mineral deposits (mm yr−1), Kh is the geometric mean horizontal hydraulic conductivity (m s−1) between mineral deposits (average value derived from the slug tests) and peat (average value for the top 30 cm of peat derived from MCM peat core measurement), lj is the length of each segment around the peatland (m; colored peat contour sections on Figure 1), dp is either the average peat thickness or the maximum peat thickness (m) (the two values are used to set an interval of possible fluxes), ih is the horizontal hydraulic gradient (m m−1) estimated from the average heads available for the piezometer-well pair, and Ap is the peatland area (m2). The sign of the hydraulic gradient determines whether there is an inflow from the aquifer to the peatland or an outflow from the peatland to the aquifer.
Similarly, vertical hydraulic gradients were calculated between peatland wells and piezometers located within the mineral deposits in the well vicinity:
where qv is the unitary flow exchanged vertically between the peat and the mineral deposits (mm yr−1), Kv is the geometric mean vertical hydraulic conductivity (m s−1) between mineral deposits (average value derived from the slug tests) and peat (average value at 92 cm derived from MCM peat core measurement), and ih is the horizontal hydraulic gradient (m m−1) estimated from the average heads available at the piezometer-well pair for each segment (cf. colored peat contour sections on Figure 1).
Groundwater recharge represents the vertical water inflow to the peatland through its unsaturated zone. It was estimated using annual net precipitation values (recharge = Pnet = P–PET) between 2017 and 2019, based on the hypothesis that there is limited runoff due to the high hydraulic conductivity of the surface deposits. Pnet varies between 414 and 450 mm yr−1 (average 434 mm yr−1). The surface outflow from the peatland at the main outlet of the Cheinu peatland was measured manually during each site visit using a current flow meter (Swoffer). Flow rates were calculated using the velocity-area method (Herschy, 1993). The outlets of the Misask peatland were too diffuse to allow similar field measurement.
2.5 Groundwater Flow Model
A finite-difference steady-state groundwater flow model was developed in MODFLOW (Harbaugh, 2005) for each peatland. The MODFLOW platform in steady-state conditions was justified by the available data describing the simulated system (geometry and some hydraulic conductivities values). A grid with a maximum cell size of 128 m was gradually refined to 4 m cells near and within the peatland. Fourteen vertical layers reaching a total depth of 70 m were used, with thickness gradually increasing from 0.25 m in the top 2–30 m. The impact of cell size on simulations were tested prior to reaching these values (not shown) and are similar those reported by Levison et al. (2014).
The Misask and Cheinu models cover 15.37 and 7.14 km2 respectively (approximately 47 and 11 times their watershed areas) to ensure that the boundary conditions have a limited effect on modeling results. Model boundaries were composed of rivers and lakes as full-depth constant head boundaries, connected by no-flow segments identified from the piezometric maps. The lower limit is set as a no-flow boundary. Due to the lack of information on their connectivity to the surficial aquifer, the small lakes located inside the models were represented with constant heads constrained to the top layers (Figure 2). The impact of the boundary conditions on simulated heads and flows was tested and estimated to be negligible (results not shown). The peat thickness was defined based on data presented in Robitaille et al. (2021).
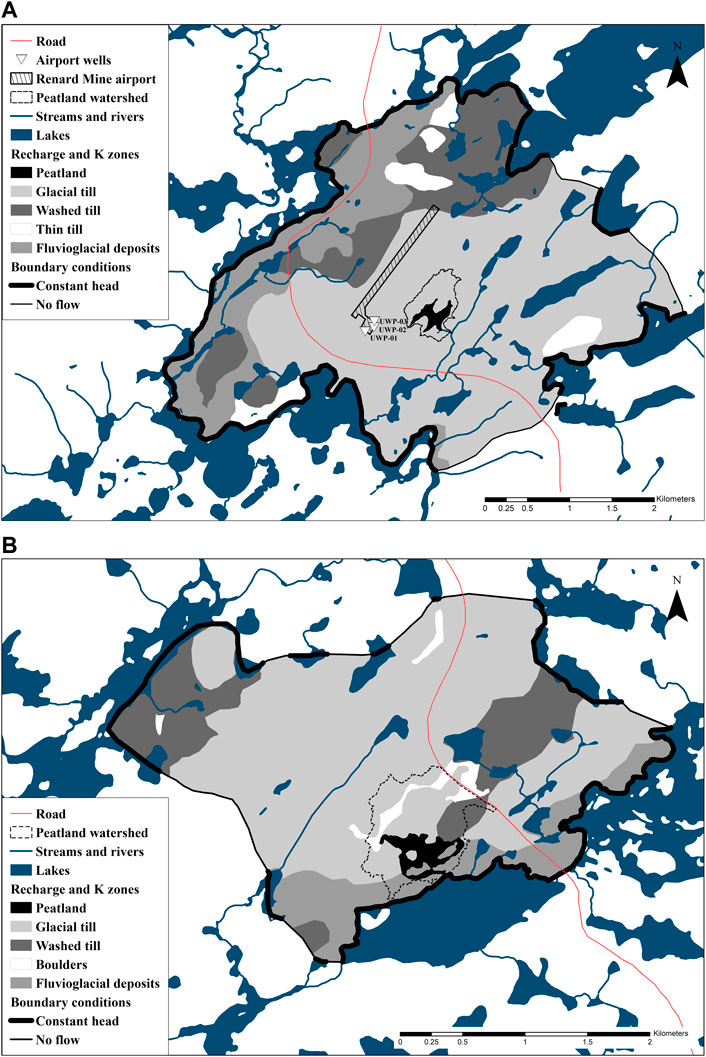
FIGURE 2. Conceptual groundwater flow context, showing boundary conditions as well as recharge zones and hydraulic conductivity zones for (A) the Misask peatland and (B) the Cheinu peatland.
Outside the peatlands, infiltration zones and hydraulic conductivity zones were established based on the Quaternary deposits map. Each model was discretized into five distinct zones including the peatland (Figure 2). Sediment types were different for the two peatlands: the Misask watershed includes a more rugged terrain covered with thin glacial till (<1 m) while the Cheinu model includes significant boulder fields with glacial till in its northern portion and fluvioglacial deposits in its southern portion.
Within the peat deposits, hydraulic conductivities for the first meter (layers 1–9) were set to the mean MCM-measured Kh and Kv values. Hydraulic conductivities for the mineral deposits (glacial till and fluvioglacial deposits) were estimated from slug test results and literature values. A vertical anisotropy (Kh/Kv) of 10 was imposed on the peat layer below 1 m and on the mineral deposits.
The Unsaturated Zone Flow Package (UZF) (Niswonger et al., 2006) was used to redirect infiltration to groundwater recharge and seepage. Seepage corresponds to groundwater that outflows to the surface when the water table reaches the surface and is exported out of the peatland. It offers a means to represent groundwater seepage relatively easily within a peatland. The UZF parameter SURFDEP (Niswonger et al., 2006), which represents the maximum amplitude of the topographic variation within a grid cell, was fixed at 0.8 m following the work of Feinstein et al. (2020) who showed that a fen peatland model was not sensitive to this parameter.
Mineral Kh and recharge rates were calibrated using PEST (Doherty, 2005) to reproduce average measured heads in the peatlands and in the aquifer. Parameters were then adjusted manually to ensure decreasing values of K with depth.
2.6 Recharge Scenarios
Because groundwater recharge is a highly imprecise variable in any aquifer study, the response of heads and flow rates (peatland inflows and outflows) to changes in recharge, as indicators of connectivity response, was performed for the two peatlands. As the peatlands are set in a pristine environment, the main reason for a change in recharge is modifications in precipitation, temperature, and evapotranspiration as a result of climate change. Few studies have estimated groundwater recharge in northern Canada in a climate change context. However, recent studies for more southern temperate locations suggest a range of possible climate-driven changes in recharge, from decreases reaching −50% (Bourgault et al., 2014; Wang et al., 2014), to increases reaching +53% (Scibek and Allen, 2006; Jyrkama and Sykes, 2007). A variety of changes, from −59% to +15%, have been reported elsewhere (Croteau et al., 2010; Levison et al., 2014; Dubois et al., 2022). Here, model reaction to climate-driven changes in recharge was tested with scenarios of −50%, −20% and +20%. The emphasis was put on recharge reduction based on observations from Robitaille et al. (2021) who identified (1950–2017) an increase in temperature and in growing degree days, combined with a decrease in precipitation. Similar ranges of recharge changes have been used by Bourgault et al. (2014) and Levison et al. (2014).
3 Results
3.1 Hydraulic Conductivities
Slug tests in the glacial till at Misask (Figure 3A) show K values ranging between 1.2 × 10⁻⁵ m s−1 and 3.3 × 10⁻⁷ m s−1 (average 4.1 × 10⁻⁶ m s−1). Slug tests in the fluvioglacial deposits at Cheinu (Figure 3B) show slightly higher K values, ranging between 1.2 × 10⁻⁴ m s−1 and 7.6 × 10⁻⁶ m s−1 (average 3.8 × 10⁻⁵ m s−1). Because there were no slug tests conducted in washed out till and thin till, their K values are assumed to be equal to those estimated for fluvioglacial deposits and glacial till deposits respectively.
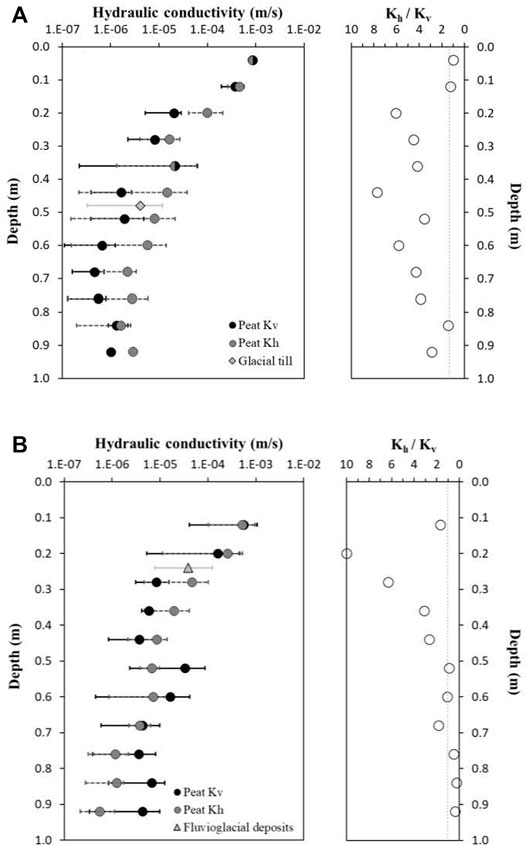
FIGURE 3. Minimum, maximum, and average measured hydraulic conductivities of the three cores for (A) the Misask peatland and (B) the Cheinu peatland. The left panels illustrate vertical hydraulic conductivities (Kv) and horizontal hydraulic conductivities (Kh) for the peat (estimated with the MCM method) and for mineral deposits (estimated with slug tests). Panels on the right illustrate Kh/Kv ratios.
At both sites, MCM results showed generally decreasing trends in average Kh and Kv with depth, with maximum K values observed between the surface and approximately 40 cm depth (Figure 3). Deeper, K values are relatively constant with depth. The average maximum Kh and Kv values (topmost cubes) were 8.7 × 10⁻⁴ and 8.6 × 10⁻⁴ m s−1 at Misask (Figure 3A) and 5.3 × 10⁻⁴ and 5.5 × 10⁻⁴ m s−1 at Cheinu (Figure 3B) respectively. The top cubes (0–8 cm) of the Cheinu peat cores were dismissed since MCM tests were unable to be properly executed (wax filling peat pores and friability of the living moss). The vertical anisotropy (Kh/Kv) ranged from 1.02 (0.04 m) to 7.72 (0.44 m) at the Misask peatland, with low values under 0.20 m followed by irregularly decreasing values deeper in the peat profile (Figure 3A). A similar trend was observed at the Cheinu peatland, with a top Kh/Kv of 1.69 followed by a maximum of 10 at 0.20 m followed by a constant decrease with depth and a minimum value of 0.24 at 0.84 m (Figure 3B).
3.2 Water Table Depths and Heads
Monitored wells within the organic deposits at Misask show water table depth (WTD) (Figure 4) variations of between 57 and 6 cm below the surface. Minimum WTD occurred upgradient of the central peatland area immediately following snowmelt (June 2018: Wm05), while maximum WTD was observed in the paludified downgradient area during the growing season (July 2018: Wm08). The Cheinu peatland WTD showed a similar range, from 55 to 7 cm below the surface. Minimum WTD occurred within the central peatland area at the end of the growing season (October 2018: Wc28) and maximum WTD was observed near the woody main outlet during the growing season (August 2018: Wc22). The minimum recorded WTD of 6 cm (Misask) and 7 cm (Cheinu) show that no flooding occurred in the monitored areas between June 2018 to October 2019. At both sites, the most central peatland wells (Wm04 and Wc28) were characterized by shallow water tables, with respective average WTD of 18 and 15 cm.
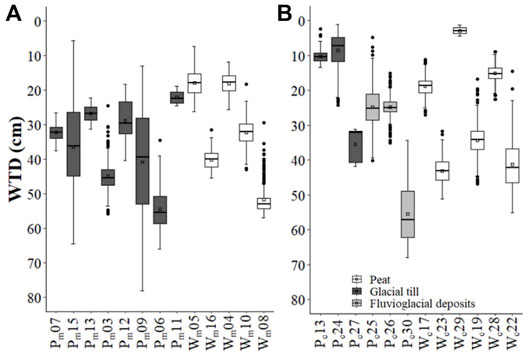
FIGURE 4. Average daily water table depths (WTD) from June to October (2018 and 2019) for monitored wells (peat) and piezometers (mineral deposits), and for unmonitored stations (Pm13, Pm12, Pc27, Wc29) used in the Darcy flow calculation for (A) the Misask peatland and (B) the Cheinu peatland. Squares indicate mean values.
Except for the central peatland wells (Wm04, shallow WTD) and one peatland well located close to the northern boundary (Wm16, deeper than expected WTD), the Misask peatland generally shows increasing WTD from its northeastern section toward the southwestern area. A similar pattern is visible at the Cheinu peatland. With some exceptions (Wc23 and Wc28), the average WTD generally decreases from north (19 cm) to south (41 cm). These are indications of northeast-southeast and north-south flow directions within the Misask and Cheinu peatlands respectively. Exceptions to these trends correspond to the forest border where peat is shallow, poorly decomposed with high porosity and associated with current lateral expansion.
In the surface deposits, WTD (Figure 4) varied from 78 to 6 cm at Misask and from 68 to 1 cm at Cheinu. In both sites, minimum WTD was measured at upstream piezometers following snowmelt in 2018 and the end of the growing season in September 2018. Maximum WTD occurred in downstream piezometers during the growing season, in August 2019 and in July 2019. Piezometers in mineral deposits surrounding the Misask peatland showed generally deeper average WTD compared to those installed at Cheinu. Piezometers at Misask have higher average WTD northwest of the peatland than southwest of the peatland while, the piezometers north of the Cheinu peatland have higher average WTD than those southward.
At the two sites, heads reflect the general groundwater flow directions within the mineral deposits (Figure 5). At the Misask peatland, heads in the mineral deposits indicate groundwater flows from Pm07 to Pm09, from northeast to southwest and in the direction of the diffuse southwest outlet, and from Pm07 to Pm06, i.e., towards the southern peatland outlet. At the Cheinu peatland, heads in the mineral deposits indicate flow from Pc13 to Pc26 and Pc30, i.e., from north to south. Heads follows a similar direction within the peat, from Wc17 to Wc28 and Wc22, towards the southern peatland outlet.
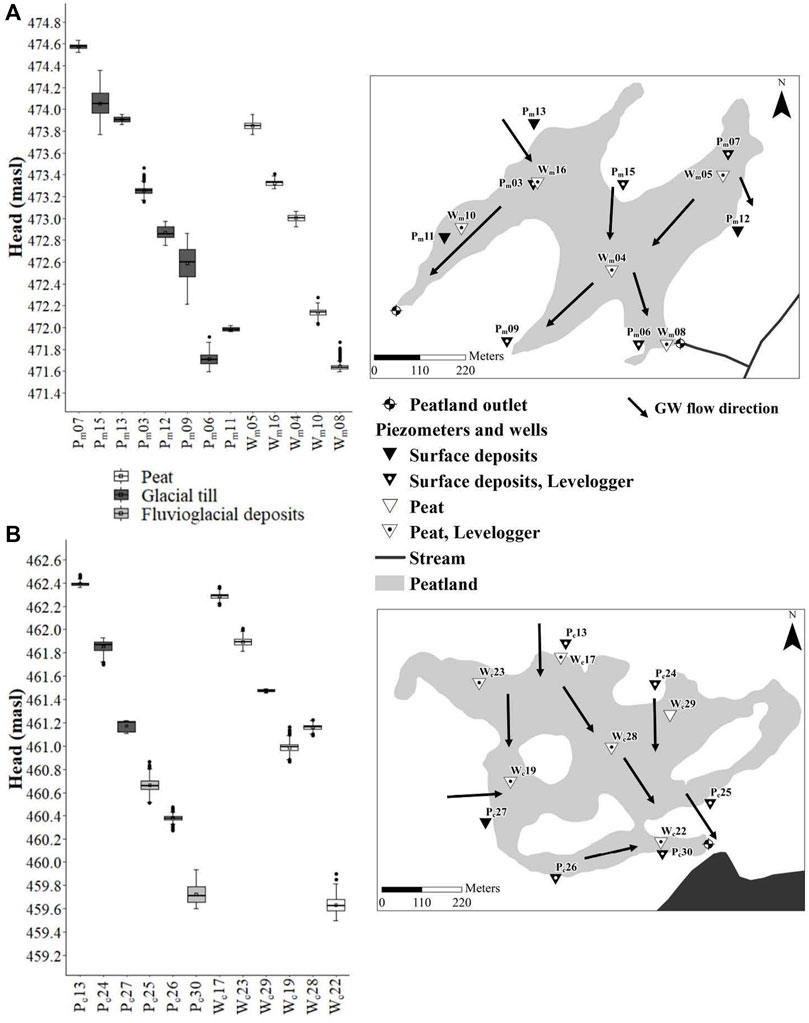
FIGURE 5. Average daily heads from June to October (2018 and 2019) for monitored wells (peat) and piezometers (mineral deposits) and for unmonitored stations used in the Darcy flow calculation (Pm13, Pm12, Pc27, Wc29) for (A) the Misask peatland and (B) the Cheinu peatland. The squares indicate mean values. Panels on the right indicate groundwater flow directions.
3.3 Hydraulic Gradients and Flows
Hydraulic gradients were calculated for all the sections used in the Darcy flow calculation. A negative horizontal hydraulic gradient (HHG) drives flow from the peatland to the aquifer and a positive horizontal hydraulic gradient drives flow from the aquifer to the peatland. The average HHG calculated between piezometers in the mineral deposits and peatland wells varied between -0.025 m m−1 and 0.010 m m−1 at Misask, and between -0.004 m m−1 and 0.012 m m−1 at Cheinu (Figure 6). Both sites were characterized by similar positive HHG ranges. The Misask peatland mostly received inflow from northern and western piezometers, while at Cheinu, piezometers in the northern and western portions of the peatland indicated inflow to the ecosystem. At both sites, inflows driven by local topography were also found to occur in areas located close to downgradient peatland flow locations. HGGs did not change markedly in time and inversions lasted a maximum of four consecutive days in August and October.
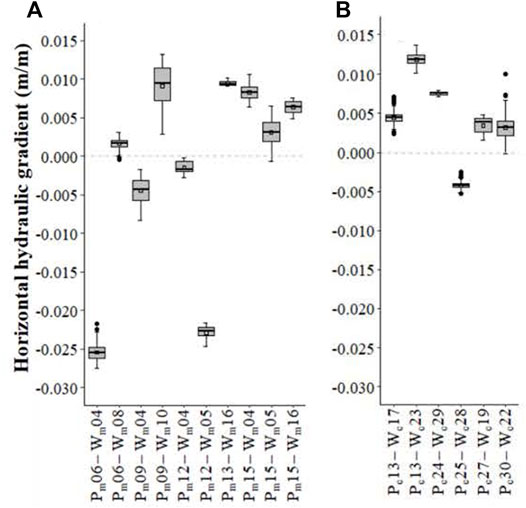
FIGURE 6. Horizontal hydraulic gradient between stations used in the Darcy flow calculation for (A) the Misask peatland and (B) the Cheinu peatland. Positive values indicate flow from the aquifer to the peatland and negative values indicate flow from the peatland to the aquifer. Squares indicate mean values.
At Misask, the largest negative HHGs (absolute value) were observed in the southeastern and eastern portions of the peatland, close to the main diffuse outlet. Results from Pm09-Wm04 (south) and Pm12-Wm04 (east) also indicated that the peatland feeds the aquifer laterally in these areas. At Cheinu, a NHG was only found in the vicinity of the outlet and was markedly smaller than those observed at Misask. Considering that the peatlands developed in shallow depressions, it is interesting to note that topography is clearly not the only factor determining groundwater inflows to the Misask peatland. If that were the case, a positive HHG would be observed along its entire periphery. Topography is apparently a stronger driver of horizontal hydraulic gradients at Cheinu, with only one negative HHG of limited amplitude.
Three vertical hydraulic gradients (VHG) were calculated at the Misask peatland. The Pm03-Wm16 pair probably provides the most reliable information, located only 6 m apart, whereas the other two pairs are located 25 m apart. The results showed VHG values of −0.17, −0.10, and 1.16 m m−1 indicating flow from the peatland to the underlying permeable mineral deposits in the northwestern and central-western parts of the ecosystem, and flow from the underling sediments to the peatland in its northeastern part. As for HHG, VHG values were relatively constant over time, with inversions observed over very short periods of only a few days.
Horizontal Darcy flows were calculated for each section using average heads for all the well-piezometer pairs (Table 2). Darcy inflows of 92 and 269 mm yr−1 were calculated at Misask, and of 111 and 418 mm yr−1 at Cheinu, with the minimum value estimated using average peat thickness and the maximum value estimated using maximum peat thickness at each site. Darcy outflows of 73 and 212 mm yr−1 were calculated at Misask, and of 48 and 131 mm yr−1 at Cheinu, again using average and maximum peat thickness. At Misask, vertical outflows of 30 mm yr−1 (Pm11–Wm10) and 18 mm yr−1 (Pm03–Wm16) were estimated from the peatland to the underlying aquifer, and vertical inflows to the peatland of 116 mm yr−1 were estimated at Pm07–Wm05 (no estimates of vertical flow were available at Cheinu).
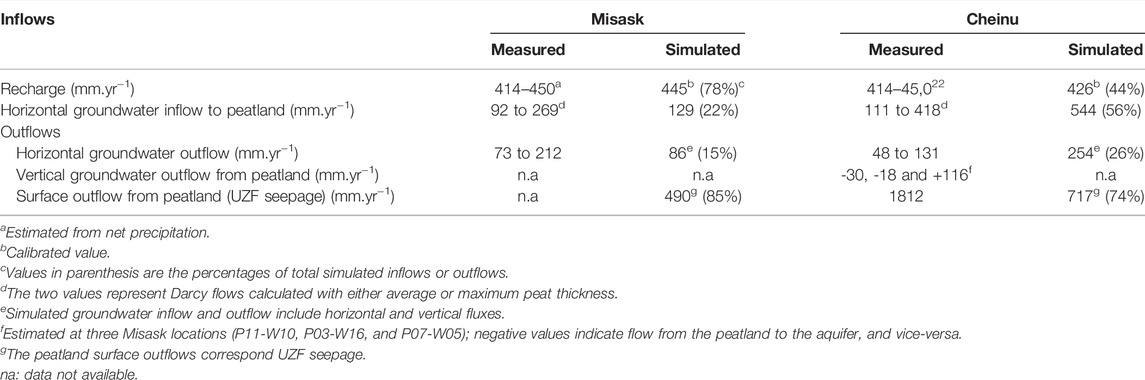
TABLE 2. Measured and simulated inflows and outflows to and from the Misask and Cheinu peatlands.
Flows in the lower southwestern portion of the peatland were mostly diffuse so outflows from the Misask peatland could not be measured. Outflows were able to be measured at the Cheinu peatland outlet. The average measured flow rate at this outlet was 730 m3 d−1 (ranging between 371 m3 d−1 in June 2019 and 1,150 m3 d−1 in September 2018), which is equivalent to 1812 mm yr−1 (921–2,855 mm yr−1) when divided by the peatland area.
3.4 Calibrated Models and Simulated Flows
The two models reproduce the measured heads reasonably well, with mean errors close to zero (0.017 and -0.002 m for Misask and Cheinu respectively), low mean absolute errors (0.141 and 0.154 m respectively), and low RMSE values (0.179 and 0.196 m respectively) (Figure 7). The 0.1 m error interval is of the same order of magnitude as the mean absolute error and includes most of the measured heads.
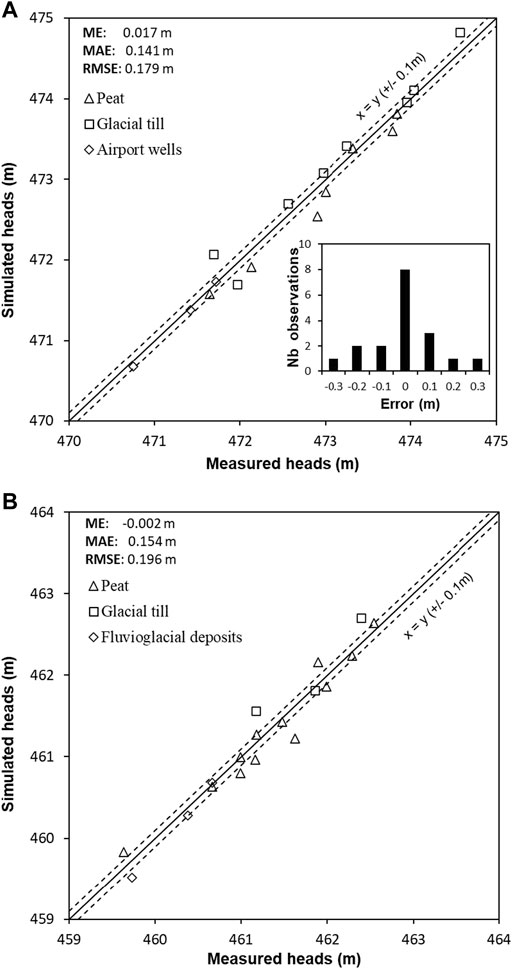
FIGURE 7. Measured and simulated steady-state piezometric heads with associated error statistics for (A) the Misask peatland and (B) the Cheinu peatland. Dotted lines indicate.
In the two models, the calibrated recharge values are similar to the range of Pnet values estimated for the region, and similar for all types of deposits. The calibrated recharge for the Misask peatland is 445 mm yr−1 and is 426 mm yr−1 for the Cheinu peatland (Table 2). At Misask, calibrated recharge was 414 mm yr−1 for glacial and thin till, 434 mm yr−1 for washed till, and 431 mm yr−1 for fluvioglacial deposits. For the Cheinu model, the calibrated recharge was 450 mm yr−1 for the boulder field area, 414 mm yr−1 for the washed and glacial till, and 416 mm yr−1 for the fluvioglacial deposits.
Calibrated Kh values for glacial till and fluvioglacial deposits are within field measured ranges (Table 3). At depths where no measurements were available, calibrated Kh values correspond to the expected ranges for the different types of mineral deposits (Domenico and Schwartz, 1998), and show decreasing trends with depth, as expected in unconsolidated sediments. As mentioned above, Kh values for the top 1 m of peat were set to measure averages, with a single value for each model layer (not calibrated). Below 1 m, peat Kh were set to gradually decrease until 1 × 10⁻⁸ m s−1 at maximum peat thickness.
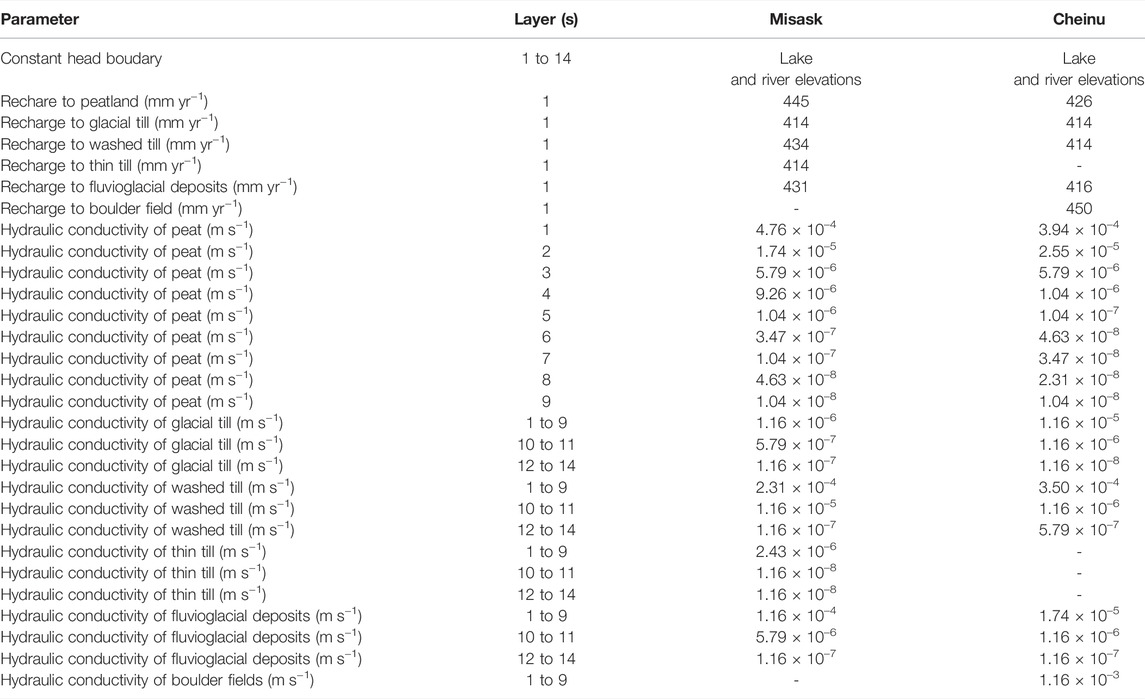
TABLE 3. Calibrated model parameters for the Misask and Cheinu peatlands.
At the Misask peatland, peatland recharge (447 mm. yr−1) dominates inflows (78% of water input), while the groundwater contribution to the peatland (129 mm yr−1) represented 22% of all peatland inflows (Table 2). Simulated groundwater inflows were distributed homogeneously all around the peatland. Results show that seepage of groundwater to the surface of the peatland (490 mm yr−1) was the largest outflow from the peatland (85% of water output), while groundwater output through the saturated zone (86 mm yr−1) represented 15% of water output. Groundwater outflow was exfiltrated from the peatland relatively homogeneously around its periphery. It is important to highlight here that, to simplify the estimation, vertical and horizontal flows were not distinguished when estimating simulated groundwater inflows and outflows to and from the peatland.
The Cheinu recharge (427 mm yr−1) represented 44% of water input to the peatland, while the proportion of inflow from the surrounding aquifer comprised 56% (544 mm yr−1). The portion of the peatland that lies on glacial till received 86% of the total groundwater inflow, while the portion of the peatland overlying fluvioglacial deposits received most of the rest of the groundwater inflow. Water outputs were dominated by seepage of groundwater to the surface of the peatland, which accounted for 74% of total outflows (717 mm yr−1), while groundwater outflow from the peatland to the aquifer represented 26% of total outflows (254 mm yr−1). These outflows were distributed relatively uniformly all around the peatland. Again, horizontal, and vertical flows were not distinguished.
At the Cheinu peatland, the simulated seepage, which is to represent surface flow at the peatland outlet, is markedly lower than the measured flow rates. This discrepancy could be an indication that the outlet stream drains surface and subsurface areas located outside of the peatland watershed in its lower section. Because outflow rates were not measured at the diffuse outlets of the Misask peatland, the simulated outflows could not be validated.
3.5 Simulated Changes From Recharge Scenarios
As expected, the recharge scenarios (−50%, −20%, and +20% change) showed that increased recharge leads to increased heads at the two sites, and vice-versa. At both peatlands, head changes in response to recharge changes were found to be smaller in the peat than in the mineral deposits (Figure 8). However, recharge changes had a larger impact on heads at Cheinu than at Misask. Head changes varied from −1 to 0.3 cm at the Misask peatland and from −9 to 2 cm at the Cheinu peatland. Head changes varied from −4 to +0.9 cm for the Misask mineral deposits and from −20 to 5 cm for the Cheinu mineral deposits.
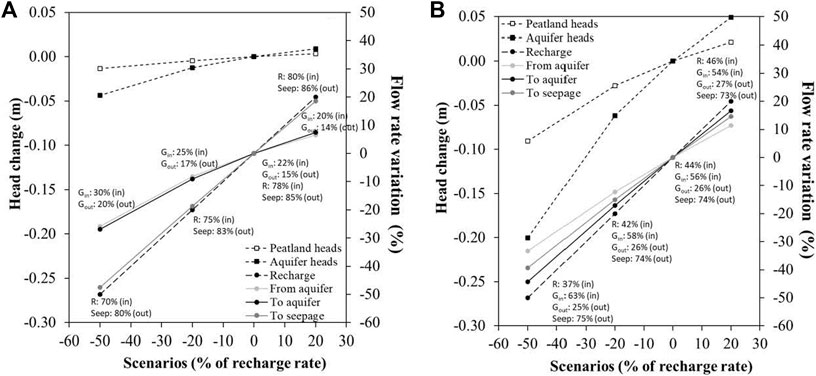
FIGURE 8. Effect of climate change scenarios on average simulated peatland heads, mineral heads, and water budget flow components at (A) Misask peatland and (B) Cheinu peatland.
At Misask, exchanges with the aquifer showed limited reaction to recharge, with variations of −26, −8, and +7% for fluxes from the aquifer to the peatland and −27, −9, and +7% for fluxes from the peatland to the aquifer (Figure 8A). Seepage from the peatland to surface flow was more sensitive, with variations of −48, −19, and +19% for the three recharge scenarios respectively. At the Cheinu site, the recharge scenarios generated greater changes in fluxes from the aquifer to the peatland than at Misask, with variations of −33, −12, and +11%. Changes in fluxes from the peatland to the aquifer were also greater at Misask, with variations of −44, −17, and +17% (Figure 8B). Seepage from the peatland to surface flow was less sensitive to recharge changes than at Misask, with −39, −15, and +15%. It is important to point out that the two peatlands remained flow-through peatlands for all recharge values tested, receiving groundwater at their upgradient limit, transmitting this water through the peat, and discharging it at the downgradient limit.
At both sites, the recharge scenarios did not cause significant changes in the dominant water budget component (Figure 8). As the recharge rate was modified from −50% to +20%, both peatland water budgets showed an increase in recharge contribution, leading to a reduction in groundwater inflow to the peatland. However, the proportion of outflow showed reverse trends for the two sites. Misask showed an increased proportion of seepage with decreased contribution of groundwater outflow from the peatland (Figure 8A). For Cheinu, proportion of seepage decreased only slightly, and proportion of groundwater outflow increased under the three recharge scenarios (Figure 8B).
4 Discussion
4.1 Peat Hydrogeological Properties and Water Table Position
Hydraulic conductivity results from the peat cores (peat K profiles) showed marked differences, despite similar peat characteristics (bulk density, C:N ratios and vegetation assemblages; Robitaille et al., 2021), regional climate, and geological context. At the Misask site, the entire top 1 m of peat showed average values of Kh > Kv, indicating that lateral flow dominates over vertical flow. At the Cheinu site, the vertical anisotropy resembles that reported by Rosa and Larocque (2008), with Kh < Kv in deeper layers (>∼50 cm), pointing to the importance of vertical flows within the peat, below the acrotelm (40 cm). It is difficult to explain this difference in vertical anisotropy between the two sites considering their similarities, but greater Kv in deeper layers at Cheinu could be due to the presence of macropores within the peat enhanced by a larger inflow of mineralized groundwater. This hypothesis is supported by results from Hare et al. (2017), who showed that peatlands with steeper margins (such as Cheinu) are more likely to develop additional preferential discharge areas with macropores and pipe flow, facilitating exchanges through peatland bottom.
As expected, the observed decreasing K with depth and the range of values compared reasonably well with those of other studies (Beckwith et al., 2003; Surridge et al., 2005; Rosa and Larocque, 2008; Bourgault et al., 2018). The decreasing trends with depth are similar to those reported by Beckwith et al. (2003) and Surridge et al. (2005) for peatlands located in the United Kingdom. However, Rosa and Larocque (2008) and Bourgault et al. (2019) found a greater range of K within the first 30 cm of the peat columns in southern Quebec peatlands (i.e., reaching 10−1 to 10–4 m s−1, and sometimes lower K values at 1 m, decreasing by up to six orders of magnitude). The difference between results from this study and those for more southern Quebec peatlands could be due to a dominance of herbaceous peat below the acrotelm at the studied sites (Robitaille et al., 2021).
Relatively stable and shallow WTDs were measured in the peatland sections where peat was the thickest. Morris and Waddington (2011) and Lukenbach et al. (2015) have already shown that groundwater-dependent peatlands present near-surface water tables. In this study, the average WTDs of the central wells (18 cm at Wm04 and 15 cm at Wc28) are shallower than the average values of approximately 30 cm reported by Bourgault et al. (2019) for southern Quebec (between 54 cm below ground to 1 cm above ground, with marked temporal variations). The shallower WTDs in the current study could be explained by the short and cool growing seasons that limits evapotranspiration from these peatlands.
For the two peatlands, the results showed more WTD variability at the forested margins where variations in groundwater levels within the aquifer directly influence the peatland water table (Figure 4). This corresponds to the results of Moore et al. (2021) who have shown that areas with shallow peat thickness experience greater water table fluctuations and are susceptible to lose their water table during drought conditions. These marginal areas are frequently characterized by a lagg margin with minerotrophic vegetation (Howie and Meerveld, 2011; Paradis et al., 2015), where groundwater inflow from the aquifer can be substantial (Glaser et al., 1997). Ferlatte et al. (2015) found similar spatialization of connectivity, which peaked at the peatland margin and was attenuated or delayed in the central zone.
4.2 Contrasting Water Budgets
The results confirm that the two peatlands are flow-through peatlands, i.e., they receive groundwater from their upstream portions, transmit water through their upper more permeable layers of peat, and discharge groundwater at their downstream edge. However, simulated inflows at Misask were dominated by recharge while inflows at Cheinu had a similar proportion from recharge and from groundwater. The larger proportion of inflows from groundwater at Cheinu is similar to that of Quillet et al. (2017) for slope peatlands. A similar result is also reported by Autio et al. (2020) who simulated larger groundwater flow into peatlands when the slope contrast between the peatland and its immediate uphill surroundings was pronounced. The contrast in inflow sources at the two peatlands could also be due to their position within the watershed, with Cheinu being located close to the regional outlet and thus accumulating more flow from upgradient areas. The larger peatland watershed of Cheinu (0.487 km2) considered to be the immediate groundwater contribution area, as well as the marked topography gradient at the head of the Cheinu peatland (6.7% at Cheinu compared to 0.5% at Misask) likely also contribute to its larger groundwater inflow. The higher proportion of pool area at Cheinu could be a result from its larger catchment area (White and Payette, 2016). Interestingly, simulated seepage and groundwater outflows occupied relatively similar proportions at the two peatlands, although the absolute simulated flows were larger at Cheinu. These results concord with those of Hokanson et al. (2020) who showed that peatlands in the Boreal Plains ecozone of Canada can be potential sources of groundwater to adjacent forestlands. They are also coherent with those of Wells et al. (2017) in the same ecozone where peatlands can generate important runoff.
The Darcy-calculated horizontal groundwater inflows and outflows (eq. (1)) using measured hydraulic conductivities and hydraulic gradients, and either average or maximum peat thickness, captured the simulated groundwater inflows and outflows relatively well. This is an interesting observation since quantifying groundwater inflows and outflows using Darcy calculations can be prone to large uncertainties due to the difficulty in measuring representative hydraulic gradients and hydraulic conductivities (both in the mineral deposits and in the peat). The three estimated vertical flows calculated at Misask (eq. (2)) indicated limited vertical outflow from the peatland to the aquifer in the northwestern and center-northern sections of the peatland, and high vertical inflow in the southeastern sections. Vertical hydraulic gradients of the same order of magnitude and in the same direction as those observed at Pm11–Wm10 and Pm03–Wm16 and similar vertical fluxes are reported by Ferlatte et al. (2015) and Goodbrand et al. (2019). Goodbrand et al. (2019) also report occasional upward hydraulic gradients, but not of a magnitude similar to those observed at Pm07–Wm05. These stations may be located too far apart for a reliable estimate of vertical inflows. Nevertheless, because the peatlands have developed over high permeability mineral materiel, vertical water flows between the peat and the aquifer are probable (Reeve et al., 2000). Vertical flow reversals during sustained dry periods have been reported elsewhere (Fraser et al., 2001; Ferone and Devito, 2004; Ferlatte et al., 2015) but were not systematically observed here.
4.3 Connectivity Response to Recharge
The analysis of WTD and flows changes following recharge modifications provides a means to estimate peatland susceptibility to long-term hydrometeorological changes. The simulated WTD changes at the Misask peatland (a decrease of 1 cm to an increase of 3 cm, for recharge changes between −50% and +20%) are very limited, indicating low sensitivity of the peatland hydrology to a changing climate. At Cheinu, the average simulated WTD change is larger (a decrease of 9 cm to an increase of 2 cm), but still relatively limited. These relatively small changes in WTDs reflect the fact that the studied peatlands are in conditions of precipitation excess. Due to the relatively high water table, a drastic drop in recharge would be necessary to lower their water levels sufficiently to accommodate all the direct incoming flow from net precipitation. This study also shows that recharge affects more WTDs in the surrounding aquifer than within the peatlands. This impact is transferred to the peatlands through modifications in hydraulic gradients in the peatland vicinity (upgradient and downgradient) which results in lower (or higher) groundwater inflows and outflows. Autio et al. (2020) have also reported that long-term groundwater drawdown (such as that caused by a recharge reduction) may not be reflected in peatland water levels, due to changes in the proportion of surface and groundwater flows and velocities.
At the Misask peatland, changes in recharge induce a variation in seepage, but a lesser variation in groundwater inflows and outflows. This might result from the relatively smaller watershed and relatively smaller catchment aquifer area of this peatland. In contrast, with its downgradient position and larger catchment area, the Cheinu peatland probably collects more groundwater inflow from deeper portions of the aquifer. These factors probably converge to make the Cheinu peatland inflows and outflows more sensitive to recharge. It has been shown elsewhere (e.g., Winter, 2001) that wetlands dependent almost exclusively on precipitation for their water supply are highly vulnerable to changes in climate conditions. Peatlands that receive substantial volumes of groundwater inflow are less vulnerable because of the large buffering capacity of aquifers to climate change. Hokanson et al. (2018) have confirmed this for drought conditions and shown that flow-through peatlands that intersect the water table are the least vulnerable to deep peat fires. In addition to this, the current work points to the fact that in peatlands with larger groundwater catchment areas, the impact of a change in recharge is also modulated by the impact this change has on the connected aquifer. Peatlands that are strongly connected to aquifers and receive larger fluxes of groundwater as their water fluxes might thus be more vulnerable to changes in recharge conditions, but this still needs to be tested further.
Temperatures and precipitation increases are expected under a changing climate, but precipitation could show more year to year variability and contrasts. Dubois et al. (2022) have identified thresholds of intra-annual precipitation and temperature changes that trigger reductions in recharge for southern Quebec. A similar analysis remains to be done for boreal regions for which it is still difficult to estimate how changes will translate into intra- and inter annual changes. The ecohydrological changes triggered by the wetter and cooler conditions of the Neoglacial period reported by Robitaille et al. (2021) could be quite different in future wetter and warmer conditions.
4.4 Peatland Hydrological Functions
It has long been recognized that wetlands are specific components of groundwater flow systems and that their connectivity is affected by their position in the landscape, the aquifer geology, and the climate setting (Winter 1999; Devito et al., 2017; Bourgault et al., 2019). This connectivity can be expressed in terms of hydrological functions of storage, transmission, and runoff (Spence et al., 2011; Goodbrand et al., 2019). Considering WTD and flow sensitivity to recharge and considering the different geomorphic contexts of the two peatlands, it is hypothesized that, on average, the Misask peatland is more dependent on seepage than the Cheinu peatland where the transmission function dominates. Spence et al. (2011) and Goodbrand et al. (2019) have shown that the main hydrological function alternate through the year. Goodbrand et al. (2019) suggested WTD thresholds for these switches between 5 and 15 cm in the Boreal Plains ecozone, i.e., implying that below this threshold peatlands switch from the runoff generation function (corresponding here to seepage) to a groundwater transmission function. In the current study, WTDs are close to these threshold values in the thickest portions of the two peatlands, but larger WTDs were observed in downgradient and marginal portions of the two peatlands. This is an indication that the runoff-to-transmission threshold probably varies within a peatland and between peatlands depending on geomorphic context size of catchment area and local flow directions. The thresholds for peatlands in north-central Quebec might also be different than those of Goodbrand et al. (2019), due to the highly permeable underlying and surrounding geological material which contrasts with the clayey substrate of the Boreal Plains.
It has been argued above that sensitivity to recharge is linked to the peatland geomorphological setting, to the size of the catchment area and to its position in regional flow. These conditions cannot be dissociated from the dominant hydrological function and probably also influence the wetness conditions that trigger switches between functions through the year. For example, at Cheinu, a lowering of the water table could favor peatland transmission at the expense of runoff, reducing the extent of pools at the surface and reducing flow rates at the peatland outlet. In contrast, the runoff function could be more resilient to change at Misask. White and Payette (2016) have shown in fens of northern Quebec that watershed area facilitates pool creation and expansion, and that pools are expected to increase in size and number if climate change brings more humid conditions. Although this needs to be demonstrated further, this work underlines the importance of characterizing the peatland watershed and groundwater catchment area to properly assess peatland hydrological functions, and their sensitivity to hydrometeorological changes.
The dominant type of hydrological functions in peatlands also affects water geochemistry and peatland vegetation (Larocque et al., 2016). Over long periods Belyea (2009) has shown that increasing WTDs can induce major shifts in peatland ecology, from typical ombrotrophic peatland vegetation to a wet-herbaceous environment. In contrast, wetter, and cooler conditions such as those evidenced by Robitaille et al. (2021) for the Neoglacial period can trigger ecohydrological changes towards a shift from Sphagnum to sedge-dominated peatlands, and during warmer conditions from herbaceous to Sphagnum-dominated peatlands, as evidenced from 33 peat cores from boreal peatlands (Magnan et al., 2022). These long-term variations of hydrological functions can trigger changes in peat accumulation rates (Bridgham et al., 1999). This has been demonstrated at the two studied peatlands where recent warming has increased apparent peat accumulation and induced important paludification (Robitaille et al., 2021). However, feedback mechanisms between hydrology, vegetation, and peat accumulation are not yet entirely understood and their combined modelling remains a challenge.
4.5 Model Advantages and Limitations
This work confirms that the UZF package is a useful package to simulate the proportion of overland flow compared to recharge on organic deposits in north-central Quebec. Without this package, it would have been necessary either to use drains all over the peatland to limit water levels or empirical runoff ratios to represent the actual volume of water that reaches the saturated level in the peatlands. This study thus adds to the work of Feinstein et al. (2020) with UZF in Wisconsin fens to demonstrate the usefulness of this package.
Steady-state models have been useful to quantify relatively well average flow conditions within the two peatlands. These models provide a useful macro-scale assessment of the peatland sensitivity to recharge in boreal conditions. It is clear however that transient-state simulations would be necessary to verify hypotheses concerning how the peatland stores, transmits, and releases water throughout the year and how these functions can be expected to change in a changing climate. Because they do not consider transient-state storage, the models used in this study produced linear relations between recharge and WTD and fluxes. However, intra-year variations of storage and discharge through seepage and groundwater flow can vary significantly within peatlands (Oswald et al., 2011; Li et al., 2019), and these changes have reported to be linked to variations of WTD (Kværner and Kløve, 2008; Carrer et al., 2015), leading to non-linear relations between recharge, WTD and fluxes. Nijp et al. (2017) have shown that including self-regulation processes through moss water storage and peat volume change can lead to less severe impacts of simulated recharge variations due to climate change. Changing climate conditions are expected to induce modifications in late fall and early spring recharge conditions, and winter recharge events (Jyrkama and Sykes, 2007; Okkonen and Kløve, 2011). Increasing rainfall intensity (Sillmann et al., 2013; Ouranos, 2015) could also modify recharge patterns throughout the year (Fu et al., 2019; Dubois et al., 2022). Jaros et al. (2019) and Autio et al. (2020) argued that aquifer-peatland interactions are best studied using integrated groundwater-surface water flow model. However, this type of model requires an extended data set that was not available in this study, for example storage coefficients for the organic and mineral materials, and continuous transient state surface flow rate data at the outlet.
Finally, some of the simplifications introduced in the models to represent boundary conditions and the heterogeneity of geological and peat materials might have influenced simulated peatland-aquifer exchanges, as well as flow directions and magnitudes between the peat and the aquifer. For example, it has been shown elsewhere that peat hydraulic conductivities at the peatland margins are lower than those in the central portion (Howie and Meerveld, 2011. According to Lapen et al. (2005), this can limit lateral flow to the aquifer and contribute to raising the water table at the center of a bog. Because spatial heterogeneity was not characterized at the two sites (only three peat cores available), it was not included in the models. In the contrasted environment of prairie wetlands, van der Kamp and Hayashi (2009) have shown that deep groundwater can contribute to wetland inflow. Deep groundwater inflows could also be present in the studied peatlands, especially at Cheinu which is located close to an important lake and downgradient from regional flow. However, the absence of measured heads from deeper within the aquifer, and the absence of natural tracer data (e.g., stable isotopes of water) makes this impossible to verify.
5 Conclusion
This research quantified aquifer-peatland hydrological connectivity and identified controlling factors in two pristine boreal peatlands. Considering that the two peatlands have a similar history of peat initiation, are exposed to the same climatic conditions, and have developed over similar glacial deposits, contrasting measured and simulated results emphasized the important role of local factors on their hydrogeological behavior. Measured hydraulic conductivities showed different trends of vertical anisotropy for the two peatlands, but WTD analysis showed stable near-surface levels within the central ombrotrophic areas and deeper water tables in marginal fens area at the two sites.
The groundwater flow models contributed to verify flow hypotheses, quantify unmeasured flows, and explore recharge scenarios leading to changes in connectivity. This work provided indications that, at the Misask peatland, inflows were dominated by recharge and the contribution of groundwater was relatively limited. Outflows to the aquifer were small and mostly exfiltrated by surface seepage. The Cheinu site had a distinct water budget, with inflows dominated by groundwater and most of outflow as seepage. The Misask peatland shows limited sensitivity to changes in recharge, while the Cheinu peatland reacts more markedly to the same changes. It is hypothesized that the greater groundwater dependence of the Cheinu site can be explained by the peatland geomorphological setting, by the size of its catchment area and by its position in regional flow. These factors necessarily influence the hydrological functions of the two peatlands and their sensitivity to long-term recharge changes. This work underlined the importance of the peatland watershed and groundwater catchment area to assess its resilience to hydrometeorological changes.
More work needs to be done to confirm results from this study, notably the influence of transient processes which could trigger feedback processes leading to either stable long-term conditions or in contrast drastic changes in hydrological conditions leading to changes in vegetation and peat accumulation. To achieve this, long-term transient-state simulations including flow, vegetation and peat accumulation need to be performed. This work has shown that aquifer-peatland connectivity at the regional scale needs to be included in this assessment.
Data Availability Statement
The raw data supporting the conclusions of this article will be made available by the authors, without undue reservation.
Author Contributions
CL, ML, and SG contributed to develop and implement the field and modelling approach. ML supervised the project and MG contributed for the ecohydrology components of the project. Data management, simulations, and figure preparation were done by CL. MG and ML obtained the research grant, All authors contributed to write the paper.
Funding
This research was funded by NSERC in collaboration with Stornoway Diamond corporation and Nemaska Lithium. Stornoway Diamond provided access to the peatlands and handled all the logistics related with travel and accomodation Grant number: RDCPJ 51342-17 during field work.
Conflict of Interest
The authors declare that the research was conducted in the absence of any commercial or financial relationships that could be construed as a potential conflict of interest.
Publisher’s Note
All claims expressed in this article are solely those of the authors and do not necessarily represent those of their affiliated organizations, or those of the publisher, the editors and the reviewers. Any product that may be evaluated in this article, or claim that may be made by its manufacturer, is not guaranteed or endorsed by the publisher.
References
Autio, A., Ala‐Aho, P., Ronkanen, A. K., Rossi, P. M., and Kløve, B. (2020). Implications of Peat Soil Conceptualization for Groundwater Exfiltration in Numerical Modeling: A Study on a Hypothetical Peatland Hillslope. Water Resour. Res. 56, e2019WR026203. doi:10.1029/2019WR026203
Beckwith, C. W., Baird, A. J., and Heathwaite, A. L. (2003). Anisotropy and Depth-Related Heterogeneity of Hydraulic Conductivity in a Bog Peat. I: Laboratory Measurements. Hydrol. Process. 17 (1), 89–101. doi:10.1002/hyp.1116
Belyea, L. R. (2009). “Nonlinear Dynamics of Peatlands and Potential Feedbacks on the Climate System,” in Carbon Cycling in Northern Peatlands. Editors A. Baird, L. R. Belyea, X. Comas, A. S. Reeve, and L. D. Slater (Washington, DC: American Geophysical Union), 184, 5–18. Geophysical Monograph Series.
Bourgault, M.-A., Larocque, M., and Garneau, M. (2019). How Do Hydrogeological Setting and Meteorological Conditions Influence Water Table Depth and Fluctuations in Ombrotrophic Peatlands? J. Hydrology X 4, 100032. doi:10.1016/j.hydroa.2019.100032
Bourgault, M.-A., Larocque, M., Garneau, M., and Roux, M. (2018). Quantifying Peat Hydrodynamic Properties and Their Influence on Water Table Depths in Peatlands of Southern Quebec (Canada). Ecohydrology 11 (7), e1976. doi:10.1002/eco.1976
Bourgault, M. A., Larocque, M., and Roy, M. (2014). Simulation of Aquifer-Peatland-River Interactions under Climate Change. Hydrol. Res. 45 (3), 425–440. doi:10.2166/nh.2013.228
Bourgeau-Chavez, L., Grelik, S., Billmire, M., Jenkins, L., Kasischke, E., and Turetsky, M. (2020). Assessing Boreal Peat Fire Severity and Vulnerability of Peatlands to Early Season Wildland Fire. Front. For. Glob. Change 3, 545–559. doi:10.3389/ffgc.2020.00020
Bridgham, S. D., Pastor, J., Updegraff, K., Malterer, T. J., Johnson, K., Harth, C., et al. (1999). Ecosystem Control over Temperature and Energy Flux in Northern Peatlands. Ecol. Appl. 9 (4), 1345–1358. doi:10.1890/1051-0761(1999)009[1345:ecotae]2.0.co;2
Carrer, G. E., Rousseau, A. N., St-Hilaire, A., and Jutras, S. (2015). Mosaic Surface Storages of a Small Boreal Catchment. Hydrol. Process. 29 (6), 845–858. doi:10.1002/hyp.10195
Croteau, A., Nastev, M., and Lefebvre, R. (2010). Groundwater Recharge Assessment in the Chateauguay River Watershed. Can. Water Resour. J. 35 (4), 451–468. doi:10.4296/cwrj3504451
Desbiens, H. (2008). Report on the Drilling Program on the 33 Carats Diamond Project. Exploration DIOS . Report submitted to the Quebec Ministry of Natural Resources (Ministère de l’Énergie et des Ressources naturelles), GM 63933. Quebec, QC.
Devito, K. J., Hokanson, K. J., Moore, P. A., Kettridge, N., Anderson, A. E., Chasmer, L., et al. (2017). Landscape Controls on Long-Term Runoff in Subhumid Heterogeneous Boreal Plains Catchments. Hydrol. Process. 31 (15), 2737–2751. doi:10.1002/hyp.11213
Dionne, J.-C. (1978). Les champs de blocs en Jamésie, Québec subarctique. Geogr. Phys. Quat. 32 (2), 119–144.
Doherty, J. (2005). PEST Version 9 Users Guide. Brisbane, Australia: Watermark Numerical Computing, 75.
Dubois, E., Larocque, M., Gagné, S., and Braun, M. (2022). Climate Change Impacts on Groundwater Recharge in Cold and Humid Climates: Controlling Processes and Thresholds. Climate 10, 6. doi:10.3390/cli10010006
Dyke, A. S., Moore, A., and Robertson, L. (2003). Deglaciation of North America. Ottawa, Ontario, Canada: Geological Survey of Canada. Open File 1574. doi:10.4095/214399
Elmes, M. C., Kessel, E., Wells, C. M., Sutherland, G., Price, J. S., Macrae, M. L., et al. (2021). Evaluating the Hydrological Response of a Boreal Fen Following the Removal of a Temporary Access Road. J. Hydrology 594, 125928. doi:10.1016/j.jhydrol.2020.125928
Feinstein, D. T., Hart, D. J., Gatzke, S., Hunt, R. J., Niswonger, R. G., and Fienen, M. N. (2020). A Simple Method for Simulating Groundwater Interactions with Fens to Forecast Development Effects. Groundwater 58 (4), 524–534. doi:10.1111/gwat.12931
Ferlatte, M., Quillet, A., Larocque, M., Cloutier, V., Pellerin, S., and Paniconi, C. (2015). Aquifer–peatland Connectivity in Southern Quebec (Canada). Hydrol. Process. 29 (11), 2600–2612. doi:10.1002/hyp.10390
Ferone, J. M., and Devito, K. J. (2004). Shallow Groundwater-Surface Water Interactions in Pond-Peatland Complexes along a Boreal Plains Topographic Gradient. J. Hydrology 292, 75–95. doi:10.1016/j.jhydrol.2003.12.032
Foster, D. R., and Fritz, S. C. (1987). Mire Development, Pool Formation and Landscape Processes on Patterned Fens in Dalarna, Central Sweden. J. Ecol. 75 (2), 409–437. doi:10.2307/2260426
Fraser, C., Roulet, N., and Lafleur, M. (2001). Groundwater Flow Patterns in a Large Peatland. J. Hydrol. 246 (1-4), 142–154. doi:10.1016/s0022-1694(01)00362-6
Fu, G., Crosbie, R. S., Barron, O., Charles, S. P., Dawes, W., Shi, X., et al. (2019). Attributing Variations of Temporal and Spatial Groundwater Recharge: A Statistical Analysis of Climatic and Non-climatic Factors. J. Hydrology 568, 816–834. doi:10.1016/j.jhydrol.2018.11.022
Gallego-Sala, A. V., Charman, D. J., and Zhao, Y. (2018). Latitudinal Limits to the Predicted Increase of the Peatland Carbon Sink with Warming. Nat. Clim. Change 8, 907–913. doi:10.1038/s41558-018-0271-1
Glaser, P. H., Siegel, D. I., Romanowicz, E. A., and Shen, Y. P. (1997). Regional Linkages between Raised Bogs and the Climate, Groundwater, and Landscape of North-Western Minnesota. J. Ecol. 85 (1), 3–16. doi:10.2307/2960623
Goodbrand, A., Westbrook, C. J., and Kamp, G. (2019). Hydrological Functions of a Peatland in a Boreal Plains Catchment. Hydrol. Process. 33 (4), 562–574. doi:10.1002/hyp.13343
Harbaugh, A. W. (2005). MODFLOW-2005, the US Geological Survey Modular Ground-Water Model: The Ground-Water Flow Process. Denver (USA): US Department of the Interior, US Geological Survey, 253.
Hare, D. K., Boutt, D. F., Clement, W. P., Hatch, C. E., Davenport, G., and Hackman, A. (2017). Hydrogeological Controls on Spatial Patterns of Groundwater Discharge in Peatlands. Hydrol. Earth Syst. Sci. 21 (12), 6031–6048. doi:10.5194/hess-21-6031-2017
Harris, L. I., Roulet, N. T., and Moore, T. R. (2020). Drainage Reduces the Resilience of a Boreal Peatland. Environ. Res. Commun. 2 (6), 065001. doi:10.1088/2515-7620/ab9895
Helbig, M., Waddington, J. M., Alekseychik, P., Amiro, B. D., Aurela, M., Barr, A. G., et al. (2020). Increasing Contribution of Peatlands to Boreal Evapotranspiration in a Warming Climate. Nat. Clim. Change 10 (6), 555–560. doi:10.1038/s41558-020-0763-7
Herschy, R. (1993). The Velocity-Area Method. Flow Meas. Instrum. 4 (1), 7–10. doi:10.1016/0955-5986(93)90004-3
Hokanson, K. J., Moore, P. A., Lukenbach, M. C., Devito, K. J., Kettridge, N., Petrone, R. M., et al. (2018). A Hydrogeological Landscape Framework to Identify Peatland Wildfire Smouldering Hot Spots. Ecohydrology 11, e1942. doi:10.1002/eco.1942
Hokanson, K. J., Peterson, E. S., Devito, K. J., and Mendoza, C. A. (2020). Forestland-peatland Hydrologic Connectivity in Water-Limited Environments: Hydraulic Gradients Often Oppose Topography. Environ. Res. Lett. 15 (3), 034021. doi:10.1088/1748-9326/ab699a
Howie, S. A., and Meerveld, I. T.-v. (2011). The Essential Role of the Lagg in Raised Bog Function and Restoration: a Review. Wetlands 31 (3), 613–622. doi:10.1007/s13157-011-0168-5
Hvorslev, M. J. (1951). Time Lag and Soil Permeability in Ground-Water Observations. Vickburg (USA): Waterways Experiment Station, Corps of Engineers, US Army, 43. No 36.
Ireson, A. M., Barr, A. G., Johnstone, J. F., Mamet, S. D., Van der Kamp, G., Whitfield, C. J., et al. (2015). The Changing Water Cycle: the Boreal Plains Ecozone of Western Canada. WIREs Water 2 (5), 505–521. doi:10.1002/wat2.1098
Jaros, A., Rossi, P. M., Ronkanen, A.-K., and Kløve, B. (2019). Parameterisation of an Integrated Groundwater-Surface Water Model for Hydrological Analysis of Boreal Aapa Mire Wetlands. J. Hydrology 575, 175–191. doi:10.1016/j.jhydrol.2019.04.094
Jeglum, J., Rothwell, R., Berry, G., and Smith, G. (1992). A Peat Sampler for Rapid Survey”. Frontline, Technical Note, Canadian Forestry Service. Sault-Ste-Marie 20 (2), 285–291.
Jyrkama, M. I., and Sykes, J. F. (2007). The Impact of Climate Change on Spatially Varying Groundwater Recharge in the Grand River Watershed (Ontario). J. Hydrol. 338 (3-4), 237–250. doi:10.1016/j.jhydrol.2007.02.036
Kløve, B., Ala-Aho, P., Bertrand, G., Gurdak, J. J., Kupfersberger, H., Kværner, J., et al. (2014). Climate Change Impacts on Groundwater and Dependent Ecosystems. J. Hydrol. 518, 250–266. doi:10.1016/j.jhydrol.2013.06.037
Kværner, J., and Kløve, B. (2008). Generation and Regulation of Summer Runoff in a Boreal Flat Fen. J. Hydrol. 360 (1-4), 15–30. doi:10.1016/j.jhydrol.2008.07.009
Lamarche, O., and Hébert, S. (2020). Géologie des dépôts de surface de la région de la rivière Eastmain supérieure (SNRC 23D05, 23D06, 23D11, 23D12, 33A08 à 33A10). Report submitted to the Quebec Ministry of Natural Resources (Ministère de l’Énergie et des Ressources naturelles), RP 2019-02. Quebec, QC.
Lapen, D. R., Price, J. S., and Gilbert, R. (2005). Modelling Two-Dimensional Steady-State Groundwater Flow and Flow Sensitivity to Boundary Conditions in Blanket Peat Complexes. Hydrol. Process. 19 (2), 371–386. doi:10.1002/hyp.1507
Larocque, M., Ferlatte, M., Pellerin, S., Cloutier, V., Munger, J. L., Paniconi, C., et al. (2016). Chemical and Botanical Indicators of Groundwater Inflow to Sphagnum -dominated Peatlands. Ecol. Indic. 64, 142–151. doi:10.1016/j.ecolind.2015.12.012
Levison, J., Larocque, M., Fournier, V., Gagné, S., Pellerin, S., and Ouellet, M. A. (2014). Dynamics of a Headwater System and Peatland under Current Conditions and with Climate Change. Hydrol. Process. 28 (17), 4808–4822. doi:10.1002/hyp.9978
Li, Z., Gao, P., and Lu, H. (2019). Dynamic Changes of Groundwater Storage and Flows in a Disturbed Alpine Peatland under Variable Climatic Conditions. J. Hydrology 575, 557–568. doi:10.1016/j.jhydrol.2019.05.032
Loisel, J., Gallego-Sala, A. V., Amesbury, M. J., Magnan, G., Anshari, G., Beilman, D. W., et al. (2021). Expert Assessment of Future Vulnerability of the Global Peatland Carbon Sink. Nat. Clim. Change 11, 70–77. doi:10.1038/s41558-020-00944-0
Lukenbach, M. C., Devito, K. J., Kettridge, N., Petrone, R. M., and Waddington, J. M. (2015). Hydrogeological Controls on Post-fire Moss Recovery in Peatlands. J. Hydrology 530, 405–418. doi:10.1016/j.jhydrol.2015.09.075
Magnan, G., Sanderson, N. K., Piilo, S., Pratte, S., Väliranta, M., van Bellen, S., et al. (2022). Widespread Recent Ecosystem State Shifts in High‐latitude Peatlands of Northeastern Canada and Implications for Carbon Sequestration. Glob. Change Biol. 28 (5), 1919–1934. doi:10.1111/gcb.16032
Menberu, M. W., Haghighi, A. T., Ronkanen, A. K., Marttila, H., and Kløve, B. (2018). Effects of Drainage and Subsequent Restoration on Peatland Hydrological Processes at Catchment Scale. Water Resour. Res. 54 (7), 4479–4497. doi:10.1029/2017wr022362
Moore, P. A., Didemus, B. D., Furukawa, A. K., and Waddington, J. M. (2021). Peat Depth as a Control on Sphagnum Moisture Stress during Seasonal Drought. Hydrol. Process. 35, e14117. doi:10.1002/hyp.14117
Morris, P. J., and Waddington, J. M. (2011). Groundwater Residence Time Distributions in Peatlands: Implications for Peat Decomposition and Accumulation. Water Resour. Res. 47. W02511, 1–12. doi:10.1029/2010WR009492
Nelson, K., Thompson, D., Hopkinson, C., Petrone, R., and Chasmer, L. (2021). Peatland-fire Interactions: A Review of Wildland Fire Feedbacks and Interactions in Canadian Boreal Peatlands. Sci. Total Environ. 769, 145212. doi:10.1016/j.scitotenv.2021.145212
Nijp, J. J., Metselaar, K., Limpens, J., Teutschbein, C., Peichl, M., Nilsson, M. B., et al. (2017). Including Hydrological Self-Regulating Processes in Peatland Models: Effects on Peatmoss Drought Projections. Sci. Total Environ. 580, 1389–1400. doi:10.1016/j.scitotenv.2016.12.104
Niswonger, R. G., Prudic, D. E., and Regan, R. S. (2006). Documentation of the Unsaturated-Zone Flow (UZF1) Package for Modeling Unsaturated Flow between the Land Surface and the Water Table with MODFLOW-2005. Denver, (USA): U.S. Geological Survey Techniques and Methods, 62. 6-A19.
Okkonen, J., and Kløve, B. (2011). A Sequential Modelling Approach to Assess Groundwater–Surface Water Resources in a Snow Dominated Region of Finland. J. Hydrol. 411 (1-2), 91–107. doi:10.1016/j.jhydrol.2011.09.038
Oswald, C. J., Richardson, M. C., and Branfireun, B. A. (2011). Water Storage Dynamics and Runoff Response of a Boreal Shield Headwater Catchment. Hydrol. Process. 25 (19), 3042–3060. doi:10.1002/hyp.8036
Oudin, L., Hervieu, F., Michel, C., Perrin, C., Andréassian, V., Anctil, F., et al. (2005). Which Potential Evapotranspiration Input for a Lumped Rainfall–Runoff Model? Part 2—Towards a Simple and Efficient Potential Evapotranspiration Model for Rainfall–Runoff Modelling. J. Hydrol. 303 (1-4), 290–306. doi:10.1016/j.jhydrol.2004.08.026
Ouranos (2015). Vers l’adaptation. Synthèse des connaissances sur les changements climatiques au Québec. Partie 1: Évolution climatique au Québec”. Montreal, Quebec, Canada: Ouranos, 114.
Paradis, É., Rochefort, L., and Langlois, M. (2015). The Lagg Ecotone: an Integrative Part of Bog Ecosystems in North America. Plant Ecol. 216 (7), 999–1018. doi:10.1007/s11258-015-0485-5
Payette, S., and Rochefort, L. (2001). Écologie des tourbières du Québec-Labrador”. Québec (Canada): Presses Université Laval, 550.
Quillet, A., Larocque, M., Pellerin, S., Cloutier, V., Ferlatte, M., Paniconi, C., et al. (2017). The Role of Hydrogeological Setting in Two Canadian Peatlands Investigated through 2D Steady-State Groundwater Flow Modelling. Hydrological Sci. J. 62 (15), 2541–2557. doi:10.1080/02626667.2017.1391387
Reeve, A., Siegel, D., and Glaser, P. (2000). Simulating Vertical Flow in Large Peatlands. J. Hydrol. 227 (1-4), 207–217. doi:10.1016/s0022-1694(99)00183-3
Richardson, K., Bona, K. A., Davidson, S. J., Finkelstein, S. A., Garneau, M., McLaughlin, J., et al. (2021). The Essential Carbon Service provided by Northern Peatlands. Front. Ecol. Environ. 20, 222–230. doi:10.1002/fee.2437
Robitaille, M., Garneau, M., van Bellen, S., and Sanderson, N. K. (2021). Long-term and Recent Ecohydrological Dynamics of Patterned Peatlands in North-Central Quebec (Canada). Holocene 31 (5), 844–857. doi:10.1177/0959683620988051
Rosa, E., and Larocque, M. (2008). Investigating Peat Hydrological Properties Using Field and Laboratory Methods: Application to the Lanoraie Peatland Complex (Southern Quebec, Canada). Hydrol. Process. 22 (12), 1866–1875. doi:10.1002/hyp.6771
Rosenberry, D. O., and LaBaugh, J. W. (2008). Field Techniques for Estimating Water Fluxes between Surface Water and Ground Water. Denver (USA): U.S. Geological Survey Techniques and Method, USGS, 128.
Rossi, P. M., Ala-aho, P., Doherty, J., and Kløve, B. (2014). Impact of Peatland Drainage and Restoration on Esker Groundwater Resources: Modeling Future Scenarios for Management. Hydrogeol. J. 22, 1131–1145. doi:10.1007/s10040-014-1127-z
Saraswati, S., Petrone, R. M., Rahman, M. M., McDermid, G. J., Xu, B., and Strack, M. (2020). Hydrological Effects of Resource-Access Road Crossings on Boreal Forested Peatlands. J. Hydrology 584, 124748. doi:10.1016/j.jhydrol.2020.124748
Schneider, R. R., Devito, K., Kettridge, N., and Bayne, E. (2016). Moving beyond Bioclimatic Envelope Models: Integrating Upland Forest and Peatland Processes to Predict Ecosystem Transitions under Climate Change in the Western Canadian Boreal Plain. Ecohydrol. 9 (6), 899–908. doi:10.1002/eco.1707
Scibek, J., and Allen, D. (2006). Modeled Impacts of Predicted Climate Change on Recharge and Groundwater Levels. Water Res. Res. 42, 1–18. doi:10.1029/2005wr004742
Seppälä, M., and Koutaniemi, L. (1985). Formation of a String and Pool Topography as Expressed by Morphology, Stratigraphy and Current Processes on a Mire in Kuusamo, Finland. Boreas 14 (4), 287–309.
Sillmann, J., Kharin, V. V., Zwiers, F. W., Zhang, X., and Bronaugh, D. (2013). Climate Extremes Indices in the CMIP5 Multimodel Ensemble: Part 2. Future Climate Projections. J. Geophys. Res. Atmos. 118 (6), 2473–2493. doi:10.1002/jgrd.50188
Spence, C., Guan, X. J., and Phillips, R. (2011). The Hydrological Functions of a Boreal Wetland. Wetlands 31 (1), 75–85. doi:10.1007/s13157-010-0123-x
Surridge, B. W. J., Baird, A. J., and Heathwaite, A. L. (2005). Evaluating the Quality of Hydraulic Conductivity Estimates from Piezometer Slug Tests in Peat. Hydrol. Process. 19 (6), 1227–1244. doi:10.1002/hyp.5653
Tarnocai, C., Kettles, I., and Lacelle, B. (2000). Peatlands of Canada. Canada: Geological Survey of Canada. Open File Report, vol. 3834.
Thompson, C., Mendoza, C. A., Devito, K. J., and Petrone, R. M. (2015). Climatic Controls on Groundwater-Surface Water Interactions within the Boreal Plains of Alberta: Field Observations and Numerical Simulations. J. Hydrology 527, 734–746. doi:10.1016/j.jhydrol.2015.05.027
USGS (United States Geological Survey) (2021). USGS Global Positioning Application and Practice. Available at: http://water.usgs.gov/osw/gps/ (Accessed November, 2021).
van der Kamp, G., and Hayashi, M. (2009). Groundwater-wetland Ecosystem Interaction in the Semiarid Glaciated Plains of North America. Hydrogeol. J. 17 (1), 203–214. doi:10.1007/s10040-008-0367-1
Waddington, J. M., Morris, P. J., Kettridge, N., Granath, G., Thompson, D. K., and Moore, P. A. (2015). Hydrological Feedbacks in Northern Peatlands. Ecohydrol. 8 (1), 113–127. doi:10.1002/eco.1493
Wang, Y., Hogg, E. H., Price, D. T., Edwards, J., and Williamson, T. (2014). Past and Projected Future Changes in Moisture Conditions in the Canadian Boreal Forest. For. Chron. 90 (5), 678–691. doi:10.5558/tfc2014-134
Wells, C., Ketcheson, S., and Price, J. (2017). Hydrology of a Wetland-Dominated Headwater Basin in the Boreal Plain, Alberta, Canada. J. Hydrology 547, 168–183. doi:10.1016/j.jhydrol.2017.01.052
White, M., and Payette, S. (2016). Pool Size Structure Indicates Developmental Stages of Boreal Fens. Botany 94, 643–651. doi:10.1139/cjb-2015-0268
Whittington, P. N., and Price, J. S. (2006). The Effects of Water Table Draw-Down (As a Surrogate for Climate Change) on the Hydrology of a Fen Peatland, Canada. Hydrol. Process. 20 (17), 3589–3600. doi:10.1002/hyp.6376
Winter, T. C. (1999). Relation of Streams, Lakes, and Wetlands to Groundwater Flow Systems. Hydrogeology J. 7 (1), 28–45. doi:10.1007/s100400050178
Winter, T. C. (2001). The Concept of Hydrologic Landscapes. J. Am. Water Resour. Assoc. 37 (2), 335–349. doi:10.1111/j.1752-1688.2001.tb00973.x
Wu, J., Kutzbach, L., Jager, D., Wille, C., and Wilmking, M. (2010). Evapotranspiration Dynamics in a Boreal Peatland and its Impact on the Water and Energy Balance. J. Geophys. Res. 115, 4038. doi:10.1029/2009JG001075
Yu, Z. (2011). Holocene Carbon Flux Histories of the World’s Peatlands: Global Carbon Cycle Implications. Holocene 21, 761–774. doi:10.1177/0959683610386982
Keywords: Aquifer, peatland, hydraulic conductivity, water table depths, hydrological connectivity, MODFLOW, north-central Quebec (Canada), recharge
Citation: Lambert C, Larocque M, Gagné S and Garneau M (2022) Aquifer-Peatland Hydrological Connectivity and Controlling Factors in Boreal Peatlands. Front. Earth Sci. 10:835817. doi: 10.3389/feart.2022.835817
Received: 14 December 2021; Accepted: 19 May 2022;
Published: 21 June 2022.
Edited by:
Frédéric Frappart, INRAE Nouvelle-Aquitaine Bordeaux, FranceReviewed by:
Anna-Kaisa Ronkanen, Finnish Environment Institute (SYKE), FinlandDengpan Xiao, Hebei Normal University, China
Sakari Sarkkola, Natural Resources Institute Finland (Luke), Finland
Copyright © 2022 Lambert, Larocque, Gagné and Garneau. This is an open-access article distributed under the terms of the Creative Commons Attribution License (CC BY). The use, distribution or reproduction in other forums is permitted, provided the original author(s) and the copyright owner(s) are credited and that the original publication in this journal is cited, in accordance with accepted academic practice. No use, distribution or reproduction is permitted which does not comply with these terms.
*Correspondence: M. Larocque, bGFyb2NxdWUubWFyaWVAdXFhbS5jYQ==