 Qun Yu1
 Danchen Zhao
 Yingjie Xia
- 1School of Architecture and Civil Engireering, Shenyang University of Technology, Shenyang, China
- 2State Key Laboratory of Coastal and Offshore Engineering, Dalian University of Technology, Dalian, China
- 3China Railway Construction Bridge Engineering Bureau Group 3rd Engineering Co., Shenyang, China
The monitoring of rockburst is one of the worldwide problems in underground engineering and how to effectively predict and early warn the occurrence of rockburst disasters has become an urgent problem to be solved. In this article, the high rockburst occurrence section of the deep diversion tunnel of Jinping Hydropower Station on the yalong River is taken as the research object. Based on the microseismic monitoring technology and combined with the principle of seismology with qualitative analysis and quantitative calculation, the distribution law of “time, space, and intensity” of microseismic activity and the change law of source parameters time series are used as the precursor characteristics of rockburst early warning. Based on these, the internal relationship between the microseismic activity and the rockburst micro-fracture was studied. The monitoring results show that the rockburst occurred before has obvious micro-fracture precursors. The microseismic activity is a self-organizing process from spatial disordered dispersion to ordered concentration. The abnormal changes in source parameters such as density of microseismic events, seismic energy density, the cumulative volume, energy index, 3S index, and b values can be used as a warning identification of rockburst. Therefore, the multivariate early warning method for rockburst monitoring based on the comprehensive analysis of source parameters in the deep tunnel is proposed. The prediction accuracy of this method is up to 80.6%, and it can provide reference for the rockburst prediction, warning, and safe construction of such tunnel engineering.
1 Introduction
Rockburst is a dynamic phenomenon and ejection caused by the sudden release of elastic deformation and potential energy accumulated in underground engineering rock mass under excavation disturbance. As the major rock mass projects in national economic construction tend to be more and more comprehensive and complicated, the underground infrastructure construction is generally faced with the challenges of complex and changeable environment, construction safety under extreme load conditions, and gradual development from ground to deep underground. Subsequently, the engineering geological disasters caused by deep problems are increasing day by day, and the rockburst induced by high ground stress is the most typical dynamic disaster. Table 1 lists the basic situation and records of rockburst disasters of key tunnel projects, and statistics of the occurrence proportions of rockburst events of different grades and intensities in China (Feng et al., 2012; Zhang et al., 2012; Yu et al., 2020; Mu et al., 2021). It can be seen that rockburst not only threatens the safety of construction personnel and equipment, but also directly affects the progress of work, even induces earthquakes and destroys the whole project construction. In addition, it has become a major technical bottleneck problem in the future deep and deep underground engineering in China (Pu et al., 2019; Yu et al., 2021a; Zheng et al., 2021). Therefore, it is of great theoretical value and practical significance to carry out the research on rockburst monitoring and early warning under the influence of unloading of deep-buried tunnel.
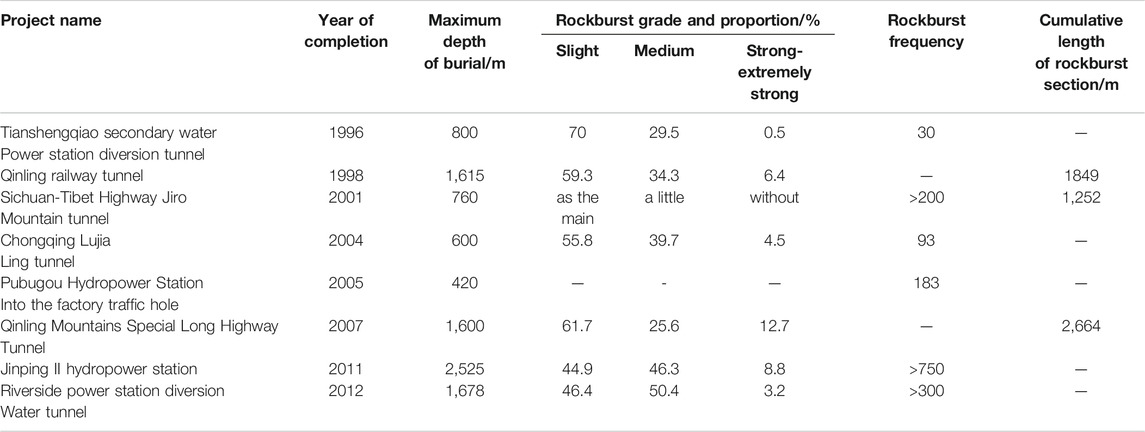
TABLE 1. Incomplete statistical of rockbursts record in tunnel engineering in China (Feng et al., 2012).
The studies show that the rockburst is closely related to the microseismic activity (micro-fracture) in the rock. There are micro-fracture precursors corresponding to rockburst in every stage from initiation, development to occurrence, and the abnormal phenomenon of microseismic activity is the micro-fracture precursors of rockburst (Zhang et al., 2020; Du et al., 2021; Yu et al., 2021b). Therefore, the accurate understanding of microseismic activity in rock mass is the basis of rockburst disaster prediction and dynamic control. In recent years, the researchers have carried out innovative research on the law of microseismic activity by using seismology, nonlinear dynamics, and other theories, and the research results were obtained. For example, Senfaute et al. (1997) analyzed the relationship between the distribution of microseismic events and the change of rock mass stress state during the mining operation of coal mine by means of microseismic monitoring. The correlation between the support conditions and the concentration of microseismic events was found and it provided a new research method for the prediction and risk evaluation of rockburst disaster. Gibowicz (2009) monitored the mining-induced microseismic activities through the microseismic monitoring technology, and elaborated the mechanism of microseismic generation and the feasibility of predicting mine earthquakes. Based on these, the geophysical methods for studying mining-induced mine seismic events were introduced. Srinivasan et al. (1999) used the parameters of microseismic events, microseismic energy, and event-dominant frequency as the indicators of rockburst prediction and early warning in the Kolar gold mine in India. Zhao and Li. (2021) conducted the nonlinear analysis of microseismic activities, judged the possibility of rockburst according to the number of microseismic events generated per unit time, and carried out research on the microseismic activity and the potential danger area of rockburst of Hongdoushan Copper Mine. Tang et al. (2015) put forward the earthquake nucleation model and South Africa ISSI microseismic monitoring system was study the mine earthquake activity relationship corresponding to mining activities. This model has been successfully applied to the rockburst prediction of Dongguashan Copper Mine by using the criteria of earthquake gestation and nucleation of relative earthquake stress and displacement. At the same time, Feng et al. (2015) analyzed the occurrence mechanism and later dynamic support of rockburst in Jinping Tunnel by studying the law of microseismic activity, and carried out detailed research on the occurrence law, prediction, and early warning problems of rockburst. In addition, based on the variation law of microseismic parameters before rockburst, the precursor of rockburst micro-fracture by using parameters such as the number of microseismic events was studied (Li et al., 2012; Wu et al., 2012; Chen et al., 2013; Xu et al., 2016; Ma et al., 2018; Liu et al., 2019). The relationship between event magnitude and frequency in the processes of rockburst prediction and early warning for the deep-buried diversion tunnel and the drainage tunnel of Jinping II hydropower station during construction were analyzed. It is proved that by practice and statistics, the rockburst can be predicted and forewarned by microseismic monitoring technology.
From the literature analysis above, we know the rockburst monitoring and early warning technology has been widely used in mining engineering, underground engineering, tunnel engineering, water conservancy, hydropower engineering, and other fields, making it possible to evaluate the stability of rock mass. However, the researches still have the following shortcomings. 1) The rockburst early warning index is relatively single. Every signal of rock micro-fracture contains rich information of rock mass state change, and how to obtain the monitoring data in the systems, and make reasonable interpretation based on the data, so as to realize the rockburst prediction is the focus of rockburst warning. 2) Rockburst prediction and warning criterion in the judgment system are not complete. The existing reports on the application of microseismic information in rockburst early warning are mainly reflected in successful cases, and the established early warning criteria and methods are not universal. Therefore, in this article, taking the section of deep-buried tunnel with high rockburst occurrence of Jinping Hydropower Station as the research object, the real-time monitoring and analysis of the surrounding rock microseismic activities in the area of high buried depth and high in-situ stress were carried out. Based on the source statistical parameters including the density of microseismic events, seismic energy density, 3S index, the cumulative apparent volume, the energy index, and the space-time evolution regularity of b value, the temporal variation characteristics as a precursor to micro-fracture characteristics of early warning were analyzed. In addition, through the qualitative analysis and quantitative calculation, the multivariate early warning method for deep hard rock tunnel rockburst monitoring in the Jinping II Hydropower Station was proposed and verified. It may provide some references for the excavation of tunnels and prediction of rockburst during construction.
2 Engineering Background
2.1 Project Overview
The Jinping II Hydropower Station, located on the Yalong River in Sichuan Province, is an important landmark project of power transmission from west to east of China. Figure 1 shows the layout of diversion tunnel of hydropower station; it can be seen the hydropower engineering tunnel group is composed of 7 parallel tunnels with an average length of over 16.7 km and trending toward N58°W, 2 traffic tunnels, 4 diversion tunnels, and 1 drainage tunnel, respectively (Figure 1A Layout of the Jinping hydropower project across the Yalong River; B) location of the Jinping II Hydropower Station; C) configuration of seven tunnels; and D) the construction detailed dimension drawing for the headrace tunnel and drainage tunnel). The tunnel construction process adopts a tunnel boring machine (TBM) method and drill burst tunneling. The TBM construction method is adopted for 1#, 3# water diversion tunnel and drainage tunnel, and the diameter of the excavation hole is 12.4 and 7.2 m respectively. The diversion tunnels of 2# and 4# are constructed by drilling and blasting method, with a diameter of 13 m.
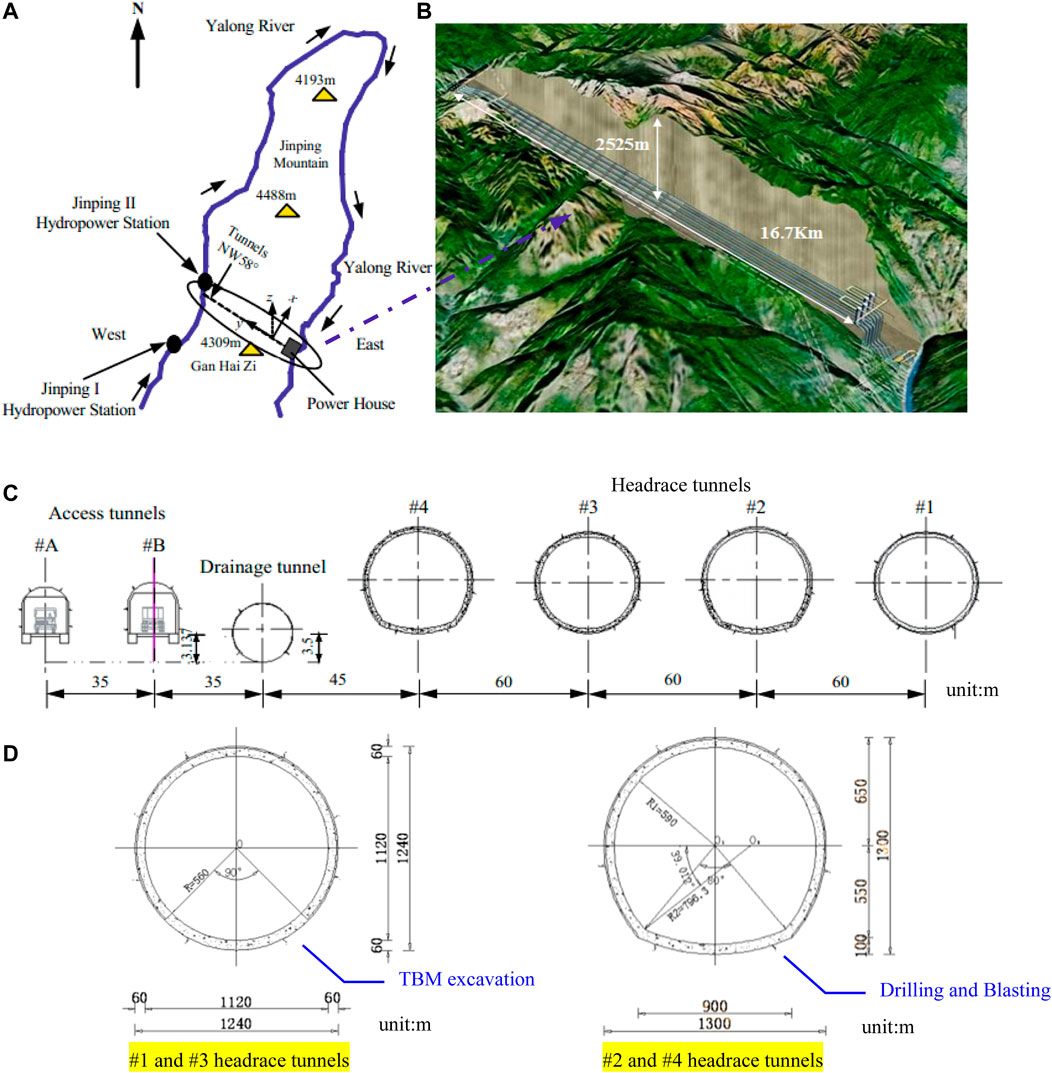
FIGURE 1. Layout and location of tunnels at the Jinping II hydropower station. (A) Layout of the Jinping hydropower project across the Yalong River; (B) location of the Jinping II Hydropower Station; (C) coniguration of seven tunnels; and (D) the construction detailed dimension drawing for the headrace tunnel and drainage tunnel.
3 Geological Investigation
Figure 2 shows the engineering geological profile of the Jinping II Hydropower Station. Since it is located between the Qinghai-Tibet Plateau and Sichuan Basin, there is a typical slope geomorphic feature with a large overall terrain drop. The deep valley is in the shape of “V,” and the coastal terraces sporadically developed. The overall strike of the strata is mainly in the direction of NNE. The main rock strata through which the tunnel group passes from west to east are lower Triassic chlorite schist and metamorphic medium sandstone, etc. The physical and mechanical parameters of various strata rock masses are shown in Table 2. It can be seen the surrounding rock is fresh brittle hard rock, and the rock mass integrity is good (Yu et al., 2014; Xia et al., 2022). The tunnel group has the characteristics of large buried depth, long tunnel line, difficult construction, and diverse and complex geological conditions. Its buried depth is 1500–2200 m, with the maximum buried depth of 2525 m. Therefore, the tunnel group is the super-large underground hydropower project existing in China.

FIGURE 2. An engineering geological profile of deep-buried tunnel of Jinping II Hydropower Station.
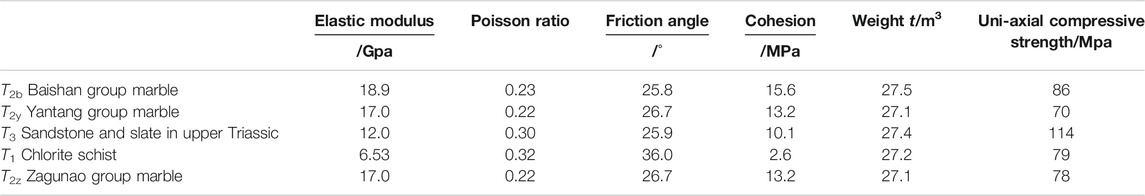
TABLE 2. Strata physical and mechanical properties for the Jinping project.
3.1 Construction of Microseismic Monitoring System
The Jinping microseismic monitoring project adopts Canadian Engineering Solution Group (ESG) monitoring system, which is mainly composed of Paladin digital signal acquisition system, hyperion digital signal processing system, and acceleration sensor. The workflow of the microseismic monitoring system is shown in Figure 3. The data acquisition instrument was installed on both sides of the work face in the array form. Two sensors are arranged 50 m away from the rear of the working face, and the distance between the sensors is also 50 m. At every 50 m advance of the working face, the two sensors located at the end follow forward to 50 m away from the working face. Through this cycle, the microseismic monitoring system can work closely with the working face and achieve the purpose of real-time monitoring (Zhang et al., 2012; Yu et al., 2014; Xu et al., 2016; Yu et al., 2021b; Zhang et al., 2021).
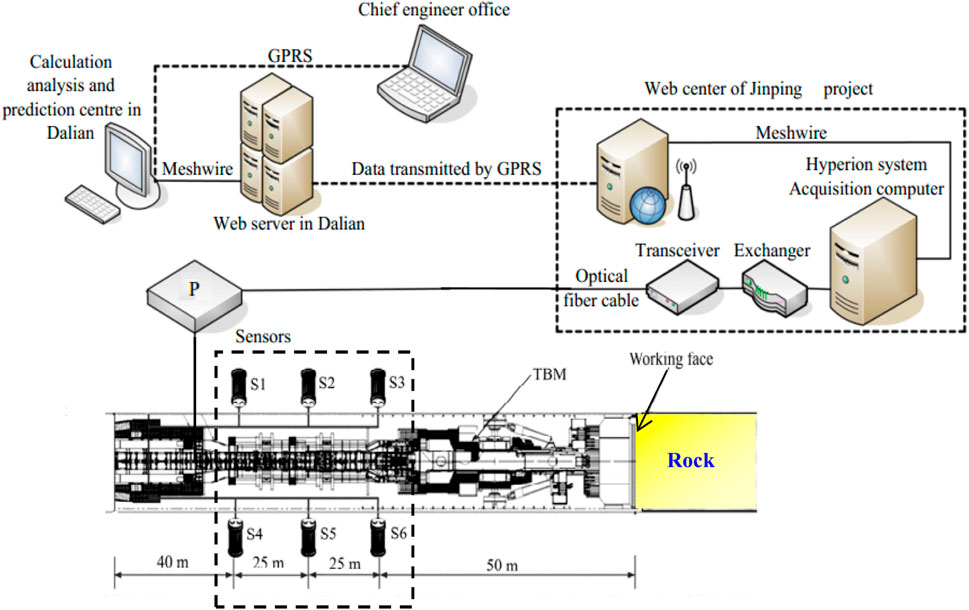
FIGURE 3. Microseismic monitoring system for ground tunnels in Jinping hydropower station (Yu et al., 2014).
4 Research on Early Warning Method of Rockburst
4.1 Selection of Source Parameters for Rockburst Warning
Under the external disturbance, the secondary distribution of stress field will inevitably lead to the accumulation and concentration of local stress, and then cause the transfer and release of surrounding rock stress. In the process of stress accumulation and release, rock micro-fracture (microseismic) occurs. This associated phenomenon reflects the response of the surrounding rock mass structure to stress, which is called “emergence” of stress field, and the micro-fracture is exactly a form of emergence of stress field. That is, in a certain area, the more microseismic events, the greater the aggregation degree, and the frequent occurrence of high-energy large earthquakes, indicating that the stress state in this area is much higher than that of the original rock. Therefore, through the evolution and distribution law of microseismic activity “time, space, and intensity” (i.e., occurrence time, space, and intensity), the change situation and change law of internal stress in engineering disturbance range can be indirectly reflected.
With the development of geophysics and a better understanding of rockburst, it has become possible to predict and warn of rockbursts by means of microseismic monitoring technology based on the results of natural earthquake prediction (Liu et al., 2013). In the study of seismology theory, seismic statistical analysis on temporary and spatial evolution laws of MS events is widely used to evaluate rock mass stability. The seismology statistical parameters of microseismic activity include apparent volume, apparent stress, and energy index. Therefore, by analyzing the distribution law of microseisms in time, space, and intensity and the temporal variation law of focal parameters corresponding to the precursors of rockburst micro-fracture, the microseismic event density, microseismic energy density, 3S theory and index, cumulative apparent volume and energy index, and b value are selected as the related parameters and indexes of rockburst prediction and early warning.
4.1.1 Microseismic Event Density
The density of microseismic events represents the number of microseismic events per unit volume, which directly reflects the clustering degree of microseismic events and the damage degree of rock micro-fracture (Liu et al., 2013; Yang et al., 2013; Xia et al., 2020; Zheng et al., 2021). According to the size, concentration degree, and density of micro-fracture, it is possible to infer the development trend of rock micro-fracture. Then it is possible to predict the occurrence of rockburst based on the distribution and clustering law (Wu et al., 2012) of micro-fracture. The density of microseismic events can be expressed as
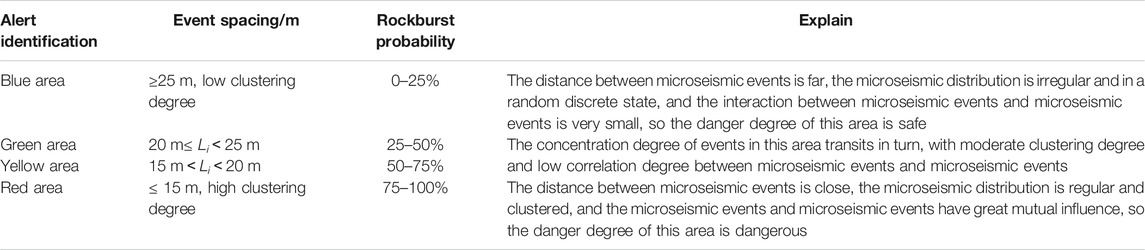
TABLE 3. Safety grade table of microseismic event density.
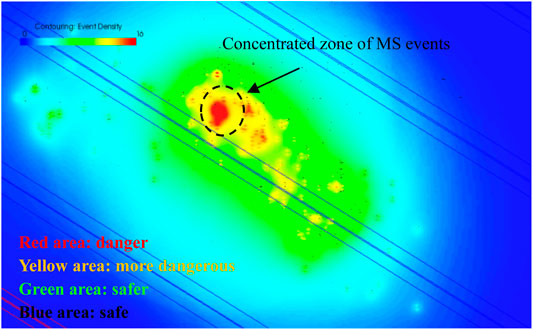
FIGURE 4. Rockburst hazard zoning by the contour of microseismic events.
4.1.2 Microseismic Energy Density
Microseismic energy density represents the spatial quantitative distribution characteristics of microseismic energy release intensity, which can not only reflect the location and intensity of rock micro-fracture, but also characterize the release process of rock strain energy in the source area. Then, it can explore the state of engineering rock mass under the action of external disturbance. The area of high energy density distribution in rock mass is the area of high energy release after stress accumulation reaches peak intensity, and is also the area of concentrated micro-fracture and serious damage. The monitoring space is assumed to be
If the total released energy can be expressed as E, and the volume of a sphere or cylinder was described as
Figure 5 shows the hazard of rockburst judging by the energy density cloud. In the monitoring of Jinping deep water diversion tunnel rockburst, it can also be divided into four safety levels by microseismic energy density. The red zone has the highest energy density (75–100% rockburst probability) and is also a potential rockburst danger zone. The blue zone has the lowest energy density (rockburst probability under 25%), indicating a safe zone and no rockburst tendency. Besides, the intermediate energy density values are successively excessive.
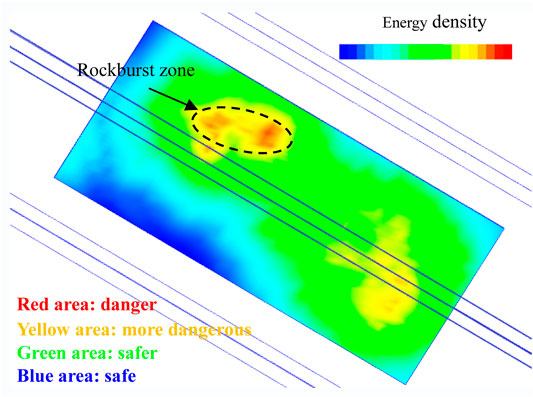
FIGURE 5. Rockburst hazard zoning by the contour of microseismic energy density.
4.1.3 3S Theory
In the study of seismology theory, Tang et al. (2009) proposed that the stress accumulation, stress shadow, and stress transfer (3S for short) are three states of stress. Similar to the principle of earthquake, stress adjustment needs a certain period of time and period in the development and occurrence stage of rockburst. According to the statistics of rockburst with moderate intensity and above, it is found that the microseismic activity has a certain periodicity and regularity before the occurrence of rockburst. Based on the regularity corresponding to the 3S phenomenon in seismology, the microseismic activity before and after rockburst can be divided into three stages in a same way: the development period, the peak period, and the quiet period, as shown in Figure 6.
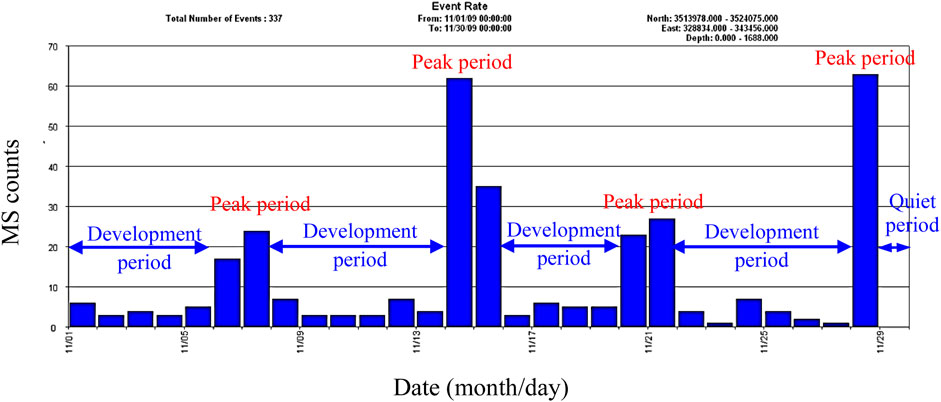
FIGURE 6. Frequency of microseismic events based 3S theory.
Generally, when microseismic events accumulate to a certain extent in a certain area, there will be a peak of microseismic events (i.e., stress accumulation stage). If no rockburst occurs in the peak period, the microseismic events in the next stage will continue to increase and the stress will continue to accumulate. However, if the rockburst occurs during the peak period, the stress accumulated in the rock mass is released (the stress-shadowing stage). Accordingly, on the basis of the monitoring data and geological conditions, corresponding early warning should be made in time. After the rockburst, if the stress and energy in the rock mass in this area are released completely, the frequency of microseismic activity drops rapidly. When a few or no microseismic events occur, this stage is called the quiet period of microseismic events.
4.1.4 Cumulative Apparent Volume and Energy Index
According to the typical stress-strain curve of rock, the deformation growth is accelerated and the stress growth is slow when the rock is close to the peak strength. Then in the late peak period, the stress decreases with the increase in deformation. After that, when the rock mass is in the strain-softening stage, the larger the stress drop is, the more likely the rock mass will be unstable and the more serious the failure degree will occur. Therefore, the slope of cumulative apparent volume
where E is the seismic energy and p is the seismic potential.
where μ is the shear stiffness and M is the seismic moment.
Energy index refers to the ratio of the radiation energy generated by the seismic event to the average seismic energy
The energy index reflects the variation of driving stress in the source region. According to the instability theory of rock, strain softening occurs in the residual strength stage of rock failure, and the larger the stress drop is, the more serious the rock damage is. Therefore, the greater the energy index in the monitoring area, the higher the stress level in the area. However, the rapid decrease in the energy index indicates that the instability of rock mass increases and the probability of big events increases greatly. So the apparent stress, apparent volume, and energy index reflect the stress state of rock mass under external disturbance in real time. The temporal variation characteristics of these parameters can be used to obtain the precursor information of micro-fracture before rockburst.
4.1.5 b Value
The existing research results show that both microseismic events induced by engineering disturbance and natural seismic events follow the magnitude-frequency (G-R) relationship (Gutenberg and Richter, 1994). The mathematical expression is
where M is the magnitude and N(M) is the total number of microseismic events above magnitude M, and a and b are the constants for a given monitoring area.
The relationship curve of magnitude-event number of typical earthquakes is shown in Figure 7, in which the b value represents the function of the relative magnitude distribution of microseismic events. That is the proportion relationship between the number of large earthquakes and the number of small earthquakes in a certain area. In can be seen in Figure 7 that when the value of b increases, the number of large magnitude events is less but the number of small earthquakes is more. However, when the value of b decreases, the proportion of large earthquake events increases and the stability of rock mass begins to decline. In addition, the value of b is also related to the strength and stress of the medium in this area (Xu et al., 2014).
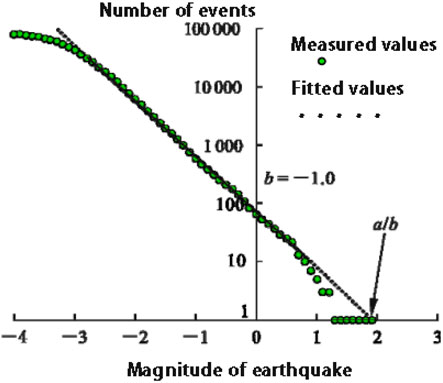
FIGURE 7. A typical frequency-magnitude relation curve (Gibowicz and Lasocki, 1990).
4.1.6 Research on Rockburst Monitoring and Early Warning Methods
Since the operation of the microseismic monitoring system in the deep diversion tunnel of Jinping Hydropower Station, a large number of microseismic monitoring data have been obtained. Based on the early warning parameters in Section 3.1, the clustering area was delineated through the distribution of “time, space, and intensity” of microseismic events. In addition, the density and energy density of microseismic events, and the potential danger area of rockburst were determined. After that, the overall stability of rock mass is determined by analyzing the apparent volume, apparent stress and energy index, b value evolution law, and 3S theory. The multiparameter early warning model for rockburst monitoring of deep-buried tunnels of Jinping II Hydropower Station is proposed by combining qualitative analysis with quantitative calculation (Figure 8).
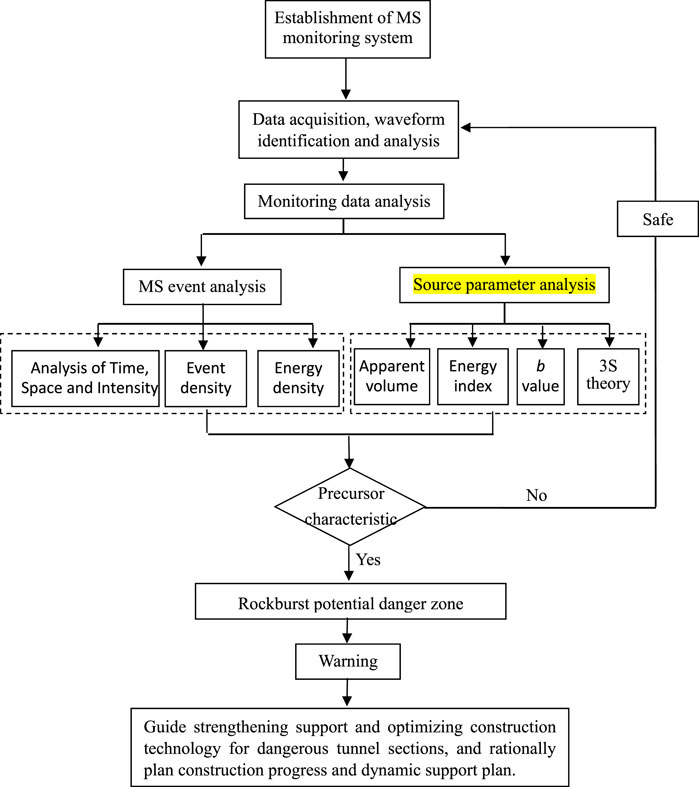
FIGURE 8. Flow chart of early warning for rockburst in deep-buried tunnel at Jinping project.
According to the monitoring results of five tunnels at the construction site (including water diversion tunnel and drainage tunnel of 1#∼4#) monitored by the microseismic monitoring system, 191 of the 237 rockbursts recorded at the site were accurately predicted. The accuracy rate including the location and intensity of rockbursts is 80.6% (Tang et al., 2014). Therefore, it means that this method can provide guidance for tunnel construction and excavation, and provide reference for monitoring, warning, and prevention of rockburst in this kind of tunnel.
5 Engineering Application of Rockburst Early Warning Method
From July 1st to July 20th, 2011, one strong rockburst and four moderate rockbursts occurred in the section of tunnel (3) 9 + 218–250, as shown in Table 4. In this monitoring tunnel section, the rock mass is composed of T2B thick massive marble, crystalline limestone and white ∼ grayish white coarse-grained smelly marble, and located in the high-stress area. The rock mass has dense structure, pure quality, good integrity, thick massive structure, no large-scale fault zone, and classed into III and II surrounding rock. Among the rockburst events, the most severe one occurred on July 20th, 2011, damaged length up to 32 m, and extensive damage occurred at the south shoulder to side wall (Figure 9). According to the damaged surrounding rock and support conditions, the rock block pops out and the water expansion bolt is seriously bent and exposed. The damage depth of blasting pit is between 0.6 and 1.0 mm, which is in the shape of pot bottom, and the damaged rock mass is generally broken. When rockburst occurred, there was a large continuous sound.
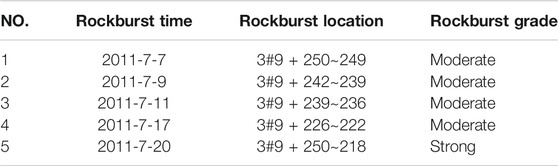
TABLE 4. Basic situation of rockburst in 3 # diversion tunnel.

FIGURE 9. Failure caused by strong rockburst in diversion tunnel #3 on Jul. 20th, 2011.
5.1 Analysis of “Time, Space, and Intensity” of Microseismic Events
Figure 10 shows the plan of temporal and spatial evolution of microseismic activity of #3 diversion tunnel from July 3rd to July 19th, 2011 (The size of the ball represents energy and the color represents moment magnitude respectively). In Figure 10A, from July 3rd to July 6th, 7 high-energy microseismic events occurred and gathered near (3) 9 + 248 working surface. At this time, it is preliminatively predicted that moderate intensity rockburst may occur at the location of (3) 9 + 248 m–9 + 266 m. With the advance of the excavation, the number of major events increased significantly from July 7th to July 10th, and the microseismic activity mainly occurred between (3) 9 + 239 m to 9 + 259 m. Owing to the close spacing of microseismic events, the cluster area of microseismic events is formed, as shown in Figure 10B. Because of the large number of high-energy events generated during this period and the clustering state, the level of rockburst is predicted to be of moderate intensity, and the possible location is still cited at (3) 9 + 239 m–9 + 259 m. In the following 9 days, with the advance of the working surface, microseismic events with high energy and large magnitude continued to occur behind the surface. Furthermore, the range of cluster area of microseismic events A continues to expand to cluster area B (Figure 10D), indicating that the stress of rock mass in this range is still accumulating. Moreover, the strength of surrounding rock was also cracking with time, and finally a strong rockburst occurred at (3) 9 + 230–245 on July 20th, 2011.
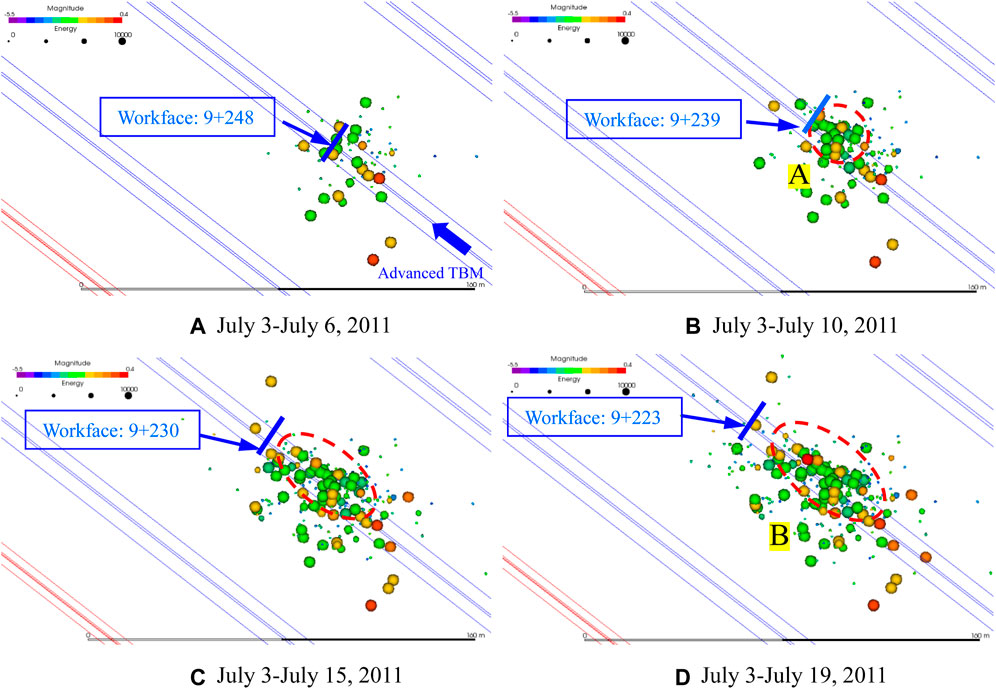
FIGURE 10. The spatio-temporal distribution of MS in diversion tunnel #3.
5.2 Microseismic Event Density and Energy Density
Figure 11 shows the evolution of the microseismic event equivalent density cloud and energy density cloud over time from July 3rd, 2011 to July 19th, 2011 (the left is the microseismic event density cloud and the right is the microseismic event energy density cloud). It can be seen that the rockburst core area of microseismic event density cloud and energy density cloud began to appear on July 6th, the day before the occurrence of medium rockburst. Over the next few days, the dense cloud with this point as its core experienced nucleation and spread out in all directions. The results indicate that the small-scale cracks in rock mass are experiencing initiation, development, merging and forming large-scale cracks. During this period, the strength of the rock mass is reduced due to accumulated damage. The mechanical properties of rock mass deteriorate seriously, and the stability of the surrounding rock is greatly reduced. This is basically consistent with the temporal and spatial distribution and evolution of microseismic activity as shown in Figure 10. The cluster area of microseismic events almost coincides with the area of serious energy loss, which further confirms the possibility of serious deterioration of mechanical properties of rock mass in this area. Finally, the local stress field in the region was fully released in the form of an intense rockburst on July 20th. Therefore, the equivalent density and energy density cloud maps of microseismic events can well reflect the time-space evolution law of internal micro-fracture and damage of rock mass under the action of on-site construction disturbance. The two evidences of each other enable us to accurately determine the location of rockburst nucleation zone and the development process of rockburst.
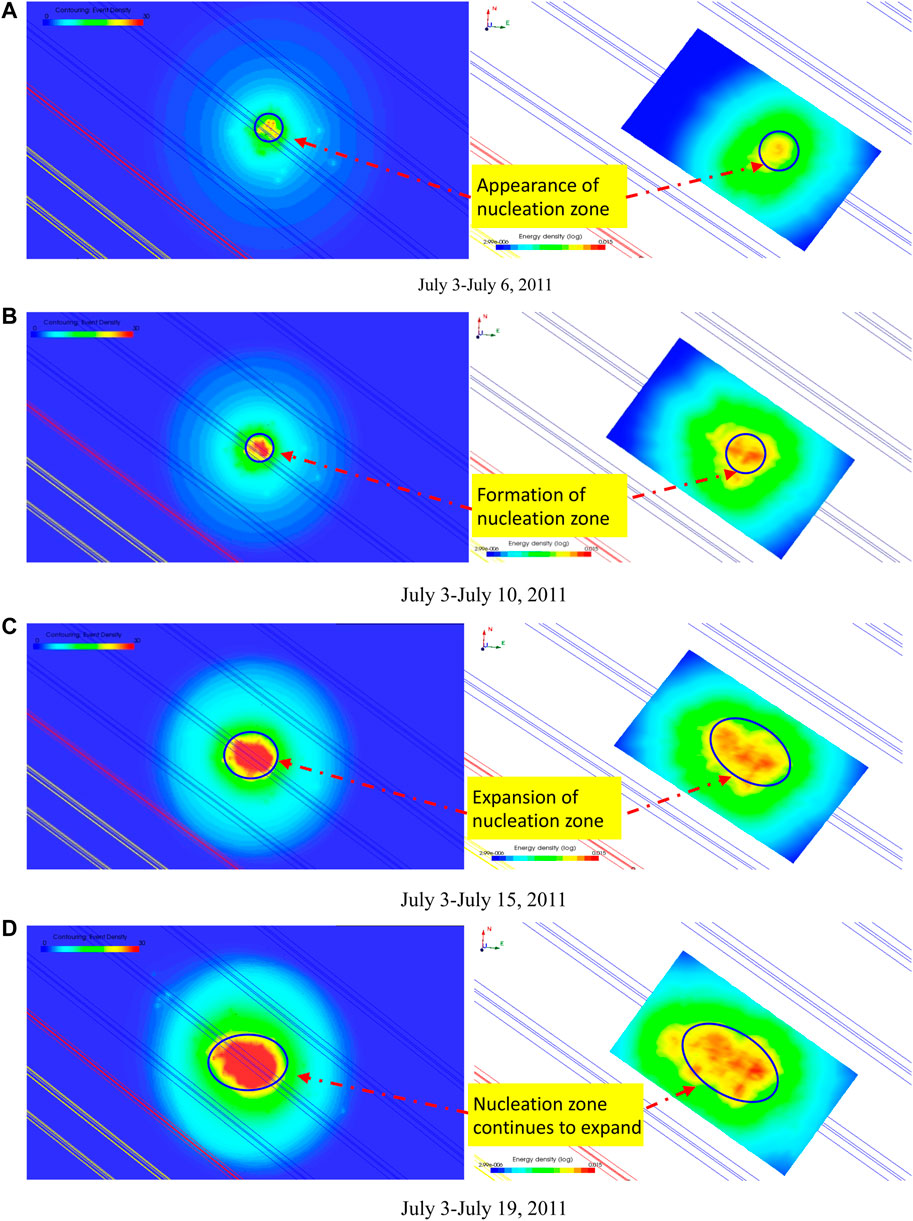
FIGURE 11. Evolution contour of MS events density and energy density in diversion tunnel #3.
5.3 3S Theory
The bar chart of microseismic event frequency variation with time in diversion tunnel #3 from July 3rd to July 23rd, 2011 is shown in Figure 12. It can be seen from the figure that before the occurrence of strong rockburst on July 20th, the occurrence regularity of microseismic events and the occurrence frequency of rockburst are regular. That is, the rockburst usually occurs on the day or adjacent to the peak of microseismic activity. As can be seen from Figure 12, during the 20 days of monitoring, the surrounding rock underwent four cycles of D-P (microseismic development transition period to microseismic peak period) process. The peak of four microseismic events occurred on July 6th (P1), July 10th (P2), July 15th (P3), and July 19th (P4), respectively. When the peak of the first microseismic event P1 arrived, no rockburst occurred. According to the 3S criteria, if microseismic events continue to accumulate in this area, it can be judged as a local high in-situ stress area as well as a rockburst hazard area, and the corresponding early warning and support measures should be made in time. Then the microseismic events developed to the transitional D2 experience. Subsequently, the second peak of microseismic events accumulated until the next day of P2 (July 11th), when moderate rockburst occurred. Similarly, the development and occurrence process of rockburst on July 17th was similar to that of the last rockburst, and it also experienced the microseismic development transitional period D3 and the microseismic event peak P3. Finally, the peak of microseismic event P4 appeared again, but the subsequent rockburst did not occur, so corresponding warning should be made. With the external disturbance, the stress was also accumulated, and finally on July 20th, a strong rockburst occurred. After the strong rockburst occurred, the stress was fully adjusted and released, so the microseismic events rapidly decreased and transitioned to a plateau in the following 2 days.
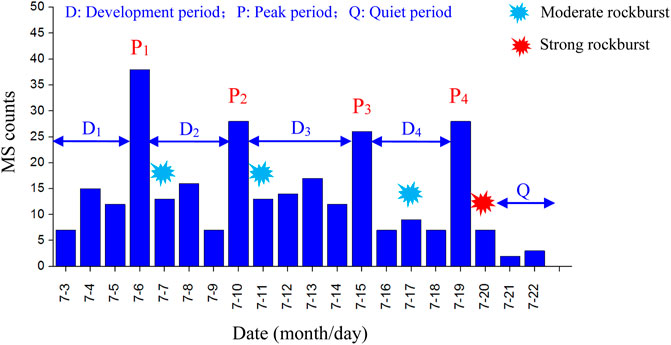
FIGURE 12. The histogram of relationship between microseismic events and time in diversion tunnel #3.
5.4 Cumulative Apparent Volume and Energy Index
Figure 13 shows the curve of cumulative apparent volume and energy index of diversion tunnel #3 over time from July 1st to July 20th, 2011. The warning stage and danger stage of rockburst can be divided based on the curves of energy index and cumulative apparent volume. During this period, the energy index and cumulative apparent volume experienced two rapid decreases and rapid increases. From July 4th to July 9th, the energy index decreased sharply while the cumulative apparent volume continued to increase. It shows that the rock mass has been seriously cracked and the risk of rockburst increases greatly. Then from July 9th to July 12th, the surrounding rock entered the rockburst danger stage. After the rockburst occurred on July 11th, the rock mass experienced another stage of rapid decline of energy index and continuous increase of cumulative apparent volume from July 12th to July 15th. Then the surrounding rock entered the rockburst danger period, and finally rockburst occurred on July 17th and July 20th.
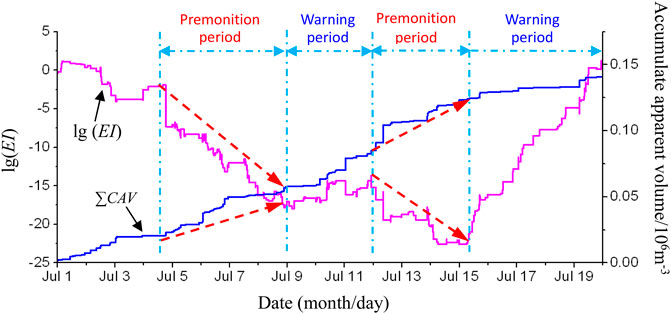
FIGURE 13. A curve of accumulative apparent volume and energy index with time in diversion tunnel #3.
5.5 b Value
In the calculation process of b value, in order to avoid the large fluctuation and error of b value caused by too many or too few events in the selected range due to the large difference in the number of microseismic events generated every day. Therefore, when calculating the b value, the sliding window of equal time or equal number of microseismic events should be selected as far as possible to calculate the number of microseismic events and establish the spatial correlation length relationship. In this article, time is selected as the sliding window to select microseismic events. The time window sliding method of b value from June 28th to July 24th, 2011 is shown in Figure 14. In the calculation, b value is advanced by a sliding window of 7 days, and
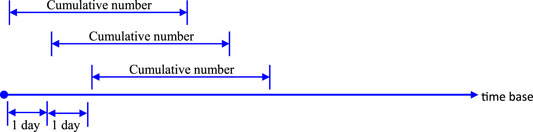
FIGURE 14. A sketch map of time window sliding.
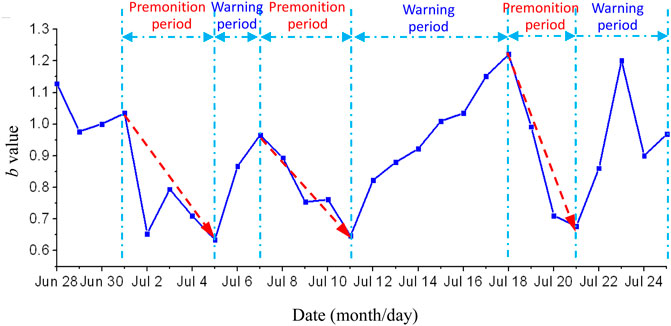
FIGURE 15. The b value varied with time in diversion tunnel #3.
6 Discussions
(1) The precursor and warning stages of rockburst are divided by cumulative apparent volume, energy index, 3S index, and time series variation of b value, but the main parameters are not completely synchronized in time. There are several reasons for this. 1) Because different systems with selected parameters have different sensitivities to their responses, the time division of precursor stage and early warning stage of rockburst is also different, but the two are not contradictory. 2) In the process of data analysis of microseismic monitoring and rockburst prediction, some source parameters are greatly affected by uncertainties such as geological conditions, such as the event positioning accuracy, system sensitivity, waveform processing, and data analysis error. Therefore, the variation rules of these parameters should be referred, compared with each other, and considered comprehensively. In addition, the suggestions should be put forward and predicted based on the actual situation of the site.
(2) The relationship between rockburst and micro-fracture precursor is a sufficient and unnecessary condition, and it is not necessarily the occurrence of rockburst when the precursor features appear. The abrupt changes in seismic statistical parameters CAV, ACT, 3S index, and b value only represent a rapid deformation process of brittle rock mass. Then rebalanced by stress transfer and the energy release, it does not ultimately result in a rockburst. Although the relationship between rockburst and micro-fracture precursor is not sufficient and necessary, these micro-fracture precursor features can play a warning role in rockburst disaster. Thus, the loss of personnel and equipment may be reduced and the prediction and warning of similar tunnel rockburst is provided.
7 Conclusion
(1) The application of microseismic monitoring system and technology in rockburst monitoring of underground cavern of Jinping II Hydropower station provides effective technical measures for rockburst warning and dynamic prevention of tunnel engineering. By using the seismological theory to calculate the monitoring information quantitatively, the early warning parameters reflecting the precursor information of rockburst micro-fracture are obtained. It provides a theoretical basis for quantitative analysis and prediction of microseismic activity of deep-buried tunnels under the influence of excavation unloading.
(2) Through extraction and analysis of microseismic parameters, including microseismic event density and energy density, 3S index, cumulative apparent volume, energy index, and b value analysis, the combination of qualitative analysis and quantitative calculation can effectively and accurately identify the potential danger area of rockburst. In addition, it reveals the internal relationship between the evolution law of time, space, and intensity of microseismic activity and rockburst. The monitoring results show that there are obvious micro-fracture precursors before rockburst. Microseismic activity gradually evolved from spatial disordered distribution to ordered self-organization. The densities of microseismic events and microseismic energy expand around the nucleation region, and the cumulative apparent volume
(3) Based on the study and analysis of source parameters, a multivariate early-warning method and model for rockburst monitoring in deep-buried tunnels are established. By comparing the rockburst records on the site, the prediction accuracy of this method is up to 80.6%, which has high accuracy and practicability. In addition, it also provides reference for the prediction and prevention of rockburst in this kind of tunnel engineering.
Data Availability Statement
The original contributions presented in the study are included in the article/Supplementary Material, further inquiries can be directed to the corresponding author.
Author Contributions
All authors listed have made a substantial, direct, and intellectual contribution to the work and approved it for publication.
Funding
This study was funded by the National Natural Science Foundation of China (Grant Nos 42077251 and 41807269). The work presented in this paper was also supported by Open Research Fund of State Key Laboratory of Geomechanics and Geotechnical Engineering, Institute of Rock and Soil Mechanics, Chinese Academy of Sciences (Grant No. Z020011), Fundamental Research Funds for the Central Universities (Grant No. DUT20RC (3)011).
Conflict of Interest
JZ is employed by the China Railway Construction Bridge Engineering Bureau Group 3rd Engineering Co.
The remaining authors declare that the research was conducted in the absence of any commercial or financial relationships that could be construed as a potential conflict of interest.
Publisher’s Note
All claims expressed in this article are solely those of the authors and do not necessarily represent those of their affiliated organizations, or those of the publisher, the editors, and the reviewers. Any product that may be evaluated in this article, or claim that may be made by its manufacturer, is not guaranteed or endorsed by the publisher.
References
Chen, B. R., Feng, G. L., Li, Q. P., Zhou, H., and Feng, X. T. (2013). Analysis of Microseismic Characteristic and Rockburst Risk during TBM Excavation under Deeply Burried Tunnel. Disaster Adv. 3, 122–128.
Du, J., Chen, J., Pu, Y., Jiang, D., Chen, L., and Zhang, Y. (2021). Risk Assessment of Dynamic Disasters in Deep Coal Mines Based on Multi-Source, Multi-Parameter Indexes, and Engineering Application. Process Saf. Environ. Prot. 155, 575–586. doi:10.1016/j.psep.2021.09.034
Feng, G.-L., Feng, X.-T., Chen, B.-r., Xiao, Y.-X., and Yu, Y. (2015). A Microseismic Method for Dynamic Warning of Rockburst Development Processes in Tunnels. Rock Mech. Rock Eng. 48 (5), 2061–2076. doi:10.1007/s00603-014-0689-3
Feng, X. T., Zhang, C. Q., Chen, B. R., Feng, G. L., Zhao, Z. N., Ming, H. J., et al. (2012). Dynamical Control of Rockburst Evolution Process. Chin. J. Rock Mech. Eng. 31 (10), 1983–1997. doi:10.3969/j.issn.1000-6915.2012.10.004
Gibowicz, S. J., and Lasocki, S. (1990). Seismicity Induced by Mining. Adv. Geophys. 32, 1–74. doi:10.1016/S0065-2687(08)60426-4
Gibowicz, S. J. (2009). Seismicity Induced by Mining: Recent Research. Adv. Geophys. 51, 1–53. doi:10.1016/S0065-2687(09)05106-1
Gutenberg, B., and Richter, C. F. (1994). Frequency of Earthquakes in California. Bull. Seismol. Soc. Am. 34 (4), 185–188. doi:10.1038/156371a0
Li, S., Feng, X.-T., Li, Z., Zhang, C., and Chen, B. (2012). Evolution of Fractures in the Excavation Damaged Zone of a Deeply Buried Tunnel during TBM Construction. Int. J. Rock Mech. Mining Sci. 55, 125–138. doi:10.1016/j.ijrmms.2012.07.004
Liu, F., Tang, C. A., Ma, T., and Tang, L. (2019). Characterizing Rockbursts along a Structural Plane in a Tunnel of the Hanjiang-To-Weihe River Diversion Project by Microseismic Monitoring. Rock Mech. Rock Eng. 52, 1835–1856. doi:10.1007/s00603-018-1649-0
Liu, J.-p., Feng, X.-t., Li, Y.-h., Xu, S.-d., and Sheng, Y. (2013). Studies on Temporal and Spatial Variation of Microseismic Activities in a Deep Metal Mine. Int. J. Rock Mech. Mining Sci. 60, 171–179. doi:10.1016/j.ijrmms.2012.12.022
Ma, T.-H., Tang, C.-A., Tang, S.-B., Kuang, L., Yu, Q., Kong, D.-Q., et al. (2018). Rockburst Mechanism and Prediction Based on Microseismic Monitoring. Int. J. Rock Mech. Mining Sci. 110, 177–188. doi:10.1016/j.ijrmms.2018.07.016
Mu, W., Wang, D., Li, L., Yang, T., Feng, Q., Wang, S., et al. (2021). Cement Flow in Interaction Rock Fractures and its Corresponding New Construction Process in Slope Engineering. Construction Building Mater. 303, 124533. doi:10.1016/j.conbuildmat.2021.124533
Pu, Y., Apel, D. B., Liu, V., and Mitri, H. (2019). Machine Learning Methods for Rockburst Prediction-State-Of-The-Art Review. Int. J. Mining Sci. Tech. 29 (4), 565–570. doi:10.1016/j.ijmst.2019.06.009
Senfaute, G., Chambon, C., Bigarré, P., Guise, Y., and Josien, J. P. (1997). Spatial Distribution of Mining Tremors and the Relationship to Rockburst hazard. Pure Appl. Geophys. 150 (3-4), 451–459. doi:10.1007/s000240050087
Srinivasan, C., Arora, S. K., and Benady, S. (1999). Precursory Monitoring of Impending Rockbursts in Kolar Gold Mines from Microseismic Emissions at Deeper Levels. Int. J. Rock Mech. Mining Sci. 36 (7), 941–948. doi:10.1016/S0148-9062(99)00048-0
Tang, C., Ma, T., and Ding, X. (2009). On Stress-Forecasting Strategy of Earthquakes from Stress Buildup, Stress Shadow and Stress Transfer (SSS) Based on Numerical Approach. Earthq Sci. 22 (1), 53–62. doi:10.1007/s11589-009-0053-y
Tang, L. X., Tang, C. A., Ma, T. H., and Yu, Q. (2014). Study on Rockburst Analysis, Monitoring and Early Warning in Deep-Buried Tunnel at Jinping II Hydropower Station of the Yalong River (Section A), China. Dalian: Mechsoft Technology Co.,Ltd.
Tang, L. Z., Wang, C., Cheng, L. P., and Gao, L. H. (2015). Experimental Study of Mechanical Characteristics of Skarn under One-Dimensional Coupled Static and Cyclic Impact Loads. J. Cent. South Univ. (Science Technology) 46 (10), 3898–3906. doi:10.11817/j.issn.1672-7207.2015.10.045
Wu, A., Ruan, Z., Bürger, R., Yin, S., Wang, J., and Wang, Y. (2020). Optimization of Flocculation and Settling Parameters of Tailings Slurry by Response Surface Methodology. Minerals Eng. 156, 106488. doi:10.1016/j.mineng.2020.106488
Xia, Y., Liu, B., Zhang, C., Liu, N., Zhou, H., Chen, J., et al. (2022). Investigations of Mechanical and Failure Properties of 3D Printed Columnar Jointed Rock Mass under True Triaxial Compression with One Free Face. Geomech. Geophys. Geo-energ. Geo-resour. 8, 26. doi:10.1007/s40948-021-00331-9
Xia, Y., Zhang, C., Zhou, H., HouSu, J. G., Su, G., GaoSingh, Y. H., et al. (2020). Mechanical Behavior of Structurally Reconstructed Irregular Columnar Jointed Rock Mass Using 3D Printing. Eng. Geology. 268, 105509. doi:10.1016/j.enggeo.2020.105509
Xu, N. W., Dai, F., Zhou, Z., Sha, C., and Tang, C. A. (2014). Study of Characteristics of B Value for Microseismic Events in High Rock Slope. Rock Mech. Rock Eng. 33 (S1), 3368–3374. doi:10.13722/j.cnki.jrme.2014.s1.109
Xu, N. W., Li, T. B., Dai, F., Zhang, R., Tang, C. A., and Tang, L. X. (2016). Microseismic Monitoring of Strainburst Activities in Deep Tunnels at the Jinping II Hydropower Station, China. Rock Mech. Rock Eng. 49, 981–1000. doi:10.1007/s00603-015-0784-0
Yang, T. H., Zheng, C., Zhang, H. P., Yu, Q. L., Liu, H. L., Nan, S. Q., et al. (2013). Research on Dynamic Calibration Method of Rock Mass Strength of Mine Based on Microseismic Monitoring. J. Mining Saf. Eng. 30 (4), 548–554.
Yu, J., Ren, C., Cai, Y., Yao, W., and Liu, X. (2021a). Analytical Approach for Evaluating the Dynamic Self-Bearing Capacity of Tunnels. Int. J. Geomech. 21 (8), 04021133. doi:10.1061/(ASCE)GM.1943-5622.0002097
Yu, J., Yao, W., Duan, K., Liu, X., and Zhu, Y. (2020). Experimental Study and Discrete Element Method Modeling of Compression and Permeability Behaviors of Weakly Anisotropic Sandstones. Int. J. Rock Mech. Mining Sci. 134, 104437. doi:10.1016/j.ijrmms.2020.104437
Yu, J., Zhu, Y., Yao, W., Liu, X., Ren, C., Cai, Y., et al. (2021b). Stress Relaxation Behaviour of marble under Cyclic Weak Disturbance and Confining Pressures. Measurement 182, 109777. doi:10.1016/j.measurement.2021.109777
Yu, Q., Tang, C. A., Li, L. C., Li, H., and Cheng, G. W. (2014). Nucleation Process of Rockbursts Based on Microseismic Monitoring of Deep-Buried Tunnels for Jinping Ⅱ Hydropower Station. Chin. J. Geotechnical Eng. 36, 2315–2322. doi:10.11779/CJGE201412021
Zhang, C., Cui, G., Chen, X., Zhou, H., and Deng, L. (2020). Effects of Bolt Profile and Grout Mixture on Shearing Behaviors of Bolt-Grout Interface. J. Rock Mech. Geotechnical Eng. 12 (2), 242–255. doi:10.1016/j.jrmge.2019.10.004
Zhang, C., Feng, X., Zhou, H., Qiu, S., and Wu, W. (2012). A Top Pilot Tunnel Preconditioning Method for the Prevention of Extremely Intense Rockbursts in Deep Tunnels Excavated by TBMs. Rock Mech. Rock Eng. 45, 289–309. doi:10.1007/s00603-011-0199-5
Zhang, C., Liu, Z., Pan, Y., Gao, Y., Zhou, H., and Cui, G. (2020). Influence of Amygdale on Crack Evolution and Failure Behavior of basalt. Eng. Fracture Mech. 226, 106843. doi:10.1016/j.engfracmech.2019.106843
Zhao, X., and Li, Y. (2021). Estimation of Support Requirement for a Deep Shaft at the Xincheng Gold Mine, China. Bull. Eng. Geol. Environ. 80 (9), 6863–6876. doi:10.1007/s10064-021-02350-y
Keywords: rockburst, microseismic monitoring, microseismic activity characteristics, multivariate early warning, tunnel engineering
Citation: Yu Q, Zhao D, Xia Y, Jin S, Zheng J, Meng Q, Mu C and Zhao J (2022) Multivariate Early Warning Method for Rockburst Monitoring Based on Microseismic Activity Characteristics. Front. Earth Sci. 10:837333. doi: 10.3389/feart.2022.837333
Received: 16 December 2021; Accepted: 04 January 2022;
Published: 25 January 2022.
Edited by:
Xiaodong Fu, Institute of Rock and Soil Mechanics (CAS), ChinaReviewed by:
Guojian Cui, Institute of Rock and Soil Mechanics (CAS), ChinaXige Liu, Northeastern University, China
Copyright © 2022 Yu, Zhao, Xia, Jin, Zheng, Meng, Mu and Zhao. This is an open-access article distributed under the terms of the Creative Commons Attribution License (CC BY). The use, distribution or reproduction in other forums is permitted, provided the original author(s) and the copyright owner(s) are credited and that the original publication in this journal is cited, in accordance with accepted academic practice. No use, distribution or reproduction is permitted which does not comply with these terms.
*Correspondence: Yingjie Xia, eGlheWluZ2ppZUBkbHV0LmVkdS5jbg==