 Nan Yan1,2Desheng Jing1Songkui Sang1
 Xiaoyu Bai1,2*Xueying Liu3,4
 Mingyi Zhang1,2Yujin Jiao5Honghua Liu3,4Jun Yan6Zhongsheng Wang3,4
 Yongfeng Huang1
- 1School of Civil Engineering, Qingdao University of Technology, Qingdao, China
- 2Cooperative Innovation Center of Engineering Construction and Safety in Shandong Blue Economic Zone, Qingdao, China
- 3Qingdao Geo-Engineering Surveying Institute, Qingdao, China
- 4The Key Laboratory of Urban Geology and Underground Space Resources, Shandong Provincial Bureau of Geology and Mineral Resources, Qingdao, China
- 5Qingdao Metro Group Co., Ltd., Qingdao, China
- 6Shandong Province Nuclear Industry Geological Group 248, Qingdao, China
Underground excavation techniques are frequently used in subway stations during the construction of urban rail transit. The current study analyzes and investigates the surface settlement and deformation laws of large-span shallow buried underground excavated stations depending on a vast quantity of measured data from the Qingdao Metro Line 3. According to the comprehensive study, obtained results show that: 1) the excavation of pilot tunnels on both sides will result in the longitudinal settlement at the ground surface; however, the settlement will be quite minor, within −10 mm. During the excavation of the middle part of the pilot tunnel, large surface settlement may occur, and the settlement may reach −30 mm, while during the excavation of the lower soil and construction of the station structure, the surface settlement changes insignificantly, and some monitoring points show a sinking trend. 2) Data fitting reveals that regression analysis with a one variable cubic polynomial produces excellent fitting results. In addition, the analysis based on statistical methods reveals that the conditions of the surrounding rock are poor (Class that the arch, and the overall buried depth of the station is not larger than 10 m. 3) Since the surface settlement control standard for large-span boring tunnels is −60 mm, using −48 mm as the warning value is more reasonable. The test conducted in the current study has helped accumulate a large amount of ground settlement monitoring data, which can provide a particular reference for the subsequent design of similar lines.
Introduction
Subway stations are generally constructed at intersections with complex surrounding environments during the construction of urban rail transit, and some stations must be constructed underground according to circumstances such as road diversion and pipeline relocation (Colvile et al., 2004; Huang and Zhang, 2004; Jakimavičius, 2013). However, since subway stations are typically buried in shallow zones and in poor geological conditions, the underground excavation technique is prone to exhibit significant surface settlement, which can lead to rupture of the pipeline, collapse of the road/tunnel, and other issues (Prasad et al., 2011; Elshafie et al., 2013; Bai et al., 2021). A similar situation was experienced in the construction of the Qingdao subway; the surface layout of most underground stations exceeded the standard, which brought obstacles to construction and management and caused the construction period to be prolonged (Attewell et al., 1986; Peck, 2017).
In the current literature, there are numerous studies conducted by scientific researchers on the surface settlement deformation caused by tunnel excavation, and several more mature methods were developed, including the empirical formula method (Yang et al., 2019; Yang et al., 2021a), numerical simulation method (Zheng et al., 2019; Yang et al., 2020a; Yang et al., 2020b; Yang et al., 2021b), stochastic environment theory, and statistical analysis method. Zhang (Zhang, 2013) investigated the effect of varying step lengths on surface settlement using finite element modeling software. A comparison of the actual monitoring data revealed that excavation to ground surface subsidence influences significantly; smaller footage leads the smaller settlement. In addition, the steps method during the construction of the surface subsidence has mainly resulted in excavation steps with a total settlement of more than 90%. In another study, Zhang et al. (Zhang et al., 2012) reported that arch cover construction technology is particularly appropriate for large-span tunnel excavation in the “upper soft, lower hard” stratum. Total surface settlement can be effectively reduced if construction control measures are taken, and it is recommended to keep the left and right guide holes at 2.5 times the diameter. Meng et al. (Meng et al., 2012) compared and analyzed the surface settlement characteristics caused by large-span shallow buried tunnel construction by applying the Peck method and random medium theory. Zhou (Zhou, 2012) analyzed the field measured data and concluded that the final surface settlement was not directly related to the construction sequence, time and schedule, etc.; the geological conditions, construction method, and surrounding environment were the major parameters to determine the final settlement at the monitoring point. Xu (Liu et al., 2018), who combined the basic principle of the BP neural network with the field measured data to establish an analysis model, stated that geological conditions have a decisive role in surface deformation. In addition, they stated that the higher the level of the surrounding rocks, the greater the subsidence deformation, and the greater the influence of the surrounding rocks and groundwater level on surface subsidence deformation. In the study performed by Ji (Liu et al., 2015), the finite element analysis software ABAQUS was used to simulate the dynamic excavation process of the tunnel; it was concluded that the length of the open tunnel affected the displacement release rate of the surrounding rock, which can also reflect the stress release rate of the surrounding rock. Wang (Wei et al., 2017), who used finite element software and integrated it with actual monitoring data to conduct a comparative evaluation of Jiangxi Road Station’s surface settlement, stated that the cumulative surface settlement caused by the CRD method was greater than that caused by the double-wall guide pit method in the case of the cover-to-span ratio being less than 0.62.
Tunneling has a significant impact on the settlement; in the case of the monitoring point being 1.0–1.5 times the tunnel diameter from the tunnel surface, the tunnel excavation has a remarkable effect on the surface of some unexcavated sections, which can also be defined as early settlement. The early settlement can constitute 15–20% of the final cumulative settlement. The surface settlement rate increases dramatically as the excavation face advances, and the increment of cumulative settlement can reach 1–3 times the hole diameter from the measuring point behind the face. The section’s settlement amount constitutes about 50–60% of the final settlement value. In the case that the back distance of the excavation face is 3–5 times the hole diameter of the measuring point, the settlement rate decelerates; hence, the rate of increase in settlement variation reduces. In this stage, the settlement constitutes about 15–20% of the final cumulative settlement. After the excavation face progresses five times the hole diameter of the measuring point, the surface settlement exhibits slow increment. Thereby, the settlement curve tends to become smoother, which constitutes about 10% of the final cumulative settlement value.
In the studies presented above, the empirical formula method, stochastic media theory, and numerical simulation method are generally used; the numerical simulation method is the most used among all methods. Metro Line 3 is Qingdao’s first subway line, which may be utilized as a model and provides significant knowledge for subsequent line design, construction, and risk management. In the current study, relevant theoretical knowledge of tunnel construction, mathematical statistics, construction monitoring, and so on was used to analyze the surface deformation mechanism of an underground tunnel at first. Based on the existing monitoring data and relevant knowledge of mathematical statistics, the longitudinal surface subsidence deformation caused by the excavation of the long-span underground tunnel in Qingdao metro was summarized, and reasonable control indexes were analyzed.
Project Overview
Design Overview
The subway line 3 is the first rail transit line under construction in Qingdao, with a total length of about 25 km and 22 stations and one depot, as shown in Figure 1. Specific parameters are shown in Table 1. Seven stations were built through shallow buried excavation under the influence of road traffic and the surrounding environment. The general situation of the three stations that are the subject of the targeted research is shown in Table 2. The underground station is mainly located below the main road of the city; because of the heavy road traffic flow and numerous surrounding structures, the tunnel construction requirements are strict. Visuals of relevant rock drilling sampling to represent the geological structure of the region at various railway stations are shown in Figure 2.
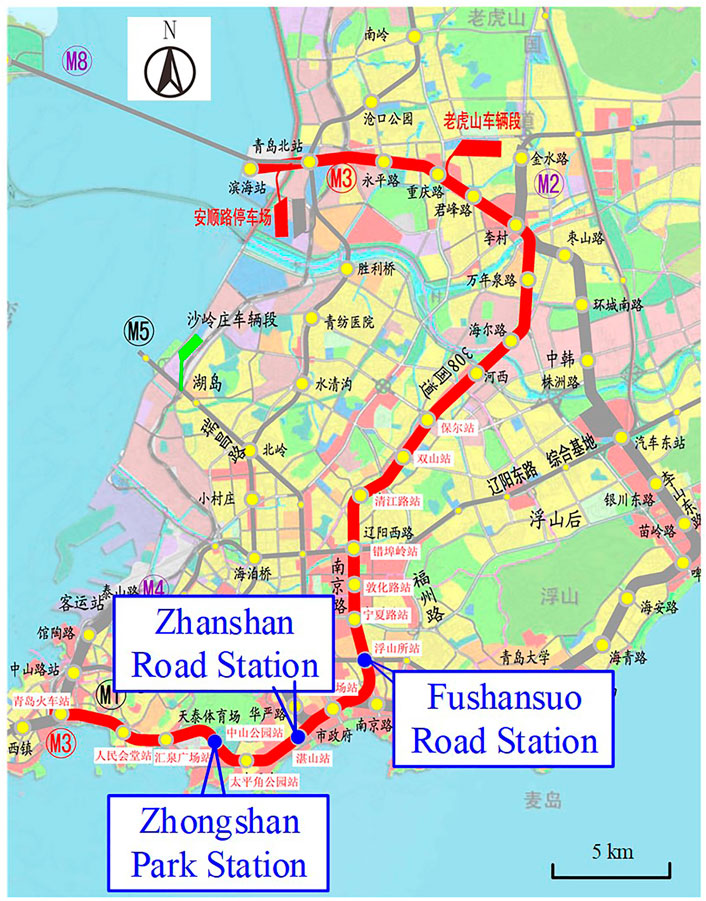
FIGURE 1. Route diagram of Metro Line 3.
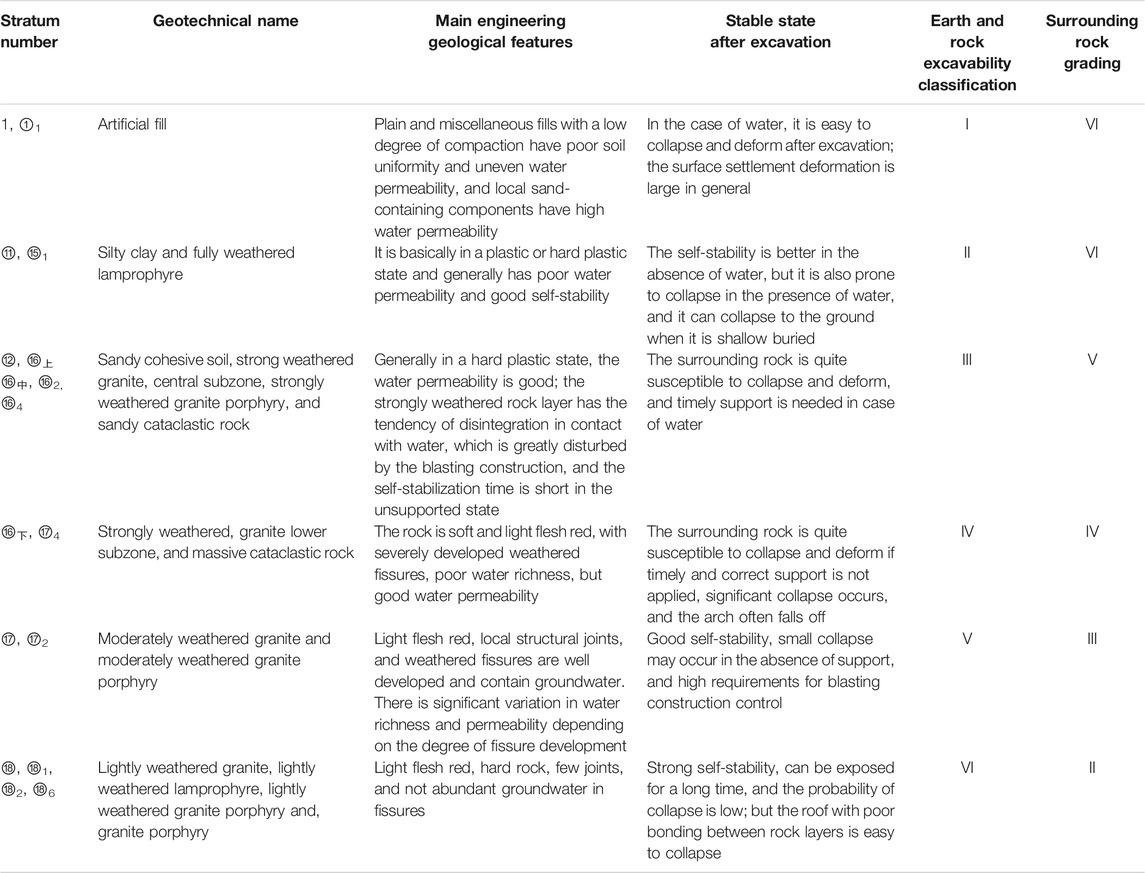
TABLE 1. Engineering geological parameters of the test site.
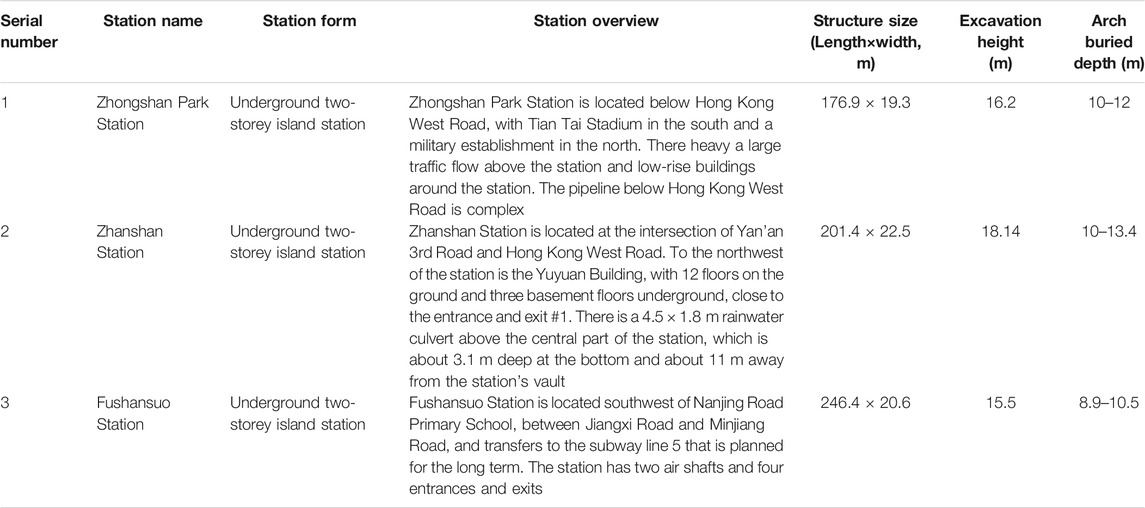
TABLE 2. Basic information table of each underground station.
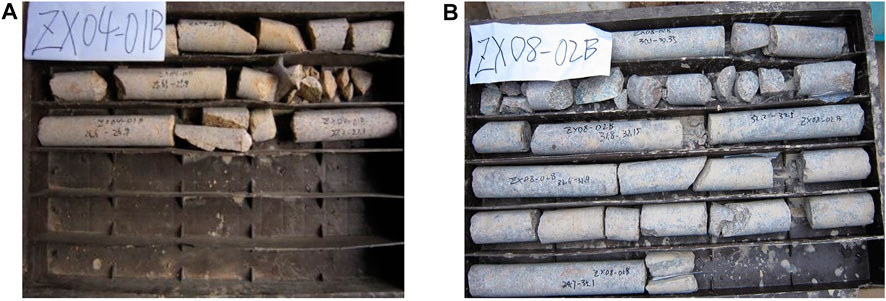
FIGURE 2. Rock drilling and sampling. (A) Zhongshan Park Station; (B) Fushansuo Road Station.
Engineering Geological Overview
According to the engineering geological survey data of each underground excavation station of subway line 3, the overburden of the station mainly constitutes an artificially filled soil layer, clay layer, and weathered rock layer, while the main penetrating rock layer of the station is mainly strong, medium, and breeze granite; granite porphyry; and lamprophyre in some parts. Considering the engineering properties of various kinds of rocks and soil, the geological conditions of each underground excavation station have typical characteristics of “soft on the top and hard on the bottom”, which are manifested explicitly as soft soil above the arch, with properties as increased water seepage, significant disturbance of blasting and excavation, and easy instability in the absence of support. The station’s main body has excellent geological characteristics, and the surrounding rock grade is typically Class III to IV, which necessitates blasting and excavation, and it takes a long time to stabilize after excavation. The soil profile and topology to present are shown in Figure 3.
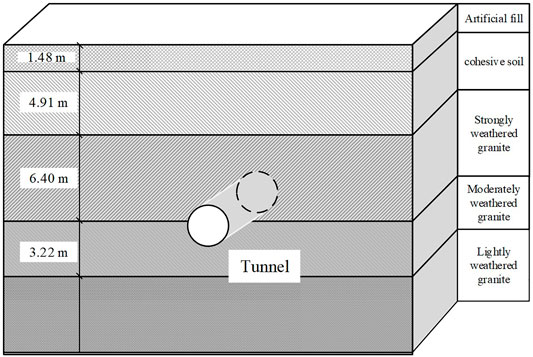
FIGURE 3. Soil profile and topology to present.
Hydrogeology Overview
According to the different occurrence medium and burial conditions, the groundwater in the related area can be divided into quaternary pore water, weathered fissure water, and structural fissure water. Quaternary pore water is present primarily in the sand layer and is significantly influenced by atmospheric precipitation. Weathered fissure water is present primarily in weathered rock and is distributed in a layer-like pattern in the relatively low-lying terrain. Generally, it is replenished by atmospheric precipitation and overlying pore water. The tectonic fissure water mainly occurs in the tectonic belt on both sides of the fault zone and the intrusive dike positioned behind. Moreover, it is replenished primarily by atmospheric precipitation and weathered fissure water, and the local water volume is relatively large. The overall hydrogeological conditions in each station site are reasonable as per the detailed examination of the construction process and geological exploration data; however, water seepage persisted on the palm and first branch surface after excavation. If preventive treatment is not applied in time or in place, it will not be conducive to controlling the upper stratum settlement.
Main Construction Methods of Long-Span Underground Tunnels
Increment in the excavation section size gradually causes increment in construction difficulty; thus, the available construction methods become insufficient in such cases. In the current state, the main excavation methods of long-span underground tunnels in China consist of the full-section method, step method, double-wall pit guide method, CRD method, arch cover method, etc. (Sharifzadeh et al., 2013). In the metro, which is the subject of the present study, the selection of the wide span underground tunnel construction method was carried out entirely by utilizing the experiences of other regions, and each construction method was combined according to the specific characteristics of each station to take full advantage of the benefits of each method (as presented in Table 3).
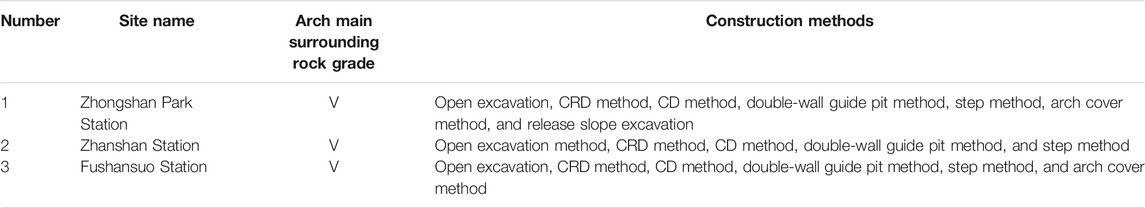
TABLE 3. Main construction methods of underground excavation station of subway line 3.
Monitoring and Data Analysis
Construction monitoring should be undertaken throughout the construction process of urban rail transit engineering, according to the technical specification for Urban Rail Transit Engineering Monitoring (GB50911-2013) (Ministry of Housing and Urban-Rural Development, 2013). Throughout subway construction, the construction unit selects the construction party’s monitoring unit to monitor the main body of the tunnel and the surrounding environment in accordance with the design criteria; in addition, the construction unit selects the third-party monitoring unit as a complement to the construction party’s monitoring through bidding. Examining the surface settlement monitoring data, which is an important monitoring element in tunnel construction, can provide some reference for relevant investigations of the long-span underground tunnel.
Monitoring Method
The majority of the surface settlement monitoring methods adopts precision leveling measurement (Touhei et al., 2013; Shen et al., 2021; Zhang et al., 2021). The Topcon GM-52 high-precision total station instrument is used in this monitoring process. All data are automatically read by the total station, which greatly improves the accuracy of data. The standard reference point is determined by choosing a fixed point. Then, its height is measured (H), monitoring is performed by measuring the elevation difference (ΔH) between the base and of the monitoring, and then the actual height of the monitoring (ΔHt) is calculated. At last, the site of the sedimentation value change (ΔH) is determined based on comparison with the last measured elevation. Calculations are performed by the presented equation as follows:
Monitoring Distribution Points
Surface settlement evaluation is vital for tunnel excavation and can directly reflect the soil change above the tunnel. Since direct drilling and coring on the road surface for point distribution is difficult to accomplish and is frequently subject to artificial damage, the distribution point of the surface settlement this time is mainly to directly drive the spike into the road surface as the monitoring point. The locations where the local circumstances are met and the locations with higher risks should be cored in accordance with the specification requirements.
Consequently, the measuring points of tunnel surface settlement were arranged before the tunnel face reached the monitoring section with a diameter of 3–5 times. The longitudinal spacing of surface settlement in the underground excavation stations was 10–20 m, with a row of local encryption points of 5 m; in addition, the transverse distance was 2–5 m, and the middle line was encrypted. In this monitoring process, the monitoring period of all monitoring points was 24 h. In principle, the monitoring range on both sides of the middle line should not be less than H0+B (H0 is the buried depth of the tunnel, and B is the width of the tunnel). In case the ground conditions are limited, the monitoring range can be appropriately reduced; however, the measuring range should be broadened appropriately in the presence of controlled structures on the surface. However, the ground environment often affects the distribution points mainly concentrated directly above the main body, and the two sides extend slightly outward.
Monitoring Data Analysis Methods
Analysis methods for monitoring data can be listed as statistical analysis, finite element, boundary element, and reverse analysis methods, etc., in general (Liu et al., 2019; Elbaz et al., 2020). The nonlinear regression analysis was used in the current study for the statistical analysis method to analyze the law of surface subsidence deformation.
If the relationship between two variables is not linear, then the relationship between them is called nonlinear, that is, to nonlinear regression analysis. The primary strategy for nonlinear regression problems is to first transform the variables into linear regression and then cope with them using the linear regression method. Nonlinear regression analysis techniques typically used in monitoring data processing include numerous unary equations, exponential functions, logarithmic functions, hyperbolic functions, etc.
Law of Longitudinal Surface Settlement
Entire Process Surface Settlement Analysis
According to the on-site construction process, the monitoring distribution points and data change curves of each monitoring point, 2–3 monitoring sections from each station, and 2–6 representative measuring points of each monitoring section were selected to plot the whole process. Afterward, the obtained process change curve and a total of 25 surface settlement change curves were summed. Figure 4 shows the surface subsidence change curve of Zhongshan Park Station.
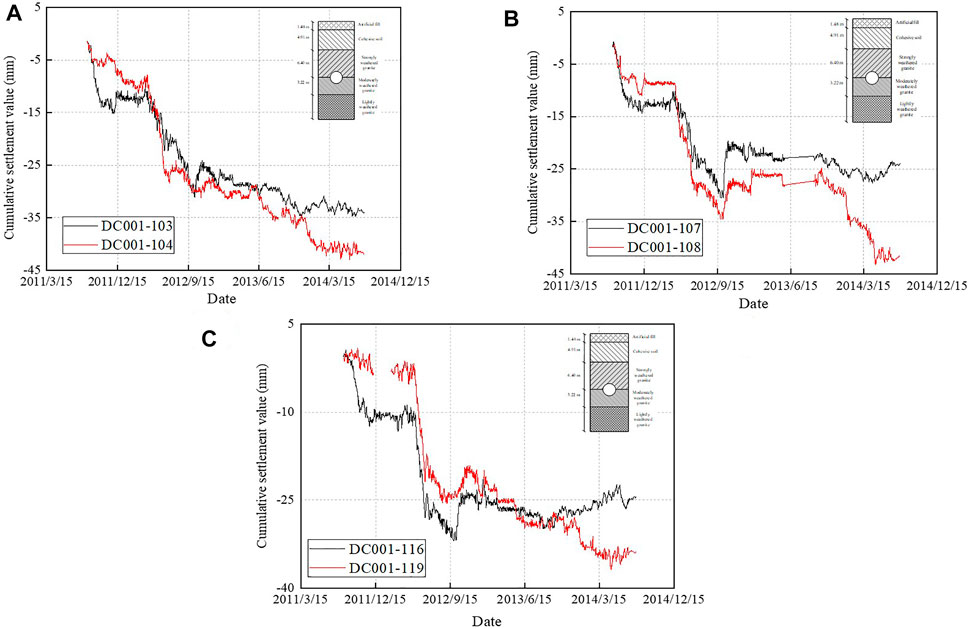
FIGURE 4. Settlement change curve of Zhongshan Park Station. (A) DC001-103, DC001-104; (B) DC001-107, DC001-108; (C) DC001-116, DC001-119.
It has been observed in Figure 4 that the entire process change curve of the surface settlement monitoring point was consistent, and the obtained curve change can be divided into four stages according to the different curvatures of the curve change. In the first stage, from the beginning of the monitoring until mid-April 2012, the curve first decreased significantly and then gradually changed. The cumulative settlement was between −5 and 15 mm, and the variation was 5–15 mm. The corresponding construction stage to the mentioned value was the excavation of the upper and left guide holes on both sides. In the second stage, from the middle of April 2012 to the middle of October 2012, the curve settlement changed significantly, with the cumulative settlement between −25 and 35 mm and the variation between 10 and 25 mm. The cumulative settlement value of some monitoring points in this stage exceeded 30 mm, and the minimum exceeded 20 mm. The construction process corresponding to mentioned values was in excavating the upper–middle guide hole and manual digging pile. In the third stage, from mid-October 2012 to mid-October 2013, the settlement changes of all measuring points were generally flat on the whole, without obvious fluctuations. The accumulated settlement was fundamentally the same as that at the end of the second stage, and the change was approximately 5 mm. However, at the beginning of this stage, an obvious uplift was observed. Compared with the on-site construction process, it was found that the arch grouting reinforcement was carried out in this stage, followed by the arch second lining construction, which lasted for about one year. In the fourth stage, from mid-October 2013 to August 2014, the change curve of all measuring points fluctuated to some extent, yet the law was quite different. In addition, some measuring points showed minor settlement, while some measuring points showed slight uplift or remained unchanged. Through in-depth comparison, it is found that the measuring points with slight uplift or unchanged in this stage were located outside the main body’s edge line, however, quite close to the edge line, while the points with settlement were found inside the main body’s edge line. The analysis showed that the settlement trend within the edge line was average during the middle and lower part of the main body excavation and secondary lining construction. The edge line position was not significantly changed due to the internal support of the pile body and beam. The corresponding construction process of this stage was the earthwork excavation and structure construction of the middle and lower part of the main body. Figure 5 shows the whole process change curve of Zhanshan Station surface subsidence.
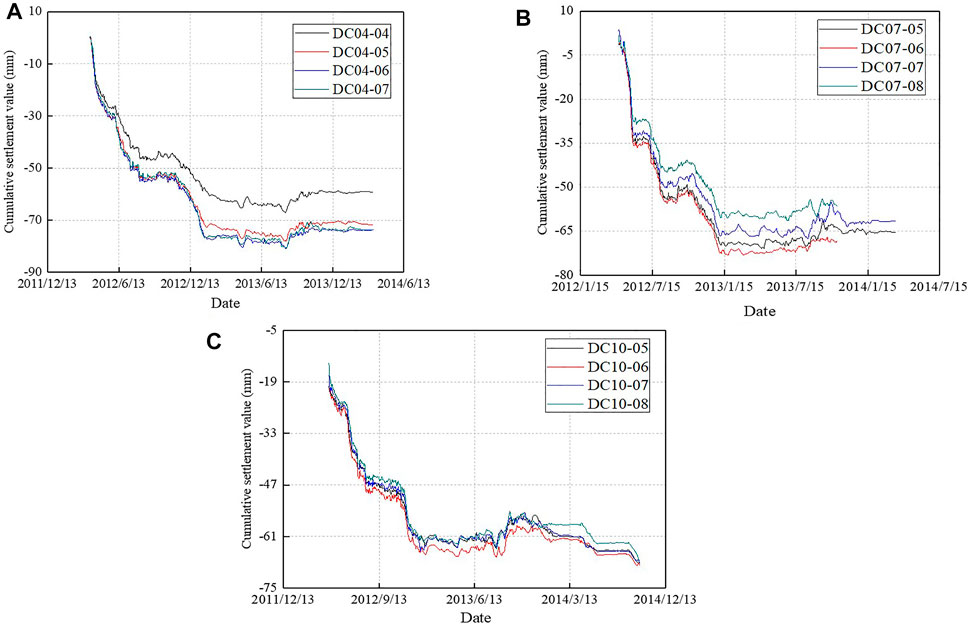
FIGURE 5. Settlement change curve of Zhanshan Road Station. (A) DC04-04‐DC04-07; (B) DC07-05‐DC07-08; (C) DC10-05‐DC10-08.
According to the monitoring section of DC04-04–DC04-07, from the beginning of the first stage to the early April of 2012, the variation trend of the surface settlement was obvious. Nevertheless, the accumulated seating value did not exceed the standard and also 20 mm. The corresponding construction stage was the excavation of the guide hole on both sides of the upper part. In the second stage, from early April to early June 2012, it continued to sink; however, the change rate was significantly slower than that in the first stage, and the accumulated settlement reached about −30 mm. The corresponding construction stage was the excavation of the front palm face, which exceeded 40 m by June, and connecting the upper guide holes on both sides. In the third stage, from early June 2012 to early August 2012, the surface subsidence deformation trend increased again, and the cumulative surface subsidence value reached between −45 and 55 mm. The corresponding construction stage was the guide hole excavation on both sides of the central part. In the fourth stage, from August 2012 to early January 2013, the surface settlement experienced the third significant settlement change, and the cumulative settlement value reached −60–75 mm. The corresponding construction stage was the excavation of the lower two sides guide hole and the upper–middle guide hole. In the fifth stage, from early January 2013 to late February 2014, the change of surface settlement was generally flat, but slight uplift was caused by grouting reinforcement. The corresponding construction stage was mainly secondary construction. Similarly, the monitoring sections of DC07-05–DC07-08 and DC10-05–DC10-08 can be basically divided into five stages. Figure 6 shows the whole process change curve of Fushansuo Station surface subsidence.
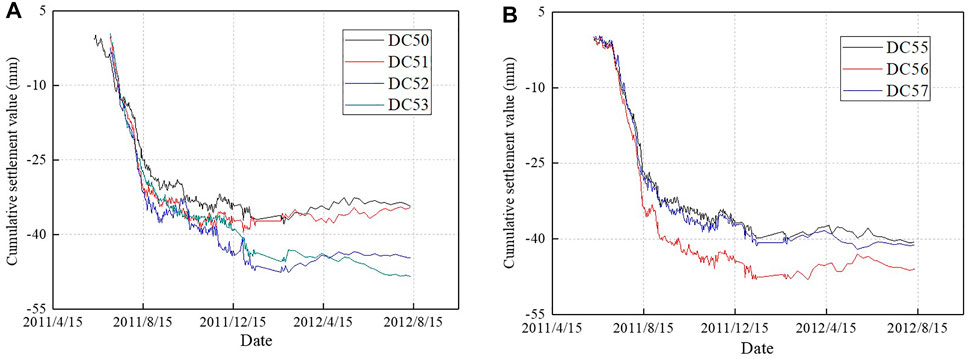
FIGURE 6. Settlement change curve of Fushansuo Road Station. (A) DC50∼DC53; (B) DC55∼DC57.
According to the change curve of Fushansuo Station, the change process of surface subsidence can be divided into four stages. In the first stage, from the beginning to the end of June 2011, there was a small amount of settlement in the monitoring data of this stage, but the cumulative settlement was small, with a maximum between −5 and 10 mm. The corresponding construction stage was the excavation of both sides of the guide hole. In the second stage, from late June to mid-August 2011, the settlement changed significantly, and the accumulated settlement reached −30–40 mm. The corresponding construction stage was the middle guide hole excavation. In the third stage, from mid-August 2011 to early January 2012, the surface continued to sink; however, the trend was slow. The cumulative settlement was between −35 and 50 mm, and the cumulative change was basically within 10 mm, lasting for more than 4 months. The corresponding construction stage did not include any construction phase under the monitored section. The fourth stage was from early January 2012 to August 2012. The monitoring data changed steadily without significant fluctuations in this stage, and the accumulated settlement remained unchanged. The corresponding construction stage was the middle and lower guide hole excavation. Owing to the stable change of monitoring data in the later period, no continuous monitoring was performed during the construction of the main structure.
Fitting Analysis of Surface Settlement Change Curve
Zhongshan Park Station
Based on the experiences of underground tunnel construction in the past, it can be said that tunnel collapse and surrounding environment accidents occurred primarily in the excavation of the upper part of the main body. In the construction of the Qingdao metro underground station, it has been noted that local collapse, leakage of pipelines, excessive ground settlement, and other accidents often occurred in the excavation of the upper guide hole of the station main body. Consequently, it is necessary to strengthen the construction control of the upper guide hole. In the current research, surface settlement change curves during upper or middle Earth excavation were analyzed in depth, and curve fitting was performed with the help of OriginPro software.
The construction progress of Zhongshan Park Station can be divided into Phases I and II. Based on the monitoring values and curves of Phase I of Zhongshan Park Station (Table 4; Figure 4), the results fitted by OriginPro software are shown in Figure 7.
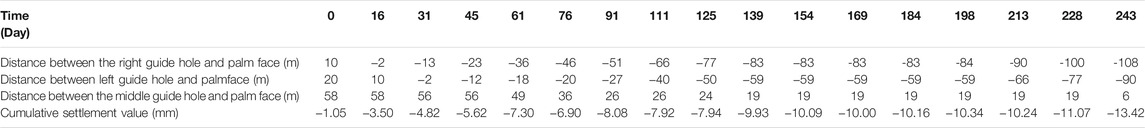
TABLE 4. Comparison of construction progress and monitoring data of Zhongshan Park Station.
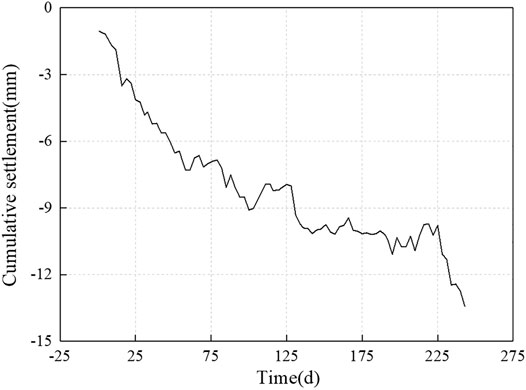
FIGURE 7. Data change curve in the first stage.
According to the relationship between the data change curve and construction progress, before the pilot face of the left and right lines went down through the monitoring points, the data tended to sink (it can be seen from Table 3 and Figure 8). Still, the accumulated settlement was small, at about 5 mm. After the left and right guide holes passed through the measuring points, the surface continued to sink. It was not until the left guide hole passed through the monitoring points for nearly 60 m, that was until the data changes became stable after the tunnel diameter was more than three times (tunnel span is 20 m), and the tunnel depth was six times. In the meantime, the cumulative surface settlement was −10.09 mm. When the horizontal distance between the pilot face of the middle guide hole and monitoring point was less than 10 m, the settlement trend of the monitoring point started to increase again and entered the second stage. According to the monitoring data in Table 4, scatter plots are drawn, and curve fitting is carried out, as shown in Figure 9.
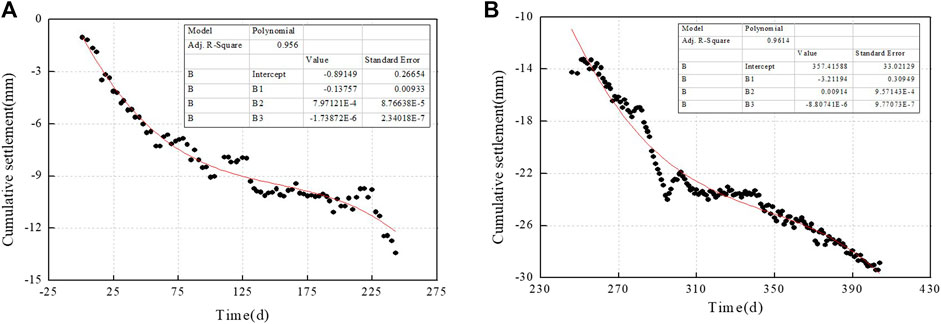
FIGURE 8. Data change curve fitting diagram. (A) phases I; (B) phases II.
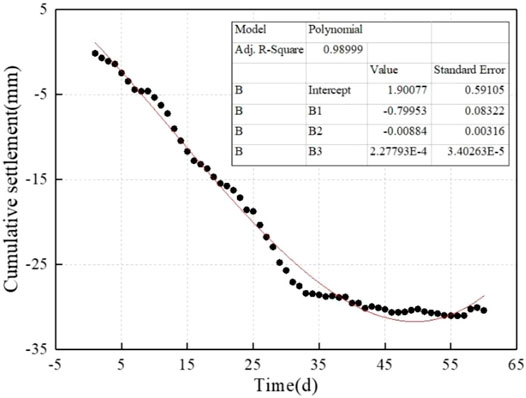
FIGURE 9. Data change curve fitting diagram of the first stage.
The fitting formula was obtained as
According to the first stage data processing method, the second stage monitoring data of the monitoring point were fitted and analyzed, and the curve is shown in Figure 7.
The fitting formula was obtained as
Zhanshan Station
According to the construction schedule, the Zhanshan Station can be divided into two phases (Phases I and II). Based on the monitoring values of Phase I (Table 5), the results fitted by OriginPro software are shown in Figure 8.
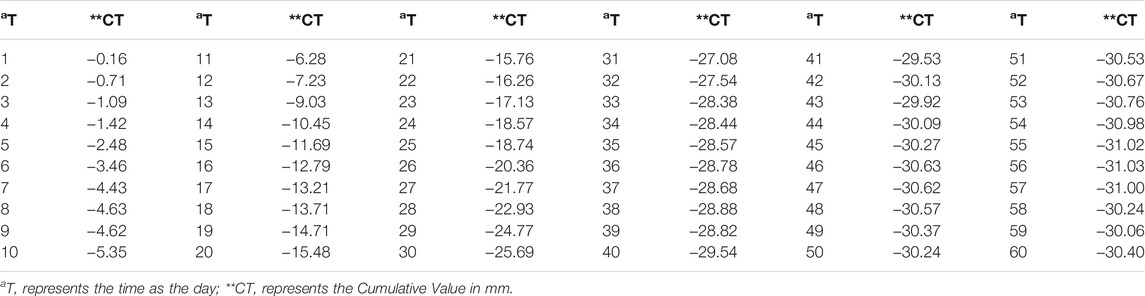
TABLE 5. The first stage monitoring values of a measuring point in Zhanshan Station.
The fitting formula was obtained as
According to the first stage data processing method, the second stage monitoring data of the monitoring point (Table 6) were fitted and analyzed. The curve is shown in Figure 10.
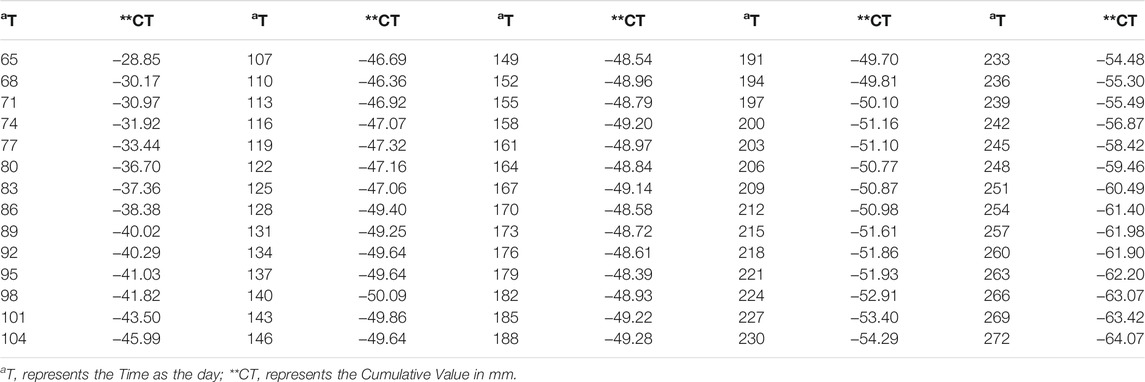
TABLE 6. Second-stage monitoring values of a measuring point in Zhanshan Station.
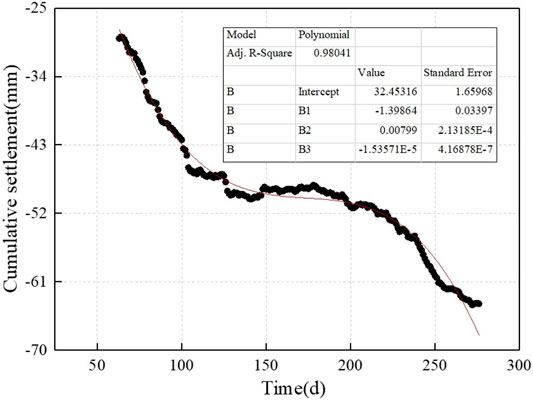
FIGURE 10. Data change curve fitting diagram of the second stage.
The fitting formula was obtained as
Fushansuo Station
Based on the monitoring values of the Fushansuo station (Table 7), the results of an OriginPro software fitting are presented in Figure 11.
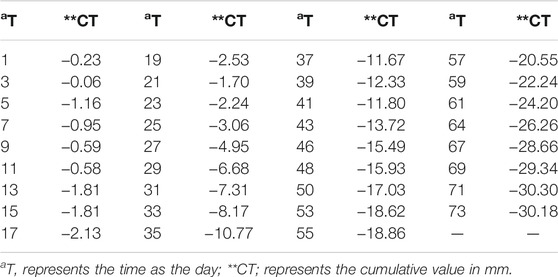
TABLE 7. The monitoring values of a measuring point in Fushansuo Station.
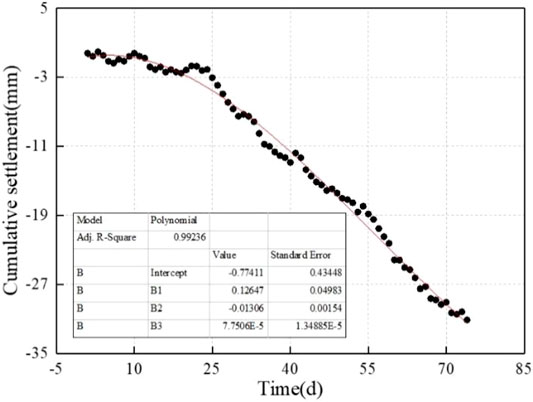
FIGURE 11. Data change curve fitting diagram.
The fitting formula was obtained as
Analysis of Surface Settlement Control Standards
The control standard of surface subsidence caused by urban subway tunnel excavation has been a hot research topic in recent years. The surface settlement caused by tunnel excavation is affected by geological conditions, tunnel burial depth, construction method, support parameters, and other factors, so it is difficult to describe the settlement’s changing process and final deformation value accurately. Despite this, a huge number of engineering practices and scientific investigations reveal that the surface subsidence deformation caused by tunnel excavation is regular. Through statistical analysis of a huge number of measured data, a more reasonable surface subsidence control standard value can be obtained to guide other line tunnel excavation processes.
Data selection should first assure data consistency and, in general, comply with the actual construction process on-site. Due to the failure of some station monitoring to be carried on continuously after the end of the excavation and based on previous construction experience, the overall settlement amount between the end of excavation and construction is generally minor. Furthermore, the impact on the structure itself and the surrounding environment is much reduced compared to the excavation stage. Therefore, the current study on the cumulative settlement control index mainly focused on the surface cumulative settlement control value after the excavation.
243 effective surface settlement measuring points in each station were selected. Statistical analysis showed that the maximum settlement value was −81.11 mm, the minimum settlement value was −1.46 mm, and the mean value was −36.06 mm. The specific data are presented in Table 8.

TABLE 8. Statistics of surface settlement data.
In the current situation, the surface subsidence control standards adopted by Qingdao metro long-span underground excavation stations are mostly based on −30 mm. In this study, the measurement points with settlements exceeding 30 mm accounted for more than 61%, and no evident damage occurred to the road surface and underground pipelines throughout the construction process. The area around the monitoring point where the cumulative settlement value reached −81.11 mm did not appear abnormal, and the site was generally safe and controllable. This implies that the control value of cumulative surface settlement set at −30 mm is too conservative, causing a lot of hassles for site construction, management, and wasting additional resources. Therefore, it is necessary to adjust the control index.
The proportion of surface settlement between −10 and 60 mm reached 81%, as shown in Table 8, and the number of surface settlement points in each section was not significantly different. The measurement points above −60.00 mm constituted for a relatively small percentage, only 10%. According to the abovementioned analysis, the arch of the surrounding rock conditions was poor (V, VI level), and the overall station depth under the condition was lesser than 10 m. The ground settlement after the end of the large-span underground tunnel excavation stability with −60 mm was more reasonable according to the final settlement control standard. The warning value was 80% of the final settlement value with −48 mm.
It was found that utilizing a cubic polynomial of one variable improved the fitting impact of the surface settlement deformation curves of each station during earthwork excavation, and the correlation coefficient was essentially above 0.95. The cubic polynomial of one variable was relatively simple compared to other functions, and the calculation was rapid. However, the formula coefficients derived from the curve fitting of each station’s surface settlement change were quite different. Therefore, the surface settlement change curve during the excavation of large-span underground tunnels was impacted by a variety of factors, and only a certain analysis and judgment can be made from the overall change law.
Conclusion
1) The data changes of each underground station were analyzed by comparing the surface subsidence curve of each station. Surface settlement occurred when excavation took place on either side of the guide hole, but the overall settlement was relatively small, basically within 10 mm of the foundation. The large surface settlement will occur during the middle or middle guide hole excavation. The larger settlement potentially can reach over 30 mm depending on geological conditions. The change in the surface settlement was not evident throughout the excavation of the lower soil and building of the station structure, and some sites had a certain subsiding tendency owing to the effect of geological circumstances.
2) The surface settlement variation throughout the excavation of the station’s main body was analyzed via fitting. It was revealed through data fitting that regression analysis utilizing a cubic polynomial of one degree could be advantageous for a superior fitting effect; however, the parameters of the findings were significantly different. Therefore, only through the overall change law can we analyze and guide other excavation station construction.
3) For the arch with surrounded weak rock (V, VI level), the overall depth was lower than 10 m, large-span underground running tunnel surface subsidence control standards used to 60 mm, and warning value of—48 mm was more reasonable. For station arches with surrounded relatively better rock (IV level and below), it was more acceptable to be performed as per the specification and design documents.
4) According to fitting data analysis, the surface settlement changes per underground station were still incredibly diverse, which may be attributed to geological conditions and environmental variables. Therefore, in case of increasing data volume, it is necessary to summarize the surface settlement rules of other stations comprehensively to obtain directions with a broader range of adaptability.
Data Availability Statement
The original contributions presented in the study are included in the article/Supplementary Material; further inquiries can be directed to the corresponding author.
Author Contributions
NY wrote the manuscript; DJ and SS prepared the test; XB and MZ designed the test process and ideas; XL and HL typeset the manuscript; YJ and JY provided technical support; and ZW and YH plotted the graph.
Funding
This research was financially supported by the Key Program of Natural Science Foundation of Shandong Province (ZR2020KE009); the National Natural Science Foundation of China (51708316 and 51778312), the China Postdoctoral Science Foundation Funding (2018M632641); the Shandong Key Research and Development Program (2017GSF16107 and 2018GSF11700), the Shandong Provincial Postdoctoral Innovation Program of China (201903043), Higher Educational Science and Technology Program of Shandong Province (J16LG02), and Qingdao Postdoctoral Applied Research Program (2018101).
Conflict of Interest
YJ was employed by Qingdao Metro Group Co., Ltd.
The remaining authors declare that the research was conducted in the absence of any commercial or financial relationships that could be construed as a potential conflict of interest.
Publisher’s Note
All claims expressed in this article are solely those of the authors and do not necessarily represent those of their affiliated organizations, or those of the publisher, the editors, and the reviewers. Any product that may be evaluated in this article, or claim that may be made by its manufacturer, is not guaranteed or endorsed by the publisher.
References
Attewell, P. B., Yeates, J., and Selby, A. R. (1986). Soil Movements Induced by Tunnelling and Their Effects on Pipelines and Structures[J]. Tunnelling Underground Space Tech. 2, 102.
Bai, X., Ma, J., Liu, J., Zhang, M., Yan, N., and Wang, Y. (2021). Field Experimental Investigation on Filling the Soda Residue Soil With Liquid Soda Residue and Liquid Fly Ash[J]. Int. J. Damage Mech. 30 (4), 502–517. doi:10.1177/1056789520950424
Colvile, R. N., Kaur, S., Britter, R., Robins, A., Bell, M. C., Shallcross, D., et al. (2004). Sustainable Development of Urban Transport Systems and Human Exposure to Air Pollution. Sci. Total Environ. 334-335 (1), 481–487. doi:10.1016/j.scitotenv.2004.04.052
Elbaz, K., Shen, S. L., Zhou, A. N., Yin, Z. Y., and Lyue, H. M. (2020). Prediction of Disc Cutter Life during Shield Tunneling with AI via the Incorporation of a Genetic Algorithm into a GMDH-type Neural Network[J]. Engineering 7 (2), 238–251. doi:10.1016/j.eng.2020.02.016
Elshafie, M. Z. E. B., Choy, C. K., and Mair, R. (2013). Centrifuge Modeling of Deep Excavations and Their Interaction with Adjacent Buildings[J]. Geotechnical Test. J. 36, 20120209. doi:10.1520/GTJ20120209
Huang, J., and Zhang, D. (2004). Analysis of Large Deformation Regularity of Overlying Strata in Underground Tunnel [J]. Rock Soil Mech. 25 (8), 1288–1301. doi:10.1155/2020/8826337
Jakimavičius, M. (2013). Multi-criteria Assessment of Urban Areas Transport Systems Development According to Sustainability[J]. IEEE Trans. Edu. 56 (1), 9–17.
Liu, X., Han, G., Wang, E., Wang, S., and Nawnit, K. (2018). Multiscale Hierarchical Analysis of Rock Mass and Prediction of its Mechanical and Hydraulic Properties. J. Rock Mech. Geotechnical Eng. 10, 694–702. doi:10.1016/j.jrmge.2018.04.003
Liu, X., Wang, F., Huang, J., Wang, S., Zhang, Z., and Nawnit, K. (2019). Grout Diffusion in Silty fine Sand Stratum with High Groundwater Level for Tunnel Construction. Tunnelling Underground Space Tech. 93, 103051. doi:10.1016/j.tust.2019.103051
Liu, X., Wang, S., Wang, S., and Wang, E. (2015). Fluid-driven Fractures in Granular Materials. Bull. Eng. Geol. Environ. 74, 621–636. doi:10.1007/s10064-014-0712-7
Meng, D., Zang, X., Yu, G., and Yuan, C. (2012). Comparative Study on Analysis Methods of Ground Subsidence Caused by Subway Station Excavation[J]. J. Rock Mech. Eng. 31 (6), 1169–1177.
Ministry of Housing and Urban-Rural Development (2013). GB 50911-2013 Technical Specifications for Urban Rail Transit Project Monitoring. Beijing: China Building Industry Press.
Peck, R. B. “Deep Excavations and Tunneling in Soft Ground, State of theArt Report. Proe,” in 7th Int. Conf. On soil Mechanics and Foundation September 2017 (Mexico city: International Society for Soil Mechanics and Geotechnical Engineering), 225–290.
Prasad, G. D., Freeman, C. F., and Klajnerman, D. (2011). Deep Excavations for the Manufacturers Life Centre, Toronto[J]. Can. Geotechnical J. 9 (2), 137–144. doi:10.1139/t72-015
Sharifzadeh, M., Kolivand, F., Ghorbani, M., and Yasrobi, S. (2013). Design of Sequential Excavation Method for Large Span Urban Tunnels in Soft Ground - Niayesh Tunnel. Tunnelling Underground Space Tech. 35, 178–188. doi:10.1016/j.tust.2013.01.002
Shen, S.-L., Lyu, H.-M., Zhou, A., Lu, L.-H., Li, G., and Hu, B.-B. (2021). Automatic Control of Groundwater Balance to Combat Dewatering during Construction of a Metro System. Automation in Construction 123, 103536. doi:10.1016/j.autcon.2020.103536
Touhei, T., Hinago, T., and Fukushiro, Y. (2013). Inverse Scattering Analysis of Elastic Half Space by Means of the Fast Volume Integral Equation Method[J]. Eng. Anal. Boundary Elem. 50, 111–119. doi:10.2495/BE100101
Wei, X., Liu, X., Duan, Y., and Feng, J. (2017). Property Transformation of a Modified Sulfoaluminate Grouting Material under Pressure Circulation for a Water-Sealed Underground Oil Cavern. Construction Building Mater. 140, 210–220. doi:10.1016/j.conbuildmat.2017.02.137
Yang, Y. T., Sun, G. H., and Zheng, H. (2019). Investigation of the Sequential Excavation of a Soil-Rock-Mixture Slope Using the Numerical Manifold Method. Eng. Geol. 256, 93–109.
Yang, Y. T., Sun, G. H., Zheng, H., and Yan, C. Z. (2020a). An Improved Numerical Manifold Method with Multiple Layers of Mathematical Cover Systems for the Stability Analysis of Soil-Rock-Mixture Slopes. Eng. Geol. 264, 105373.
Yang, Y. T., Xu, D. D., Liu, F., and Zheng, H. (2020b). Modeling the Entire Progressive Failure Process of Rock Slopes Using a Strength-Based Criterion. Comput. Geotech. 126, 103726.
Yang, Y. T., Xia, Y., Zheng, H., and Liu, Z. J. (2021a). Investigation of Rock Slope Stability Using a 3D Nonlinear Strength-Reduction Numerical Manifold Method. Eng. Geol. 292, 106285.
Yang, Y. T., Wu, W. A., and Zheng, H. (2021b). Stability Analysis of Slopes Using the Vector Sum Numerical Manifold Method. Bull. Eng. Geol. Environ. 80, 345–352.
Zhang, G., Du, Z., Song, J., and Zheng, H. (2012). Monitoring Analysis and Control Countermeasures for Construction Settlement of Subway Station by Arch Cover Method[J]. J. rock Mech. Eng. 31 (S1), 3413–3420. doi:10.1016/j.tust.2020.103326
Zhang, N., zhou, A., pan, Y., and Shen, S.-L. (2021). Measurement and Prediction of Tunnelling-Induced Ground Settlement in Karst Region by Using Expanding Deep Learning Method. Measurement 183, 109700. doi:10.1016/j.measurement.2021.109700
Zhang, P. (2013). Analysis of Influencing Factors of Tunnel Excavation Surface Settlement[J]. Henan Sci. Tech. 11 (6), 141–142. doi:10.1155/2021/5573372
Zheng, H., Yang, Y. T., and Shi, G. H. (2019). Reformulation of Dynamic Crack Propagation Using the Numerical Manifold Method. Eng. Anal. Bound. Elem. 105, 279–295.
Keywords: subway tunnel, shallow buried excavation, surface settlement, settlement law, fitting analysis
Citation: Yan N, Jing D, Sang S, Bai X, Liu X, Zhang M, Jiao Y, Liu H, Yan J, Wang Z and Huang Y (2022) An Investigation on Longitudinal Surface Subsidence Deformation of Large-Span Undercut Metro Tunnel. Front. Earth Sci. 10:839242. doi: 10.3389/feart.2022.839242
Received: 19 December 2021; Accepted: 17 February 2022;
Published: 23 March 2022.
Edited by:
Yongtao Yang, Institute of Rock and Soil Mechanics (CAS), ChinaReviewed by:
Fanzhen Meng, Qingdao University of Technology, ChinaTao Liu, Ocean University of China, China
Copyright © 2022 Yan, Jing, Sang, Bai, Liu, Zhang, Jiao, Liu, Yan, Wang and Huang. This is an open-access article distributed under the terms of the Creative Commons Attribution License (CC BY). The use, distribution or reproduction in other forums is permitted, provided the original author(s) and the copyright owner(s) are credited and that the original publication in this journal is cited, in accordance with accepted academic practice. No use, distribution or reproduction is permitted which does not comply with these terms.
*Correspondence: Xiaoyu Bai, YmFpeGlhb3l1NTM4QDE2My5jb20=