 Pengpeng Zhang
 Lin Chen
 Wenjiao Xiao
 Ji’en Zhang
- 1State Key Laboratory of Lithospheric Evolution, Institute of Geology and Geophysics, Chinese Academy of Sciences, Beijing, China
- 2Institute of Geology and Planetary Sciences, University of Chinese Academy of Sciences, Beijing, China
- 3Xinjiang Research Center for Mineral Resources, Xinjiang Institute of Ecology and Geography, Chinese Academy of Sciences, Urumqi, China
A number of basins have developed in Tibet since the early stages of the India–Asia collision, and now, they have become integral parts of the Tibetan Plateau. Geophysical and geochemical data reveal that these basins are currently characterized either by strong or weak basements. However, it remains unclear how these hinterland basins evolved during the India–Asia collision and how they affected the post-collisional growth of the Tibetan Plateau. Here, we use 3D thermo-mechanical simulations to investigate the topographic response of a strength-varying hinterland basin imbedded in an orogenic plateau under the horizontal compression condition. Our results show that a strong hinterland basin experiences little deformation and develops into a lowland with respect to the surrounding plateau at the early stages of the collision. The lowland gradually shrinks and survives in the interior of the plateau for ∼30–40 Myr before merging into the plateau. In contrast, a weak hinterland basin uplifts soon after the initial collision and develops into a highland after ∼20 Myr of convergence. Topographic analysis reveals that the strong hinterland basin experiences an evident elevation drop after ∼20–30 Myr of convergence, followed by a rapid uplift. After compiling the paleoelevation data, we proposed that the Tibetan Plateau experienced a four-stage surface uplift, which was characterized by 1) the Gangdese and central watershed highlands isolating three lowlands during the Eocene, 2) the central lowland experiencing an elevation drop of ∼2000 m during the Oligocene, 3) the central lowland suffering a rapid uplift and merging into the Tibetan Plateau in the Early Miocene, and 4) the south and north lowlands rising and developing into a plateau similar to the modern Tibetan Plateau since the Middle Miocene.
1 Introduction
The modern Tibetan Plateau is the most extensive elevated surface on the earth, characterized by a high elevation and a flat-topped landscape. However, a number of low-elevation sedimentary basins developed in Tibet during the Cenozoic era (Kapp et al., 2005; Zhang et al., 2010; Deng and Ding, 2015; Kapp and DeCelles, 2019) (Figure 1). Sedimentary records and paleoelevation data reveal that many of these basins survived for a long period of time and maintained a low elevation before merging into the Tibetan Plateau. For example, the Lunpola Basin, located in central Tibet, contains >4,000 m-thick of lacustrine sedimentary layers which deposited during the Middle Eocene to the Early Miocene (Sun et al., 2014; Fang et al., 2020). Fish and palm fossils indicate that the Lunpola Basin was in a warm and humid environment during the late Oligocene, implying an elevation <2,300 m (Wu et al., 2017; Farnsworth et al., 2018). In the neighboring Nima Basin, the sedimentary layers were deposited from the Late Cretaceous to the Early Miocene (DeCelles et al., 2007; Kapp et al., 2007), and plants fossils indicate an elevation no more than 1,000 m during the late Oligocene (Wu et al., 2017; Liu et al., 2019). In the north-central Tibetan Plateau, the Hoh Xil Basin has a series of sedimentary sequences developed from the Middle Eocene to Early Miocene (Liu et al., 2003; Wang et al., 2008), and the leaf fossils indicate an elevation less than 3,000 m during the Early Miocene (Sun et al., 2015). In contrast, there were some other basins that had uplifted and merged into the plateau soon after the India–Asia collision. For example, the sedimentary strata in the Linzhou Basin ceased to deposit during the Late Eocene (He et al., 2007; Ding et al., 2014), and the oxygen isotope indicates that the Linzhou Basin had uplifted to attain its current elevation in the Early Eocene (Ding et al., 2014).
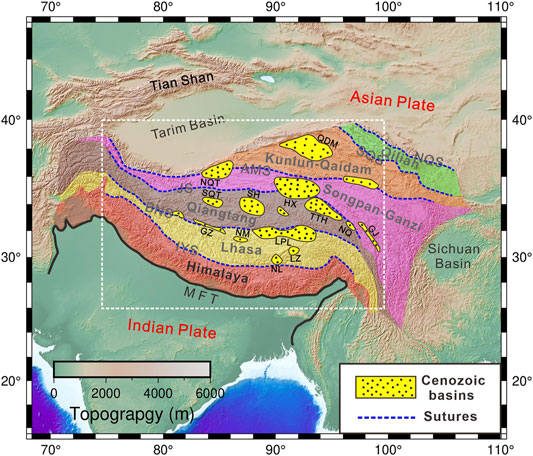
FIGURE 1. Simplified geological map of the Tibetan Plateau. The black curve represents the main frontal thrust (MFT). The blue dashed curves delineate the suture zones, and the colored regions are different terrains within the Tibetan Plateau (Yin and Harrison., 2000). Yellow dotted areas are Paleocene–Eocene basins (Zhang et al., 2010; Zhang et al., 2013). The white dashed box outlines the area of Figure 2A. IYS, Indus–Yarlung suture zone; BNS, Bangong–Nujiang suture zone; JS, Jinsha suture zone; AMS, Anyimaqen–Muztagh suture zone; SQS, South Qilian suture; NQS, North Qilian suture; NL, Namling Basin; LZ, Linzhou Basin; LPL, Lunpola Basin; NM, Nima Basin; GZ, Gerze Basin; GJ, Gonjo Basin; NQ, Niangqian Basin; TTH, Tuotuohe Basin; HX, Hoh Xil Basin; SH, Shuanghu Basin; SQT, South Qiangtang Basin; NQT, North Qiangtang Basin; QDM, Qaidam Basin.
Recent geophysical investigations show that some basins inside the Tibetan Plateau have relatively high seismic velocity crusts with respect to the surroundings (Yang et al., 2012; Zhao et al., 2013; Chen M. et al., 2017; and Huang et al., 2020) (Figure 2A), such as the Lunpola and Nima basins, implying relatively strong basements beneath these basins. However, the others basins exhibit a low velocity anomalies in the crust (Figure 2A), such as the Linzhou and the Hoh Xil basins, implying soft basements beneath them. Similar differences also manifest in geochemical data. For example, the Lunpola and Nima basins in the Lhasa terrane exhibit a negative Hf isotopic ratio of felsic igneous rocks (Zhu et al., 2011; Hou et al., 2015; Hou et al., 2020), correlated with the fast velocity zones (Figure 2B), indicative of a strong basement underneath them. In contrast, other basins, such as the Linzhou and Namling basins, display positive Hf isotopic values (Figure 2B), correlated with the slow velocity zones, implying a relatively weak basement beneath them. Therefore, both the available geophysical and geochemical data suggest that the strength of the hinterland basins in Tibet varies from region to region.
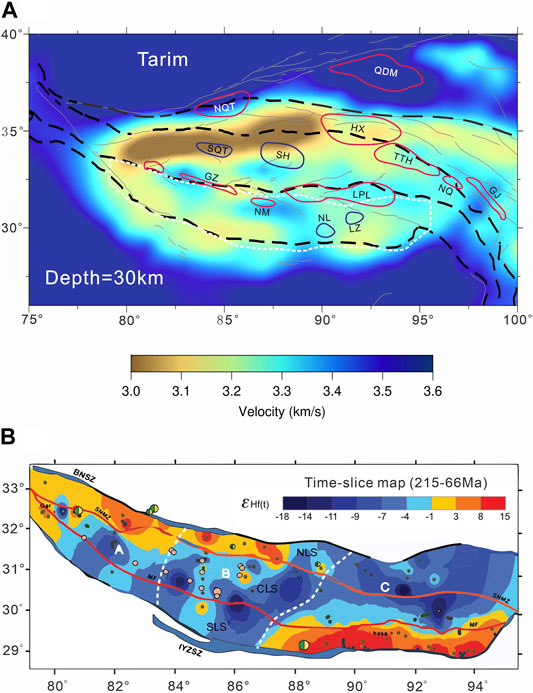
FIGURE 2. Shear wave velocity of the crust and Hf isotopic mapping. (A) Shear wave velocity at a 30 km depth in the region shown in Figure 1 (Yang et al., 2012). Red curves delineate the hinterland basins with a relatively fast velocity. Blue curves delineate the hinterland basins with a relatively slow velocity. (B) Hf isotopic mapping showing the spatial variation of zircon εHf(t) values for felsic igneous rocks in the Lhasa terrain (Hou et al., 2015). The region is outlined by a white dashed curve in (A). SLS, southern Lhasa subterrane; CLS, central Lhasa subterrane; and NLS, northern Lhasa subterrane.
Over the past several decades, a number of modeling studies have investigated the role of lateral lithospheric strength heterogeneities in the deformation pattern and growth of the orogenic plateau (England and Houseman, 1985; Cook and Royden, 2008; Dayem et al., 2009; Sokoutis and Willingshofer, 2011; Chen L. et al., 2017; Bischoff and Flesch, 2019; and Chen et al., 2020; Xie et al., 2021). These studies can be classified into two different categories: 1) weak lithosphere flanked by strong domains, and 2) strong block imbedded into a weak lithosphere. Most of these studies focus on the case of a weak domain sandwiched by a strong lithosphere (Willingshofer et al., 2005; Sokoutis and Willingshofer, 2011; Chen et al., 2020; and Xie et al., 2021). Willingshofer et al. (2005) used the lithosphere-scale analogue model to show that the strength contrast between the weak zone and surrounding lithosphere controls the scope and the shape of the collision orogen. Sokoutis and Willingshofer, (2011) demonstrated that the geometries and the decoupling degree of the weak zone play an important role in the geometric and topographic evolution of the mountain belts. Chen et al. (2020) using 3D numerical models revealed that the pre-existing weaknesses within the upper plate can alter the deformation propagation and the surface uplift pattern of the orogenic plateau. Xie et al. (2021) demonstrated that the crustal pre-existing weakness in the compressed lithosphere facilitates the local surface uplift at an early time and generates a second local surface uplift in a later time. In contrast, only a few studies investigated how the strong blocks in a weak lithosphere affect the continental deformation and surface topography (England and Houseman, 1985; Cook and Royden, 2008; Dayem et al., 2009; and Calignano et al., 2015). England and Houseman, (1985) used the thin viscous sheet model showed that the deformation is strongly concentrated around the strong crust and high mountain rise along its margins. Cook and Royden, (2008) built up a 3D numerical experiment demonstrating that the existence of a strong lower crust in the foreland slows the plateau propagation speed and develops a steep plateau margin. Dayem et al. (2009) found that the strong block’s oblique orientation significantly affects the localization of shearing deformation. Calignano et al. (2015) using analogue models revealed that the depth of the strong domain strongly impacts the deformation patterns and topographic growth at the margins. In summary, these studies mainly concentrate on the deformation, localization, and surface topography induced by the lateral lithospheric strength heterogeneities. However, how the hinterland basins evolved during the India–Asia convergence and how they affected the post-collisional growth of the Tibetan Plateau remain poorly understood.
In this study, we use 3D thermo-mechanical modeling to explore the topographic response of a hinterland basin to continental collision. We focus on the topographic evolution of a strength-varying basin imbedded in an orogenic plateau which is subject to horizontal compression and its influence on the plateau growth. For simplification, we do not include all of the hinterland basins in Tibet in the model. Instead, we set a single basin to explore the basin’s topographic evolution to the India–Asia collision and its influence on the growth of the Tibetan Plateau. We first describe the methodology and model setup. This is followed by presenting the simulation results of models in different situations. We then analyze the modeling results and summarize the topographic features and uplift history of basins inside the plateau. Finally, we apply the modeling results to understanding the uplift history of the Lunpola and Hoh Xil basins and discuss the growth pattern of the Tibetan Plateau.
Modeling Approach
Three-dimensional numerical simulations are carried out using the thermo-mechanical code I3ELVIS (Gerya, 2010). The code combines the finite difference method and the marker-in-cell technique to solve the continuity, momentum, and energy conservation equations on a staggered Eulerian grid (Gerya, 2010). It uses visco-plastic rheologies to describe the mechanical behavior of the rocks and considers thermo-mechanical properties for different rocks. These characteristics, together with an interior free surface, enable the simulation of a large-scale deformation and topographic evolution associated with continental collision.
Governing Equations
The incompressible continuity equation, which accounts for mass conservation using the Boussineq approximation, is as follows:
where i and j are spatial directions according to the Einstein summation convention,
Momentum conservation is governed by the three-dimensional Stokes equations, which are given as follows:
where
The heat conduction equation for the purpose of energy conservation is
where
The deviatoric stress tensor
Rheology and Partial Melting
The code considers the viscous and plastic rheologies, as well as the thermomechanical properties of different rocks. The lithospheric strength is determined by a combination of ductile and brittle deformation mechanisms at a mountain building time scale. The brittle deformation follows the Drucker–Prager yield criterion, which describes the linear relationship of the material resistance on the total pressure (Ranalli, 1995):
where
The viscosity for ductile creep takes the form (Beaumont et al., 2004)
where
The effective viscosity
Laboratory-determined flow laws of ‘wet quartzite,’ ‘plagioclase An75,’ and ‘dry olivine’ are used for the continental upper crust, lower crust, and asthenospheric mantle, respectively (Ranalli, 1995). Note that a modulated ‘plagioclase An75’ is used for the lower crust of the hinterland basin. The detailed rheological parameters used in this study are shown in Table 1. We set a lower cutoff viscosity of 1018 Pa s and an upper cutoff viscosity of 1026 Pa s for all rocks.
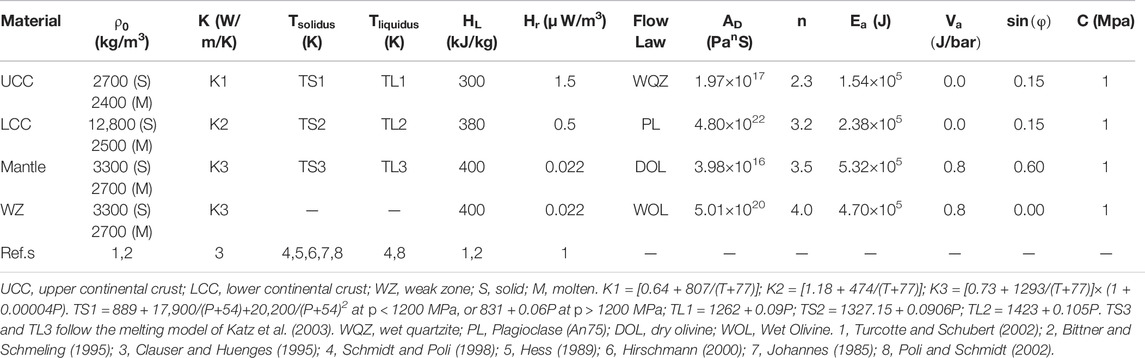
TABLE 1. Material properties used in the numerical experiments.
The degree of the partial melting of rocks is calculated by P-T–dependent solidus and liquidus curves (Table 1). The volumetric fraction
where
The effective density of partially molten rocks changes with the amount of melt fraction and P-T conditions:
where
The effects of latent heating generated by melting or crystallization are accounted for by an increased effective heat capacity
where
Model Setup
We investigate the topographic response of a hinterland basin imbedded in the upper plate under horizontal compression condition. The computational domain is a 4000 × 200 × 4000 km (in the order of x, y, and z) Cartesian box, and is resolved by 501 × 101×501 grid points with a uniform resolution of 8 × 2 × 8 km (Figure 3). There are approximately 200 million Lagrangian markers randomly distributed inside the box, which are used to advect the physical properties. As Chen L. et al. (2017) demonstrated that the lower crust rheology plays an important role in the deformation of the continental lithosphere. We vary the scaling factor f (Eq. (8)) of the lower crust flow law to represent the different strengths of the basin inside the plateau. Previous studies indicate that the composition of the continental lower crust ranges from basaltic to andesitic (Hacker et al., 2015) and the basaltic lower crust is ∼1 order of a magnitude more viscous than the andesitic lower crust (Shinevar et al., 2015). Therefore, in the reference model, we set a rectangle basin with the scaling factor f = 10, which means that the viscosity of its lower crust is 10 times higher than that of the surrounding regions. The basin is 500 × 800 km in size, and its location is varied in the study.
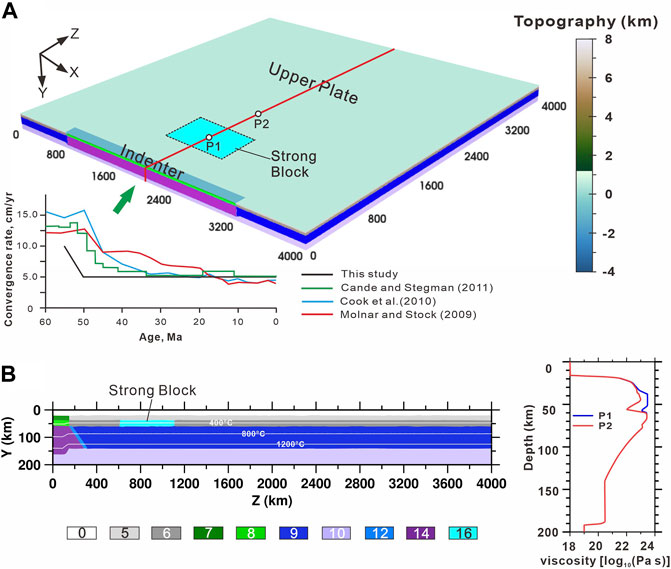
FIGURE 3. Model setup. (A) the 3D model domain (4,000 × 200 × 4,000 km). The colors covering the top of the model indicate the magnitude of the topography as shown in the vertical color bar. The cyan-colored area represents the strong basin. The left bottom chart shows the convergence rate applied in this study and previous estimates (Cande and Stegman; Copley et al., 2010; Molnar and Stock, 2009). (B) The composition field along the section x = 2000 km, as denoted by the red line in Figure 2A. And viscosity contrast between strong basin and surrounding areas whose localities are shown as P1 and P2 in (A). The blue curve represents the viscosity profile of the strong basin, and the red curve represents the viscosity profile of the surrounding areas. Composition numbers represent different rock types: 0- sticky air; 5- Asian upper crust; 6- Asian lower crust; 7- Indian upper crust; 8- Indian lower crust; 9- Asian lithospheric mantle; 10- asthenosphere; 12- weak zone; 14- Indian lithospheric mantle; and 16- strong lower crust of the basin.
In the model, back and side walls are set to be free slip. We take 55 Ma as the initial continental collision time (Molnar and Stock, 2009; Hu et al., 2016), which corresponds to the onset of the model. A starting convergence rate of 10 cm/yr is imposed at the central region of the front wall (1000 < X < 3000). It gradually decreases to 5 cm/yr after 5 Ma, and is fixed at 5 cm/yr henceforth. The time-dependent convergence rate used here is generally consistent with the estimates from plate reconstructions or paleomagnetic data (Molnar and Stock, 2009; Copley et al., 2010; and Cande and Stegman, 2011) (Figure 3A). It should be noted that when the India–Asia collision began is still controversial. Recently, Xiao et al. (2017) proposed that the terminal India–Asia collision occurred after 14 Ma based on the anatomy of composition and tectonic nature of the Himalayas, which supports a multi-stage collision process between India and Asia. The material influx at the front boundary is limited in the central region to simulate the indentation of the Indian continent, beside which (x = 0–1000 km and x = 3000–4000 km) the free slip condition applies. To keep mass balance within the layer, a constant outflow velocity is applied at the upper boundary, which is determined by
The initial temperature first increases linearly from 0°C at the surface to the Moho with 500°C for the indenter and 600°C for the upper plate, and then continues to increase to 1,360°C at the lithosphere base. The thermal gradient gradually changes in the transition zone between the indenter and its surrounding upper plate. The underlying asthenospheric mantle has an initial temperature gradient of 0.5°C/km. The top thermal boundary maintains a constant temperature of 0°C, and all the vertical thermal boundaries are insulating (no horizontal heat flow). At the bottom thermal boundary, an infinity-like external constant temperature condition is applied (Burg and Gerya, 2005). This implies that a constant temperature condition is satisfied at ∼200 km below the model base, allowing a spontaneous adjustment of the temperature and heat flux at the bottom of the model.
Taking into account that multiple ocean closure and intercontinental suturing events occurred at the southern Asian continental margin prior to the India–Asia collision (Yin and Harrison, 2000; Kapp and DeCelles, 2019), a relatively weak plate is set to simulate the pre-collisional Asian continental margin. The Asian plate has a 40 km thick continental crust composed of a 17 km thick upper crust and a 23 km thick lower crust, and a 80 km thick lithospheric mantle. The indenter has a 35 km thick continental crust composed of a 15 km thick upper crust and a 20 km thick lower crust, and a 105 km thick lithospheric mantle, to simulate the northern moving Indian craton. In consideration of oceanic subduction before continental indentation, we set a weak zone with a dip angle of 30 in front of the indenter cutting through the entire lithosphere (Figure 3B). Our focus is on the topography evolution in the hinterland of the Tibetan Plateau, where the erosion and sedimentation is not as significant as that at the plateau margins. Here, we do not consider the effects of the surface processes on the topographic evolution, but we will discuss the possible limitations for simplification.
Modeling Results
According to sedimentary records (Figure 1) and geophysical observations (Figure 2), we found that the basins inside the Tibetan Plateau vary in location, size, and strength. We first designed a reference model with a strong basin (f = 10) that is located 500 km north of the convergent boundary and is 500 km in width (Table 2). Then, we tested the influence of the basin’s distance to the convergent boundary and the basin’s width on the topographic response. After that, we investigated the effect of the basin strength on the uplift history and the topographic development of the plateau. In order to test the effect of the initial convergence rate on the modeling results, an additional model with a faster velocity was performed.
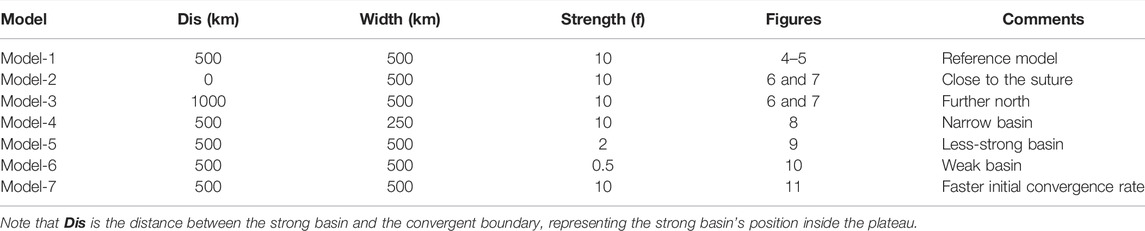
TABLE 2. Parameters and results of experiments.
Reference Model
Figure 4 shows the topographic evolution of the reference model (model-1 in Table 2). The deformation propagates northward quickly and localizes around the borders of the strong basin soon after the convergence starts. From the cross-sections, the existence of the strong basin causes the surrounding crusts to intensely thicken and buckle, resulting in the development of a high topography around the basin. In contrast, the strong basin itself experiences little deformation and underthrusts beneath the surrounding thickened crust. As a consequence, a lowland area develops in the interior of the plateau, characterized by a notable topographic relief. As the convergence continues, the lowland gradually shrinks and migrates northward. The lowland exists in the interior of the plateau until ∼46 Myr, after which it merges into the surrounding high plateau.
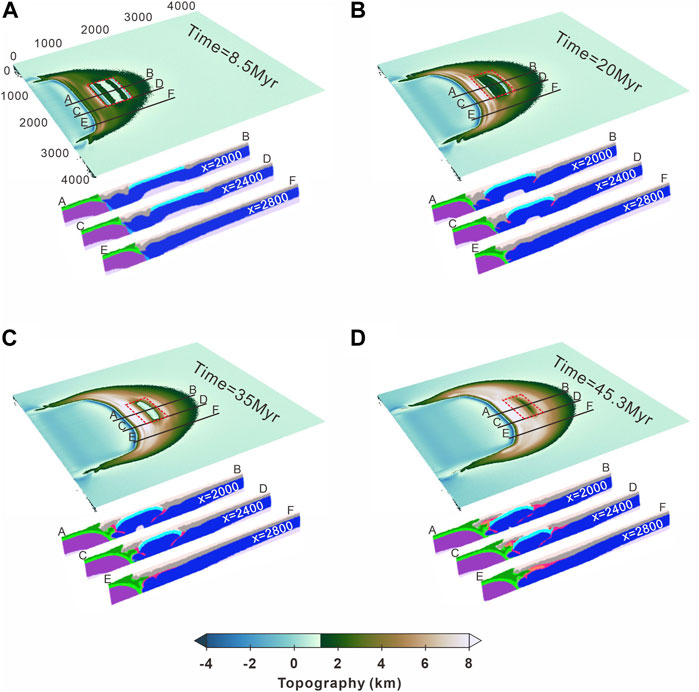
FIGURE 4. Topographic evolution of the reference model (model-1 in Table 2). Snapshots showing the surface topography and slices at (A) 8.5 Myr (B)20 Myr (C) 35.0 Myr, and (D) 45.3 Myr. The red dashed rectangles outline the scope of the strong basins’ lower crust. The black lines represent the different positions (x = 2,000, 2,400, and 2,800) of the slices.
The lowland area displays significant topographic relief in its interior. At the early stage of the collision, topographic depressions with negative elevation developed along the margins of the strong basin and uplifted belts developed adjacently (Figure 4). In terms of the uplift process, the elevation of a lowland does not rise monotonously. During the convergence, the distributed width of the strong lower crust changes slightly. Here, we assume that the length of the basin’s lower crust remains unchanged. This allows us to track the elevation variations of the basin’s different regions (points A1, B1, C, B2, and A2) with time (Figure 5). The surface of the lowland uplifts progressively from the margins to the center of the strong basin. The uplift histories of different regions vary significantly, but all undergo a considerable elevation drop followed by a rapid uplift. It is noteworthy that the lowland center (Point C) maintains a constant elevation for a long period and then experiences a noticeable elevation drop, followed by a quick uplift to the elevation of the surrounding mountains (Figure 5).
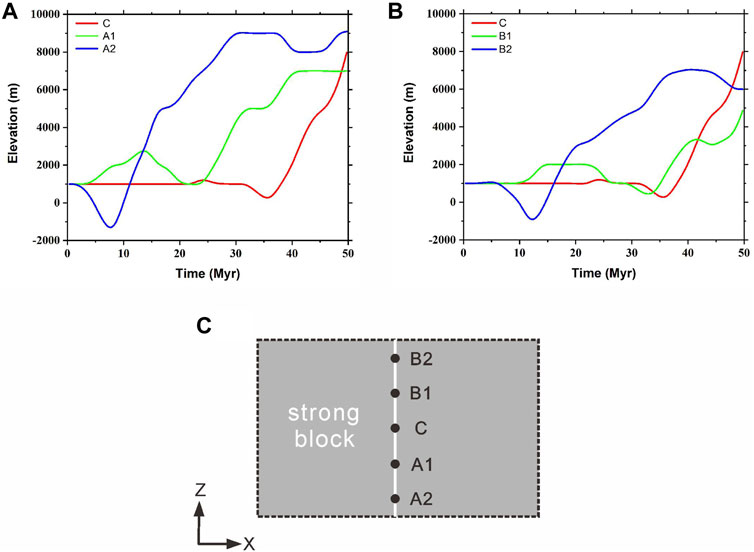
FIGURE 5. Plots of elevation versus time for different points within the strong basin. In (A) and (B), the red curves represent the uplift history at the center point (C). The blue curves represent the uplift history of the marginal points (A2, B2). The green curves represent the uplift history at points A1 and B1 (C) Positions of points A1, A2, B1, B2, and C in the interior of the strong basin.
Effects of a Strong Basin’s Position
In this section, we design a group of models (models two to three in Table 2) to investigate the impacts of a strong basin’s position on the topographic evolution of the plateau. Model-2 and model-3 are identical to the reference model, except that the distances of the strong basin to the convergent boundary are 0 and 1,000 km, respectively, instead of 500 km in the reference model. Figure 6 shows the topographic evolution of model-2 and model-3. The strong basins in model-2 and model-3 represent the rigid basins located at the south and north Tibetan Plateau, respectively. The plateau growth patterns in model-2 and model-3 are similar to the reference model, with lowlands developing in the interior of strong basins and plateaus forming in the surrounding region. Differently, the formation of the hinterland basin in model-2 occurs roughly 10 Myr earlier than that in model-3 (Figure 6). In addition, the time of the lowland merging into the plateau in model-2 also occurs earlier than that in model-3, at approximately 5 Myr. At 38 Myr of convergence, the lowland in model-2 has shrunk into a small residual basin, whereas the lowland in model-3 is still broad (Figure 6).
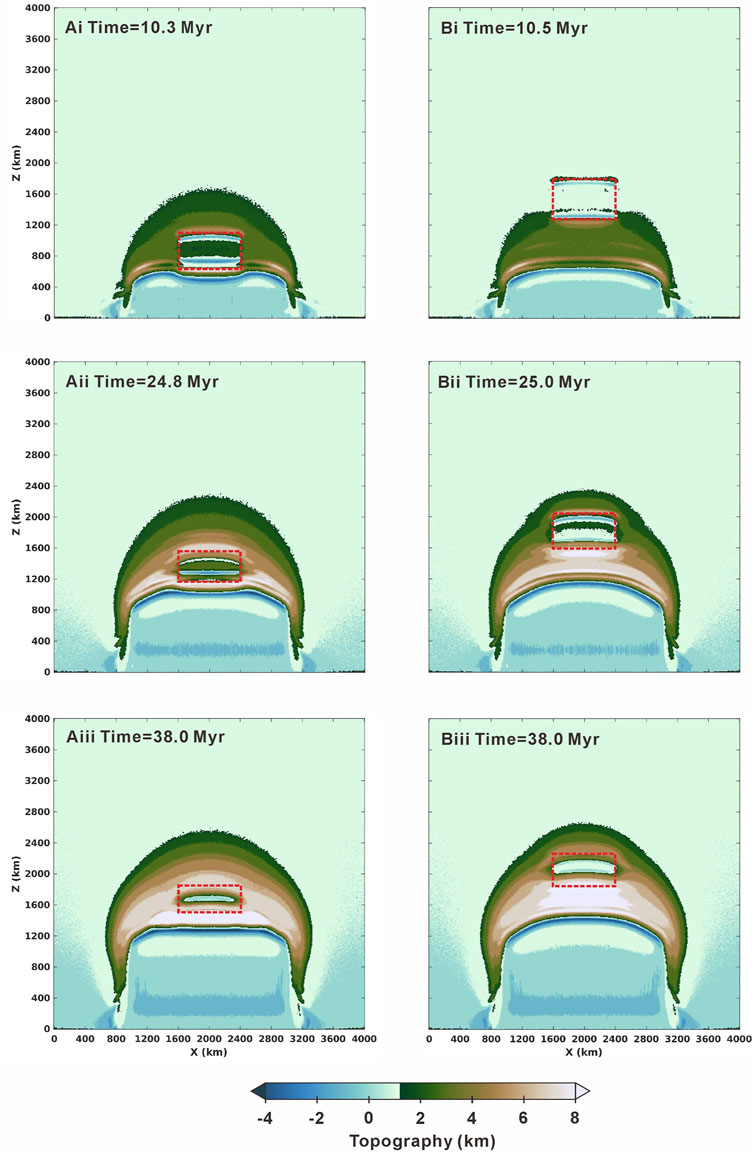
FIGURE 6. Topographic evolution of the model-2 and model-3 (Table 2). Snapshots showing the surface topography of model-2 at (Ai) 10.3 Myr (Aii) 24.8 Myr, and (Aiii) 38.0 Myr. Snapshots showing the surface topography of model-3 at (Bi) 10.5 Myr (Bii) 25.0 Myr, and (Biii) 38.0 Myr. The red dashed rectangles outline the scope of the strong basins.
The topographic features in the interior of the lowland region are significantly different in the model-1, model-2, and model-3 (Figure 7). In model-2, the center region of the lowland has been elevated from the early stage and displays a locally positive topography. Specifically, the lowland center (Point C) in model-2 uplifts nearly 2,000 m after 20 Myr of convergence, whereas the height of the lowland center in model-1 remains unchanged until 32 Myr of convergence. In addition, in model-2, the depression formed at the south margin of the lowland is more visible and deeper than that in the reference model. In detail, the subsidence of the south depression in model-2 exceeds 3,000 m, compared to less than 2,000 m in the reference model. By contrast, the lowland in model-3 has similar topographic features to the reference model.
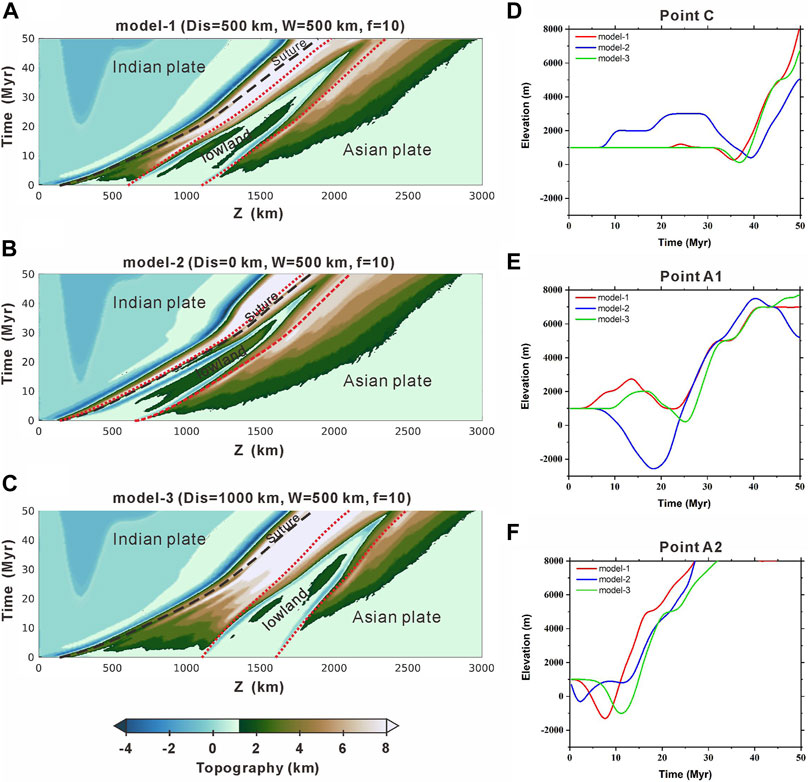
FIGURE 7. Contrasting the topographic features among mode-1, model-2, and model-3. Topographic evolution with time along section x = 2000 km in (A) model-1 (B) model-2, and (C) model-3. The red dotted curves limiting the region of the strong basins and the black dashed curves represent the sutures. Uplift histories of (D) point C (E) point A1, and (F) point A2 in different models. Red curves show the elevation history of model-1, blue curves show the elevation history of model-2, and green curves show the elevation history of model-3.
Effects of the Strong Basin’s Width
Considering the fact that the hinterland basins inside the Tibetan Plateau vary in size, we designed a model (model-4, Table 2), in which the width of the strong basin is half that in the reference model, to investigate the effects of the strong basin’s width on the topographic evolution of the plateau. Figure 8 shows the topographic evolution and the lowland uplift history of model-4. The topographic growth pattern of model-4 is similar to that of the reference model, except that the lowland in model-4 vanishes nearly 10 Myr earlier than that in the reference model (Figure 8A–D). As a result, it takes only 40 Myr to form a large uniform plateau in model-4 (Figure 8E), instead of >45 Myr in the reference model.
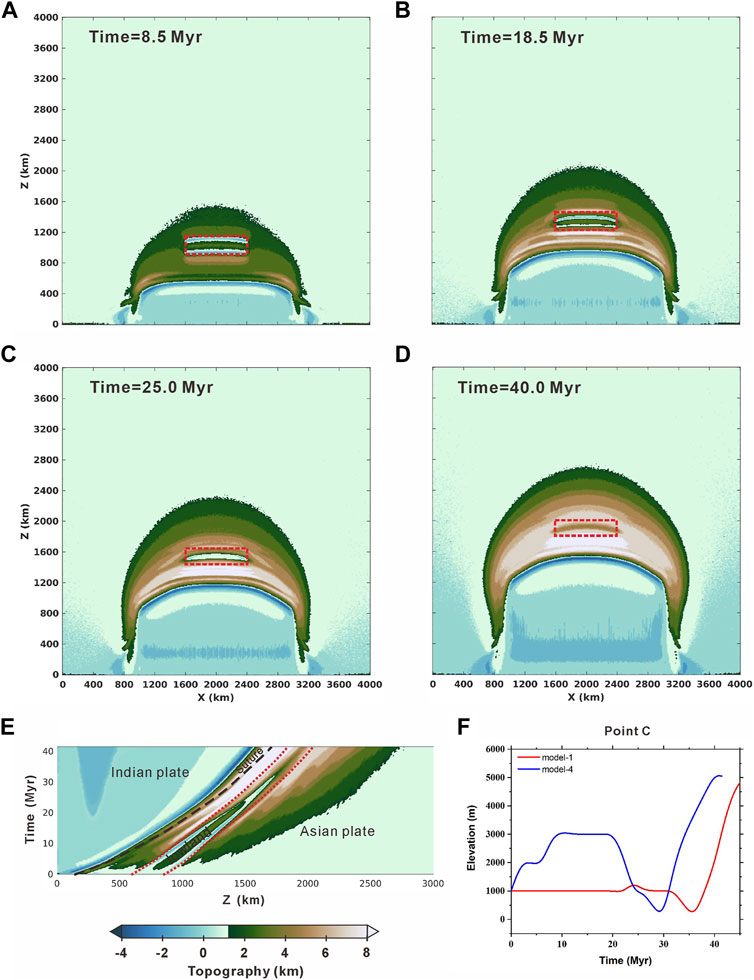
FIGURE 8. Topographic evolution of the model-4 (Table 2). Snapshots showing the surface topography at (A) 8.5 Myr (B) 18.5 Myr (C) 25.0 Myr, and (D) 40.0 Myr (E) exhibit the topographic evolution with time along section x = 2,000 km (F) showing the difference of the uplift history of center point C between the reference model (red curve) and model-4 (blue curve).
The topographic features and uplift history of the lowland in model-4 are dramatically different from those observed in the reference model. The lowland center region in model-4 was elevated soon after the convergence started, rather than maintaining constant in the reference model (Figure 8F). To be specific, after 10 Myr of convergence, the lowland center (Point C) in model-4 had increased to a height of 3,000 m and then kept unchanged until 20 Myr. Then, the height dropped by more than 2,500 m, close to sea level after 30 Myr of convergence (Figure 8F). In contrast, the elevation of the lowland center in the reference model was nearly constant during the first 30 Myr. The elevation fall of the lowland center in model-4 exceeds 2,500 m, whereas this value in the reference model is less than 1,000 m.
Effects of the Basin’s Strength
In this section, we designed a model with a less strong basin (f = 2, model-5 in Table 2) and a weak basin (f = 0.5, model-6 in Table 2) to test the effects of the basin’s strength on the topographic expressions of the plateau. The model results showed that the less strong basin had similar effects on the topographic growth of the plateau to that produced in the reference model (Figure 9A–E). The lowland basin also survives in the interior of the plateau for approximately 30 Myr. However, the basin’s uplift history is quite different to that in the reference model. The lowland center does not experience an elevation drop at a late stage, but keeps rising until reaching the height of the surrounding plateau (Figure 9F).
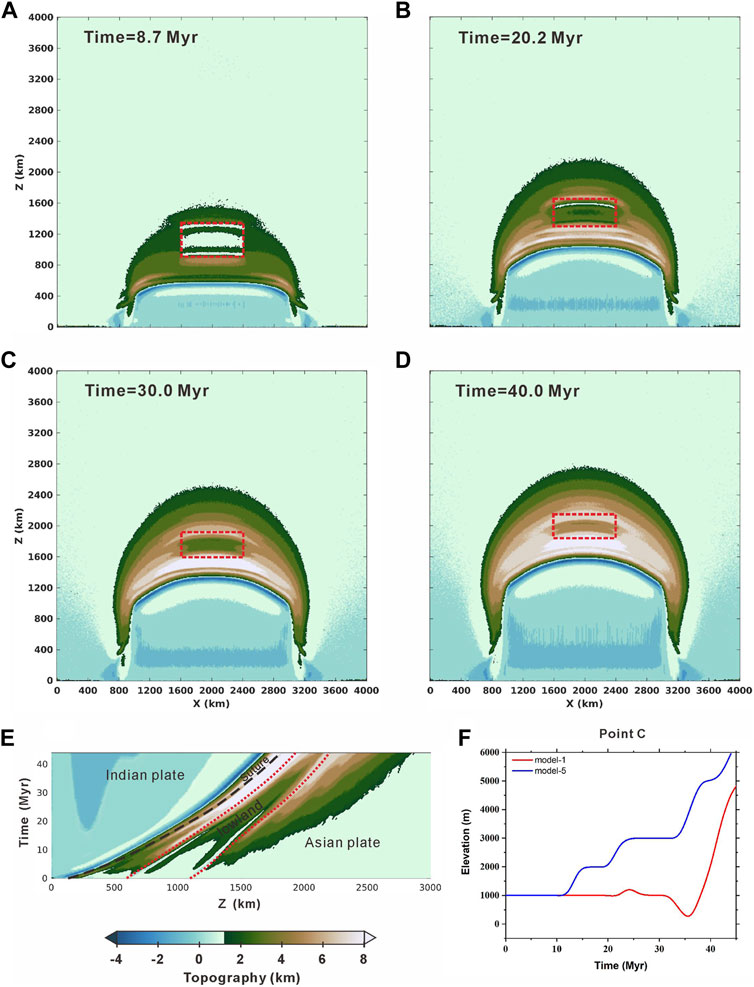
FIGURE 9. Topographic evolution of the model-5 (Table 2). Snapshots showing the surface topography at (A)8.7 Myr (B) 20.2 Myr (C) 30.0 Myr, and (D)40.0 Myr (E) display the topographic evolution with time along section x = 2,000 km (F) showing the difference of uplift history of center point C between the reference model (red line) and model-5.
The topographic response to a weak basin differs significantly from that of a strong basin. In model-6, the weak basin undergoes intense deformation in the early stage of the collision and uplifts earlier than the surrounding areas, leading to the formation of a topography high in the interior of the upper plate (Figure 10). The highland continues to rise and maintains its size until 20 Myr. After that, it propagates southward and northward. After 30 Myr of convergence, the plateau develops a flat-surfaced morphology. This set of models illustrates that the strength of the hinterland basin is a key factor in controlling the uplift pattern of the plateau. A strong hinterland basin favors a later uplift of the plateau’s interior, whereas a weak hinterland basin facilitates the formation of a topography high in the early stage of collision.
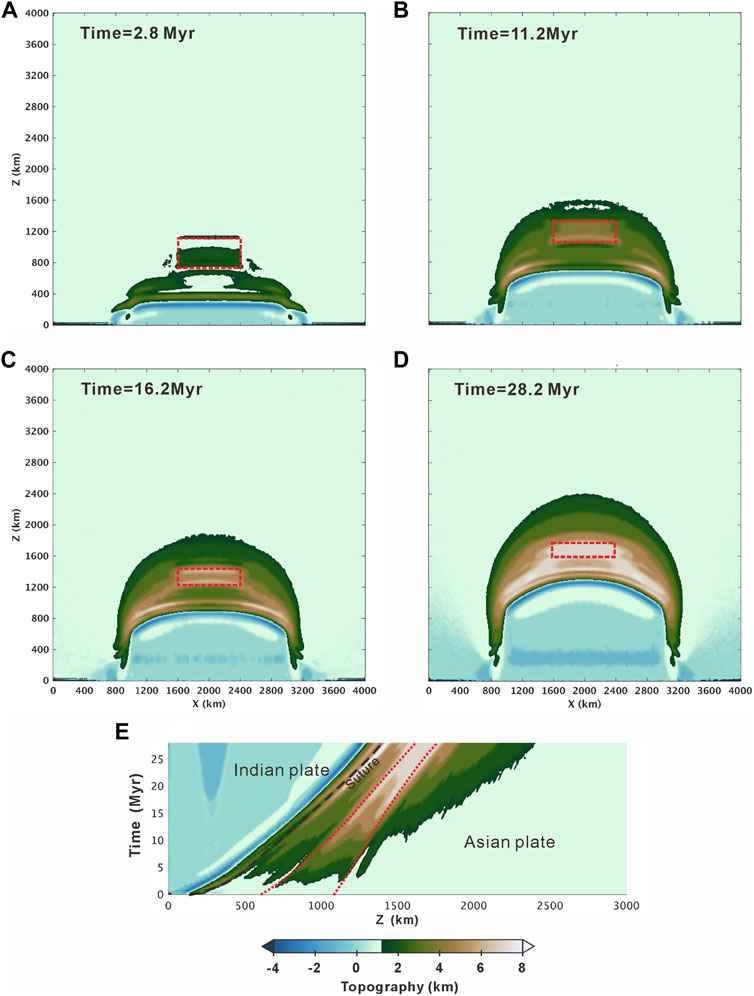
FIGURE 10. Topographic evolution of the model-6 (Table 2). Snapshots showing the surface topography at (A)2.8 Myr (B) 11.2 Myr (C) 16.2 Myr, and (D) 28.2 Myr (E) display the topographic evolution with time along section x = 2,000 km.
Effects of the Convergence Rate
Different to the aforementioned models that test the inherent properties of the basin, we perform an additional model (model-7 in Table 2) to test the influence of the convergence rate in the topographic response of a hinterland basin. Here, we choose the convergence rate reconstructed by Cande and Stegman (2011), in which the velocity is 13 cm/yr in the first 5 Myr and is then gradually reduces to a fixed value of 5 cm/yr after 15 Myr, keeping the other parameters the same as the reference model. The model results show that the growth pattern of the plateau and the topographic features in the interior of the lowland are similar to that in the reference model (Figure 11A–E). The lowland basin develops soon after the initial collision and survives for ∼35 Myrs in the interior of the plateau. The basin center also experiences an evident elevation drop and rapid uplift before merging into the plateau (Figure 11F). It is necessary to mention that the lowland basin migrates northward and shrinks more quickly due to the increased convergence amount. Also, it is worth noting that the lowland center was elevated about 1,000 m at an early stage of the basin’s lifespan, which is not noticeable in the reference model (Figure 11F). By comparing the faster convergence model with the reference model, we can conclude that the initial convergence velocity has little influence on the major characteristics of the basin’s topographic evolution and plateau growth.
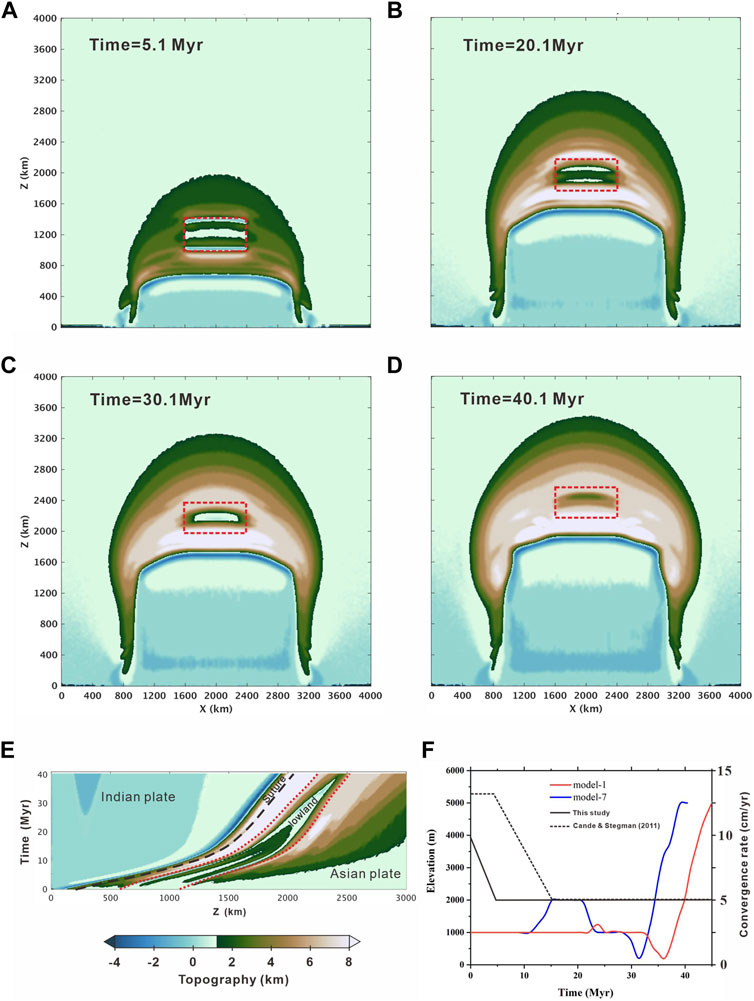
FIGURE 11. Topographic evolution of the model-7 (Table 2). Snapshots showing the surface topography at (A) 5.1 Myr (B)20.1 Myr (C) 30.1 Myr, and (D) 40.1 Myr (E) display the topographic evolution with time along section x = 2,000 km. (F) showing the difference of uplift history of center point C between the reference model (red line) and model-7 (blue line).
Discussion
Topographic Evolution of the Hinterland Basins
Our models demonstrate that the strength of the hinterland basin exerts a first-order control over the topographic evolution. The basin with a rigid basement develops into a lowland surrounded by high mountains soon after the initial collision and survives in the interior of the plateau for a long period of time (30–40 Myrs). In contrast, the basin with a soft basement uplifts quickly and reaches its current elevation after 20 Myr of the convergence. This provides an explanation to why some basins inside the Tibetan Plateau have long-term sedimentary records and keep a low elevation until the Late Oligocene, such as the Lunpola and Hoh Xil basins (Wang et al., 2008; Sun et al., 2014; Sun et al., 2015; Wu et al., 2017; and Fang et al., 2020), while some other basins ceased to deposit and have uplifted during the Eocene, such as the Linzhou and Shuanghu basins (Ding et al., 2014; Currie et al., 2016). Depending on the locations and the widths, the rigid hinterland basins display quite different lifetimes in the interior of the plateau. The time required for the formation of a lowland basin in the north Tibetan Plateau (model-3, Dis = 1000 km) delays by 10 Myr in comparison to the basin at central Tibet (model-1, Dis = 500 km). The time of merging into the plateau for the narrow basin (model-4, width = 250 km) is approximately 10 Myrs earlier than a vast basin (model-1, width = 500 km).
The hinterland basins also exhibit a variety of topographic features and uplift histories, depending on their locations, widths, and strengths. When the strong basin is close to the collisional zone (model-2) or is narrow (model-4), the central region rises at the early stage and then experiences an evident elevation drop at the late stage (Figure 12). However, when located further north (e.g., model-3), the lowland basin displays low-relief topography in the interior and the elevation keeps unchanged for a long period of time (Figure 7D). The topographic feature of the basin is closely related to the deep tectonic structure. Depressions and uplifted belts formed owing to the underthrusting and bending of the strong lower crust. Therefore, due to a weak surface topographic response to the bending, the less strong basin (model-5, f = 2) displays a less topographic relief in the interior (Figure 12). In model-2 and mode-4, the uplifted belts occur in the lowland center owing to the more intense bending and the narrowness of the strong basin, and the elevation drop is actually the result of the marginal depressions merging as the basin gradually shrinks (Figure 12).
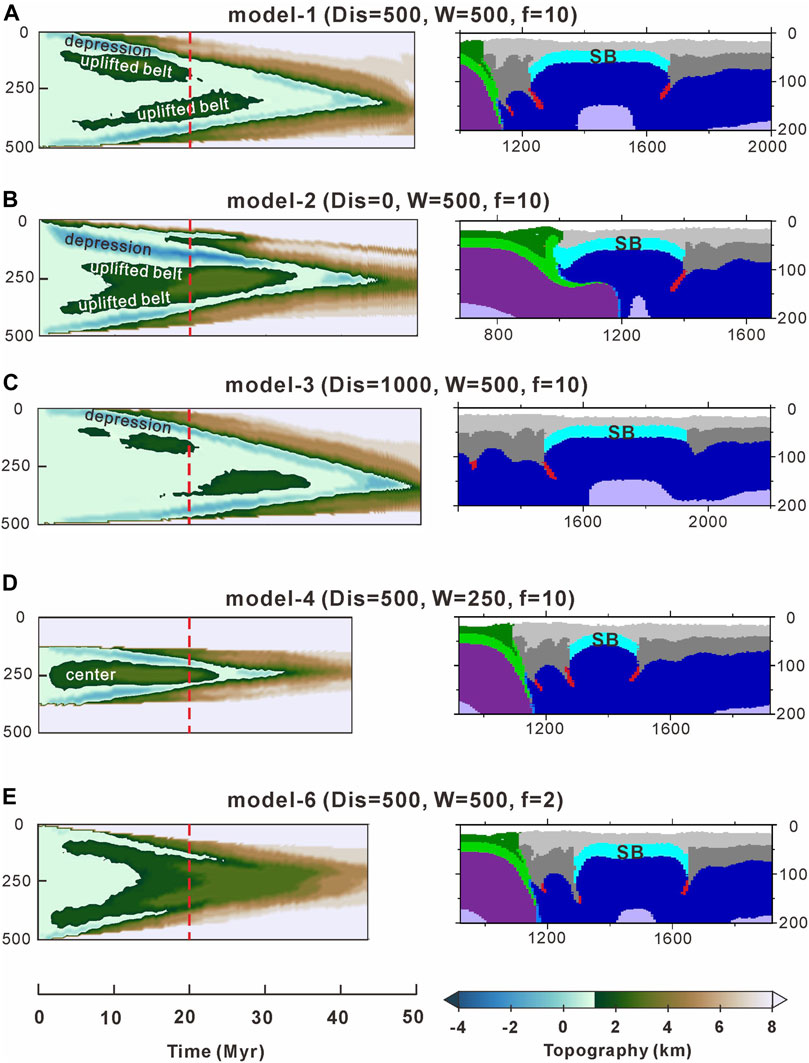
FIGURE 12. Topographic features of the lowlands and deep structures in (A) model-1 (B) model-2 (C) model-3 (D) model-4, and (E) model-6. The left column exhibits the detailed topographic features of the lowland in different models. Red dashed lines highlight the time snapshot of 20 Myr. The right column shows the deep structures along section x = 2,000 km at the snapshot of 20 Myr. SB represents the strong basement of the basins. Depressions formed at the edges and uplifted belts formed adjacently due to bending of the strong lower crust. Note that a vertical exaggeration of two is used in the cross-sections of the right column.
Implications for the Uplift Histories of the Lunpola and Hoh Xil Basins
The Lunpola Basin is a narrow basin and is located in the northern Lhasa terrane (Figure 1). Geophysical observation and geochemical data show that it is characterized by fast velocity anomalies in the crust (Yang et al., 2012) and negative Hf isotopic values of felsic igneous rocks (Hou et al., 2015; Hou et al., 2020) (Figure 2), which indicate that the Luopala Basin has a strong and old basement. Therefore, the uplift history of the Lunpola Basin can be compared with that of the lowland in model-4, in which the strong basin is 250 km in width and located 500 km north of the convergent boundary. A topographic analysis of model-4 shows that the basin was elevated to a medium elevation after 10 Myr of convergence and experienced a noticeable elevation drop of ∼3,000 m from 20 to 30 Myr of convergence, then followed by a rapid uplift (Figure 8F). We compiled the paleoelevation data published over the past 2 decades in the Lunpola Basin, including oxygen isotope, hydrogen isotope, and paleontology (Rowley and Currie, 2006; Polissar et al., 2009; Sun et al., 2014; Jia et al., 2015; Wu et al., 2017; Farnsworth et al., 2018; and Fang et al., 2020) (Figure 13A). The estimates based on isotope data tend to predict a higher elevation, whereas fossil-based data tend to reflect lowland elevations (Spicer et al., 2021). Fossil-based data indicate that the Lunpola Basin was elevated to a medium elevation during the Eocene (50–38 Ma) and suffered an evident elevation drop during the Oligocene (38–25 Ma), and then followed by a rapid uplift in the Early Miocene (23 Ma) (Figure 11). The elevation fluctuation of the Lunpola Basin, as revealed by fossils, is in agreement with the uplift history of the lowland center predicted by our model-4 (Figure 13A). In addition, the isotopic data also suggest that the Lunpola Basin had a high elevation during the Eocene and suffered a rapid uplift during the Early Miocene. Therefore, the Lunpola Basin was likely to be elevated to 2,500–3,000 m in the Middle Eocene and suffered an evident elevation fall of ∼2,000 m during the Oligocene, and then experienced a rapid uplift to achieve its present height in the Early Miocene.
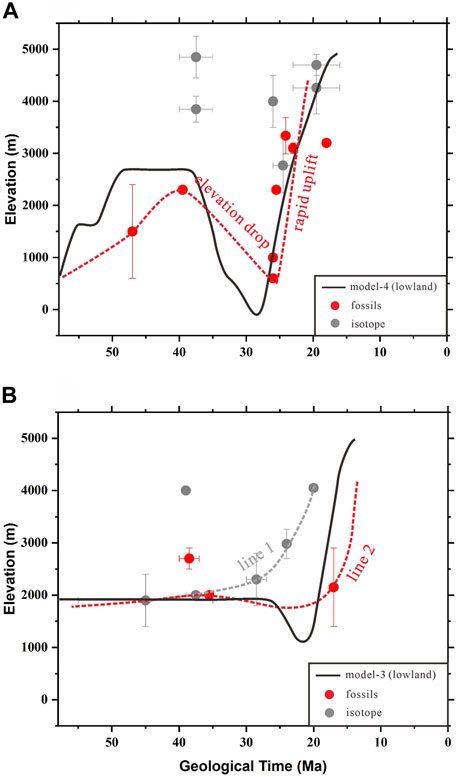
FIGURE 13. Compilation of paleolevations data of the Lunpola Basin (A) Red circles are the paleoelevations of the Lunpola Basin obtained from fossils of plant, animal, and pollen (Deng et al., 2011; Sun et al., 2014; Wu et al., 2017; Liu et al., 2019; Farnsworth et al., 2018, Su et al., 2020; Fang et al., 2020; and Xie et al., 2021). Gray circles represent the paleoelevations based on the oxygen isotope (Polissar et al., 2009; Jia et al., 2015) and hydrogen isotope (Rowley and Currie, 2006; Fang et al., 2020). The red dashed curve draws the expected uplift history of the Lunpola Basin based on fossils. The black curve displays the uplift history of the lowland center in model-4 (B) Red circles are the paleoelevations of the Hoh Xil Basin obtained from fossils (Sun et al., 2015; Miao et al., 2016; Song et al., 2021). Gray circles represent the paleoelevations based on the oxygen isotope (Cyr et al., 2005; Quade et al., 2011; Li et al., 2020) and the hydrogen isotope (Polissar et al., 2009). Dashed curves depict the expected uplift histories of the two sub-basins in the Hoh Xil Basin based on paleoelevations. The black curve shows the tendency of the uplift history of the lowland center in model-3.
The Hoh Xil Basin is a large basin far from the Indus–Yarlung suture zone (IYS). Weak crustal deformation (Staisch et al., 2016) and the negative Hf isotopic feature of felsic igneous rocks (Hou et al., 2020) imply a mechanically strong basement beneath the Hoh Xil Basin. Therefore, the topographic evolution of the Hoh Xil Basin can be compared with the lowland in model-3, where the strong basin is wide and far from the collisional zone. Our results show that the lowland center in model-3 keeps a constant elevation for ∼30 Myr and then experiences a slight elevation drop before the rapid uplift (Figure 7D). In the Hoh Xil Basin, a compilation of paleoelevation data indicates that the elevation did not change significantly throughout the Eocene (Cyr et al., 2005; Polissar et al., 2009; Miao et al., 2016; and Song et al., 2021) (Figure 13B). This is in accordance with the long-term unchanged elevation of the lowland center in model-3. As expected by the uplift histories of two sub-basins within the Hoh Xil Basin (Liu et al., 2016) (Figure 13B), the Hoh Xil Basin experienced a slight elevation drop during Oligocene followed by a fast uplift in the Early Miocene. This is consistent with the late-stage elevation variation of the lowland center in model-3.
Cenozoic Uplift Process of the Tibetan Plateau
How the Tibetan Plateau uplifted is a subject of intense debate. Several hypotheses for the growth pattern of the Tibetan Plateau have been proposed, including: 1) northward stepwise uplift model (Tapponnier et al., 2001; Mulch and Chamberlain, 2006), 2) a central proto-Tibetan Plateau model (Wang et al., 2008; Wang et al., 2014), and 3) the “Central Tibetan Valley” model (Deng and Ding, 2015; Farnsworth et al., 2018; and Xiong et al., 2022). According to the stepwise uplift model, the Tibetan Plateau rises gradually from the south to the north, with the Lhasa rising by Eocene, the Qiangtang rising during the Oligocene, the Songpan–Ganzi rising during the Miocene, and the Qilian rising during the Pliocene to Quaternary (Mulch and Chamberlain, 2006). The proto-Tibetan Plateau model argues that the Lhasa and southern Qiangtang terranes were elevated into a central Tibetan highland during the Middle Eocene, and then the highland expanded to the Himalayas during the mid-Miocene, and to the Hoh Xil Basin during the Early Miocene (Wang et al., 2008; Wang et al., 2014). However, the “Central Tibetan Valley” model supports a lowland central Tibetan along the Bangong–Nujiang suture zone (BNS) sandwiched between the Gangdese and the Tanggula mountains (or central watershed) during the Early Eocene to the Late Oligocene, and then uplifted in the early Miocene (Farnsworth et al., 2018; Fang et al., 2020; Xiong et al., 2022).
Based on the predicted uplift histories of the Lunpola and Hoh Xil basins in this study and previous paleoelevation data, we propose a revised Cenozoic uplift model for the Tibetan Plateau south of the Kunlun Mountain (Figure 14). We subdivide the Tibetan Plateau’s growth into four stages according to the surface topographic evolution. At the first stage (50–38 Ma), the Tibetan Plateau is characterized by two highlands separated by three lowlands (Figure 14A). Paleoelevation data from the Linzhou and Namling–Qiyug basins suggest that a high Andean-type Gangdese mountain range (∼5000 m) developed in the southern Lhasa during the Early Eocene (Ding et al., 2014; Ingalls et al., 2017). Also, the central watershed highlands were contemporaneously elevated to 4,000–5,000 m in central Qiangtang, according to the paleoelevation data of the Heihuling and Gonjo basins (Xu et al., 2013; Xiong et al., 2020). The fossil evidence indicates the existence of a lowland with an elevation of <2,000 m south of the Gangdese Mountains (Ding et al., 2017), a lowland region with an elevation of 2,500–3,000 m between the Gangdese and the central watershed highlands (Wei et al., 2016; Fang et al., 2020; Su et al., 2020), and a broad lowland region with an elevation of ∼2,000 m north of the central watershed highlands during the Eocene (Miao et al., 2016; Song et al., 2021).
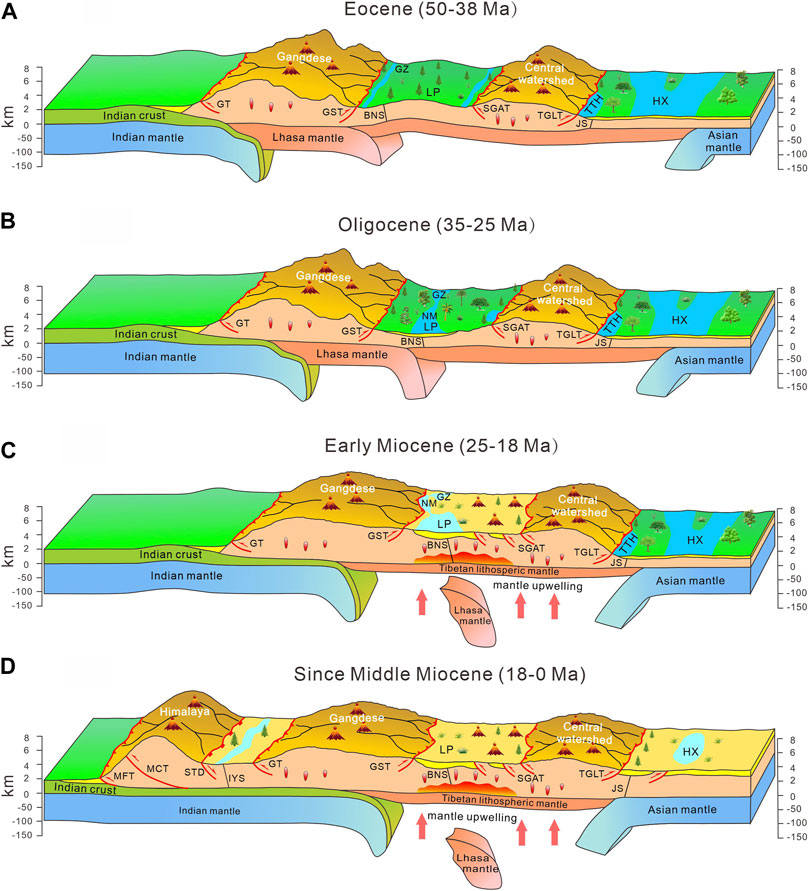
FIGURE 14. Schematic surface uplift of the Tibetan Plateau, which can be subdivided into four stages: (A) two highlands, the Gangdese and central watershed mountains, were separated by three lowlands (B) the central Tibetan lowland along BNS experienced an elevation drop of ∼2,000 m during the Oligocene (C) the central Tibetan lowland suffered an rapid uplift and merged into the Tibetan Plateau during the Early Miocene (D) the south and north lowlands were elevated and merged into the Tibetan Plateau since the Middle Miocene, forming a flat-surfaced topography similar to the modern Tibetan Plateau. GT, Gangdese Thrust; GST, Gaize-Siling Tso Thrust; SGAT, Shiquanhe-Gaize-Amdo Thrust; TGLT, Tanggula Thrust; MFT, Main Frontal Thrust; MCT, Main Central Thrust; and STD, South Tibetan Detachment.
At the second stage (35–25 Ma), the central Tibetan lowland along the Bangong–Nujiang suture (BNS) experienced an elevation drop of ∼2,000 m, forming a central Tibetan deep valley (Figure 14B). Plant and foraminifera fossils indicate that the elevation of the Lunpola, Nima, and Gerze basins were no more than 1,000 m during the Late Oligocene (Wei et al., 2016; Wu et al., 2017). Sedimentary records show a noticeable facie transition from lacustrine mudstones to fluvial and alluvial conglomerates and a threefold increase of the sedimentary rate in the Lunpola Basin during the Late Oligocene (Fang et al., 2020). This consolidates our prediction that the central Tibetan lowland suffered an evident subsidence during the Oligocene. However, paleoelevation data reveal that the lowland south of the Gangdese Mountains and the lowland north of the central watershed mountains remained at an elevation of ∼2,000 m at this stage (Ding et al., 2017; Dai et al., 2019). The elevation drop of the central Tibetan lowland occurred soon after the reduction of the India–Asia convergence rate (Molnar and Stock, 2009; Copley et al., 2010; and Cande and Stegman, 2011). Thus, we suggest that the slow convergence rate may result in a relaxation of the lithospheric compression bending, thereby sinking the surface.
At the third stage (25–18 Ma), the central Tibetan valley suffered a rapid uplift and merged into the plateau (Figure 14C). Fossil evidences from plants, mammals, and fish indicate that the ecosystem of the Lunpola and Nima basins experienced a significant turnover from a warm tropical environment in the Late Oligocene to a cool climate since the Early Miocene (Deng et al., 2019; Deng et al., 2021), whereas the lowland south of the Gangdese Mountains and the lowland north of the central watershed mountains remained at a low elevation according to carbon isotopic and palaeobotanical evidences (Wang et al., 2006; Sun et al., 2015; and Li et al., 2020). Seismic evidence suggests the convective removal of thickened lithosphere under the central Tibet during the Early Miocene (Chen M. et al., 2017), implying that the lithospheric delamination and mantle upwelling may have played important roles in the uplifting of the central Tibetan valley (Xiong et al., 2022). A recent study reveals an Early Miocene transition from a cold and strong middle-lower crust to a hot and weak middle-lower crust in the Qiangtang Block (Zhang et al., 2022). This supports that the Early Miocene uplift of the central Tibetan valley was driven by the crustal flow from surrounding highlands. Thus, we suggest that the lateral crustal flow and the vertical lithospheric delamination and mantle upwelling are the primary drivers of the central Tibetan valley’s rapid uplift.
At the last stage (18–0 Ma), the lowland south of the Gangdese Mountains and the lowland north of the central watershed mountains were uplifted and merged into the plateau since the Middle Miocene, forming the topography similar to the present Tibetan Plateau (Figure 14D). Oxygen isotopic data from the Gyirong Basin and the Thakkhola graben indicate that the Tethyan Himalaya was elevated to its current elevation by the Middle Miocene (Garzione et al., 2000; Rowley et al., 2001). Oxygen and hydrogen isotopes-based paleoelevations show that the Hoh Xil Basin was elevated to a height of >4,000 m after the Early Miocene (Polissar et al., 2009). The small degree of shortening and the Late Oligocene cessation of deformation in the Hoh Xil Basin imply that the north Tibetan lowland may have been uplifted as a result of the crustal flow and lithospheric removal (Staisch et al., 2016; Li et al., 2017).
Model Limitations
The numerical models conducted in this study are incomplete in that they do not consider the surface processes, such as erosion and sedimentation. There have been a number of investigations on the coupling and feedback between tectonics and erosion for orogens (Willett, 1999; Whipple and Meade, 2004; Graveleau et al., 2012). The climate-driven erosion generally leads to a narrowing of the orogenic belts, a temporary increase in sedimentary deposition, and a persistent increase in the rate of rock exhumation (Marques and Cobbold, 2002; Persson et al., 2004; Whipple and Meade, 2004; and Cruz et al., 2010). In our simulations, ignoring the erosion process results in an abnormally high elevation of the plateau. Neglecting the sedimentation process enlarges the topographic relief between the lowland basins and their surrounding topographic highs. However, the erosion and sedimentation processes are not significant in the interior of the Tibetan Plateau, exerting limited impact on the topographic evolution of the hinterland basins.
For simplification, we set a single basin in the upper plate in the model. Yet, it is noteworthy that there are a number of basins inside Tibet before merging into the Tibetan Plateau. These basins may have an interactive impact on each other’s topographic evolution. We will conduct further exploration on the basins’ interaction effects in the future.
Because of the large amount of computation in the 3D numerical simulation, we did not test the influences of plastic softening and high radiogenic crust on the basin’s topographic response to the continental collision. The plastic softening promotes the strain localization (Huismans and Beaumont, 2011). Chen et al. (2019) demonstrated that radioactive heating plays an important role in crustal melting, which promotes plateau expansion and crustal flow.
Despite the aforementioned simplifications, the presented 3D models can depict the first-order topographic response of the hinterland basins to the India–Asia collision.
Conclusion
In this article, we use 3D thermo-mechanical models to investigate the topographic response of the strong hinterland basin imbedded in a relatively weak continental lithosphere under the horizontal compression condition. The conclusions are as follows:
(1) Deformation strongly localizes around the margins of the strong basin soon after the convergence begins, while the strong basin experiences little deformation, resulting in a lowland area surrounded by topographic highs in the interior of the plateau. The central lowland progressively shrinks as the convergence continues, and eventually merges into the high plateau after ∼40–50 Myr of convergence.
(2) The central lowland does not rise monotonously during plateau growth, but experiences an unexpected elevation drop after ∼20–30 Myr of convergence, followed by a rapid uplift to reach the height of the surrounding plateau.
(3) A strong hinterland basin uplifts later than its surrounding regions, whereas a weak hinterland basin uplifts earlier. Our model results provide a mechanism to link the spatial distribution of hinterland basins and a diachronous uplift of the Tibetan Plateau.
(4) Based on the modeling results and paleoelevation data, we propose a revised model for the Tibetan Plateau’s uplift. During the Eocene (50–38 Ma), the Gangdese Mountains and central watershed mountains have developed and isolated three lowlands. The central lowland along the BNS experienced an elevation drop of ∼2,000 m during the Oligocene (35-25 Ma), then suffered a rapid uplift and merged into the Tibetan Plateau in the Early Miocene (25–18 Ma). The south and north lowlands were uplifted and merged into the plateau since the Middle Miocene (18–0 Ma).
Data Availability Statement
The geophysical and Hf isotopic values data are available from Yang et al. (2012) and Hou et al. (2015), respectively. The paleoelevation data of the Lunpola and Hoh Xil Basin are available from Liu et al. (2016).
Author Contributions
PZ conducted the work, analyzed the result data, and drafted the manuscript. LC made substantial contributions to the design of the work and revised the manuscript. WX made substantial contributions in guidance and discussion of the work and helped in revising the content. J'Z helped in analyzing the data of this work and revised the manuscript.
Funding
The National Natural Science of Foundation (41888101, 91955311, and 41974110) provided funds for calculating the numerical models on super computers. The Strategic Priority Research Program (B) of Chinese Academy of Sciences (XDB18030103) provided funds for participating in relatively academic meetings.
Conflict of Interest
The authors declare that the research was conducted in the absence of any commercial or financial relationships that could be construed as a potential conflict of interest.
The handling editor declared a past co-authorship with one of the authors LC at time of review.
Publisher’s Note
All claims expressed in this article are solely those of the authors and do not necessarily represent those of their affiliated organizations, or those of the publisher, the editors, and the reviewers. Any product that may be evaluated in this article, or claim that may be made by its manufacturer, is not guaranteed or endorsed by the publisher.
Acknowledgments
The authors sincerely thank Taras Gerya for providing the I3ELVIS code. They are grateful to Xi Xu, Zhiyong Yan, Renxian Xie, Jiaxuan Tang, Shunzhi Li, Xiaona Cui, and Xiao Xiang for discussions. Figures 3, 4 were generated with the open-source software ParaView (http://www.paraview.org), and the rest of the figures were generated with the Generic Mapping Tools (GMT, https://www.generic-mapping-tools.org). All the models were run on the Beijing Super Cloud Computing Center, Beijing, China (http://www.blsc.cn/), on the TianHe-1A Cluster at the National Supercomputer Center, Tianjin, China, and on the Supercomputing Laboratory, IGGCAS, Beijing, China.
References
Beaumont, C., Jamieson, R. A., Nguyen, M. H., and Medvedev, S. (2004). Crustal Channel Flows: 1. Numerical Models with Applications to the Tectonics of the Himalayan-Tibetan Orogen. J. Geophys. Res. 109 (B6), B06406. doi:10.1029/2003jb002809
Bischoff, S., and Flesch, L. (2019). Impact of Lithospheric Strength Distribution on India‐Eurasia Deformation from 3‐D Geodynamic Models. J. Geophys. Res. Solid Earth. 124 (1), 1084–1105. doi:10.1029/2018jb015704
Bittner, D., and Schmeling, H. (1995). Numerical Modelling of Melting Processes and Induced Diapirism in the Lower Crust. Geophys. J. Int. 123 (1), 59–70. doi:10.1111/j.1365-246x.1995.tb06661.x
Burg, J.-P., and Gerya, T. V. (2005). The Role of Viscous Heating in Barrovian Metamorphism of Collisional Orogens: Thermomechanical Models and Application to the Lepontine Dome in the Central Alps. J. Metamorph. Geol. 23 (2), 75–95. doi:10.1111/j.1525-1314.2005.00563.x
Calignano, E., Sokoutis, D., Willingshofer, E., Gueydan, F., and Cloetingh, S. (2015). Strain Localization at the Margins of strong Lithospheric Domains: Insights from Analog Models. Tectonics. 34 (3), 396–412. doi:10.1002/2014tc003756
Cande, S. C., and Stegman, D. R. (2011). Indian and African Plate Motions Driven by the Push Force of the Réunion Plume Head. Nature. 475 (7354), 47–52. doi:10.1038/nature10174
Chen, L., Capitanio, F. A., Liu, L., and Gerya, T. V. (2017). Crustal Rheology Controls on the Tibetan Plateau Formation during India-Asia Convergence. Nat. Commun. 8, 15992. doi:10.1038/ncomms15992
Chen, M., Niu, F., Tromp, J., Lenardic, A., Lee, C.-T. A., Cao, W., et al. (2017). Lithospheric Foundering and Underthrusting Imaged beneath Tibet. Nat. Commun. 8, 15659. doi:10.1038/ncomms15659
Chen, L., Liu, L., Capitanio, F. A., Gerya, T. V., and Li, Y. (2020). The Role of Pre-Existing Weak Zones in the Formation of the Himalaya and Tibetan Plateau: 3-D Thermomechanical Modelling. Geophys. J. Int. 221 (3), 1971–1983. doi:10.1093/gji/ggaa125
Chen, L., Song, X., Gerya, T. V., Xu, T., and Chen, Y. (2019). Crustal Melting beneath Orogenic Plateaus: Insights from 3-D Thermo-Mechanical Modeling. Tectonophysics 761, 1–15. doi:10.1016/j.tecto.2019.03.014
Clauser, C., and Huenges, E. (1995). Thermal Conductivity of Rocks and Minerals in AGU Ref. Shelf Rock Physics and Phase Relations (Washington, D. C: AGU), 3, 105–126. doi:10.1029/rf003p0105
Cook, K. L., and Royden, L. H. (2008). The Role of Crustal Strength Variations in Shaping Orogenic Plateaus, with Application to Tibet. J. Geophys. Res. 113 (B8), B08407. doi:10.1029/2007jb005457
Copley, A., Avouac, J.-P., and Royer, J.-Y. (2010). India-Asia Collision and the Cenozoic Slowdown of the Indian Plate: Implications for the Forces Driving Plate Motions. J. Geophys. Res. 115 (B3), B03410. doi:10.1029/2009jb006634
Cruz, L., Malinski, J., Wilson, A., Take, W. A., and Hilley, G. (2010). Erosional Control of the Kinematics and Geometry of Fold-And-Thrust Belts Imaged in a Physical and Numerical Sandbox. J. Geophys. Res. 115 (B9). doi:10.1029/2010jb007472
Currie, B. S., Polissar, P. J., Rowley, D. B., Ingalls, M., Li, S., Olack, G., et al. (2016). Multiproxy Paleoaltimetry of the Late Oligocene-Pliocene Oiyug Basin, Southern Tibet. Am. J. Sci. 316 (5), 401–436. doi:10.2475/05.2016.01
Cyr, A. J., Currie, B. S., and Rowley, D. B. (2005). Geochemical Evaluation of Fenghuoshan Group Lacustrine Carbonates, North‐Central Tibet: Implications for the Paleoaltimetry of the Eocene Tibetan Plateau. J. Geology. 113 (5), 517–533. doi:10.1086/431907
Dai, J. G., Fox, M., Shuster, D. L., Hourigan, J., Han, X., Li, Y. L., et al. (2019). Burial and Exhumation of the Hoh Xil Basin, Northern Tibetan Plateau: Constraints from Detrital (U‐Th)/He Ages. Basin Res. 32 (5), 894–915. doi:10.1111/bre.12405
Dayem, K. E., Houseman, G. A., and Molnar, P. (2009). Localization of Shear along a Lithospheric Strength Discontinuity: Application of a Continuous Deformation Model to the Boundary between Tibet and the Tarim Basin. Tectonics. 28 (3), a–n. doi:10.1029/2008tc002264
DeCelles, P. G., Quade, J., Kapp, P., Fan, M., Dettman, D. L., and Ding, L. (2007). High and Dry in central Tibet during the Late Oligocene. Earth Planet. Sci. Lett. 253 (3-4), 389–401. doi:10.1016/j.epsl.2006.11.001
Deng, T., and Ding, L. (2015). Paleoaltimetry Reconstructions of the Tibetan Plateau: Progress and Contradictions. Natl. Sci. Rev. 2 (4), 417–437. doi:10.1093/nsr/nwv062
Deng, T., Wang, S., Xie, G., Li, Q., Hou, S., and Sun, B. (2011). A Mammalian Fossil From the Dingqing Formation in the Lunpola Basin, Northern Tibet, and its Relevance to Age and Paleo-Altimetry. Chin. Sci. Bull. 57 (2–3), 261–269. doi:10.1007/s11434-011-4773-8
Deng, T., Wang, X., Wu, F., Wang, Y., Li, Q., Wang, S., et al. (2019). Review: Implications of Vertebrate Fossils for Paleo-Elevations of the Tibetan Plateau. Glob. Planet. Change. 174, 58–69. doi:10.1016/j.gloplacha.2019.01.005
Deng, T., Wu, F., Wang, S., Su, T., and Zhou, Z. (2021). Major Turnover of Biotas across the Oligocene/Miocene Boundary on the Tibetan Plateau. Palaeogeogr. Palaeoclimatol. Palaeoecol. 567, 110241. doi:10.1016/j.palaeo.2021.110241
Ding, L., Spicer, R. A., Yang, J., Xu, Q., Cai, F., Li, S., et al. (2017). Quantifying the Rise of the Himalaya Orogen and Implications for the South Asian Monsoon. Geology. 45 (3), 215–218. doi:10.1130/g38583.1
Ding, L., Xu, Q., Yue, Y., Wang, H., Cai, F., and Li, S. (2014). The Andean-Type Gangdese Mountains: Paleoelevation Record From the Paleocene–Eocene Linzhou Basin. Earth Planet. Sci. Lett. 392, 250–264. doi:10.1016/j.epsl.2014.01.045
England, P., and Houseman, G. (1985). Role of Lithospheric Strength Heterogeneities in the Tectonics of Tibet and Neighbouring Regions. Nature. 315 (6017), 297–301. doi:10.1038/315297a0
Fang, X., Dupont-Nivet, G., Wang, C., Song, C., Meng, Q., Zhang, W., et al. (2020). Revised Chronology of central Tibet Uplift (Lunpola Basin). Sci. Adv. 6 (50), eaba7298. doi:10.1126/sciadv.aba7298
Farnsworth, A., Farnsworth, A., Su, T., Spicer, R., Huang, J., Wu, F., et al. (2018). No High Tibetan Plateau until the Neogene. Sci. Adv. 5, eaav2189. doi:10.1130/abs/2018am-319129
Garzione, C. N., Quade, J., DeCelles, P. G., and English, N. B. (2000). Predicting Paleoelevation of Tibet and the Himalaya from N18O vs. Altitude Gradients in Meteoric Water across the Nepal Himalaya. Earth Planet. Sci. Lette. 183 (1-2), 215–229. doi:10.1016/s0012-821x(00)00252-1
Gerya, T. V. (2010). Introduction to Numerical Geodynamic Modelling. London: Cambridge Univ. Press, 338. doi:10.1017/9781316534243.022
Graveleau, F., Malavieille, J., and Dominguez, S. (2012). Experimental Modelling of Orogenic Wedges: A Review. Tectonophysics. 538-540, 1–66. doi:10.1016/j.tecto.2012.01.027
Hacker, B. R., Kelemen, P. B., and Behn, M. D. (2015). Continental Lower Crust. Annu. Rev. Earth Planet. Sci. 43 (1), 167–205. doi:10.1146/annurev-earth-050212-124117
He, S., Kapp, P., DeCelles, P. G., Gehrels, G. E., and Heizler, M. (2007). Cretaceous-Tertiary Geology of the Gangdese Arc in the Linzhou Area, Southern Tibet. Tectonophysics. 433 (1-4), 15–37. doi:10.1016/j.tecto.2007.01.005
Hirschmann, M. M. (2000). Mantle Solidus: Experimental Constraints and the Effects of Peridotite Composition. Geochem. Geophys. Geosyst. 1, a–n. doi:10.1029/2000GC000070
Hou, Z., Duan, L., Lu, Y., Zheng, Y., Zhu, D., Yang, Z., et al. (2015). Lithospheric Architecture of the Lhasa Terrane and its Control on Ore Deposits in the Himalayan-Tibetan Orogen. Econ. Geology. 110, 1541–1575. doi:10.2113/econgeo.110.6.1541
Hou, Z., Zheng, Y., Lu, Z., Xu, B., Wang, C., and Zhang, H. (2020). Growth,thickening and Evolution of the Thickened Crust of the Tibet Plateau. Acta Geologica Sinica. 94, 2797–2815. doi:10.19762/j.cnki.dizhixuebao.2020199
Hu, X., Garzanti, E., Wang, J., Huang, W., An, W., and Webb, A. (2016). The Timing of India-Asia Collision Onset - Facts, Theories, Controversies. Earth-Science Rev. 160, 264–299. doi:10.1016/j.earscirev.2016.07.014
Huang, S., Yao, H., Lu, Z., Tian, X., Zheng, Y., Wang, R., et al. (2020). High‐Resolution 3‐D Shear Wave Velocity Model of the Tibetan Plateau: Implications for Crustal Deformation and Porphyry Cu Deposit Formation. J. Geophys. Res. Solid Earth. 125 (7), e2019JB019215. doi:10.1029/2019jb019215
Huismans, R., and Beaumont, C. (2011). Depth-dependent Extension, Two-Stage Breakup and Cratonic Underplating at Rifted Margins. Nature. 473 (7345), 74–78. doi:10.1038/nature09988
Ingalls, M., Rowley, D., Olack, G., Currie, B., Li, S., Schmidt, J., et al. (2017). Paleocene to Pliocene Low-Latitude, High-Elevation Basins of Southern Tibet: Implications for Tectonic Models of India-Asia Collision, Cenozoic Climate, and Geochemical Weathering. GSA Bull. 130 (1-2), 307–330. doi:10.1130/b31723.1
Jia, G., Bai, Y., Ma, Y., Sun, J., and Peng, P. a. (2015). Paleoelevation of Tibetan Lunpola basin in the Oligocene-Miocene Transition Estimated from Leaf Wax Lipid Dual Isotopes. Glob. Planet. Change. 126, 14–22. doi:10.1016/j.gloplacha.2014.12.007
Johannes, W. (1985). The Significance of Experimental Studies for the Formation of Migmatites in Migmatites. Editor J. R. Ashworth (Glasgow, U. K: Blackie), 36–85. doi:10.1007/978-1-4613-2347-1_2
Kapp, P., DeCelles, P. G., Gehrels, G. E., Heizler, M., and Ding, L. (2007). Geological Records of the Lhasa-Qiangtang and Indo-Asian Collisions in the Nima Area of central Tibet. Geol. Soc. America Bull. 119 (7-8), 917–933. doi:10.1130/b26033.1
Kapp, P., and DeCelles, P. G. (2019). Mesozoic-Cenozoic Geological Evolution of the Himalayan-Tibetan Orogen and Working Tectonic Hypotheses. Am. J. Sci. 319 (3), 159–254. doi:10.2475/03.2019.01
Kapp, P., Yin, A., Harrison, T. M., and Ding, L. (2005). Cretaceous-Tertiary Shortening, basin Development, and Volcanism in central Tibet. Geol. Soc. America Bull. 117 (7), 865–878. doi:10.1130/b25595.1
Katz, R. F., Spiegelman, M., and Langmuir, C. H. (2003). A New Parameterization of Hydrous Mantle Melting. Geochem. Geophys. Geosyst. 4 (9), a–n. doi:10.1029/2002gc000433
Li, L., Chang, H., Guan, C., Liu, W., and Cao, Y. (2020). Early Miocene Paleoaltitude of the Tuotuohe Basin, Central‐Northern Tibetan Plateau and its Tectonic Implications. Acta Geologica Sinica ‐ English Edition 94 (5), 1364–1372. doi:10.1111/1755-6724.14373
Li, L., Garzione, C. N., Pullen, A., Zhang, P., and Li, Y. (2017). Late Cretaceous-Cenozoic basin Evolution and Topographic Growth of the Hoh Xil Basin, central Tibetan Plateau. GSA Bull. 130 (3-4), 499–521. doi:10.1130/b31769.1
Liu, J., Su, T., Spicer, R. A., Tang, H., Deng, W.-Y.-D., Wu,, F.-X., et al. (2019). Biotic Interchange Through Lowlands of Tibetan Plateau Suture Zones During Paleogene. Palaeogeogr. Palaeoclimatol. Palaeoecol. 524, 33–40. doi:10.1016/j.palaeo.2019.02.022
Liu, X., Xu, Q., and Ding, L. (2016). Differential Surface Uplift: Cenozoic Paleoelevation History of the Tibetan Plateau. Sci. China Earth Sci. 59 (11), 2105–2120. doi:10.1007/s11430-015-5486-y
Liu, Z., Zhao, X., Wang, C., Liu, S., and Yi, H. (2003). Magnetostratigraphy of Tertiary Sediments from the Hoh Xil Basin: Implications for the Cenozoic Tectonic History of the Tibetan Plateau. Geophys. J. Int. 154 (2), 233–252. doi:10.1046/j.1365-246x.2003.01986.x
Marques, F. O., and Cobbold, P. R. (2002). Topography as a Major Factor in the Development of Arcuate Thrust Belts: Insights from Sandbox Experiments. Tectonophysics. 348 (4), 247–268. doi:10.1016/s0040-1951(02)00077-x
Miao, Y., Wu, F., Chang, H., Fang, X., Deng, T., Sun, J., et al. (2016). A Late-Eocene Palynological Record from the Hoh Xil Basin, Northern Tibetan Plateau, and its Implications for Stratigraphic Age, Paleoclimate and Paleoelevation. Gondwana Res. 31, 241–252. doi:10.1016/j.gr.2015.01.007
Molnar, P., and Stock, J. M. (2009). Slowing of India's Convergence with Eurasia since 20 Ma and its Implications for Tibetan Mantle Dynamics. Tectonics. 28 (3), a–n. doi:10.1029/2008tc002271
Mulch, A., and Chamberlain, C. P. (2006). The Rise and Growth of Tibet. Nature. 439 (7077), 670–671. doi:10.1038/439670a
Persson, K. S., Garcia-Castellanos, D., and Sokoutis, D. (2004). River Transport Effects on Compressional Belts: First Results from an Integrated Analogue-Numerical Model. J. Geophys. Res. 109 (B1). doi:10.1029/2002jb002274
Poli, S., and Schmidt, M. W. (2002). Petrology of Subducted Slabs. Annu. Rev. Earth Planet. Sci. 30 (1), 207–235. doi:10.1146/annurev.earth.30.091201.140550
Polissar, P. J., Freeman, K. H., Rowley, D. B., McInerney, F. A., and Currie, B. S. (2009). Paleoaltimetry of the Tibetan Plateau from D/H Ratios of Lipid Biomarkers. Earth Planet. Sci. Lett. 287 (1-2), 64–76. doi:10.1016/j.epsl.2009.07.037
Quade, J., Breecker, D. O., Daeron, M., and Eiler, J. (2011). The Paleoaltimetry of Tibet: An Isotopic Perspective. Am. J. Sci. 311 (2), 77–115. doi:10.2475/02.2011.01
Ranalli, G. (1995). Rheology of the Earth: Deformation and Flow Processes in Geophysics and Geodynamics. 2nd ed. London: Chapman & Hall.
Rowley, D. B., and Currie, B. S. (2006). Palaeo-Altimetry of the Late Eocene to Miocene Lunpola basin, central Tibet. Nature 439 (7077), 677–681. doi:10.1038/nature04506
Rowley, D. B., Pierrehumbert, R. T., and Currie, B. S. (2001). A New Approach to Stable Isotope-Based Paleoaltimetry: Implications for Paleoaltimetry and Paleohypsometry of the High Himalaya since the Late Miocene. Earth Planet. Sci. Lett. 188, 253–268. doi:10.1016/s0012-821x(01)00324-7
Schmeling, H., Babeyko, A. Y., Enns, A., Faccenna, C., Funiciello, F., Gerya, T., et al. (2008). A Benchmark Comparison of Spontaneous Subduction Models-Towards a Free Surface. Phys. Earth Planet. Interiors. 171 (1-4), 198–223. doi:10.1016/j.pepi.2008.06.028
Schmidt, M. W., and Poli, S. (1998). Experimentally Based Water Budgets for Dehydrating Slabs and Consequences for Arc Magma Generation. Earth Planet. Sci. Lett. 163, 361–379. doi:10.1016/S0012-821X(98)00142-3
Shinevar, W. J., Behn, M. D., and Hirth, G. (2015). Compositional Dependence of Lower Crustal Viscosity. Geophys. Res. Lett. 42 (20), 8333–8340. doi:10.1002/2015gl065459
Sokoutis, D., and Willingshofer, E. (2011). Decoupling during continental Collision and Intra-plate Deformation. Earth Planet. Sci. Lett. 305 (3-4), 435–444. doi:10.1016/j.epsl.2011.03.028
Song, B., Zhang, K., Han, F., Liu, Z., Ai, K., Li, S., et al. (2021). Reconstruction of the Latest Eocene-Early Oligocene Paleoenvironment in the Hoh Xil Basin (Central Tibet) Based on Palynological and Ostracod Records. J. Asian Earth Sci. 217, 104860. doi:10.1016/j.jseaes.2021.104860
Spicer, R. A., Su, T., Valdes, P. J., Farnsworth, A., Wu, F.-X., Shi, G., et al. (2021). Why 'the Uplift of the Tibetan Plateau' Is a Myth. Natl. Sci. Rev. 8 (1), nwaa091. doi:10.1093/nsr/nwaa091
Staisch, L. M., Niemi, N. A., Clark, M. K., and Chang, H. (2016). Eocene to Late Oligocene History of Crustal Shortening within the Hoh Xil Basin and Implications for the Uplift History of the Northern Tibetan Plateau. Tectonics 35 (4), 862–895. doi:10.1002/2015tc003972
Su, T., Spicer, R. A., Wu, F.-X., Farnsworth, A., Huang, J., Del Rio, C., et al. (2020). A Middle Eocene lowland Humid Subtropical "Shangri-La" Ecosystem in central Tibet. Proc. Natl. Acad. Sci. U.S.A. 117 (52), 32989–32995. doi:10.1073/pnas.2012647117
Sun, B., Wang, Y.-F., Li, C.-S., Yang, J., Li, J.-F., Li, Y.-L., et al. (2015). Early Miocene Elevation in Northern Tibet Estimated by Palaeobotanical Evidence. Sci. Rep. 5, 10379. doi:10.1038/srep10379
Sun, J., Xu, Q., Liu, W., Zhang, Z., Xue, L., and Zhao, P. (2014). Palynological Evidence for the Latest Oligocene−early Miocene Paleoelevation Estimate in the Lunpola Basin, central Tibet. Palaeogeogr. Palaeoclimatol. Palaeoecol. 399, 21–30. doi:10.1016/j.palaeo.2014.02.004
Tapponnier, P., Zhiqin, X., Roger, F., Meyer, B., Arnaud, N., Wittlinger, G., et al. (2001). Oblique Stepwise Rise and Growth of the Tibet Plateau. Science. 294 (5547), 1671–1677. doi:10.1126/science.105978
Wang, C., Dai, J., Zhao, X., Li, Y., Graham, S. A., He, D., et al. (2014). Outward-growth of the Tibetan Plateau during the Cenozoic: A Review. Tectonophysics. 621, 1–43. doi:10.1016/j.tecto.2014.01.036
Wang, C., Zhao, X., Liu, Z., Lippert, P. C., Graham, S. A., Coe, R. S., et al. (2008). Constraints on the Early Uplift History of the Tibetan Plateau. Proc. Natl. Acad. Sci. U.S.A. 105 (13), 4987–4992. doi:10.1073/pnas.0703595105
Wang, Y., Deng, T., and Biasatti, D. (2006). Ancient Diets Indicate Significant Uplift of Southern Tibet after Ca. 7 Ma. Geol. 34 (4), 309. doi:10.1130/g22254.1
Wei, Y., Zhang, K., Garzione, C. N., Xu, Y., Song, B., and Ji, J. (2016). Low Palaeoelevation of the Northern Lhasa Terrane during Late Eocene: Fossil Foraminifera and Stable Isotope Evidence from the Gerze Basin. Sci. Rep. 6, 27508. doi:10.1038/srep27508
Whipple, K. X., and Meade, B. J. (2004). Controls on the Strength of Coupling Among Climate, Erosion, and Deformation in Two-Sided, Frictional Orogenic Wedges at Steady State. J. Geophys. Res. 109 (F1), F01011. doi:10.1029/2003jf000019
Willett, S. D. (1999). Orogeny and Orography: The Effects of Erosion on the Structure of Mountain Belts. J. Geophys. Res. 104 (B12), 28957–28981. doi:10.1029/1999jb900248
Willingshofer, E., Sokoutis, D., and Burg, J.-P. (2005). Lithospheric-scale Analogue Modelling of Collision Zones with a Pre-existing Weak Zone. Geol. Soc. Lond. Spec. Publications. 243 (1), 277–294. doi:10.1144/gsl.sp.2005.243.01.18
Wu, F., Miao, D., Chang, M.-m., Shi, G., and Wang, N. (2017). Fossil Climbing Perch and Associated Plant Megafossils Indicate a Warm and Wet central Tibet during the Late Oligocene. Sci. Rep. 7 (1), 878. doi:10.1038/s41598-017-00928-9
Xiao, W., Ao, S., Yang, L., Han, C., Wan, B., Zhang, J. E., et al. (2017). Anatomy of Composition and Nature of Plate Convergence: Insights for Alternative Thoughts for Terminal India-Eurasia Collision. Sci. China Earth Sci. 60 (6), 1015–1039. doi:10.1007/s11430-016-9043-3
Xie, R., Chen, L., Xiong, X., Wang, K., and Yan, Z. (2021). The Role of Pre‐existing Crustal Weaknesses in the Uplift of the Eastern Tibetan Plateau: 2D Thermo‐Mechanical Modeling. Tectonics. 40 (4), TC006444. doi:10.1029/2020tc006444
Xiong, Z., Liu, X., Ding, L., Farnsworth, A., Spicer, R. A., Xu, Q., et al. (2022). The Rise and Demise of the Paleogene Central Tibetan Valley. Sci. Adv. 8 (6), eabj0944. doi:10.1126/sciadv.abj0944
Xiong, Z., Ding, L., Spicer, R. A., Farnsworth, A., Wang, X., Valdes, P. J., et al. (2020). The Early Eocene Rise of the Gonjo Basin, SE Tibet: From Low Desert to High forest. Earth Planet. Sci. Lett. 543, 116312. doi:10.1016/j.epsl.2020.116312
Xu, Q., Ding, L., Zhang, L., Cai, F., Lai, Q., Yang, D., et al. (2013). Paleogene High Elevations in the Qiangtang Terrane, central Tibetan Plateau. Earth Planet. Sci. Lett. 362, 31–42. doi:10.1016/j.epsl.2012.11.058
Yang, Y., Ritzwoller, M. H., Zheng, Y., Shen, W., Levshin, A. L., and Xie, Z. (2012). A Synoptic View of the Distribution and Connectivity of the Mid-crustal Low Velocity Zone beneath Tibet. J. Geophys. Res. 117 (B4), a–n. doi:10.1029/2011jb008810
Yin, A., and Harrison, T. M. (2000). Geologic Evolution of the Himalayan-Tibetan Orogen. Annu. Rev. Earth Planet. Sci. 28 (1), 211–280. doi:10.1146/annurev.earth.28.1.211
Zhang, K., Wang, G., Xu, Y., Luo, M., Ji, J., Xaio, G., et al. (2013). Sedimentary Evolution of the Qinghai-Tibet Plateau in Cenozoic and its Response to the Uplift of the Plateau. Acta Geological Sinica 87, 555–575. doi:10.1111/1755-6724.12068
Zhang, K.-X., Wang, G.-C., Luo, M.-S., Ji, J.-L., Xu, Y.-D., Chen, R.-M., et al. (2010). Evolution of Tectonic Lithofacies Paleogeography of Cenozoic of Qinghai-Tibet Plateau and its Response to Uplift of the Plateau. Ear th Sci. 35, 697–712. doi:10.3799/dqkx
Zhang, X.-Z., Wang, Q., Wyman, D., Ou, Q., Qi, Y., Gou, G.-N., et al. (2022). Tibetan Plateau Growth Linked to Crustal thermal Transitions since the Miocene. Geology 50 (5), 610–614. doi:10.1130/g49534.1
Zhao, L.-F., Xie, X.-B., He, J.-K., Tian, X., and Yao, Z.-X. (2013). Crustal Flow Pattern beneath the Tibetan Plateau Constrained by Regional Lg-Wave Q Tomography. Earth Planet. Sci. Lett. 383, 113–122. doi:10.1016/j.epsl.2013.09.038
Keywords: numerical modeling, Tibetan Plateau, topography, uplift history, Lunpola Basin
Citation: Zhang P, Chen L, Xiao W and Zhang J (2022) Topographic Response of Hinterland Basins in Tibet to the India–Asia Convergence: 3D Thermo-Mechanical Modeling. Front. Earth Sci. 10:845126. doi: 10.3389/feart.2022.845126
Received: 29 December 2021; Accepted: 06 April 2022;
Published: 09 May 2022.
Edited by:
Manuele Faccenda, Università Padova, ItalyReviewed by:
Andrea Piccolo, University of Bayreuth, GermanyChenglong Deng, Institute of Geology and Geophysics (CAS), China
Copyright © 2022 Zhang, Chen, Xiao and Zhang. This is an open-access article distributed under the terms of the Creative Commons Attribution License (CC BY). The use, distribution or reproduction in other forums is permitted, provided the original author(s) and the copyright owner(s) are credited and that the original publication in this journal is cited, in accordance with accepted academic practice. No use, distribution or reproduction is permitted which does not comply with these terms.
*Correspondence: Lin Chen, Y2hlbmxpbkBtYWlsLmlnZ2Nhcy5hYy5jbiYjeDAyMDBhOw==; Wenjiao Xiao, V2oteGlhb0BtYWlsLmlnZ2Nhcy5hYy5jbg==