 Jinchang Shi
- Shaanxi Institute of Engineering Prospecting, Xi’an, China
Regional landslide susceptibility mapping has an important role in guiding linear engineering optimization. Based on the geographic information system (GIS) platform and R language MaxEnt software, in this research, the China National Highway 109 New Line Expressway (Beijing Sixth Ring Road-City Boundary Section) was taken as an example. Using the maximum entropy (MaxEnt) model, with ten evaluation indicators, including the elevation, slope, aspect, relief, topographic wetness index (TWI), roughness, lithology, distance to road, normalized difference vegetation index (NDVI), and land use type, a landslide susceptibility mapping was completed to support linear engineering optimization. The ROC value of the prediction model was 82.1%, and the %LRclass was 2.25, which strongly demonstrated the reliability of the landslide susceptibility mapping results. Then, the percentages of two roads with different landslide probability levels were calculated. It was found that only 10% of the new line was in a very high class, which was much lower than 26% of the existing line. This study proved that the regional landslide susceptibility mapping can be used to support optimization of the construction plan of the new line and provided a broader basis for decision-making for similar linear projects in future engineering projections.
Introduction
Landslides, one of the major types of geological hazards, are widely distributed all over the world. Landslides have caused severe damage to infrastructures and several casualties (Fan et al., 2018; Lin and Wang, 2018; Qu et al., 2020). It has been found that as a useful tool to support governments in making smart decisions, landslide susceptibility mapping has shown great effects for many aspects (He et al., 2020; Maharjan et al., 2021; Su et al., 2021; Zhao et al., 2021).
Currently, landslide susceptibility mapping is applied primarily in risk assessment, monitoring and early warning, urban planning, and land use (Reichenbach et al., 2018; Janalipour et al., 2021). For example, Remondo et al. (2005) took landslide susceptibility mapping as an indispensable layer to develop a map of the hazard potential of landslides and then combined this layer with the value of goals influenced by landslides to determine the landslide risk mapping to aid city risk management. Additionally, Huang et al. (2020) integrated the monitoring data from a synthetic aperture radar (SAR) satellite and landslide susceptibility mapping and produced a dynamic regional landslide monitoring model with consideration of the slope resistance and landslide activity. At the same time, many researchers (Intrieri et al., 2012; Keefer et al., 1987; Liu, 2004; Osanai et al., 2010; Baum and Godt 2010; He et al., 2020) coincidentally tried to find a novel model to combine the rainfall data from satellites or rainfall recorders with landslide susceptibility mapping to produce a regional real-time landslide warning system. Furthermore, to guide urban planning work and land use, Yao et al. (2018) mixed landslide susceptibility mapping into the definition of urban affordability and then clearly showed the developed and undeveloped areas around the county of Suide, Shaanxi Province in China. Less work has been attempted for linear engineering, which is commonly called lifeline engineering.
Compared with other engineering projects, linear engineering projects such as gas lines, highways, and railways have a unique feature: one point of damage will cause failure for the entire system (Das et al., 2011). Highway work is always accompanied by large slope cutting engineering, which results in the occurrence of more landslides (Laimer 2017; Zhang and Zhang, 2014; Li et al., 2020). More importantly, Hakan (2022) monitored the evolution of a road network during an 11-year time-space in Arhavi and found that road extension works were associated with the large majority (90.1%) of mass movements in the area, which was similar to the possible effect of a theoretical earthquake, with a magnitude greater than Mw = 6.0. Therefore, road engineering has to face more threats from landslides, and route optimization must always be performed after a period of operation. Therefore, it is necessary to find a better method to easily support regional linear engineering optimization using proven useful tools such as landslide susceptibility mapping.
Considering the aforementioned aspects, in this research, the National Highway 109 New Line Expressway (Beijing Sixth Ring Road-City Boundary Section) project in China was taken as an example. The maximum entropy model of machine learning was used to evaluate the landslide susceptibility mapping function to perform a reasonable quantitative analysis of the existing highways and proposed new highways to support linear engineering optimization. First, all data, including digital elevation models (DEMs), landslide points, and other original data, were used as input into the open-source MaxEnt software program (https://biodiversityinformatics.amnh.org/open_source/maxent/) after preprocessing to export the landslide susceptibility value of each pixel. Second, the landslide susceptibility value in the ASCII format was opened on the QGIS platform and divided into five grades using the natural breakpoint method after the predictive accuracy was checked using the value of the area under the curve of the receiver operating curve (AUC–ROC) and %LRclass. Third, the lengths of the new and existing roads in each susceptible class were calculated, and the rationality of the new route was analyzed.
Study Area
The China National Highway 109 New Line Expressway (Beijing Sixth Ring Road-City Boundary Section) (Figure 1), with a total length of 69.2 km, starts from the Beijing Sixth Ring Road to the east and ends at the Zhangjiajie city of Hebei Province. It serves the two cities and plays a vital role in communication and social development. To better include and assess the existing landslides and potentially related geohazard chain, the watersheds of the mountains on both sides of the line are taken as the research boundary. Compared with the equidistant expansion of 200 m along both sides in the traditional manner, it was helpful to take high-level disasters into account (Fan et al., 2019a).
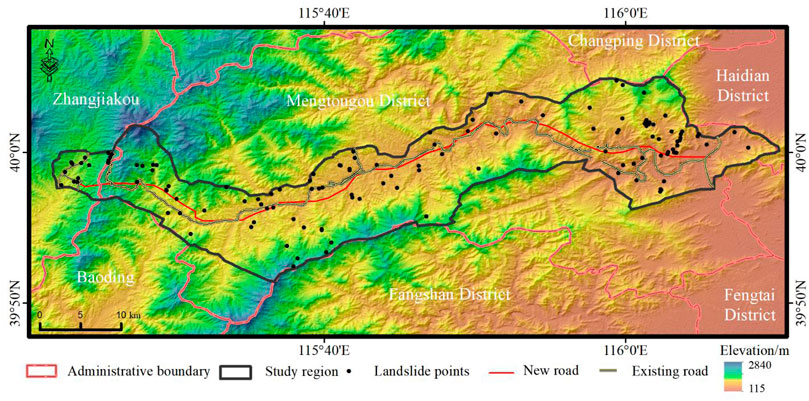
FIGURE 1. Location of the study area and distribution of the landslides.
The total study area of 628 km2 was a typical mountainous landform with sandstone and basalt as the main strata, with only a few small inactive faults. According to remote sensing interpretation and the on-site investigation, 126 landslide disasters were found. All landslides were randomly distributed on two sides of the highway.
Methodology
Model Choice
Different assessment models have significant impact on the results of landslide susceptibility mapping. At present, the commonly used landslide susceptibility evaluation models can be divided into knowledge-driven, data-driven, and physical model-driven models (Reichenbach et al., 2018). The knowledge-driven type of model has greater subjectivity, while the physical model-driven type requires a large number of accurate mechanical parameters, which limits the application of these two methods. Practice has proven that data-driven models have higher accuracy than the other two types (Reichenbach et al., 2018; Chen and Li, 2020). With the development of artificial intelligence, the machine learning model has become the most popular model in data-driven models, and a large amount of work has proven that the evaluation result of the machine learning model is better than that of the traditional statistical model (Reichenbach et al., 2018; Chen et al., 2021; Zhao et al., 2021). The common machine learning models include the random forest model, decision tree model, support vector machine, Bayesian model, and god-level network model. Each model has its advantages and disadvantages (Table 1).
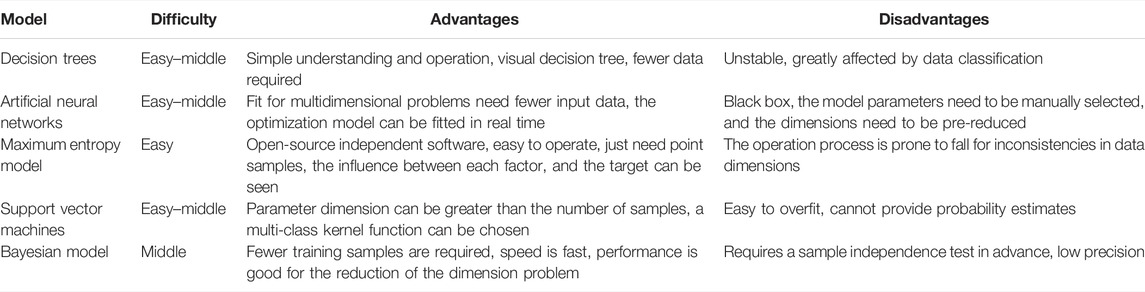
TABLE 1. Advantages and disadvantages of common machine learning modes in landslide susceptibility assessment.
Recently, scientists have also begun to apply the maximum entropy model, which was originally used and is still popular in the field of species habitat suitability assessment (Merow et al., 2013), in the evaluation of landslide susceptibility. The evaluation results have been effective and better than models as support vector machines and artificial neural networks (Chen et al., 2017; Teimouri and Nalivan, 2020). At the same time, according to the basic theory of landslide assessment, future landslides will occur in similar areas where landslides have occurred in the past, which is consistent with the basic theory of species habitat suitability assessment (Reichenbach et al., 2018). Therefore, the choice of a maximum entropy model could achieve a better result to support linear engineering optimization and further verify the suitability of this interdisciplinary evaluation model for landslide assessment to enrich the optional model and guide actual production.
Theory of the Maximum Entropy Model
MaxEnt is a machine learning model that quantitatively calculates the probability of landslide occurrence in the evaluation area using the Bayesian rule based on the geological environment indicators of the training landslide (Rahmati et al., 2016). The specific calculation principle is that the study area is divided into a finite pixel set X, with the assumption that x represents each computing unit. Then, x∈X in the study area and π(x) represents the probability distribution value of landslide occurrence in each computing unit 0<P(x) < 1. The sum of the probability values of all computing units is 1. The landslide value of the calculation grid is taken as the response variable y, if the calculation unit has a landslide, y = 1, otherwise it is 0. Therefore, the probability of the landslide conditional distribution P(y|x) can be expressed as follows:
where P(y = 1|x) is the probability of a landslide at a specific point x; P(y|x = 1) is the probability of a landslide at a specific point x under the landslide distribution conditions, which is also π(x); P(y = 1) is the overall incidence of landslides; and P(x) is the probability of landslide occurrence at any point x.
Since P(x) indicates that any point x of all calculation units X in the study area is equal to 1/∣x∣, the aforementioned formula can be transformed into the following equation:
Considering the probabilities of landslide occurrence and nonoccurrence are equal, namely [P(y = 0) = P(y = 1) = 0.5], the equation can be further simplified as follows:
The application of the MaxEnt model directly depends on the conditional probability P(y = 1|x). The larger the conditional probability is, the greater the possibility of landslide occurrence will be. The event occurrence data π(x) can be used for modeling, instead of directly estimating P(y = 1|x). The value of π(x) estimated with the principle of maximum entropy is equal to the Gibbs probability distribution represented by the exponent. If n features (fi, i = 1, 2,…,n) are considered, the Gibbs probability distribution can be defined as follows:
In the formula, Zλ is a normalization constant to ensure that the sum of qλ(x) is 1. In the estimation of qλ(x), the model uses the regularization I2 to find the distribution closest to the constraints to avoid overfitting. Therefore, the MaxEnt model maximizes the processing of log-likelihood. If the event occurs m times within the study area, the difference between the log-likelihood and the regularization should be maximized, which is expressed as follows:
where βj is the regularization parameter of the jth feature fj. The maximum entropy model finds that the Gibbs distribution not only conforms to the existing data but also has good generalization significance.
Data Processing and Parameter Settings
The landslide susceptibility mapping based on the MaxEnt model mainly included the following steps.
1 Building an assessment index system: collecting landslide database elements, such as geological maps, digital elevation models, and other data, to determine the evaluation index system;
2 Data preprocessing in the QGIS platform: making the coordinate system of all evaluation indicators uniform, determining the type and size of the evaluation unit, and outputting it in an ASCII format;
3 Importing the MaxEnt software for calculation: importing the indicators obtained in the previous step and setting the training and verification ratio, and training times;
4 Landslide susceptibility classification and analysis: the calculation results were imported into the GIS platform, and the natural breakpoint method was used for susceptibility classification to achieve the landslide susceptibility mapping in the study area. The specific process is shown in Figure 2.
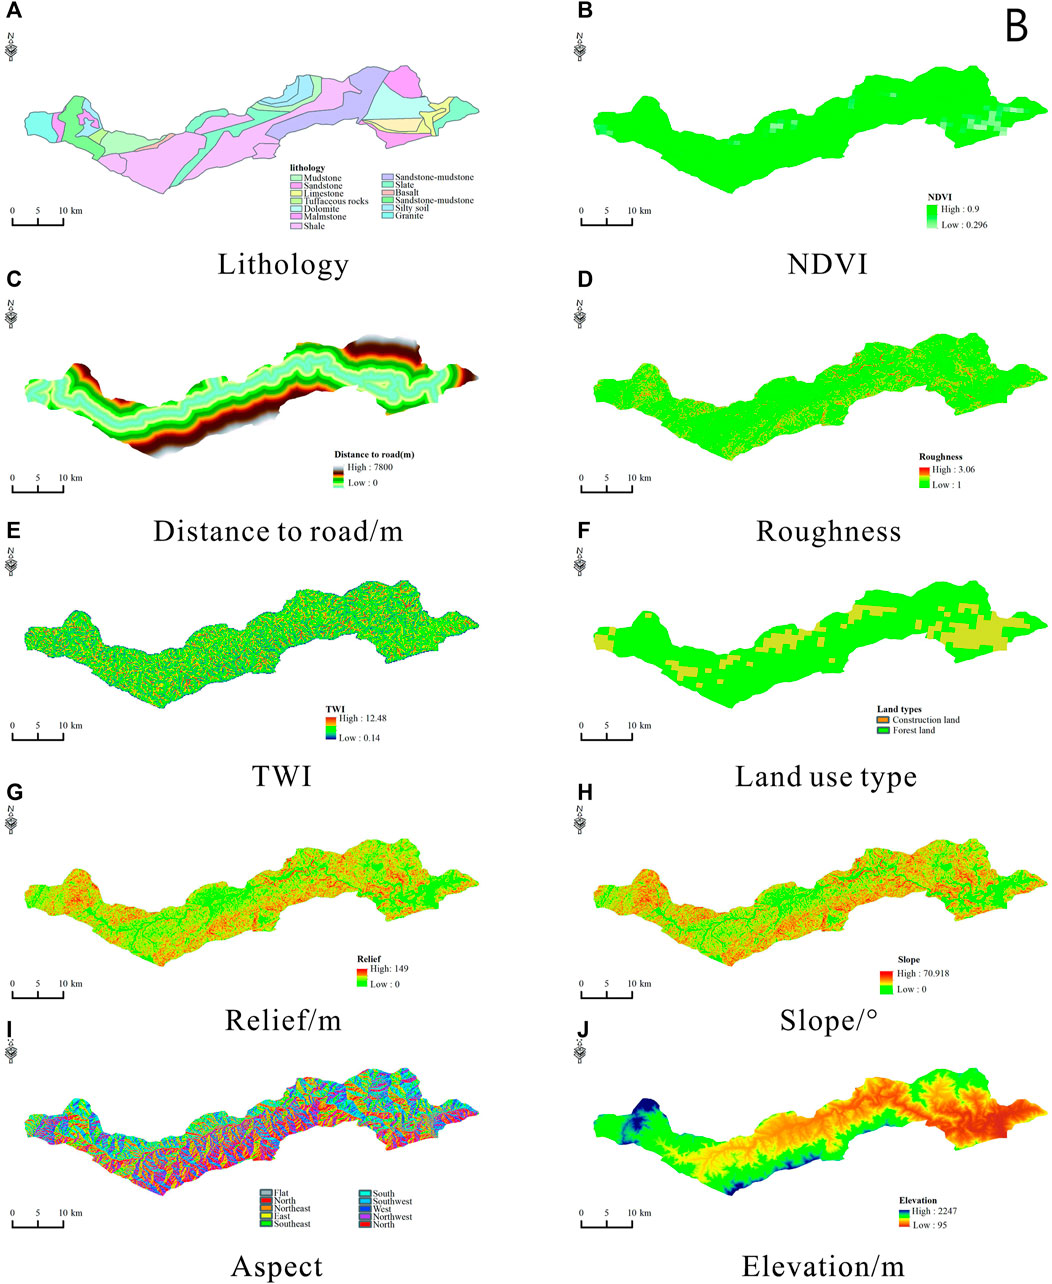
FIGURE 2. Landslide condition factors. (A) Lithology, (B) NDVI, (C) distance to road, (D) roughness, (E) TWI, (F) land use type, (G) relief, (H) slope, (I) aspect and (J) elevation.
The data source of used indexes in this study is given in Table 2. All the layers are resampled to 30 m resolution on the pixel. All the indicators can be seen in Figure 2. The quantitative evaluation of the landslide susceptibility could be achieved by setting the distribution ratio of the training data and the verification data, the number of training times, and the output type recommended by Merow et al. (2013). The main parameters that needed to be set were the data split ratio and the training times. The rest of the parameters were related options such as whether to produce the ROC curve and the output type. According to the previous studies (Merow et al., 2013; Chen et al., 2017; Reichenbach et al., 2018), 80% of the landslide data of the 126 landslides, about 111 landslides, were used for the training of the model, and the remaining 20% landslide were used for the verification model. The number of training times for the model was 100. The calculation output type was a logical calculation, and the output format was the ASCII type. The line for jackknife analysis options was selected (Figure 3).
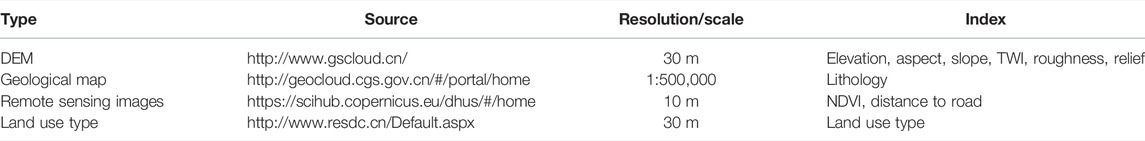
TABLE 2. Data source.
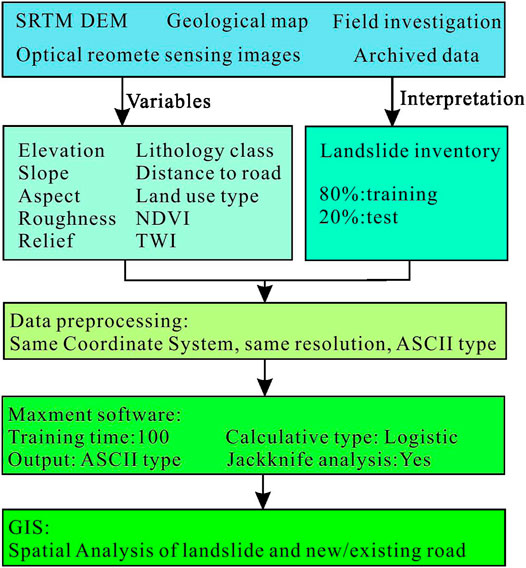
FIGURE 3. Flowchart of landslide susceptibility mapping using the MaxEnt model.
Results
Accuracy of Model Training and Testing
Using the receiver operating characteristic curve and the area under the curve, the model accuracy and the partition results were tested. As shown in Figure 4, the training model value reached 80.2%, and the verification accuracy reached 82.1%. According to the evaluation standard of the ROC–AUC value (Reichenbach et al., 2018), the value of the ROC–AUC was good when the value was calculated between 0.8 and 0.9. Therefore, both model training and verification achieved good prediction accuracy, and the results had a certain credibility.
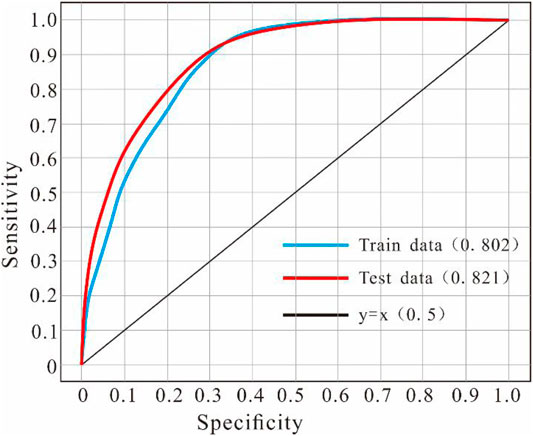
FIGURE 4. Analysis of the ROC curves of the train and test data.
Landslide Susceptibility Mapping
The calculated value of the MaxEnt model was in the range from 0 to 1. The larger the value was, the greater chance there was that the landslide was prone to happen. The results were divided into five categories using the natural breakpoints, namely, the very low-susceptibility area (0–0.144), low-susceptibility area (0.114–0.296), medium-susceptibility area (0.296–0.436), high-susceptibility area (0.436–0.584), and very high-susceptibility area (0.584–0.993). The spatial distribution of the landslide susceptibility grades is shown in Figure 5. It can be seen that very high-susceptibility areas of landslides were mainly distributed on two sides of the middle section of the newly built line, and the ends of the east and west sides near the cities experienced heavy human activity. The very low- and low-susceptibility areas were distributed in places without human influence or with few human influences.
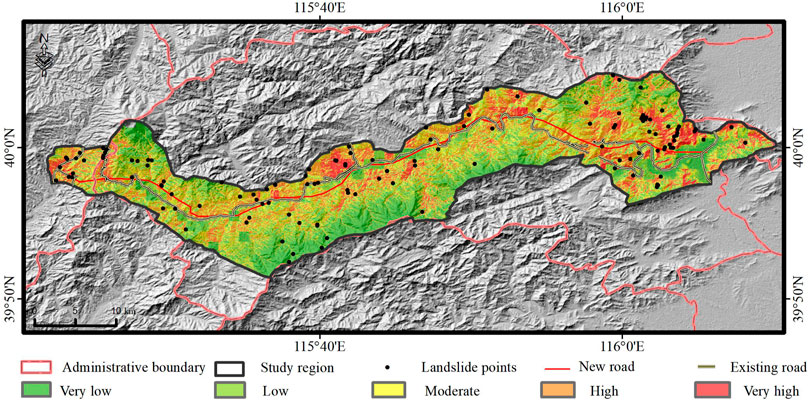
FIGURE 5. Landslide susceptibility map.
With the help of grid statistical analysis tools on the GIS platform, the areas of different levels can be quantified. As shown in Figure 6, very low-susceptibility landslide-prone areas accounted for 2% of the total, the low-susceptibility landslide-prone areas accounted for 10%, the medium-susceptibility landslide-prone areas accounted for 16%, the high-susceptibility landslide-prone areas accounted for 32%, and the area of very high-susceptibility level accounted for 40%. In the results of the landslide susceptibility mapping, 90 (72%) of the 126 landslides were located in two categories: high-susceptibility area and very high-susceptibility area.
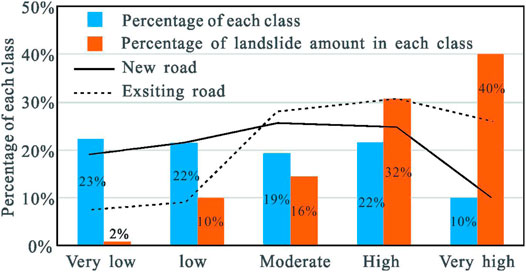
FIGURE 6. Percentages of landslides and road lengths for each landslide susceptibility level.
At the same time, to better evaluate the usefulness of the results, we used the %LRclass index to evaluate the prediction performance. The criterion of the %LRclass index was defined according to the area ratio of each grade predicted by the model and the proportion of predicted landslide points. The greater the value of %LRclass was, the better the prediction result of the model would be. This index %LRclass = S/A, where S is the proportion of landslide sites in each stability grade and A is the area of each stability grade predicted by the model. After calculating the index to be 2.25, it was determined that the evaluation results had an excellent performance (Chen et al., 2017; Viet et al., 2018). Therefore, the assessment results were comprehensively evaluated in terms of the performance of the model from different aspects. All the results showed good directness, and they could be used to support linear engineering optimization.
Quantitative Analysis of Susceptibility of New and Old Highways
Using the GIS extraction tool, the pixels of the different susceptibility levels of the new and old highways were passed through. It was found that for the new highway, as marked by a continuous dark line in Figure 7, only 10% was in the very high-susceptibility area, and the other four levels were distributed evenly, at about 20%. However, for the old highway, as marked by a dash dark line in Figure 7, 26% of the highway was in a very high level, 32% was in the high-susceptibility areas, 25% was in the medium-susceptibility areas, and the low- and very low-susceptibility areas together only made up 17%. Therefore, the newly built road faced fewer threats than the old road, especially in very high- and high-susceptibility regions, which had reduced threats of about 16% and 13%, separately, which also supported the necessity of building the proposed road and the rationality of the new route selection work.
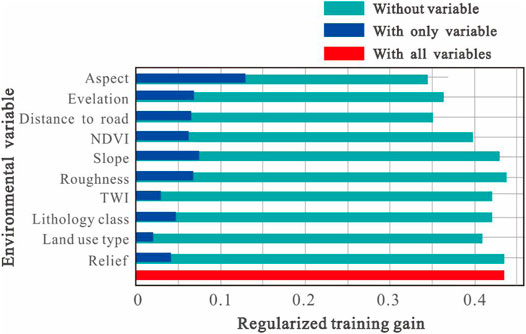
FIGURE 7. Contribution of different indexes to landslide susceptibility results.
Discussion
Evaluation of the Contribution of Different Factors to the Model
Selecting the jackknife option in the MaxEnt model could reveal the impact of different evaluation indicators on the susceptibility evaluation results (Merow et al., 2013; Chen et al., 2017). After the calculation of the changing relationship between one index and the corresponding ROC value, the contribution rates of all the assessed indexes could be exported. As shown in Figure 6, all the indexes for the evaluation results were greater than zero, indicating that all of the indicators had certain roles for the model. Additionally, it could be seen that the six indexes, namely, the slope, aspect, distance from the road, NDVI, elevation, surface roughness, and land use type, had nearly a 90% impact on the landslide evaluation results in total, while the other indexes contributed less to the landslide rate.
The results of this analysis were consistent with field surveys and related experiences (Su et al., 2021). The slope aspect affected the weathering of the rock and soil, which in turn affected the internal mass movement after the infiltration of rainwater. The distance from the road reflected the negative effect of human activities on the local environment. The NDVI represented the ecological restoration after the occurrence of landslides (Tehraniand Janalipour, 2020). Sparser than the stable slope area, the corresponding NDVI value was also smaller, and it could thus be used to distinguish the landslide area and the non-landslide area (Tehrani et al., 2021). The elevation affected the in situ stress distribution, weathering, and other factors of the slope. The surface roughness indicated the difference between the landslide occurrence area and the non-landslide area after mass transport.
Earthquake and Road Construction
The facts determined by Hakan (2022) are interesting and remarkable. Compared with the study area in Arhavi and this research, it was clearly shown that the roads passed through different landforms and construction technology (Tanyas et al., 2020). The former road was mainly located on the mountainside, which caused two more types of damage to the upper and lower slopes, compared to the majority on the slope toe in the road for this research. At the same time, the road in this research was planned to have a low retaining wall at the foot of the slope influenced by cutting regions and vegetation recovery actions, rather than simply leaving the soil and rock exposed.
It should be noted that while humans have caused many deadly landslides for engineering projections, there have also been numerous conveniences for people’s lives. However, compared with earthquake-induced landslides that have almost occurred during a short period, road-related landslides need a longer time to evolve to an unstable status. Hence, this provides more time and opportunities to prevent unfortunate events. Previously determined facts (Fan et al., 2019b; 2019c) have strongly proven that proper low-cost monitoring equipment can achieve successful landslide warnings before landslide failure to prevent property damage.
At the same time, as shown in Figure 7, the new road shows a better situation than the existing road from the aspect of length percentages in different susceptibility levels, but it should be noted that the situation may change from a low threat to a middle or high threat with new road and frequency of human activities involved.
Conclusion
Taking the China National Highway 109 New Line Expressway (Beijing Sixth Ring Road-City Boundary Section) project as an example, in this research, the watersheds on both sides of the non-traditional line were used as the evaluation boundary; the landslide susceptibility evaluation index of 10 evaluation indicators for 126 landslides was constructed. The system adopted the machine learning MaxEnt model to evaluate the susceptibility mapping of landslide geological hazards along the way. To support linear engineering optimization, the landslide susceptibility zoning of the old and the new roads was analyzed, which provided a theoretical basis for route optimization and route selection. The main conclusions were as follows:
1) The MaxEnt models performed well for landslide susceptibility mapping. The training and verification accuracies of the landslide susceptibility mapping based on the GIS and MaxEnt models reached 80.2% and 82.1%, respectively. At the same time, the %LRclass index was used to verify the results, and the value was 2.25, which also proved the validity of the result. This further revealed that the MaxEnt model used for the spatial assessment of vegetation and animal analysis could also be applied to landslide susceptibility mapping across disciplines.
2) The use of the jackknife tool could reveal the different index contributions to landslide susceptibility mapping. In this research, the landslides were mainly affected by the slope, aspect, distance from road, NDVI, elevation, roughness, and land use type, and their cumulative contribution rate reached 90%.
3) Landslide susceptibility mapping could be used to support linear engineering optimization. After the completion of the susceptibility mapping, the relationships between the newly planned routes and the existing roads passing through the different landslide susceptibility levels were innovatively calculated. Overall, 24% of the newly built roads were located in the high-susceptibility area, and 10% were located in the very high-susceptibility area. Furthermore, 26% of the existing roads were in the very high-susceptibility area, and 32% were in the high-susceptibility area.
Data Availability Statement
The raw data supporting the conclusion of this article will be made available by the authors, without undue reservation.
Author Contributions
JS completed all the work.
Conflict of Interest
The author declares that the research was conducted in the absence of any commercial or financial relationships that could be construed as a potential conflict of interest.
Publisher’s Note
All claims expressed in this article are solely those of the authors and do not necessarily represent those of their affiliated organizations, or those of the publisher, the editors and the reviewers. Any product that may be evaluated in this article, or claim that may be made by its manufacturer, is not guaranteed or endorsed by the publisher.
Acknowledgments
The author acknowledges LetPub (www.letpub.com) for linguistic assistance during the preparation of this manuscript.
References
Baum, R. L., and Godt, J. W. (2010). Early Warning of Rainfall-Induced Shallow Landslides and Debris Flows in the USA. Landslides 7 (3), 259–272. doi:10.1007/s10346-009-0177-0
Chen, W., Chen, X., Peng, J., Panahi, M., and Lee, S. (2021). Landslide Susceptibility Modeling Based on ANFIS with Teaching-Learning-Based Optimization and Satin Bowerbird Optimizer. Geosci. Front. 12 (1), 93–107. doi:10.1016/j.gsf.2020.07.012
Chen, W., and Li, Y. (2020). GIS-based Evaluation of Landslide Susceptibility Using Hybrid Computational Intelligence Models. Catena 195, 104777. doi:10.1016/j.catena.2020.104777
Chen, W., Pourghasemi, H. R., Kornejady, A., and Zhang, N. (2017). Landslide Spatial Modeling: Introducing New Ensembles of Ann, Maxent, and Svm Machine Learning Techniques. Geoderma 305, 314–327. doi:10.1016/j.geoderma.2017.06.020
Das, I., Stein, A., Kerle, N., and Dadhwal, V. K. (2011). Probabilistic Landslide hazard Assessment Using Homogeneous Susceptible Units (Hsu) along a National Highway Corridor in the Northern Himalayas, india. Landslides 8 (3), 293–308. doi:10.1007/s10346-011-0257-9
Fan, X., Domènech, G., Scaringi, G., Huang, R., Xu, Q., Hales, T. C., et al. (2018). Spatio-temporal Evolution of Mass Wasting after the 2008 Mw 7.9 Wenchuan Earthquake Revealed by a Detailed Multi-Temporal Inventory. Landslides 15, 2325–2341. doi:10.1007/s10346-018-1054-5
Fan, X., Scaringi, G., Korup, O., West, A. J., Westen, C. J., Tanyas, H., et al. (2019a). Earthquake‐Induced Chains of Geologic Hazards: Patterns, Mechanisms, and Impacts. Rev. Geophys. 57 (2), 421–503. doi:10.1029/2018rg000626
Fan, X., Xu, Q., Alonso-Rodriguez, A., Subramanian, S. S., Li, W., Zheng, G., et al. (2019b). Successive Landsliding and Damming of the Jinsha River in Eastern Tibet, china: Prime Investigation, Early Warning, and Emergency Response. Landslides 16, 1003–1020. doi:10.1007/s10346-019-01159-x
Fan, X., Xu, Q., Liu, J., Subramanian, S. S., He, C., Zhu, X., et al. (2019c). Successful Early Warning and Emergency Response of a Disastrous Rockslide in Guizhou Province, china. Landslides 16 (12), 2445–2457. doi:10.1007/s10346-019-01269-6
He, J. Y., Qiu, H. J., Qu, F. H., Hu, S., Yang, D., Shen, Y., et al. (2020). Prediction of Spatiotemporal Stability and Rainfall Threshold of Shallow Landslides Using the Trigrs and Scoops3d Models. Catena 197, 104999. doi:10.1016/j.catena.2020.104999
Huang, J., Mowen, X., and Atkinson, P. M. (2020). Dynamic Susceptibility Mapping of Slow-Moving Landslides Using Psinsar. Int. J. Remote Sensing 41 (19), 7509–7529. doi:10.1080/01431161.2020.1760398
Intrieri, E., Gigli, G., Mugnai, F., Fanti, R., and Casagli, N. (2012). Design and Implementation of a Landslide Early Warning System. Eng. Geology. 147-148, 124–136. doi:10.1016/j.enggeo.2012.07.017
Janalipour, M., Abbaszadeh Tehrani, N., Shafri, H. Z. M., Salehi, S., Mohammadzadeh, A., and Ghasemi, S. (2021). Satellite-based Monitoring of lake Urmia basin Health with Focus on its Ecosystem Regulating Services by Applying Total Ecosystem Health (TEH) Model. Int. J. Environ. Sci. Technol 18, 3427–3440. doi:10.1007/s13762-021-03786-1
Keefer, D. K., Wilson, R. C., Mark, R. K., Brabb, E. E., Brown, W. M., Ellen, S. D., et al. (1987). Real-Time Landslide Warning during Heavy Rainfall. Science 238 (4829), 921–925. doi:10.1126/science.238.4829.921
Laimer, H. J. (2017). Anthropogenically Induced Landslides - A challenge for Railway Infrastructure in Mountainous Regions. Eng. Geology. 222, 92–101. doi:10.1016/j.enggeo.2017.03.015
Li, Y., Wang, X., and Mao, H. (2020). Influence of Human Activity on Landslide Susceptibility Development in the Three Gorges Area. Nat. Hazards 104, 2115–2151. doi:10.1007/s11069-020-04264-6
Lin, Q., and Wang, Y. (2018). Spatial and Temporal Analysis of a Fatal Landslide Inventory in China from 1950 to 2016. Landslides 15 (12), 2357–2372. doi:10.1007/s10346-018-1037-6
Liu, C. (2004). Methods and Application of Early Warning of Geo-Hazards in China. Geotechnical Eng. Word 7 (7), 16–17.
Maharjan, S., Gnyawali, K. R., Tannant, D. D., Xu, C., and Lacroix, P. (2021). Rapid Terrain Assessment for Earthquake-Triggered Landslide Susceptibility with High-Resolution DEM and Critical Acceleration. Front. Earth Sci. 9, 689303. doi:10.3389/feart.2021.689303
Merow, C., Smith, M. J., and Silander, J. A. (2013). A Practical Guide to MaxEnt for Modeling Species' Distributions: what it Does, and Why Inputs and Settings Matter. Ecography 36, 1058–1069. doi:10.1111/j.1600-0587.2013.07872.x
Osanai, N., Shimizu, T., Kuramoto, K., Kojima, S., and Noro, T. (2010). Japanese Early-Warning for Debris Flows and Slope Failures Using Rainfall Indices with Radial Basis Function Network. Landslides 7 (3), 325–338. doi:10.1007/s10346-010-0229-5
Qu, F., Qiu, H., Sun, H., and Tang, M. (2020). Post-failure Landslide Change Detection and Analysis Using Optical Satellite sentinel-2 Images. Landslides 18 (1), 447–455. doi:10.1007/s10346-020-01498-0
Rahmati, O., Pourghasemi, H. R., and Melessec, A. M. (2016). Application of Gis-Based Data Driven Random forest and Maximum Entropy Models for Groundwater Potential Mapping: a Case Study at Mehran Region, iran. Catena 137, 360–372. doi:10.1016/j.catena.2015.10.010
Reichenbach, P., Rossi, M., Malamud, B. D., Mihir, M., and Guzzetti, F. (2018). A Review of Statistically-Based Landslide Susceptibility Models. Earth-Science Rev. 180, 60–91. doi:10.1016/j.earscirev.2018.03.001
Remondo, J., Bonachea, J., and Cendrero, A. (2005). A Statistical Approach to Landslide Risk Modelling at basin Scale: from Landslide Susceptibility to Quantitative Risk Assessment. Landslides 2 (4), 321–328. doi:10.1007/s10346-005-0016-x
Su, Q., Tao, W., Mei, S., Zhang, X., Li, K., Su, X., et al. (2021). Landslide Susceptibility Zoning Using C5.0 Decision Tree, Random Forest, Support Vector Machine and Comparison of Their Performance in a Coal Mine Area. Front. Earth Sci. 9, 781472. doi:10.3389/feart.2021.781472
Tanyas, H., Gorum, T., Kirschbaum, D. B., and Lombardo, L. (2020). Could Road Constructions Be More Disastrous Than an Earthquake in Terms of Landsliding? Earth's Future 12, 127–143. doi:10.1002/essoar.10503922.1
Tehrani, N. A., and Janalipour, M. (20202020). Predicting Ecosystem Shift in a Salt Lake by Using Remote Sensing Indicators and Spatial Statistics Methods (Case Study: Lake Urmia basin). Environ. Eng. Res. 26 (4), 225. doi:10.4491/eer.2020.225
Tehrani, N. A., Shafri, H. Z. M., Salehi, S., Chanussot, J., and Janalipour, M. (2021). Remotely-Sensed Ecosystem Health Assessment (RSEHA) Model for Assessing the Changes of Ecosystem Health of Lake Urmia Basin. Int. J. Image Data Fusion 26 (26), 1–14. doi:10.1080/19479832.2021.1924880
Teimouri, M., and Nalivan, O. A. (2020). Susceptibility Zoning and Prioritization of the Factors Affecting Landslide Using MaxEnt, Geographic Information System and Remote Sensing Models (Case Study: Lorestan Province). Hydrogeomorphology 6 (21), 155–179. doi:10.22092/ijwmse.2020.126344.1658
Tran, T. V., Alvioli, M., Lee, G., and An, H. U. (2018). Three-dimensional, Time-dependent Modeling of Rainfall-Induced Landslides over a Digital Landscape: a Case Study. Landslides 15 (6), 1071–1084. doi:10.1007/s10346-017-0931-7
Wang, Y., Zhang, M.-s., Xue, Q., and Wu, S.-d. (2018). Risk-based Evaluation on Geological Environment Carrying Capacity of mountain city - A Case Study in Suide County, Shaanxi Province, China. J. Mt. Sci. 15 (12), 2730–2740. doi:10.1007/s11629-017-4798-9
Zhang, S., and Zhang, L. M. (2014). Human Vulnerability to Quick Shallow Landslides along Road: Fleeing Process and Modeling. Landslides 11 (6), 1115–1129. doi:10.1007/s10346-014-0468-y
Keywords: landslide susceptibility mapping, MaxEnt (maximum entropy), landslide, highway, maximum entropy model
Citation: Shi J (2022) Engineering Application of Landslide Susceptibility Mapping in Linear Engineering Optimization. Front. Earth Sci. 10:861057. doi: 10.3389/feart.2022.861057
Received: 24 January 2022; Accepted: 21 March 2022;
Published: 12 April 2022.
Edited by:
Xuanmei Fan, Chengdu University of Technology, ChinaReviewed by:
Milad Janalipour, K. N. Toosi University of Technology, IranGaetano Pecoraro, University of Salerno, Italy
Copyright © 2022 Shi. This is an open-access article distributed under the terms of the Creative Commons Attribution License (CC BY). The use, distribution or reproduction in other forums is permitted, provided the original author(s) and the copyright owner(s) are credited and that the original publication in this journal is cited, in accordance with accepted academic practice. No use, distribution or reproduction is permitted which does not comply with these terms.
*Correspondence: Jinchang Shi, U2hpSkMwMDdAMTYzLmNvbQ==