 Ágnes Rostási1,2Boglárka Anna Topa3,4Fruzsina Gresina5,6Tamás G. Weiszburg3,7András Gelencsér1,2
 György Varga5*
- 1MTA-PE Air Chemistry Research Group, Veszprém, Hungary
- 2Air Chemistry Research Group, University of Pannonia, Veszprém, Hungary
- 3Department of Mineralogy, Eötvös Loránd University, Budapest, Hungary
- 4Institute of Mineralogy and Geology, University of Miskolc, Miskolc, Hungary
- 5Geographical Institute, Research Centre for Astronomy and Earth Sciences, Budapest, Hungary
- 6Department of Environmental and Landscape Geography, Eötvös Loránd University, Budapest, Hungary
- 7Environmental Science Department, Sapientia Hungarian University of Transylvania, Cluj-Napoca, Romania
Changes in circulation patterns associated with climate change have led to an increase in the frequency and intensity of Saharan dust events (SDEs) in the Carpathian Basin. The annual number of dust events was 4.2 on average between 1979 and 2010, while in the period of 2011–2018, it has increased to 10.3. This study presents a quantitative assessment of wet deposition of dust particles to Lake Balaton (Central Europe) with mineralogical and particle size distribution measurements. In addition to a comprehensive, systematic SDE identification process, rainwater samples were collected in 2016, and the particles on the filters were characterised using a range of analytical techniques. The atmospheric transport of particulates and moisture was evaluated using HYSPLIT Lagrangian trajectory model. XRD measurements revealed that during these events, the major minerals were quartz, kaolinite and 10-Å phyllosilicates. In addition, mineralogical source markers of arid dust (palygorskite and smectite) were also identified in majority of the analysed samples. Based on the results, wet deposition fluxes of dust particles were estimated for the region. 2016 was a typical and representative year for the decade, with twelve identified dust episodes. The synoptic patterns of the events fit well with the typical meteorological character of the North African dust intrusions with enhanced atmospheric meridionality described earlier. From the twelve episodes of 2016, seven were depositional events when wet deposition could be observed at ground level. Dust material of five episodes was analysed in detail, while particles of the two February wet deposition episodes were only granulometrically characterised. General uncertainties that hinder the characterisation of mineral dust in climate models were also observed in the granulometric and dust flux data of the sampled material. The particle size of the deposited dust was coarser than the upper cut-off level of grain size of the models. In addition, the discrepancies between measured and simulated deposition values clearly demonstrated the incorrect representation of dust flux in numerical simulations (partly due to inaccurate grain size data in the models).
1 Introduction
The emission of mineral dust from continents is an essential source of solid particles in the atmosphere. These particles are entrained into the atmosphere by the process of deflation from poorly vegetated surfaces. Fine-grained particles are generally lifted to higher altitudes and may have longer atmospheric residence time, up to a few weeks (Pye, 1987). The presence of atmospheric dust influences the energy budget of the Earth via scattering and absorbing the incoming solar radiation (Claquin et al., 1999; Balkanski et al., 2007). Aerosol particles, via the modification of cloud properties and reduction of surface temperature, are also playing a role in the alteration of synoptic system patterns (Barkan et al., 2004; 2005). Dust particles can become coated with water-soluble secondary species (Wurzler et al., 2000), thus altering their hygroscopic growth and their ability to act as cloud condensation nuclei (Yu et al., 2006). The desert dust particles serve as nutrients with important environmental consequences for both terrestrial (Swap et al., 1992; Muhs et al., 2007; Yu et al., 2015) and marine (Lenes et al., 2001; Walsh and Steidinger, 2001) ecosystems. They have the potential to affect the biogeochemical cycle through their trace metal content (Engelstaedter et al., 2006), such as iron which is the limiting nutrient in many oceanic ecosystems (Jickells et al., 2005). Atmospheric dust deposition in lakes could have a substantial impact on the sediment budget of lakes, this is especially true for shallow lakes with relatively large surface areas (e.g., Lake Balaton, the largest Central European lake).
The annual global emission flux of desert dust was estimated to be in the order of the range between 1 and 3 Pg (Tegen et al., 1996; Mahowald et al., 1999; Ginoux et al., 2001; Mahowald et al., 2006). The Sahara is known to be the largest single source of windblown crustal material (Ginoux et al., 2001; Pósfai and Buseck, 2010). The mass concentration of dust in the European atmosphere significantly increases by periodical Saharan dust episodes.
Saharan dust episodes have become a common atmospheric phenomenon in spring and early summer (Dulac et al., 1996). These events are usually induced by convective systems when high atmospheric currents of southern amplitude are likely. The leading edge of transported dust and other mineral constituent is generally over a kilometre in height and several kilometres in length (Hjelmroos et al., 1994; Ross et al., 2004). Most of the Sahara-derived dust particles deposit locally, but a significant fraction is transported over large areas of the North Atlantic and the Mediterranean. Aeolian dust from North Africa is regularly observed in the Mediterranean region (Israelevich et al., 2002; Barkan et al., 2005; Israelevich et al., 2012; Varga et al., 2014; Rodriguez-Navarro et al., 2018). It can often be detected further to the north, e.g., over the British Isles (Wheeler, 1986), Germany (Klein et al., 2010), Scandinavia (Franzén et al., 1994; Barkan et al., 2005) and Central Europe (Borbély-Kiss et al., 2004; Koltay et al., 2006; Szoboszlai et al., 2009).
Changing nature of dust episodes indicates changing climatic and other environmental processes. In Central Europe, an increasing frequency of Saharan dust episodes was observed in the last decade (Varga, 2020). In the background of this phenomenon, the high-amplitude southerly sinking of the high-altitude air masses is thought which causes intense North African outflow and meridional transport (Varga, 2020). In general, the atmospheric concentration of coarse dust particles is generally low in Central Europe, except for episodic dust storms related to cold fronts at the beginning of the vegetation period in the early spring (Varga et al., 2013). Still, Central Europe can be found in the D1b zone of the “Saharan dust-fall map” by Stuut et al. (2009), indicating that North African dust material can be incorporated into the soils, increasing their fine silt content.
The Hybrid Single-Particle Lagrangian Integrated Trajectory (HYSPLIT) allows air parcel to be tracked backwards in time from the precipitation event, calculate changes in physical properties and provide information about transport routes involved (Stein et al., 2015; Rolph et al., 2017). The actual mass contribution transported along the selected trajectory strongly depends on the history of the air masses. Among the main factors, there are the duration of the transport, meteorological factors along the route, and the additional aerosol sources along the transport path (Borbély-Kiss et al., 2004). Alteration in the moisture content provides an estimate of where the source region evaporation occurred. The model has been successfully applied in several previous studies, including tracking changes in atmospheric circulation (Sjostrom and Welker 2009; Gustafsson et al., 2010; Dumitru et al., 2016; Bottyán et al., 2017; Krklec et al., 2018; Zhang et al., 2020). This atmospheric calculation model is a useful tool in our observations for studying the moisture pathways. The technique is suitable to provide detailed information about the possible moisture source regions and determine transport path from the Atlantic, Mediterranean, Eastern and Northern sectors to the Central European region leading to the observed events.
Increasing frequency and intensity of Saharan dust events in the Carpathian Basin were reported by previous studies (e.g., Varga et al., 2013; Varga et al., 2014; Varga, 2020). By identification and sampling of these episodes, we also provide a comprehensive characterisation of Central European washout events with regard to synoptic meteorology, mineralogical phase composition and particle size distribution. The goal of the sampling campaign (MARS—MAss of Rain-originated Solid phases) of this study was to quantify and characterise (granulometry, mineralogy) the filterable solid phase of precipitation and to give a measurement-based estimate for the deposited dust. The focus area of this study was Lake Balaton which enabled the estimation of the contribution of Saharan dust events to ist sediment budget.
2 Materials and Methods
2.1 Study Area
The Carpathian Basin (CB: 45°–48.5° N, 16°–23° E), including Hungary with an area of 93,036 square kilometres, is approximately equidistant from the Equator and the Arctic Circle in the temperate zone (Figure 1). The surrounding mountain belt of the Carpathians, Alps and Dinarides forms a natural barrier between temperate Central Europe, the colder continental Eastern Europe, as well as the warm, dry Balkan (Spinoni et al., 2014). The sampling site is located in the central Carpathian Basin and is situated on the northern shore of Lake Balaton with latitude 46°58′29.9″N and longitude 17°55′38.3″E (Figure 1). Dust material samplings of two intense February 2016 wet depositional events were performed as part of a permanent dust sampling program running in Budapest. The basin character determines the main geographical features: weak vertical articulation and low altitude. Due to the considerable distance from the Atlantic Ocean (1,300–1700 km), the climate of the Carpathian Basin is drier than that of the Western European areas. The basin territory lies at the border of Atlantic, Mediterranean and continental climate zones. This specific position determines the general climate and the continuously changing atmospheric systems have a significant impact on regional meteorological events (Stevens et al., 2011). The regional climate model predicts temperature-related changes manifest in general warming conditions and seasonally large distribution in precipitation (Krüzselyi et al., 2011). The influence of Mediterranean climate features will be strengthened in the Carpathian Basin (Spinoni et al., 2014; Kis et al., 2017).
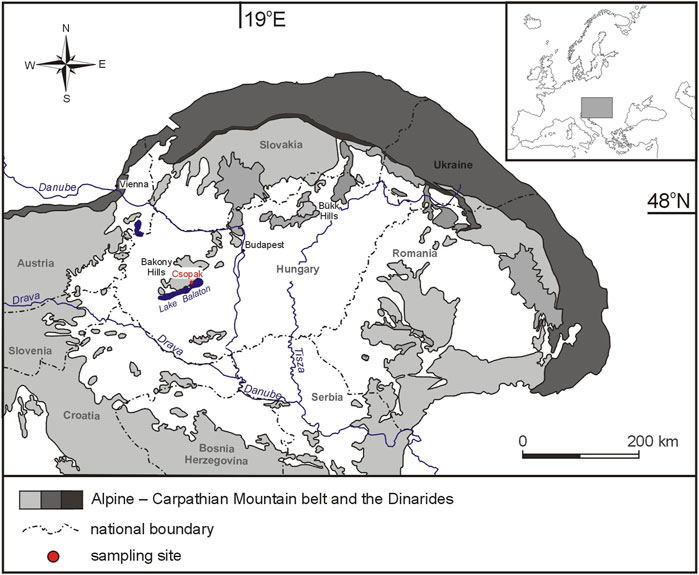
FIGURE 1. Geologic framework of the Carpathian–Pannonian area (modified after Csontos & Nagymarosy 1998) and map of sampling location.
The above-mentioned significance of dust deposition into shallow lakes has also an important role in the case of sediment budget of Lake Balaton, the largest lake in Central Europe, on the shores of which the Csopak sampling station is located. Previous measurements and historical data have shown that a significant proportion of the lake’s sediment is aeolian in origin. Annual concentrations of settling dust were measured by the National Air Pollution Measurement Network at several locations around the lake until 2007, and only in Siófok after 2007 (summary studies of the Environmental Protection and Water Management Research Institute, 2007 and the Hungarian Meteorological Survey 2009). Based on these database no apparent relationship could be observed between the amounts of annual dust concentrations and precipitation; 2003 and 2009 were extremely dry years but the annual dust concentrations did not show outstanding values (average for 2002–2017: 5.10 g/m2/30 days; 2003: 4.51 g/m2/30 days; 2009: 3.20 g/m2/30 days). We calculated ∼33,000 tonnes per year annual average amount of atmospheric dust based on data from the 2002–2017 period.
2.2 Identification of Dust Events
A permanent Saharan dust monitoring program is running in the Research Centre for Astronomy and Earth Sciences, Budapest, Hungary. Combined application of satellite-borne aerosol products, numerical simulations, meteorological analyses and surface observation reports allowed the compilation of a more than 40 years long time series of dust events identified in the Carpathian Basin (Varga, 2020). Foremost, the standardised values of Aerosol Index of Ozone Monitoring Instrument (OMI—Daily Level 3 Gridded Products; OMTO3d) and Aerosol Optical Depth data of Terra and Aqua satellites (Combined Dark Target and Deep Blue AOD at 0.55 micron for land and ocean - MOD08_D3_v6; MYD08_D3_v6)) were calculated to select possible Saharan dust episodes. Additionally, Area-Averaged of Dust Column Mass Density simulations of MERRA-2 (M2T1NXAER.5.12.4) were applied to verify the AOD-based observations and complete the dust episode database with cloud-obscured days. Due to local aerosol emissions, these initial episodes have to be verified by the additional HYSPLIT backwards air mass trajectories, daily visibility-reducing surface weather reports of the potential source areas by Naval Research Laboratory (https://www.nrlmry.navy.mil/aerosol/#aerosolobservations) and Barcelona Dust Forecast Center’s dust load and deposition simulations (Non-hydrostatic Multiscale Model NMMB/BSC-dust model).
Monthly dust deposition data of NASA’s Modern-Era Retrospective analysis for Research and Applications, Version 2 (MERRA-2) model (Gelaro et al., 2017) were obtained from Giovanni application for visualisation and access Earth science remote sensing data platform (https://giovanni.gsfc.nasa.gov/giovanni/) provided by NASA Goddard Earth Sciences Data Information Services Center. Cumulative values of five size-bins provide information on dry and wet deposition in the study area, these were compared to measured solid-phase accumulation data.
2.3 Air Mass Trajectories
For atmospheric trajectory and dispersion calculations, HYSPLIT (HYbrid Single-Particle Lagrangian Integrated Trajectory) modelling was used (Draxler and Rolph, 2012), a software for predicting transport processes in the atmosphere and for simulating deposition (Stein et al., 2015). The backward trajectories used for estimation of air moisture source regions were modelled on the database provided by the Global Data Assimilation System (GDAS) with 1° spatial resolution. Backward trajectories of air parcels related to precipitation events were calculated for 48 h total run time back in time at three altitude ranges: 500–1,500 m, 1,500–3,000 m and 3,000–6,000 m. The model was run for the days when precipitation occurred, starting at that UTC hour when the real precipitation event began on the sampling site. To identify the source regions of water vapour, the trajectories were classified into sectors on the basis of the route involved. Four sectors were determined around our sampling site: 1) Northern Europe, 2) Eastern Europe, 3) Mediterranean region and 4) Atlantic region. A detailed description of the evaporative region calculation can be found in Bottyán et al. (2017). Main dust transport pathways were defined by using multiple endpoints from different heights (500–1,500 m; 1,500–3,000 m; 3,000–6,000 m a.g.l. [above ground level]).
2.4 Synoptic Meteorological Background
Based on Varga (2020) synoptic meteorological patterns associated with dust intrusion episodes were characterised by mean geopotential height (700 hPa) and wind vectors. Meridional and zonal flow maps were compiled for the event days using the Daily Mean Composite application of NOAA Earth System Research Laboratory (http://www.esrl.noaa.gov/psd/). According to previous studies, the 700 hPa level corresponds to a typical dust transport altitude (Alpert et al., 2004; Barkan et al., 2005; Varga et al., 2013, 2014). Surface air temperature anomalies (based on the 1981–2010 climatology) were also calculated using the gridded National Centers for Environmental Protection/National Center for Atmospheric Research (NCEP/NCAR) Reanalysis Project dataset (Kalnay et al., 1996) for Central Europe.
2.5 Sample Collection
In the period of 2016, overall, 74 precipitation events occurred in the sampling location, of which 46 samples were collected. Typically, with precipitation amounts less than 3 mm it was not possible to obtain a sufficient quantity of filtered solid material for subsequent analyses. Out of the rain samples, 5 were collected during incursions of dust-laden air masses originating from the Sahara. Rain sample collection was performed with care to ensure that no accidental contamination occurred during sampling. Evergreen hedge near the collector was routinely pruned to minimise catch errors from wind currents (Poreh and Mechrez, 1984). Samples were collected in clean polycarbonate plastic container on a 40 cm-raised, concrete ground platform to collect as many solid components as possible and to avoid rain splash as mentioned in standard literature (Salles et al., 2000; Lara et al., 2010; Chakraborty and Gupta, 2018). The collector was deployed just before the onset of rainfall and withdrawn immediately at the end of the event. All samples were transported to the laboratory shortly after collection. The membrane-filtered (mixed cellulose esters membrane/MCE; 47 mm diameter; 0.45 µm nominal pore size; types: Millipore, Prat Dumas) water samples were stored frozen. The filtered material was dried at 40°C, and its weight was measured and stored in a desiccator.
2.6 Mineralogical Analyses (XRD, SEM)
The mineral particles filtered from rainwater were determined by X-ray powder diffraction (XRD). The measurements were performed directly on the filters which were mounted to a silicon low background sample holder. XRD patterns were obtained with a Siemens D5000 instrument equipped with a graphite monochromator, using CuKα radiation (λ = 1.5406 Å), generator operating at 40 kV voltage and at 40 mA tube current. Detection covered the range 2–65°2ϑ with a step size of 0.05°2ϑ and counting time of 2 s.
The morphology and composition of mineral dust were determined by scanning electron microscopy (SEM). Observation of silt-size solid-phase by SEM has been carried out in high vacuum an accelerating voltage of 2 kV with an Everhart-Thornley Detector (FEI SE detector R580). The microstructure and morphology were tested by SEM coupled with energy-dispersive x-ray spectroscopy (SEM/EDS). An Apreo SEM (FEI/ThermoFischer Apreo S scanning electron microscope) equipped with Octane Elect Plus EDS (AMETEK) was used at 2 kV for imaging and 10 kV for determining the chemical composition.
2.7 Grain Size of Deposited Mineral Dust
The grain size of the collected mineral dust samples was determined by a Malvern Morphologi G3-ID automated static image analyser. Filtered mineral dust samples were dispersed by 4 bar compressed air onto the glass slide of the automated microscope with 60 s settling time, however, the filters were also scanned. The used ×20 objective lens provides a 40 pixel per μm2 resolution of the acquired images of each individual particles, suitable for the measurement of the particles sized between fine silt and fine sand. Two-dimensional imaging was amended with two additional vertical focal plane layers above and two others under the focus, equivalent to a total of 27.5 µm focal plane range.
On average, 50,000 high-resolution grayscale images of individual particles were processed to assemble a raw granulometric database with various grain size and shape parameters for every particle, completed with light transmissivity values and Raman correlation scores. A detailed description of the granulometric procedure can be found in Varga et al. (2018).
In most cases, even after very intense washout episodes, it was not possible to collect an appropriate amount (>0.1 g) of Saharan dust material for other grain size characterisation methods (e.g., for laser diffraction sizing).
3 Results
3.1 Meteorological Background of Saharan Dust Events and Dust Transport
Twelve dust episodes were identified in 2016 by combined application of satellite measurements, numerical simulations, backward trajectories and surface observation reports (Figure 2). In the case of seven episodes, no deposition could be noticed, only synoptic meteorology, transport routes and potential source area allocation is discussed here. Two intense washout events occurred before the onset of the systematic sampling at the Csopak site. Those samples were collected in Budapest, Hungary, and the characterisation by automated image analysis and Raman spectroscopy were performed. Five Saharan dust depositional events were observed at the Csopak site (Figure 3).
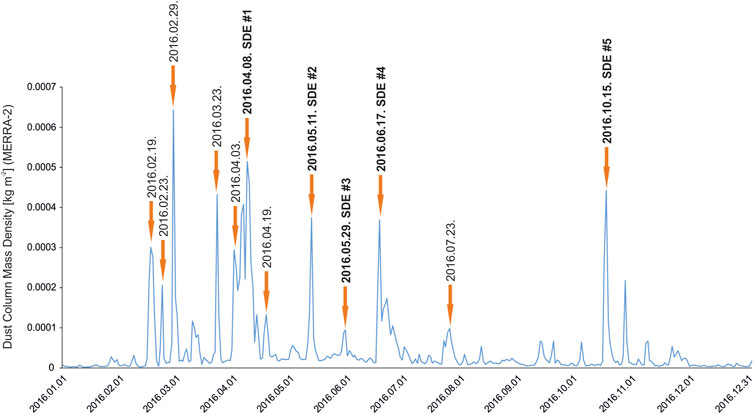
FIGURE 2. MERRA-2 Dust Column Mass Density data of the study area and the identified Saharan dust events.
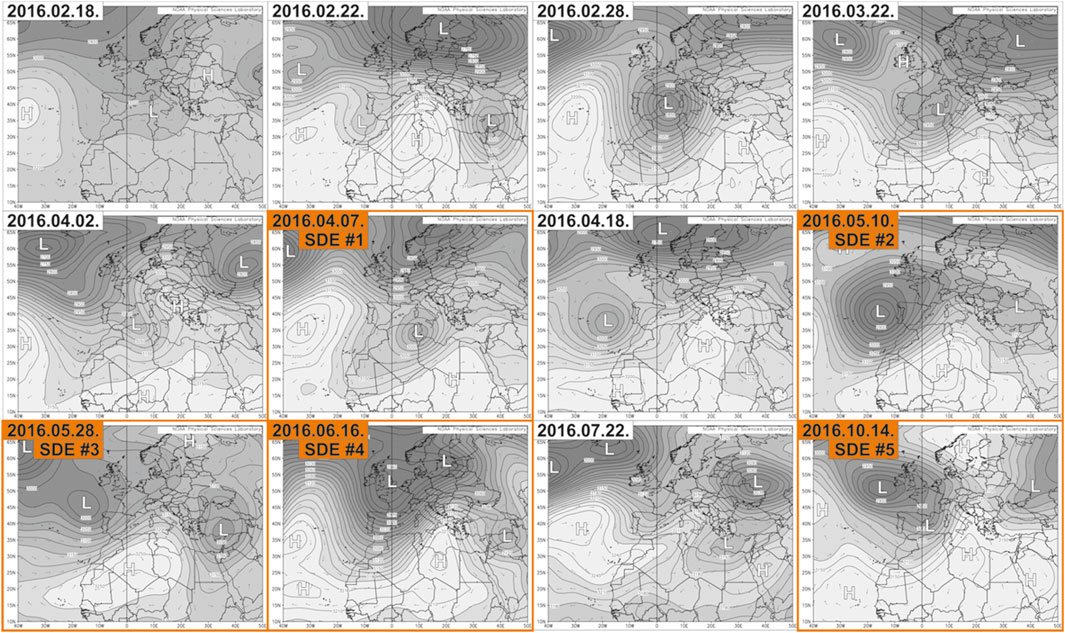
FIGURE 3. Synoptic meteorological background (mean geopotential height map and wind vectors at 700 hPa of the SDEs identified in the Carpathian Basin in 2016.
The majority of dust loaded air mass intrusions into the Carpathian Basin are caused by eastward-moving low-pressure systems developing over SW Europe and NW Africa and by Central Mediterranean cyclones (Figure 3). These meteorological set ups which are favorable for these events are also characterized by prominent ridge patterns. Based on the backward trajectories, the potential dust source areas of the discussed episodes might be located in the vicinity of the Atlas Mountains (Hautes Plaines, chott regions of the foreland of Saharan Atlas), from where strong winds of the penetrating cyclones emit a huge amount of dust into the atmosphere (Figure 4).
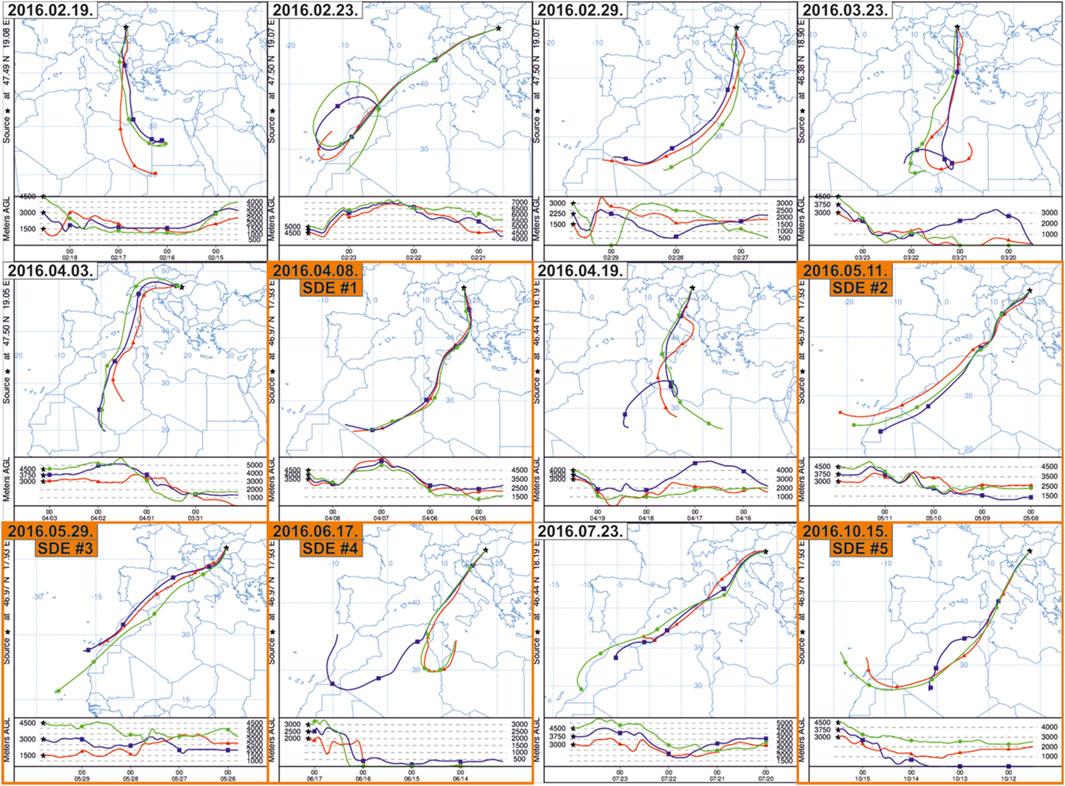
FIGURE 4. HYSPLIT backward trajectories of the SDEs identified in the Carpathian Basin in 2016.
The two most intense February episodes (23rd and 29th of February) were discussed in detail in previous studies (Varga et al., 2014; Varga, 2020). However, it is worth noting that both of these episodes were connected to the separated cut-off low of a deepened atmospheric through developed over the Iberian Peninsula. Daily precipitation totals for the 23 February event were 5–6 mm, while the 29 February washout episode was associated with 25 mm of rain. The deposited reddish-yellow dust blanketed exposed obstacles in Central Hungary. Among the sampled mineral material, a high volumetric proportion of larger than 50 µm giant dust particles could be identified in both cases. The Saharan dust events sampled in Csopak are the followings:
3.1.1 Saharan Dust Episode/SDE #1: 08 April 2016
A low-pressure system formed over northern Africa (Algeria), at the lee side of the Atlas Mountains on 05. April 2016 (Figure 3). According to the visibility-reducing surface weather reports of the Naval Research Laboratory, intense dust storms were developed in the next few days also in the central and northern regions of Lybia. The dust-loaded airmass was clearly visible over the Gulf of Sidra and Cyrenaica on MODIS images of NASA’s Aqua and Terra satellites. Airmasses with elevated dust concentration reached the Carpathian Basin at the foreside of the (north)eastward-moving shallow cyclone.
3.1.2 Saharan Dust Episode/SDE #2: 11/12 May 2016
In early May, intense dust storms were reported from the intramontane basins, foreland and Chott regions of the Atlas Mountains by the surface observations and very high dust concentrations were observed over the western and central basins of the Mediterranean region for several days. As a result of the strong meridional flow coupled to this situation, on 11–12 May 2016, precipitation with a large amount of Saharan dust fell again in the territory of Central Europe. On the front of a shallow, then increasingly deepening low-pressure atmospheric centre formed over SW Europe and NW Africa. The steep pressure gradient between the cyclonal system and the static high-pressure regions over the Sahara led to the strong southerly airflow.
3.1.3 Saharan Dust Episode/SDE #3: 29 May 2016
In late May, another dust washout episode was observed in Hungary, the synoptic background was similar to the SDE #2; South-westerly flow dominated the investigation area as a result of the pressure difference of an eastward propagating cyclone and the African high-pressure belt. The intramontane basins of Atlas were obscured by the dust storms, while areas of Chott Melrhir and Felrhir was also affected by the strong winds, surface reports recorded the dust.
3.1.4 Saharan Dust Episode/SDE #4: 19 June 2016
Rainfall on 19 June 2016 contained Saharan dust, which was well visible on car windshields and rain-exposed landmarks. The strongest south-western flow occurred between the high-pressure region from the northwest of the African continent to the Balkans and the undulating frontal zone bisecting Europe, which was later followed by an Italian-centered vortex. The source of the dust was the southern foreland of the Atlas.
3.1.5 Saharan Dust Episode/SDE #5: 15 October 2016
An autumn dust episode was also identified in 2016, on 15 October rainfall washed out a large amount of Saharan dust in the western part of Hungary. An extensive cyclone over Western Europe and its SW flow determined the synoptic situation of these days. A high-pressure blocking zone over the Central Mediterranean led to strong meridional winds on the warm sector of the low-pressure system carrying mineral dust from the Tunisian dry salt lakes (Chott Melrhir and Chott Jerid) to Central Europe.
3.2 Rain Amounts
Based on daily meteorological reports of the Hungarian Meteorological Survey (OMSZ), 469 mm of precipitation fell in the study area from April 2016 to March 2017. A total number of 46 rainy episodes were sampled (>3 mm) in Csopak during the sampling period (393 mm). Events with very low precipitation intensities were ignored in our study because of sampling and filtration difficulties. The measured cumulative precipitation volume was about 75% of the total annual precipitation reported for the site. The largest number of events within a single month was in June (11), followed by October 7) and August (6), and none was observed in March. Monthly average precipitation amounts during the campaign are shown in Figure 5A. The annual distribution of precipitation showed large variability. The highest total precipitation was collected in June followed by August and May. Table 1 presents the seasonal distribution of precipitation. Five individual SDEs were detected during the sampling period, three in spring (with total precipitation amount of 4 mm, 55 mm, 3 mm), one in summer (9 mm) and one in autumn (5 mm).
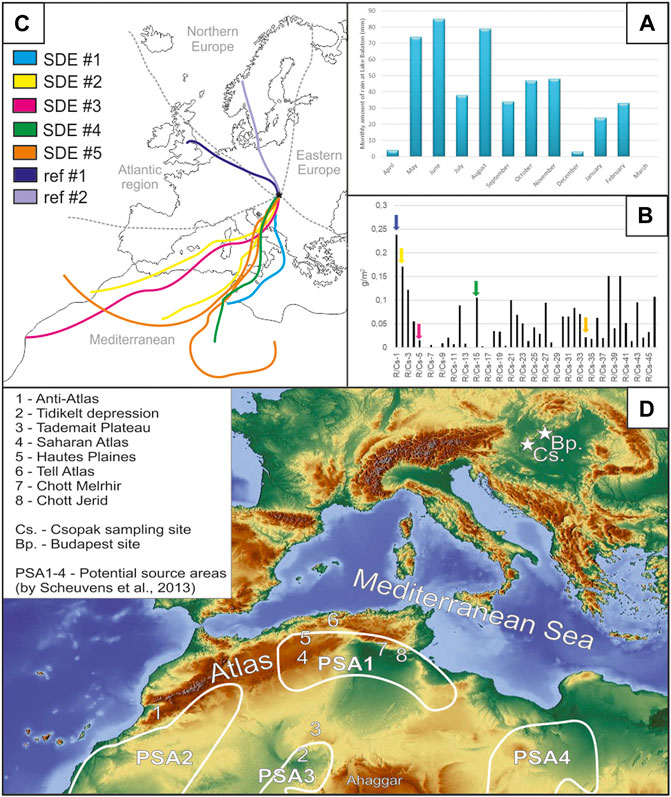
FIGURE 5. (A) Monthly variation of examined rainfall occurrence (i.e., > 3 mm) during the study period (based on the database of the National Meteorological Service); (B) Quantity of deposited dust material; (C) Sectors for determination of precipitation sources (after Bottyán et al., 2017) and directions of the examined Saharan dust events at an altitude of 3,000–6,000 m; (D) Schematic map of possible Saharan source areas (source of basemap: https://maps-for-free.com/).
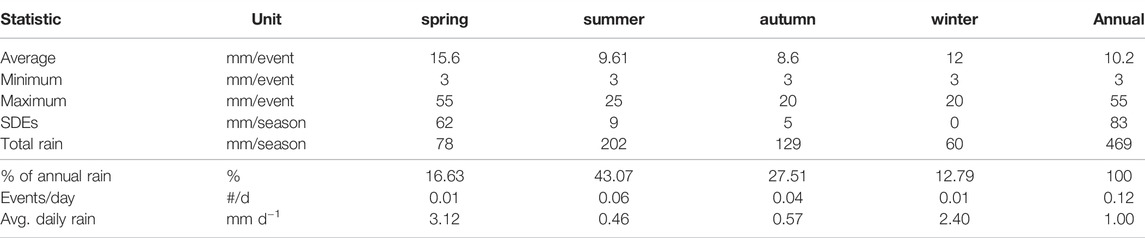
TABLE 1. Comparison of seasons and annual storm size statistics for the study period, April 2016—March 2017, from all the rain events measured.
3.3 Mineralogy (XRD, SEM)
XRD patterns measured directly on the filters are shown in Figure 6A. Both filter types (Prat Dumas and Millipore) produced an elevated background but of different characteristics (Figure 6B). The signal coming from the filters hid the presence of potential amorphous phases in all samples and, due to peak overlaps, decreased the detectability of some potential phases in the case of the two Prat Dumas filter-based samples. Due to the low total amount of dust on the filters, the patterns could be analysed by fingerprint method (e.g., Rodriguez-Navarro et al., 2018) using only the most intense, characteristic peaks of the relevant rock-forming minerals or mineral groups. Reference samples from the Atlantic (ref #1) and Northern (ref #2) region were compared with Saharan originated samples.
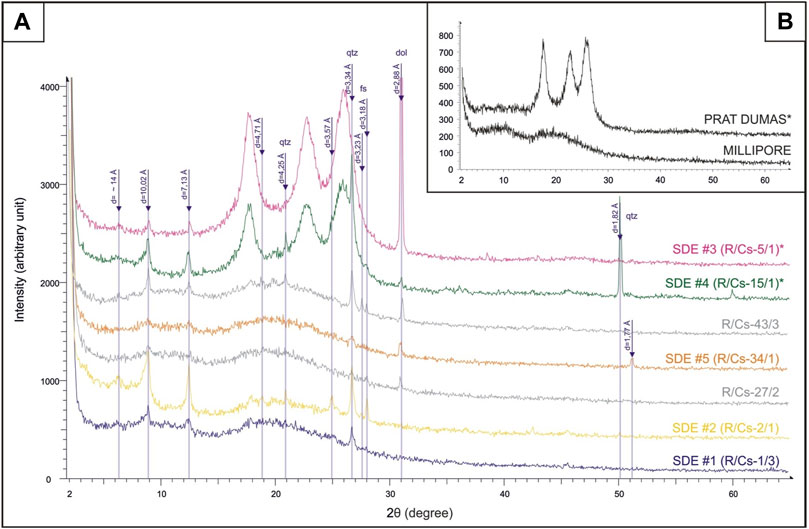
FIGURE 6. X-ray diffraction patterns of (A) the SAD samples (SDE #1–#5) and the reference samples (reference sample #1: R/Cs–27, reference sample #2: R/Cs–43), both on filter holders and (B) the two blank filter types (* indicates Prat Dumas filter). The most significant peaks and interplanar spacing (dhkl) values used for mineral group identification are indicated. Legend: qtz: quartz, dol: dolomite, fs: feldspar.
3.3.1 Mineral Phases
Table 2 contains the identified minerals and also indicates the relative quantity categories of the given mineral in comparison to the other samples. Quartz is the only mineral that could be traced in all samples, even in varying quantities. In one (SDE #4) of the three quartz-dominated samples, the preferred orientation associated intensity distribution (unusual 1.82 Å peak) indicates grain size much coarser than the ideal powder range. Four characteristics, but usually broad sheet silicate peaks were associated (Rodriguez-Navarro et al., 2018) with the following minerals: smectite (14 Å), palygorskite (10.5 Å), illite (10 Å), kaolinite (7.1 Å, 3.57 Å). SEM images (Figure 7) confirm the presence of 100 nm range fibrous mineral grains, a morphology typical for palygorskite. These fibrous texture clay mineral flakes travelled by being attached to rounded quartz grains, mainly of 1–10 µm size (Figure 7). Very large quartz particles up to 100 µm in size were also found. Dolomite (2.89 Å) dominates one sample (SDE #3), appears in an additional four and absents from two samples. Feldspars (K-feldspar: 3.23 Å; plagioclase: 3.18 Å) occur together with quartz, but in a subordinate amount.
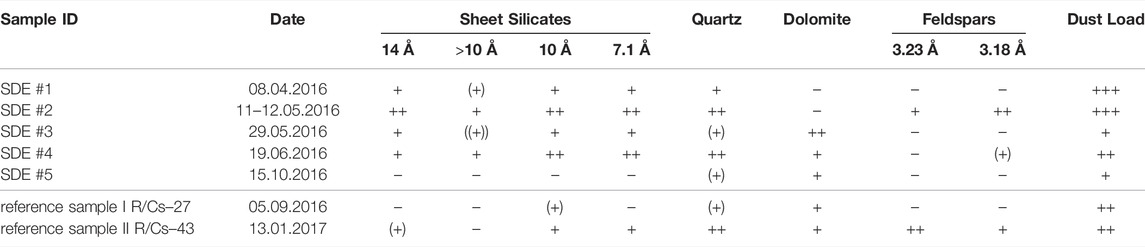
TABLE 2. Main mineral phases contributing to the XRD fingerprint (Figure 4) of the samples analysed. Legend:—not detected; Relative quantity symbols (++ > + > (+)) should be read by columns, as they refer to the relative amount of the given mineral in the different samples. Dust load categories (+++ > ++ > +) are based on solid phase load (Table 3).
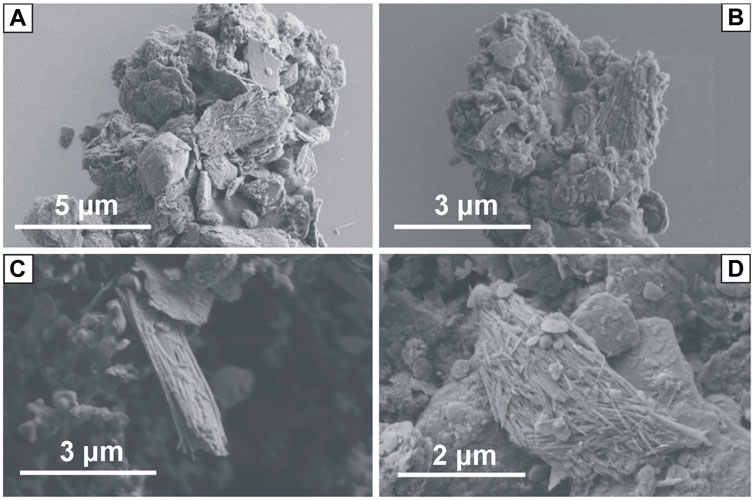
FIGURE 7. Morphology of aggregated dust particles on SEM images observed during the MARS campaign in Csopak. Fibrous platelets of palygorskite are attached to rounded quartz grains.
3.3.2 Mineral Assemblages
Four (SDE #1–4) out of the five trajectory-computed samples are of a similar, but not the same mineralogical fingerprint. These four samples included palygorskite, which is widely used to identify Saharan dust. Their mineral assemblages indicate different Mediterranean/Saharan source areas. SDE #1 and #2, both dolomite free show the greatest similarity in mineral composition. These samples might have originated from the closest regions, but the former is of depleted intensity though the similar—high—dust load of the two filters. SDE #2 is of the highest clay mineral content, in good agreement with the grain size distribution data (Figure 7). SDE #3 and #4 are built up of the same minerals, but #3 is strongly dolomite dominated, indicating very different source geology. The coarser range dominated grain-size distribution of SDE #4 (Figure 6) is due to the relatively larger contribution of quartz particles. The anomalous XRD intensities also support the coarse grain character of quartz. The fifth sample (SDE #5), characterized by the complete lack of clay minerals, should originate from an area of very different mineralogy, even if of Saharan source at all.
Two additional non-SDE samples were also studied by XRD to test differences in mineral composition. The reference sample #2 (13 January 2017) has a similar fingerprint to SDE #4, thus based just on mineralogy it might also be of Saharan origin, however, HYSPLIT trajectories prove its N–NW source area. The reference sample #1 (05 September 2016) differs from SDE #1–4 by the lack of clay minerals, indicating non-Saharan transport direction, and indeed, the HYSPLIT trajectories confirm the Atlantic source region.
3.4 Precipitation Transport Route Directions
Transport routes of all major precipitation events were determined based on 48-h trajectory simulations in the altitude ranges of 500–1,500 m, 1,500–3,000 m, and 3,000–6,000 m a.s.l. In the study period, the Atlantic ocean was the predominant source region, accounting for about two third of the total volume annual precipitation (Figure 5C). The Mediterranean, Northern Europe and Eastern Europe source regions were found to contribute to 16%, 8%, and 8% of annual precipitation, respectively. In contrast, in 2012 which was a year with an extensive drought during the summer the main precipitation source region was the Mediterranean Sea (Bottyán et al., 2017). These two regions are the primary sources of precipitation in the Carpathian Basin. Synoptic circulation patterns seldom favour moist air mass transport from the North in summer, but such events happened three times during the study period. It follows that as against other locations in Europe moisture source regions to the Carpathian Basin exhibit marked interannual variations, so the results from any given year should be treated with caution.
In the Mediterranean sector based on isotope study of rainwater (1999–2001) derived from different elevations in the Hyblean Mountains region (south-east Sicily, Italy) suggests that the main variation in rainwater are due to seasonal effects and elevation, the main source of moisture is Mediterranean-derived component (Grassa et al., 2006). Long-term monitoring (1997–2016) of rainwater stable oxygen isotope composition supplemented with air mass history reconstruction found that the percentage of initial moisture sources was an important factor in controlling oxygen isotope ratio in precipitation in SW-France (Zhang et al., 2020). The relatively fast changes in this mid-high latitude region rainfall sources are controlled by atmospheric circulations. In the Northwestern Mediterranean region, the heavy precipitation systems are fed by a south-southwesterly to easterly low-level moist flow (Duffourg and Ducrocq, 2011). The phenomenon has been described in several studies in Eastern Spain (Peñarrocha et al., 2002), Southern France (Delrieu et al., 2005; Ducrocq et al., 2008) and Northwestern Italy (Buzzi et al., 1998; Turato et al., 2004). The key element of these convective systems is a synoptic pattern inducing a moderate to strong southerly to easterly low-altitude circulation transporting moist and unstable air masses from the Mediterranean (Duffourg and Ducrocq, 2011). This relationship is consistent with having the highest precipitation volume in the entire sampling period (Table 3).
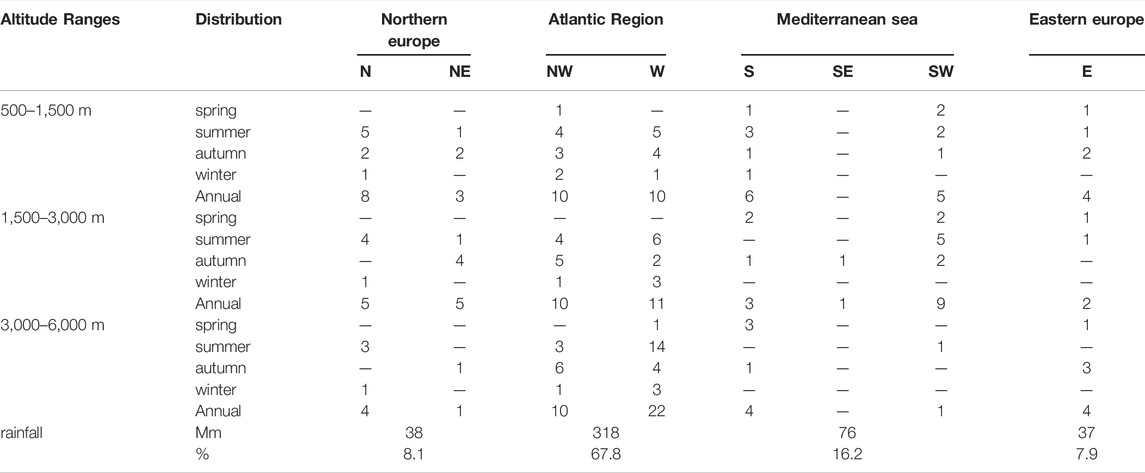
TABLE 3. Seasonal distribution of source regions based on 48-h trajectory analyses.
3.5 Measured and Modelled Dust Deposition
Filtered mass of solid phase of precipitation samples showed large variability ranging from 0.02 to 0.24 g m−2 per episode (Figure 5B, Table 4). Monthly modelled deposition data of MERRA-2 showed that the highest simulated values were February, March, April, May, June and October (Figure 8). The unusually intense dust depositional events of February were not sampled in the MARS campaign, so we do not have any measured depositional data. During March, no deposition of Saharan dust could be observed in the study area, while the other peak months were the same as the SDE-months of this study.

TABLE 4. Main characteristics of the examined SDEs.
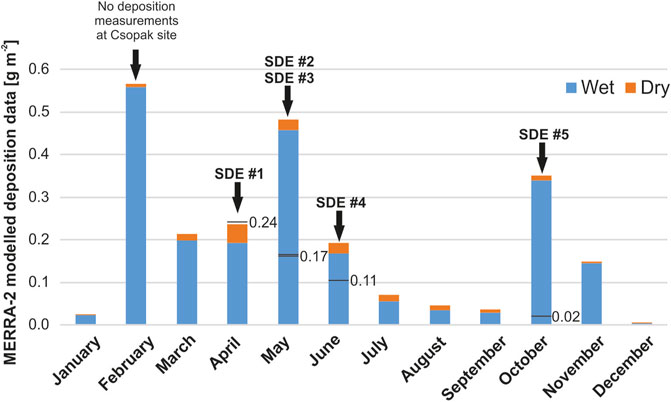
FIGURE 8. Measured and modelled deposition.
The precipitation ratio of Saharan wet depositional episodes (83 mm from total 469 mm) are 17.6%. The amount of deposited dust from five SDEs is 0.55331 g. The SDE dust deposition ratio is 22.81% to the total filtered mass of all measured precipitation events (2.4 g). From this point of view, the efficiency of SDE events in terms of wet deposition of dust is 37% better than precipitation events from other directions.
3.6 Particle Size Characteristics of the Saharan Dust Samples
An average of 50,000 individual dust particles by samples were scanned. Due to the presence of aggregated and non-mineral (e.g., pollens, plant fragments), irregularly shaped particles, additional mathematical filtering was applied. The exclusion rule was based on low (<0.65) circularity and convexity scores. Still, a few giant (>100 µm), irregular particles remained in the dataset, which caused an additional coarse-grained mode on the calculated grain size distributions. This distribution was forced into a unimodal distribution by parametric curve fitting with two Weibull-distributions (an iterative least-square numerical method described in detail by Varga et al., 2019). The fine-grained subpopulations were identified as the Saharan dust cluster, while the coarse population was dominated by aggregated particles and irregularly shaped objects (e.g., plant fragments from local sources). However, the exclusion of a few giant particles of Saharan origin cannot be ruled out, either (Maring et al., 2003; Betzer et al., 1998; Renard et al., 2018; Van der Does et al., 2018; Varga, 2020; Varga et al., 2021).
The volume-based mean diameter of the identified Saharan dust particles fell into the range between 20 and 80 μm, with modal values ranging from 30 to 50 µm (Figures 9, 10). Only the SDE #2 sample was dominated by significantly smaller particles (modal value ∼ 11 µm). The shapes of the particles were rather similar in all individual events, with the exception of particles in the SDE#2 sample. As a result of the large volumetric amount of fine-grained fractions in this sample, the grain shape parameter values were higher (partly due to the applied magnification, partly because of the less irregular shapes of fine silt particles). Granulometric properties of the mineral particles were summarised in Table 5.
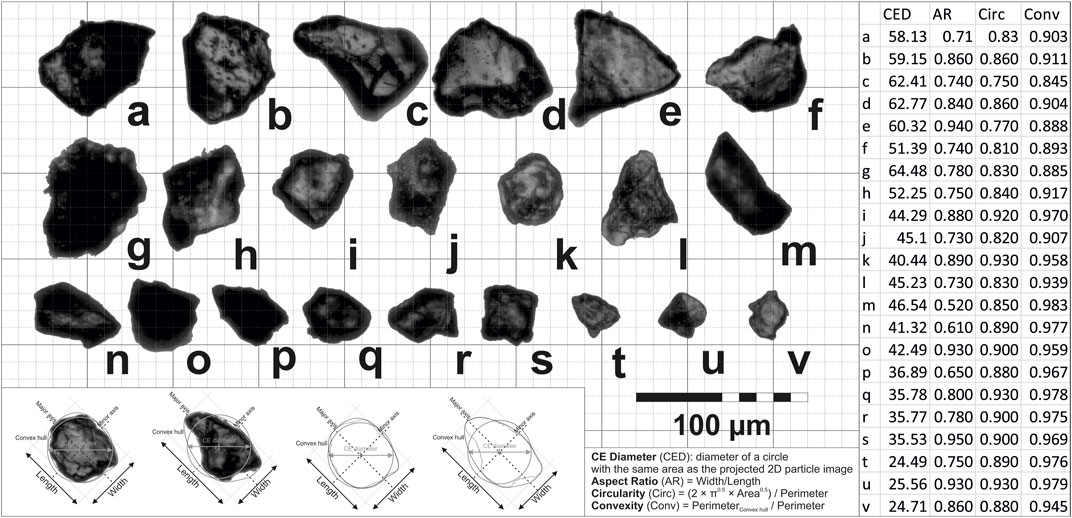
FIGURE 9. Size and shape properties of selected coarse silt-sized particles (CED: circle equivalent diameter in µm; AR: aspect ratio; Circ: circularity; Conv: convexity).
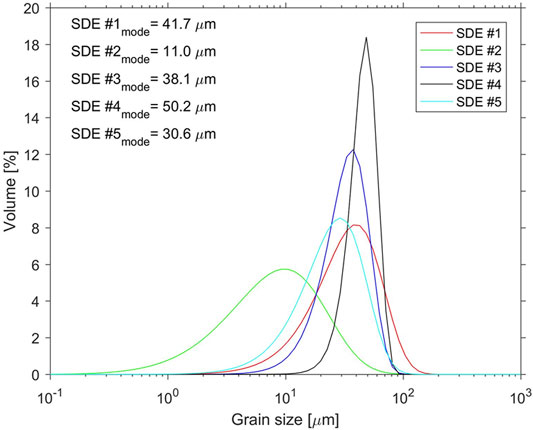
FIGURE 10. Grain size distributions of the identified Saharan dust particles.
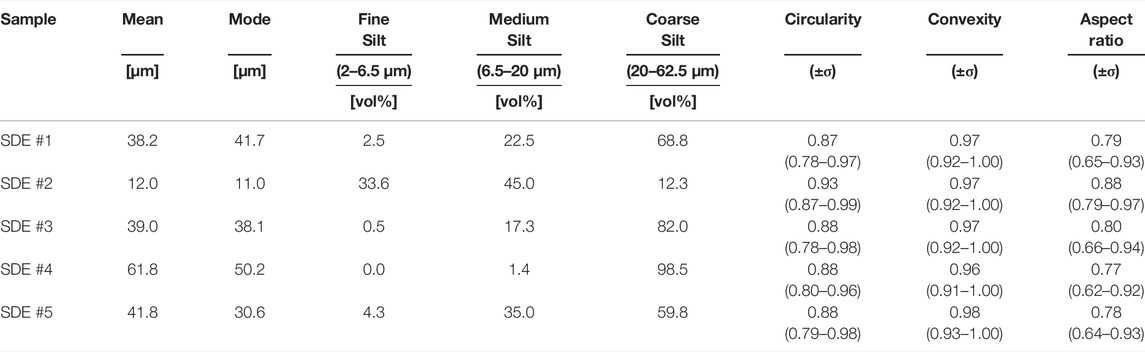
TABLE 5. General granulometric properties of identified Saharan mineral particles.
4 Discussion
4.1 Giant Particles and Their Effect on Deposition Values
Grain size results of automated static image analyses showed a high volumetric proportion of coarse silt-sized fractions. Particles larger than 50 µm in diameter could also be detectable in large numbers. Due to the cubic relationship between particle diameter and volume (and so mass), even a few giant dust particles have a major impact on general granulometric properties, and thus, on dust flux values.
Direct quantitative observations and measurements of dust emission fluxes are rare and sporadic (Urban et al., 2018). Because any observational data are insufficient to constrain the spatial distribution of dust aerosol and the dynamics of its evolution, the tropospheric dust budget is currently estimated only by models that are constrained by available measurements and retrievals (Zender et al., 2004). However, in order to properly assess the impacts of airborne dust on the Earth system, climate models should include a realistic representation of silt-size mineral dust (≥5 μm) in the atmosphere (Adebiyi and Kok, 2020). On average, the global atmosphere contains about 17 Tg of coarse dust, which is four times more than that current climate models can simulate (Adebiyi and Kok, 2020). Desert dust may remain to be the predominant coarse particle type in the free troposphere even thousands of kilometres away from the source. The transported minerals are essentially silt and clay particles between 0.1 and 20 µm (data obtained from Goudie and Middleton, 2006: Crete: 8–30 µm (modal—Mattson and Nihlén, 1996), 4–16 µm (median); Spain: 4–30 µm (mean—Sala et al., 1996); Germany: 2.2–16 µm (median); Italy: 16.8 µm (modal), 14.6 µm (median—Ozer et al., 1998); South France: 4–12.7 µm (median—Bücher and Lucas, 1984), 8–11 µm (median—Coudé-Gaussen, 1991); France (Paris Basin): 8 µm (Coudé-Gaussen et al., 1988); Swiss Alps: 4.5 ± 1.5 µm (median—Wagenbach and Geis, 1989); Central Mediterranean: 2–8 µm (modal—Tomadin et al., 1984).), though in some documented cases, much larger particles were transported over long distances (Maring et al., 2003; Betzer et al., 1998; Renard et al., 2018; Van der Does et al., 2018; Varga, 2020, this study). Whereas these particles can also be removed from the atmosphere by gravitational settling, wet deposition is thought to be more important, but it is poorly constrained due to its complexity (Cakmur et al., 2006). As pointed out above, current climate models markedly underestimate the concentrations of coarse dust in the atmosphere, and similarly their impacts on marine ecosystems, clouds formation, and global climate (Adebiyi and Kok, 2020).
4.2 Possible Source Areas of Mineral Dust
Reviews on the global dust sources by Prospero et al. (2002) and Washington et al. (2003) identified different Saharan sub-regions as major sources of desert dust. The mineralogical composition of atmospheric dust depends on the geology of source areas and is also affected by the mineral composition of the areas along the transport route. Bulk compositions of northern African dust and sources are highly heterogeneous by regions (Scheuvens et al., 2013). Based on Scheuvens et al. (2013) the most important mineral phases of northern African dust samples are quartz, feldspars, carbonates, sulfates, micas, oxides, hydroxides, different clay minerals (kaolinite, illite, smectite, palygorskite) and chlorites. Because of the regional compositional heterogeneity, only a few minerals are suitable to be used as source markers for dust originating from northern Africa (Scheuvens et al., 2013). According to Rodriguez-Navarro et al. (2018), indicators of northern and north-western Saharan dust are palygorskite and illite, accompanied with high carbonate and low chlorite contents. The abundance of smectites and kaolinite occurring in dust increases southwards in the western Sahara. The presence of palygorskite showed Saharan provenance and was related to events of “red rain” in several European locations (Rodriguez-Navarro et al., 2018).
Here we provide some guidance on possible source areas based on trajectory calculations and previous studies on dust transport from the Sahara to the Carpathian Basin (Varga et al., 2013; Varga, 2020). The comparative provenance analysis of the mineral dust requires more detailed elemental, isotopic and mineralogical compositional information.
Daily satellite AOD measurements and images, HYSPLIT air mass trajectories, surface observations and numerical model results were used to determine the possible source areas for the identified Saharan dust storm events. These have been compared with the available data from research papers on the main characteristics of the Saharan source areas in previous publications, as well as with our own mineralogical, granulometric results.
It was found that dust storm events can be traced back to synoptic-scale meteorological causes over large areas, activating a number of hot spots with different geological structures and different mineralogical signatures. Dust was released from several sources at the same time. Over the large affected region, air masses were saturated with mineral dust and the transport of dust reached the Carpathian Basin with the dominant meridional flow.
The mineralogical results available to us are not necessarily sufficient for an accurate source apportionment, but the palygorskite identified in the samples clearly supports a Saharan origin. Mineralogical data suggest that the illite/kaolinite ratios above 1 within this area indicate the dominance of the Northwest Saharan source areas. The other independent sources of observational, measurement and modelling data allow the main sources to be narrowed down somewhat further. The mineralogy and the grain size differences between the two quartz dominated samples (SDE #4: large quartz grains + subordinate carbonate; SDE #2: high clay fraction, no carbonate) may be more in connection with very local surface features than regional differences.
Several key source areas can be identified based on satellite observations. Saharan dust events in the Carpathian Basin were associated with some of the most intense dust source regions such as wadis and alluvial fans of Ahaggar Mts.; seasonal streams and playas at the slopes of Zemmour Massif and Adrar Soutouf Highlands; Tidikelt depression surrounded by Ahaggar, Tassili-n-Ajjer Mountains and the plateaus of Tanezrouft; ephemeral drainage system with seasonal marshes, mudflats and wadis of Erg Chech; the dry and salt lakes (e.g., Chott Melrhir and Chott Jerid) in the lowlands of Tell Atlas; and the northern hillslopes of Tibesti across Cyrenaica to the Qattara Depression (Varga et al., 2013). The source area of Saharan dust are areas with humid pre-history (e.g., wadi systems, ephemeral lakes), mostly flooded during the Pleistocene and Holocene pluvial periods (Stuut et al., 2009; Varga et al., 2013).
The calculated transport trajectories point to particular regions of northern Africa. Though no univocal assignment of surface mineral parageneses can be set up for that large area representing a wide range of soil types and bedrock, some general trends could still be identified (Scheuvens et al., 2013). A special feature of all the samples studied is the total lack of calcite, a characteristic dust component for N and NW Saharan source areas (Rodriguez-Navarro et al., 2018), and still the presence of carbonate in the form of dolomite in some samples.
Based on the calculated air mass dispersion trajectories and daily AOD measurements and satellite images, it can be concluded that during SDE #1 the atmosphere was saturated with dust on the foreside of the low-pressure formation centred over the Atlas Mountains, from the southeastern foothills of the Anti-Atlas, the border between Mauritania and Western Sahara, through the Tidikelt depression to southern Tunisia, which then flowed into northeastern direction (Figure 5D.). The dust collected contained palygorskite, smectite, kaolinite and illite clay as well as quartz.
During SDE #2, the dust storm activity was concentrated in a smaller area based on measurements and observations. At that time, dust emission was significant in the southern forearc of the Saharan Atlas, partly further south in the vicinity of the Tademait Plateau, and in the intramontane basins of the Atlas. Calculated trajectories also confirmed that this is the region from which the particulate matter arrived in the Carpathian Basin. Of our samples, the sample from this event has the highest palygorskite content. If that observation is not an artefact caused by extreme dust fractionation (Caquineau et al., 1998), in the case of SDE #2 the more eastern, central and south Algerian region is backed by the carbonate free mineralogical composition (Avila et al., 1996, 1997).
During SDE #3, the air mass propagation trajectories cross the Hautes Plaines region, which was then characterised by high AOD values and an intense dust storm episode confirmed by surface observations. This area is a vast endorheic depression-system of large chotts (salt lakes) in the high plateau between the Tell Atlas and Saharan Atlas Mountains. SDE #3, the most carbonate dominated sample, is in good overlap with carbonate dominated dust source areas reported earlier (Rodriguez-Navarro et al., 2018), but the change in the regular calcite > dolomite relationship needs further explanation.
Satellite measurements and surface observations for SDE #4 show heavy dust emissions in southern Tunisia and in the north-western corner of Libya in the Gulf of Gabes area. The calculated trajectories also assume this region as the source of the collected particulate matter. The predominance of coarse-grained quartz confirms that the source material may have originated from a different source area than previously mentioned. The significant palygorskite content of the sample is consistent with previous publications from the hypothesized region; Jamoussi et al. (2003) and O'Hara et al. (2006) having published on the presence of palygorskite in the area.
In the October SDE #5, the Chott Melrhir and Chott Jerid ephemeral salt lakes were identified as possible source areas. Dust storms were reported from this location at the time of the episode, which was confirmed by satellite measurements. No clay minerals were identified in the collected sample, only quartz and dolomite. This was presumably due to insufficient sample availability.
4.3 Increased Number of Episodes and Deposition
Based on the general Saharan dust climatology of the Carpathian Basin, a clear increase of the number and intensity of dust episodes could be identified in the last decade (Varga, 2020). The annual number of dust events was 4.2 on average between 1979 and 2010, while in the period of 2011–2018, it has increased to 10.3. In the study period of the present paper, the number of identified dust episodes was twelve (with seven sampled depositional episodes); 2016 can be regarded as a representative year of changing nature of the decade. All of the presented SDEs were started by an intense dust storm formation in the NW region of Sahara caused by the intrusion of an upper-level atmospheric through and increased surface wind speeds, partly associated with orographic blocking of Atlas Mountains. Northwards transport towards the study area in Central Europe was driven by warm sector winds of the same eastwards moving low-pressure system.
Wind component analysis indicated an enhanced meridionality of atmospheric flow patterns of intense dust depositional events (Varga, 2020). Similar synoptic meteorological situations were reported by Francis et al. (2018) in the case of rare Saharan dust transport events towards Greenland. The more intense local dust storms injected more mineral dust into the Saharan atmosphere and the dominant meridional flow patterns of the regional circulation system caused a more effective northward transport of dust loaded air masses.
The more frequent spreading of high-altitude atmospheric though systems into low-latitude areas has been connected to high-amplitude flow patterns of jet streams. Above-average warming of northern polar regions, known as Arctic Amplification, and the decreased temperature difference between high- and low-latitudes leads to more meandering high-level flow patterns (Francis and Vavrus, 2015). According to our observations, the zonal mean temperature anomalies were dominated by Arctic warm periods, indicating warmer than average northern polar situations during the dust episodes (Figure 11).
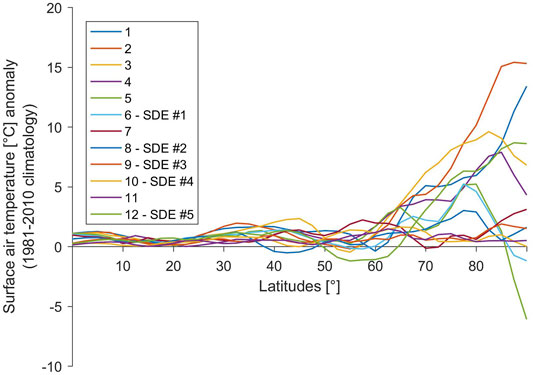
FIGURE 11. Meridional transect (zonal mean) air temperature anomalies during the identified twelve dust events in 2016.
According to the corrected model-based calculations of Varga et al. (2014), the amount of annually deposited Saharan dust can be set into the range between 3.2 and 5.4 g m−2. MERRA-2 simulations showed moderately lower values, 1.2–3.6 g m−2 year−1 for the period of 1979–2018. For the year 2016, total dust deposition of 2.37 g m-2 (dry deposition: 0.17 g m−2; wet deposition: 2.2 g m−2) was reported by MERRA-2 simulations with peak months of February, May and October. The amounts of filtered material were in the range of 0.1–240 mg m−2 per event (Figure 8). Based on the measured values, a cumulative wet deposition rate of 2.4 g m−2 years−1 were calculated for dust. Most of the solid, insoluble phases were transported by air masses from the south (Table 3). Modelling of samples arrived from the southern region was supplemented with backward trajectories to predict better transport processes (Figure 3). The average dust deposition from individual SDEs is 0.1107 g m−2 year−1 (Table 3), yielding a total of 0.5533 g m−2 year−1 during the observed period. According to depositional adjustment estimations, the annual amount of deposited Saharan dust can be set into the range between 3 and 5 g m−2 year−1 (Varga 2016). Based on forecast maps of Dust REgional Atmospheric Model (DREAM, Barcelona Supercomputing Centre) the dry deposition rate is ∼ 300 mg m−2year−1 and the wet deposition rate is ∼ 700 mg/m2/year in the Carpathian Basin (Varga et al., 2014). Thus our value is in good agreement with the results of global models (Ginoux et al., 2001).
Since dust deposition is overwhelmingly linked to large-scale synoptic transport and precipitation events, it seems reasonable to assume that regional wet deposition rate can be estimated by using results from a single sampling location. We estimated that the annual deposition rate of Saharan dust to the Lake Balaton (surface area 596 km2) was in the order of ∼ 300 t year−1. In the sampling period of 2016–2018, the inflows transported suspended particulates at a rate of about ∼ 24,000 t year−1, so direct atmospheric deposition of Saharan dust contributed about 1% to the overall rate of sediment formation. The presented granulometric (particle size and shape) and mineral data can serve as a reference for the identification of Saharan dust particles in the sedimentary sequences (e.g., from sediment cores) of Lake Balaton to provide insight into the past circulation patterns.
5 Summary
In this paper, a systematic SDE identification procedure and wet deposition estimation were achieved in Central Europe in 2016 with a view to evaluating the relative importance of SDEs in the annual total deposition. The changing climatic framework is also changing atmospheric circulation systems. The typical transport pathways of windblown mineral dust, the amount of dust transported and the intensity of deposition episodes are also changing. This is also being witnessed in Central Europe, where SDEs have been identified with increasing frequency and intensity over the last decade. In 2016, there were particularly significant events that foreshadow the changes that are likely to occur in the near future. The number of identified dust episodes was twelve (with seven sampled depositional episodes); 2016 can be regarded as a representative year of the decade. All of the presented SDEs were started by an intense dust storm formation in the NW region of Sahara caused by the intrusion of an upper-level atmospheric through and increased surface wind speeds, partly associated with orographic blocking of Atlas Mountains. Northwards transport towards the study area in Central Europe was driven by warm sector winds of the same eastwards moving low-pressure system. The more frequent spreading of high-altitude atmospheric though systems into low-latitude areas has been connected to high-amplitude flow patterns of jet streams determined by climate change-driven Arctic Amplification.
Precipitation events of possible Saharan influence were sorted out by using backward air trajectories and synoptic meteorology. It was found that about 15% of the annual total precipitation volume originated from the Mediterranean source region. Based on the synoptic meteorological background and moisture source parameters, five SDE events were identified, two additional depositional episodes were sampled before the rainwater sampling campaign.
XRD analyses of these filter samples revealed that the major mineral constituents were quartz, kaolinite and 10-Å phyllosilicates, with evidence for the presence of the highly specific palygorskite. Some samples contained dolomite. Further studies are needed to clarify the lack of calcite is caused by mineralogical fractionation during transport. The mineralogical fingerprint of the SDE samples could clearly be differentiated from the Atlantic (Western) reference sample however, the N–NW reference sample showed more similarities to the SDE.
The volume-based mean diameter of individual dust particles fell into the range between 20 and 80 μm, with the presence of giant (silt and sand) mineral dust particles in precipitation at the sampling site 1,500–2,500 km away from the potential source areas that were hypothesised based on characteristic mineralogical signatures.
General uncertainties which hamper mineral dust characterisation in climate models were also observed in our granulometric and dust flux data of sampled material. The particle size of the deposited dust was coarser than the upper cut-off level of models’ grain size, while contradictions of measured and simulated deposition values clearly proved incorrect representation of dust fluxes of numerical simulations.
Data Availability Statement
The raw data supporting the conclusions of this article will be made available by the authors, without undue reservation.
Author Contributions
ÁR: Conceptualisation; Formal analysis; Supervision; Validation; Writing—original draft; BT: Investigation; FG: Investigation; Writing—review and editing; TW: Investigation; AG: Conceptualisation; Writing—review and editing; GV: Conceptualisation; Formal analysis; Investigation; Methodology; Writing—original draft.
Funding
Research of ÁR was supported by the National Research, Development and Innovation Office [PD 121088]. Financial support for this study was provided by NKFIH grants [KH130337 and FK138692] and NKFIH-471-3/2021, National Multidisciplinary Laboratory for Climate Change.
Conflict of Interest
The authors declare that the research was conducted in the absence of any commercial or financial relationships that could be construed as a potential conflict of interest.
Publisher’s Note
All claims expressed in this article are solely those of the authors and do not necessarily represent those of their affiliated organizations, or those of the publisher, the editors and the reviewers. Any product that may be evaluated in this article, or claim that may be made by its manufacturer, is not guaranteed or endorsed by the publisher.
Acknowledgments
We thank Valéria Andirkó and Judit Szauer for sample preparation and analytical measurements. The authors are very grateful to Miklós Jakab for SEM images. The published trajectories were provided by the HYSPLIT transport model website (https://ready.arl.noaa.gov/hypub-bin/trajsrc.pl) of NOAA Air Resources Laboratory (AAL).
References
Adebiyi, A. A., and Kok, J. F. (2020). Climate Models Miss Most of the Coarse Dust in the Atmosphere. Sci. Adv. 6 (15), eaaz9507. doi:10.1126/sciadv.aaz9507
Alpert, P., Kishcha, P., Shtivelman, A., Krichak, S. O., and Joseph, J. H. (2004). Vertical Distribution of Saharan Dust Based on 2.5-year Model Predictions. Atmos. Res. 70 (2), 109–130. doi:10.1016/j.atmosres.2003.11.001
Avila, A., Queralt, I., Gallart, F., and Martin-Vide, J. (1996). “African Dust over Northeastern Spain: Mineralogy and Source Regions,” in The Impact of Desert Dust across the Mediterranean. Environmental Science and Technology Library. Editors S. Guerzoni, and R. Chester (Dordrecht: Springer), 11. doi:10.1007/978-94-017-3354-0_19
Avila, A., Queralt-Mitjans, I., and Alarcón, M. (1997). Mineralogical Composition of African Dust Delivered by Red rains over Northeastern Spain. J. Geophys. Res. 102 (D18), 21977–21996. doi:10.1029/97JD00485
Balkanski, Y., Schulz, M., Claquin, T., and Guibert, S. (2007). Reevaluation of Mineral Aerosol Radiative Forcings Suggests a Better Agreement with Satellite and AERONET Data. Atmos. Chem. Phys. 7, 81–95. doi:10.5194/acp-7-81-2007
Barkan, J., Alpert, P., Kutiel, H., and Kishcha, P. (2005). Synoptics of Dust Transportation Days from Africa toward Italy and central Europe. J. Geophys. Res. 110 (D7). doi:10.1029/2004jd005222
Barkan, J., Kutiel, H., and Alpert, P. (2004). Climatology of Dust Sources in North Africa and the Arabian Peninsula, Based on TOMS Data. Indoor Built Environ. 13 (6), 407–419. doi:10.1177/1420326x04046935
Borbély-Kiss, I., Kiss, Á. Z., Koltay, E., Szabó, G., and Bozó, L. (2004). Saharan Dust Episodes in Hungarian Aerosol: Elemental Signatures and Transport Trajectories. J. Aerosol Sci. 35 (10), 1205–1224. doi:10.1016/j.jaerosci.2004.05.001
Bottyán, E., Czuppon, G., Weidinger, T., Haszpra, L., and Kármán, K. (2017). Moisture Source Diagnostics and Isotope Characteristics for Precipitation in East Hungary: Implications for Their Relationship. Hydrological Sci. J. 62 (12), 2049–2060. doi:10.1080/02626667.2017.1358450
Bücher, A., and Lucas, G. (1984). Sédimentation éolienne intercontinentale, poussières sahariennes et géologie. Bull. Cent. Rech. Elf. E 8, 151–165.
Buzzi, A., Tartaglione, N., and Malguzzi, P. (1998). Numerical Simulations of the 1994 Piedmont Flood: Role of Orography and Moist Processes. Mon. Wea. Rev. 126 (9), 2369–2383. doi:10.1175/1520-0493(1998)126<2369:nsotpf>2.0.co;2
Cakmur, R. V., Miller, R. L., Perlwitz, J., Geogdzhayev, I. V., Ginoux, P., Koch, D., et al. (2006). Constraining the Magnitude of the Global Dust Cycle by Minimizing the Difference between a Model and Observations. J. Geophys. Res. 111 (D6). doi:10.1029/2005jd005791
Caquineau, S., Gaudichet, A., Gomes, L., Magonthier, M.-C., and Chatenet, B. (1998). Saharan Dust: Clay Ratio as a Relevant Tracer to Assess the Origin of Soil-Derived Aerosols. Geophys. Res. Lett. 25, 983–986. doi:10.1127/ejm/9/1/015710.1029/98gl00569
Chakraborty, B., and Gupta, A. (2018). “Study and Interpretation of Chemical Composition of Rainwater in Selected Urban and Rural Locations in India Using Multivariate Analysis,” in International Conference on Electrical, Electronics, Materials and Applied Science AIP Conf. Proc. 1952, 020034-1–020034-7. doi:10.1063/1.5031996
Claquin, T., Schulz, M., and Balkanski, Y. J. (1999). Modeling the Mineralogy of Atmospheric Dust Sources. J. Geophys. Res. 104 (D18), 22243–22256. doi:10.1029/1999jd900416
Coudé-Gaussen, G., Désiré, E., and Regrain, R. (1988). Particularité de poussières sahariennes distales tombées sur la Picardie et l’Ile-de-France le 7 Mai 1988. Hommes Terr. N. 4, 246–251.
Coudé-Gaussen, G. (1991). Les poussières sahariennes: cycle sédimentaire et place dans les environments et paléoenvironments désertiques. Montrouge: John Libby Eurotext, 485.
Csontos, L., and Nagymarosy, A. (1998). The Mid-Hungarian Line: a Zone of Repeated Tectonic Inversions. Tectonophysics 297, 51–71. doi:10.1016/s0040-1951(98)00163-2
Delrieu, G., Nicol, J., Yates, E., Kirstetter, P.-E., Creutin, J.-D., Anquetin, S., et al. (2005). The Catastrophic Flash-Flood Event of 8-9 September 2002 in the Gard Region, France: A First Case Study for the Cévennes-Vivarais Mediterranean Hydrometeorological Observatory. J. Hydrometeorol 6 (1), 34–52. doi:10.1175/jhm-400.1
Draxler, R. R., and Rolph, G. D. (2012). “HYSPLIT (HYbrid Single-Particle Lagrangian Integrated Trajectory,” in Model Access via NOAA ARL READY. Website (http://ready.a.rl.noaa.gov/HYSPLIT.php) NOAA Air Resource s Laboratory, Silver Spring, MD.
Ducrocq, V., Nuissier, O., Ricard, D., Lebeaupin, C., and Thouvenin, T. (2008). A Numerical Study of Three Catastrophic Precipitating Events over Southern France. II: Mesoscale Triggering and Stationarity Factors. Q.J.R. Meteorol. Soc. 134 (630), 131–145. doi:10.1002/qj.199
Duffourg, F., and Ducrocq, V. (2011). Origin of the Moisture Feeding the Heavy Precipitating Systems over Southeastern France. Nat. Hazards Earth Syst. Sci. 11 (4), 1163–1178. doi:10.5194/nhess-11-1163-2011
Dulac, F., Moulin, C., Lambert, C. E., Guillard, F., Poitou, J., Guelle, W., et al. (1996). “Quantitative Remote Sensing of African Dust Transport to the Mediterranean,” in The Impact of Desert Dust across the Mediterranean. Editors S. Guerzoni, and R. Chester (New York: Springer), 25–49. doi:10.1007/978-94-017-3354-0_3
Dumitru, O. A., Forray, F. L., Fornós, J. J., Ersek, V., and Onac, B. P. (2016). Water Isotopic Variability in Mallorca: a Path to Understanding Past Changes in Hydroclimate. Hydrol. Process. 31 (1), 104–116. doi:10.1002/hyp.10978
Engelstaedter, S., Tegen, I., and Washington, R. (2006). North African Dust Emissions and Transport. Earth-Science Rev. 79 (1-2), 73–100. doi:10.1016/j.earscirev.2006.06.004
Environmental Protection and Water Management Research Institute (VITUKI) (2007). Summary Study for 2006 on Air Quality in Hungary Based on Data from the Manual Monitoring Network. Budapest: VITUKI Kht. LRK Data Centre. [In Hungarian] http://www.levegominoseg.hu/Media/Default/Ertekeles/docs/2006_RIVertekeles.pdfFranzén.
Gelaro, R., McCarty, W., Suárez, M. J., Todling, R., Molod, A., Takacs, L., et al. (2017). The Modern-Era Retrospective Analysis for Research and Applications, Version 2 (MERRA-2). J. Clim. 30 (14), 5419–5454. doi:10.1175/JCLI-D-16-0758.1
Ginoux, P. M., Chin, I., Tegen, I., Prospero, J., Holben, M., Dubovik, O., et al. (2001). Sources and Distributions of Dust Aerosols Simulated with the GOCART Model. J. Geophys. Res. 106, 20255–20273.
Grassa, F., Favara, R., and Valenza, M. (2006). Moisture Source in the Hyblean Mountains Region (South-eastern Sicily, Italy): Evidence from Stable Isotopes Signature. Appl. Geochem. 21 (12), 2082–2095. doi:10.1016/j.apgeochem.2006.07.014
Gustafsson, M., Rayner, D., and Chen, D. (2010). Extreme Rainfall Events in Southern Sweden: where Does the Moisture Come from? Tellus A: Dynamic Meteorology and Oceanography 62 (5), 605–616. doi:10.1111/j.1600-0870.2010.00456.x
Hjelmroos, M., Kållberg, P., Brorström-Lunden, E., Juntto, S., and Savolainen, A.-L. (1994). The “Yellow Snowepisode” of Northern Fennoscandia, March 1991—A Case Study of Long-Distance Transport of Soil, Pollen and Stable Organic Compounds. Atmos. Environ. 28 (22), 3587–3604.
Hungarian Meteorological Survey (OMSZ) (2009). Summary Studies for the Period 2009–2018 on Air Quality in Hungary Based on Data from the Manual Monitoring Network. Budapest: ÉLFO LRK Data Centre. 2018[In Hungarian]https://legszennyezettseg.met.hu/levegominoseg/ertekelesek/olm-ertekelesek.
Israelevich, P., Ganor, E., Alpert, P., Kishcha, P., and Stupp, A. (2012). Predominant Transport Paths of Saharan Dust over the Mediterranean Sea to Europe. J. Geophys. Res. Atmospheres 117 (D2). doi:10.1029/2011jd016482
Israelevich, P. L., Levin, Z., Joseph, J. H., and Ganor, E. (2002). Desert Aerosol Transport in the Mediterranean Region as Inferred from the TOMS Aerosol index. J. Geophys. Res. 107 (D21), 13–21. AAC 13–1–AAC 13–13. doi:10.1029/2001jd002011
Jamoussi, F., Ben Aboud, A., and López-Galindo, A. (2003). Palygorskite Genesis through Silicate Transformation in Tunisian continental Eocene Deposits. Clay miner. 38 (2), 187–199. doi:10.1180/0009855033820088
Jickells, T. D., An, Z. S., Andersen, K. K., Baker, A. R., Bergametti, G., Brooks, N., et al. (2005). Global Iron Connections between Desert Dust, Ocean Biogeochemistry, and Climate. Science 308 (5718), 67–71. doi:10.1126/science.1105959
Kalnay, E., Kanamitsu, M., Kistler, R., Collins, W., Deaven, D., Gandin, L., et al. (1996). The NCEP/NCAR 40-Year Reanalysis Project. Bull. Amer. Meteorol. Soc. 77 (3), 437–471. doi:10.1175/1520-0477(1996)077<0437:tnyrp>2.0.co;2
Kis, A., Pongrácz, R., and Bartholy, J. (2017). Multi-model Analysis of Regional Dry and Wet Conditions for the Carpathian Region. Int. J. Climatol 37 (13), 4543–4560. doi:10.1002/joc.5104
Klein, H., Nickovic, S., Haunold, W., Bundke, U., Nillius, B., Ebert, M., et al. (2010). Saharan Dust and Ice Nuclei over Central Europe. Atmos. Chem. Phys. Discuss. 10 (6). doi:10.5194/acp-10-10211-2010
Koltay, E., Borbély-Kiss, I., Kertész, Z., Kiss, Á. Z., and Szabó, G. (2006). Assignment of Saharan Dust Sources to Episodes in Hungarian Atmosphere by PIXE and TOMS Observations. J. Radioanal. Nucl. Chem. 267 (2), 449–459. doi:10.1007/s10967-006-0073-1
Krklec, K., Domínguez-Villar, D., and Lojen, S. (2018). The Impact of Moisture Sources on the Oxygen Isotope Composition of Precipitation at a continental Site in central Europe. J. Hydrol. 561, 810–821. doi:10.1016/j.jhydrol.2018.04.045
Krüzselyi, I., Bartholy, J., Horányi, A., Pieczka, I., Pongrácz, R., Szabó, P., et al. (2011). The Future Climate Characteristics of the Carpathian Basin Based on a Regional Climate Model Mini-Ensemble. Adv. Sci. Res. 6 (1), 69–73. doi:10.5194/asr-6-69-2011
Lara, E. R., Guardiola, R. M., Vasquez, Y. G., and Renteria, I. B. (2010). Chemical Composition of Rainwater in Northeastern Mexico. Atmosfera 23 (3), 213–224. doi:10.1353/ntc.2010.0064
Lenes, J. M., Darrow, B. P., Cattrall, C., Heil, C. A., Callahan, M., Vargo, G. A., et al. (2001). Iron Fertilization and the Trichodesmiumresponse on the West Florida Shelf. Limnol. Oceanogr. 46 (6), 1261–1277. doi:10.4319/lo.2001.46.6.1261
Mahowald, N., Kohfeld, K., Hansson, M., Balkanski, Y., Harrison, S. P., Prentice, I. C., et al. (1999). Dust Sources and Deposition during the Last Glacial Maximum and Current Climate: A Comparison of Model Results with Paleodata from Ice Cores and marine Sediments. J. Geophys. Res. 104 (D13), 15895–15916. doi:10.1029/1999jd900084
Mahowald, N. M., Muhs, D. R., Levis, S., Rasch, P. J., Yoshioka, M., Zender, C. S., et al. (2006). Change in Atmospheric mineral Aerosols in Response to Climate: Last Glacial Period, Preindustrial, Modern, and Doubled Carbon Dioxide Climates. J. Geophys. Res. Atmospheres 111 (D10). doi:10.1029/2005jd006653
Mattsson, J., and Nihlén, T. (1996). The Transport of Saharan Dust to Southern Europe: a Scenario. J. Arid Environments 32, 111–119. doi:10.1006/jare.1996.0011
Muhs, D. R., Budahn, J. R., Prospero, J. M., and Carey, S. N. (2007). Geochemical Evidence for African Dust Inputs to Soils of Western Atlantic Islands: Barbados, the Bahamas, and Florida. J. Geophys. Res. 112 (F2). doi:10.1029/2005jf000445
O'Hara, S. L., Clarke, M. L., and Elatrash, M. S. (2006). Field Measurements of Desert Dust Deposition in Libya. Atmos. Environ. 40, 3881–3897. doi:10.1016/j.atmosenv.2006.05.080
Ozer, P., Erpicum, M., Cortemiglia, G. C., and Lucchetti, G. (1998). A Dustfall Event in November 1996 in Genoa, Italy. Weather 53, 140–145. doi:10.1002/j.1477-8696.1998.tb03982.x
Peñarrocha, D., Estrela, M. J., and Millán, M. (2002). Classification of Daily Rainfall Patterns in a Mediterranean Area with Extreme Intensity Levels: the Valencia Region. Int. J. Climatol. 22 (6), 677–695. doi:10.1002/joc.747
Poreh, M., and Mechrez, E. (1984). The Combined Effect of Wind and Topography on Rainfall Distribution. J. Hydrol. 72 (1-2), 1–23. doi:10.1016/0022-1694(84)90182-3
Pósfai, M., and Buseck, P. R. (2010). Nature and Climate Effects of Individual Tropospheric Aerosol Particles. Annu. Rev. Earth Planet. Sci. 38 (1), 17–43. doi:10.1146/annurev.earth.031208.100032
Prospero, J. M., Ginoux, P., Torres, O., Nicholson, S. E., and Gill, T. E. (2002). Environmental Characterization of Global Sources of Atmospheric Soil Dust Identified with the Nimbus 7 Total Ozone Mapping Spectrometer (Toms) Absorbing Aerosol Product. Rev. Geophys. 40 (1), 2–1. doi:10.1029/2000rg000095
Rodriguez-Navarro, C., di Lorenzo, F., and Elert, K. (2018). Mineralogy and Physicochemical Features of Saharan Dust Wet Deposited in the Iberian Peninsula during an Extreme Red Rain Event. Atmos. Chem. Phys. 18 (13), 10089–10122. doi:10.5194/acp-18-10089-2018
Rolph, G., Stein, A., and Stunder, B. (2017). Real-time Environmental Applications and Display sYstem: READY. Environ. Model. Softw. 95, 210–228. doi:10.1016/j.envsoft.2017.06.025
Ross, A. N., Tompkins, A. M., and Parker, D. J. (2004). Simple Models of the Role of Surface Fluxes in Convective Cold Pool Evolution. J. Atmos. Sci. 61 (13), 1582–1595. doi:10.1175/1520-0469(2004)061<1582:smotro>2.0.co;2
Sala, J. Q., Cantos, J. O., and Chiva, E. M. n. (1996). Red Dust Rain within the Spanish Mediterranean Area. Climatic Change 32, 215–228. doi:10.1007/bf00143711
Salles, C., Poesen, J., and Govers, G. (2000). Statistical and Physical Analysis of Soil Detachment by Raindrop Impact: Rain Erosivity Indices and Threshold Energy. Water Resour. Res. 36 (9), 2721–2729. doi:10.1029/2000wr900024
Scheuvens, D., Schütz, L., Kandler, K., Ebert, M., and Weinbruch, S. (2013). Bulk Composition of Northern African Dust and its Source Sediments - A Compilation. Earth-Science Rev. 116, 170–194. doi:10.1016/j.earscirev.2012.08.005
Sjostrom, D. J., and Welker, J. M. (2009). The Influence of Air Mass Source on the Seasonal Isotopic Composition of Precipitation, Eastern USA. J. Geochemical Exploration 102 (3), 103–112. doi:10.1016/j.gexplo.2009.03.001
Spinoni, J., Szalai, S., Szentimrey, T., Lakatos, M., Bihari, Z., Nagy, A., et al. (2014). Climate of the Carpathian Region in the Period 1961-2010: Climatologies and Trends of 10 Variables. Int. J. Climatol. 35 (7), 1322–1341. doi:10.1002/joc.4059
Stein, A. F., Draxler, R. R., Rolph, G. D., Stunder, B. J. B., Cohen, M. D., and Ngan, F. (2015). NOAA's HYSPLIT Atmospheric Transport and Dispersion Modeling System. Bull. Amer. Meteorol. Soc. 96, 2059–2077. doi:10.1175/BAMS-D-14-00110.1
Stevens, T., Marković, S. B., Zech, M., Hambach, U., and Sümegi, P. (2011). Dust Deposition and Climate in the Carpathian Basin over an Independently Dated Last Glacial-Interglacial Cycle. Quat. Sci. Rev. 30 (5-6), 662–681. doi:10.1016/j.quascirev.2010.12.011
Stuut, J.-B., Smalley, I., and O’Hara-Dhand, K. (2009). Aeolian Dust in Europe: African Sources and European Deposits. Quat. Int. 198 (1-2), 234–245. doi:10.1016/j.quaint.2008.10.007
Swap, R., Garstang, M., Greco, S., Talbot, R., and Kallberg, P. (1992). Saharan Dust in the Amazon Basin. Tellus B 44 (2), 133–149. doi:10.1034/j.1600-0889.1992.t01-1-00005.x
Szoboszlai, Z., Kertész, Z., Szikszai, Z., Borbély-Kiss, I., and Koltay, E. (2009). Ion Beam Microanalysis of Individual Aerosol Particles Originating from Saharan Dust Episodes Observed in Debrecen, Hungary. Nucl. Instr. Methods Phys. Res. Section B: Beam Interactions Mater. Atoms 267 (12-13), 2241–2244. doi:10.1016/j.nimb.2009.03.019
Tegen, I., Lacis, A. A., and Fung, I. (1996). The Influence on Climate Forcing of mineral Aerosols from Disturbed Soils. Nature 380 (6573), 419–422. doi:10.1038/380419a0
Tomadin, L., Lenaz, R., Landuzzi, V., Mazzucoletti, A., and Vannucci, R. (1984). Windblown Dust over the central Mediterranean. Oceanol. Acta 7, 13–23.
Turato, B., Reale, O., and Siccardi, F. (2004). Water Vapor Sources of the October 2000 Piedmont Flood. J. Hydrometeor 5, 693–712. doi:10.1175/1525-7541(2004)005<0693:wvsoto>2.0.co;2
Urban, F. E., Goldstein, H. L., Fulton, R., and Reynolds, R. L. (2018). Unseen Dust Emission and Global Dust Abundance: Documenting Dust Emission from the Mojave Desert (USA) by Daily Remote Camera Imagery and Wind-Erosion Measurements. J. Geophys. Res. Atmospheres. doi:10.1029/2018jd028466
Van der Does, M., Knippertz, P., Zschenderlein, P., Giles Harrison, R., and Stuut, J.-B. W. (2018). The Mysterious Long-Range Transport of Giant mineral Dust Particles. Sci. Adv. 4 (12), eaau2768. doi:10.1126/sciadv.aau2768
Varga, G. (2020). Changing Nature of Saharan Dust Deposition in the Carpathian Basin (Central Europe): 40 Years of Identified North African Dust Events (1979-2018). Environ. Int. 139, 105712. doi:10.1016/j.envint.2020.105712
Varga, G., Cserháti, C., Kovács, J., Szeberényi, J., and Bradák, B. (2014). Unusual Saharan Dust Events in the Carpathian Basin (Central Europe) in 2013 and Early 2014. Weather 69 (11), 309–313. doi:10.1002/wea.2334
Varga, G., Dagsson-Waldhauserová, P., Gresina, F., and Helgadottir, A. (2021). Saharan Dust and Giant Quartz Particle Transport towards Iceland. Sci. Rep. 11, 11891. doi:10.1038/s41598-021-91481-z
Varga, G., Kovács, J., Szalai, Z., Cserháti, C., and Újvári, G. (2018). Granulometric Characterization of Paleosols in Loess Series by Automated Static Image Analysis. Sediment. Geology. 370, 1–14. doi:10.1016/j.sedgeo.2018.04.001
Varga, G., Kovács, J., and Újvári, G. (2013). Analysis of Saharan Dust Intrusions into the Carpathian Basin (Central Europe) over the Period of 1979-2011. Glob. Planet. Change 100, 333–342. doi:10.1016/j.gloplacha.2012.11.007
Varga, G. (2016). Recent and Past Saharan Dust Deposition in the Carpathian Basin and Itspossible Effects on Interglacial Soil Formation. Geophys. Res. Abstr. 18, EGU2016–124801.
Varga, G., Újvári, G., and Kovács, J. (2019). Interpretation of Sedimentary (Sub)populations Extracted from Grain Size Distributions of Central European Loess-Paleosol Series. Quat. Int. 502, 60–70. Part A. doi:10.1016/j.quaint.2017.09.021
Varga, G., Újvári, G., and Kovács, J. (2014). Spatiotemporal Patterns of Saharan Dust Outbreaks in the Mediterranean Basin. Aeolian Res. 15, 151–160. doi:10.1016/j.aeolia.2014.06.005
Wagenbach, D., and Geis, K. (1989). “The Mineral Dust Record in a High Altitude Alpine Glacier (Colle Gnifetti, Swiss Alps),” in Paleoclimatology and Paleometeorology: Modern and Past Patterns of Global Atmospheric Transport. Editors M. Leinen, and M. Sarnthein (Dordrecht: Kluwer), 543–564. doi:10.1007/978-94-009-0995-3_23
Walsh, J. J., and Steidinger, K. A. (2001). Saharan Dust and Florida Red Tides: The Cyanophyte Connection. J. Geophys. Res. 106 (C6), 11597–11612. doi:10.1029/1999jc000123
Washington, R., Todd, M., Middleton, N. J., and Goudie, A. S. (2003). Dust-Storm Source Areas Determined by the Total Ozone Monitoring Spectrometer and Surface Observations. Ann. Assoc. Am. Geogr. 93 (2), 297–313. doi:10.1111/1467-8306.9302003
Wheeler, D. A. (1986). The Meteorological Background to the Fall of Saharan Dust, November 1984. Meteorol. Mag. 115 (1362), 1–9.
Wurzler, S., Reisin, T. G., and Levin, Z. (2000). Modification of mineral Dust Particles by Cloud Processing and Subsequent Effects on Drop Size Distributions. J. Geophys. Res. 105 (D4), 4501–4512. doi:10.1029/1999jd900980
Yu, H., Chin, M., Yuan, T., Bian, H., Remer, L. A., Prospero, J. M., et al. (2015). The Fertilizing Role of African Dust in the Amazon Rainforest: A First Multiyear Assessment Based on Data from Cloud‐Aerosol Lidar and Infrared Pathfinder Satellite Observations. Geophys. Res. Lett. 42 (6), 1984–1991. doi:10.1002/2015gl063040
Yu, H., Kaufman, Y. J., Chin, M., Feingold, G., Remer, L. A., Anderson, T. L., et al. (2006). A Review of Measurement-Based Assessments of the Aerosol Direct Radiative Effect and Forcing. Atmos. Chem. Phys. Eur. Geosciences Union 6 (3), 666. doi:10.5194/acp-6-613-2006
Zender, C. S., Miller, R. L. R. L., and Tegen, I. (2004). Quantifying mineral Dust Mass budgets:Terminology, Constraints, and Current Estimates. Eos Trans. AGU 85 (48), 509–512. doi:10.1029/2004eo480002
Zhang, J., Genty, D., Sirieix, C., Michel, S., Minster, B., and Régnier, E. (2020). Quantitative Assessments of Moisture Sources and Temperature Governing Rainfall δ18O from 20 years' Monitoring Records in SW-France: Importance for Isotopic-Based Climate Reconstructions. J. Hydrol. 591, 125327. doi:10.1016/j.jhydrol.2020.125327
Keywords: saharan dust, Central Europe, wet deposition, particle size distribution, trajectory analysis
Citation: Rostási Á, Topa BA, Gresina F, Weiszburg TG, Gelencsér A and Varga G (2022) Saharan Dust Deposition in Central Europe in 2016—A Representative Year of the Increased North African Dust Removal Over the Last Decade. Front. Earth Sci. 10:869902. doi: 10.3389/feart.2022.869902
Received: 05 February 2022; Accepted: 25 March 2022;
Published: 13 April 2022.
Edited by:
Alexandre M. Ramos, University of Lisbon, PortugalReviewed by:
Pedro J. M. Costa, University of Coimbra, PortugalPedro M. Sousa, Portuguese Institute for Sea and Atmosphere (IPMA), Portugal
Copyright © 2022 Rostási, Topa, Gresina, Weiszburg, Gelencsér and Varga. This is an open-access article distributed under the terms of the Creative Commons Attribution License (CC BY). The use, distribution or reproduction in other forums is permitted, provided the original author(s) and the copyright owner(s) are credited and that the original publication in this journal is cited, in accordance with accepted academic practice. No use, distribution or reproduction is permitted which does not comply with these terms.
*Correspondence: György Varga, dmFyZ2EuZ3lvcmd5QGNzZmsub3Jn