 Hongyang Wang
 Shiming Yao3*
- 1State Key Laboratory of Hydrology-Water Resources and Hydraulic Engineering, Nanjing Hydraulic Research Institute, Nanjing, China
- 2State Key Laboratory of Water Resources and Hydropower Engineering Science, Wuhan University, Wuhan, China
- 3Key Laboratory of River Regulation and Flood Control of Ministry of Water Resources, Changjiang River Scientific Research Institute, Wuhan, China
Dam construction often changes downstream fluvial processes by reducing sediment supply. Taking Tiaoguan reach and Laijiapu reach of the lower Jingjiang Reach downstream of the Three Gorges Project as examples, three-dimensional flow velocity, sediment, and bed elevation were observed in the two bends for investigating the impact of flow structure and sediment transport of different discharges on sharp bend morphology. Results indicated that the flow structure and sediment transport process in curved channels depended upon the flow stages, which affected the patterns of erosion and deposition along the point bars and concave banks. Flow separation and development of secondary flow were depended on the shapes of point bars and flow depths nearby, and the strength of secondary flow increased with flow discharge. The high flow discharges, which had high sediment carrying capacity and stream power, provided the main driving force for erosion on upstream point bar, thus the type and duration of floods were crucial factors in the morphological evolution of meandering bends. The reduction of sediment supply should be responsible for erosion on the point bars, causing the flow to migrate toward the convex banks. In meandering rivers with reduced sediment supply, retreats (push inward) of inner (convex) banks dominated advances (pull inward) of outer (concave) banks. In addition, the formation and development of concave-bank bars might relate particularly to meander curvature. This study is expected to constitute a reference for bank protection and river management in meandering bends downstream of reservoirs.
1 Introduction
Sandy alluvial meandering rivers generally are highly dynamic in geomorphology, involving complex evolution processes of meanders. Therefore, it is necessary to understand the spatial variations of water flow and sediment transport in bends and the factors affecting these variations, such as riverbank erosion, flow structure, and riverbed material composition. It is also of great significance for studying the sandy alluvial meandering rivers in river rehabilitation, water resources management, and adaptation to climate change (Lotsari et al., 2010; Hooke and Yorke, 2011).
For meandering rivers, the evolution pattern of a single bend is controlled by the pattern of water flow, in turn, the flow structure is also affected by the curvature and path length of the bend (Hooke and Harvey, 1983). As the curvature and the intensity of secondary flow increase, the variation of flow structure lags behind the spatial feedback of riverbank erosion, and new translation or asymmetric planar development may occur (Ferguson, 1984). Once the channel length of a single bend exceeds the critical threshold (about tenfold the channel-width), the secondary flow starts to split (Thompson, 1984), resulting in scouring at bend apex (Hooke and Harvey, 1983) or in the straight channel between adjacent bends (Keller, 1972). The planar development of meanders is not only related to the flow structure, but also closely related to topography and time scale (Ferguson et al., 2003; Hooke and Yorke, 2010; Hooke and Yorke, 2011; Engel and Rhoads, 2012). In the past, the evolution of meandering rivers had been thought to be driven by concave-bank erosion (Hasegawa, 1989), while Eke et al. (2014) believed that convex-bank deposition would also induce concave-bank erosion, leading to bend migration. However, a consensus has not yet been reached whether the development of river meanders is caused by convex-bank deposition or concave-bank erosion.
Early theory of evolution in meandering rivers suggests that sediment transport is a reflection of the change of flow structure. Coarse sediment is transported along the concave bank where stream power is high, while point bars along the convex bank is usually composed of fine sediment (Dietrich and Smith, 1984; Clayton and Pitlick, 2007). Bridge and Jarvis (1982) also proposed that the relative difference of stream power reflects the spatial distribution of bedload transport in the channel, resulting in the morphological changes of point bars. The existence of secondary flow causes transverse transport of sediment in curved channel, so that it is easier for bed material to reach the threshold condition for motion than in straight channel (Yao and Zhang, 2001). Owing to the secondary flow, surface water flow with low suspended sediment concentration (SSC) moves to concave bank and then turns downward to the riverbed, while water flow on the bottom with high suspended sediment concentration moves to the convex bank (Ding, 1965; Sun, 1992). However, in mature bends with well-developed point bars, bedload transport along point bars decreases, while bedload transport along the thalweg will increase. Deposition on the margins of point bars and erosion on concave banks shift from downstream of the apex to upstream (Hickin, 1974; Hooke, 1975; Pyrce and Ashmore, 2005), which will lead to increased asymmetry of the bends.
Previous studies on hydrodynamics and morphodynamics of meandering rivers have been conducted mostly using laboratory experiments (Frothingham and Rhoads, 2003; Termini and Piraino, 2011; Blanckaert et al., 2013) or mathematical models (Leschziner and Rodi, 1979; Constantinescu et al., 2011). However, due to the limitation of measuring devices and cost, there have been few studies on the interaction between flow and sediment movement in natural rivers. Recently, some recent breakthroughs have been made (Bridge and Jarvis, 1976; O’Neal and Pizzuto, 2010; Flener et al., 2015), for example, O’Neal and Pizzuto (2010) introduced Ambient Light Sensor (ALS) in water surface mapping, which was based on Real Time Kinematic (RTK) global positioning system (GPS) field survey and ground orthophoto images, and obtained a high level of automation and accuracy. However, sediment sampling in the large-scale river is relatively difficult, including the flux and particle size composition of suspended sediment, bedload, and bed material. Therefore, there is much room for improvement in terms of combining field measurement and theory.
In addition, Ranzi et al. (2012) predicted that sediment load would decrease by 71%–95% downstream of the dam after reservoir impoundment, resulting in degradation of the riverbed at a rate much higher than that of natural rivers (Knighton, 1998; Lu and Liu, 1998; Xia et al., 2014). The construction of upstream dams changes discharges and sediment supplies downstream of them, affecting the formation and quantity of sand bars in the channel (Macklin and Lewin, 1989; Joeckel and Henebry, 2008). However, as a fundamental component of alluvial river systems, the importance of sustained sediment supply for the evolution of meandering planforms remains unclear. After the Three Gorges Project (TGP) operation, sediment load has been reduced significantly in the lower Jingjiang River (LJR), and the main channel between Tiaoguan and Laijiapu began to swing toward the convex bank (Lu et al., 2010; Zhu et al., 2017). At present, there has been few studies on this problem, and the observed data cannot fully reveal the impact of sediment reduction on the morphological adjustment of meandering channel, thus it is difficult to predict the evolution trend of the meandering river (Zhang and Jiao, 2002; Xu and Milliman, 2009; Yang et al., 2014).
The purpose of this study is to explore the effect of flow-sediment interaction on the “push-pull” behavior of concave bank and convex bank in meandering rivers with insufficient sediment supply. Firstly, the variation of water flow and sediment supply, grain size distribution of suspended sediment (intra-annual and inter-annual) in the LJR before and after the TGP were compared and analyzed. Secondly, the spatial variability of flow structure, suspended sediment concentration, and sediment carrying capacity at different discharges in two sharp bends were compared and analyzed. Thirdly, the spatial distribution of stream power and the morphological changes of point bars and concave bank in the flood season were associated and analyzed. Finally, the effect of water flow and sediment movement on the morphological changes of meander bends with reduced incoming sediment was discussed comprehensively.
2 Study Area
The Yangtze River is the longest river in China with a total length of 6,387 km, and it is usually divided into upper (4,504 km in length), middle (955 km in length), and lower (938 km in length) reaches. The Jingjiang Reach (347 km in length) is located in the Middle Yangtze River (MYR), which starts at Zhicheng and ended at Chenglingji. Bounded by Ouchikou, the Jingjiang Reach is generally divided into the Upper Jingjiang Reach (UJR, 172 km in length) and the Lower Jingjiang Reach (LJR, 175 km in length) (Cao and Wang, 2015; Yu, 2017).
The LJR is located at 274 km downstream of the Three Gorges Dam (TGD), which includes the reaches from Ouchikou to Chenglingji with a curvature of 2.16 (Yu, 2017). The river banks of LJR belong to a soil-sand binary structure, the upper layer is clay, and the lower layer is medium-fine sand, resulting in a weak scour resistance. In addition, the riverbed is sandy structure, mainly composed of fine sand (0.1–0.25 mm), and the variation of size is small (Xia et al., 2014; CWRC, 2017; Yu, 2017). According to incomplete statistics, the bank revetment length of LJR had reached at least 146 km since the 1980s and the LJR had gradually developed into a restricted meandering channel (Xia et al., 2016; Yu, 2017). At present, the LJR is composed of 11 bends, namely Shishou, Shatanzi, Tiaoguan, Laijiapu, Jianli, Fengtuling, Jingjiangmen, Xiongjiazhou, Qigongling, Guanyinzhou and Zhuoyuzhou, and the annual flow discharges are slightly affected by three diversion branches in the right bank of UJR, which diverts part of flood in the MYR to Lake Dongting downstream (Figure 1A). In addition, the hydrological conditions of the LJR are monitored by the Jianli hydrological station, which is located at the middle of the LJR (about 347 km downstream of the TGD).
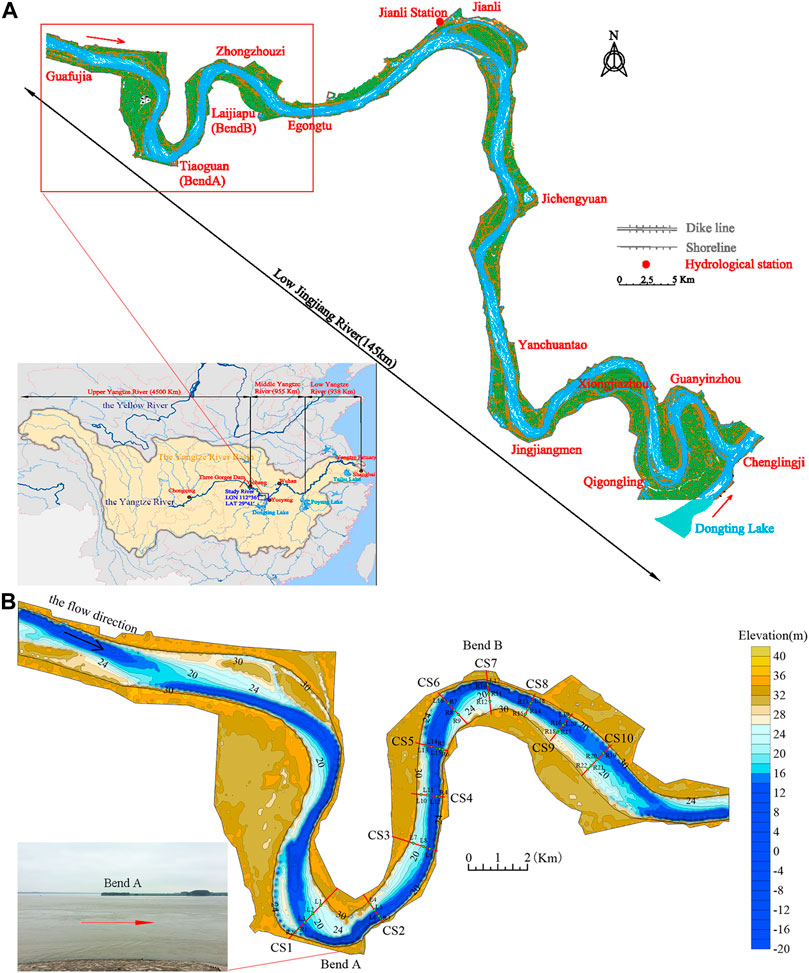
FIGURE 1. (A) The LJR and the Yangtze River Basin, including the location of hydrological station and the study area. (B) Sketch maps of the study area from Tiaoguan reach (Bend A) to Laijiapu reach (Bend B), including cross sections CS1-CS10, where measurements were taken.
In this article, the study area (about 22.5 km in length) is located in Shishou City, Hubei Province, China, including the Tiaoguan reach (Bend A) and the Laijiapu reach (Bend B) in the LJR. The two bends form a reversed “S” shape, and the curvature radius (1,030 m) of Bend A is smaller than that (1,220 m) of Bend B (Figure 1B). The study area has a continental climate with a great seasonal variation with a great seasonal variation. The average annual precipitation is 1,240–1,400 mm, concentrated between March and July, and the maximum annual variation of water level is 10–13 m. Since 2003 (after the TGP operation), affected by changes of water and sediment supply, both the morphological changes of two bends have been “erosion on point bar, and deposition near concave bank” to some extent, affecting the stability of the river channel (Yu, 2017).
3 Data and Methods
3.1 Data Source and Variations in Flow and Sediment Regimes
The hydrological dataset of the LJR from 1981 to 2017 was obtained from the Changjiang Water Resources Commission (CWRC), including the daily discharges, water levels, suspended sediment concentration, and sediment load at the Jianli hydrological station. The topographic maps (the scale: 1:10,000) of the LJR for 2002 and 2016 were also collected from the CWRC.
After the TGP operation (2003–2017), the annual average runoff and sediment load at Jianli hydrological station had decreased by about 4.5% and 81.5% compared with that before the TGP (1981–2002), respectively (Figure 2). The influence of the TGP on flow discharge was mainly manifested by the reduction of peak discharges, and the increase of low discharges. The annual hydrograph had become more uniform since the Three Gorges Dam increased water release before flood season and stored water at the end of flood season. However, sediment supply to downstream had been greatly reduced, especially during flood season.
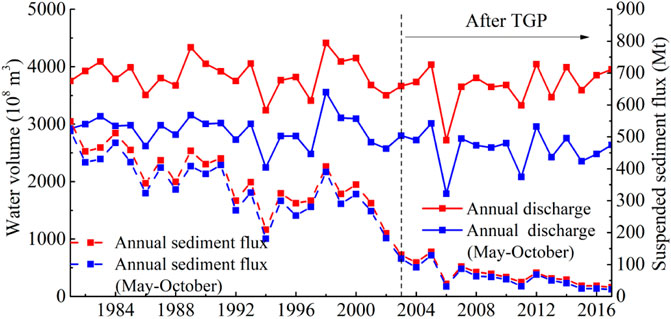
FIGURE 2. Variations of water volume and sediment flux at the Jianli hydrological station from 1981 to 2017.
According to the annual flow discharges process at the Jianli hydrological station, the characteristic discharges of low-water and bankfull channels in the LJR were about 6,000 m3/s and 22,000 m3/s, respectively. Therefore, the low discharge of 6,000 m3/s, the medium discharge of 15,000 m3/s, and the bankfull discharge of 22,000 m3/s were selected as the characteristic values. The annual discharges were divided into four levels, and the duration of each level discharges was counted.
The durations of medium and high discharges in the LJR had increased significantly after the TGP operation (2003–2017), while the durations of flood and low discharges had decreased considerably (Figure 3). After the TGP operation, the durations of medium discharges (6,000–15,000 m3/s) and medium/high discharges (15,000–22,000 m3/s) increased from 34.5% to 18.1%–62.2% and 24.1%, respectively. While, the durations of low discharges (<6,000 m3/s) and flood discharges (>22,000 m3/s) had reduced from 30.4% to 17%–9.9% and 3.8%, respectively.
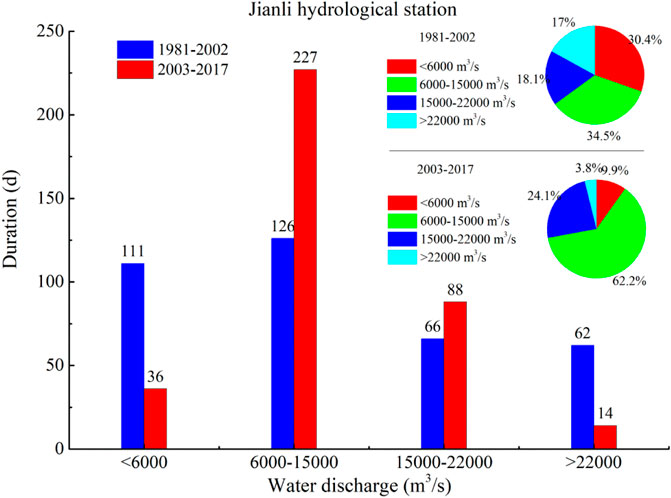
FIGURE 3. Duration of characteristic discharges at the Jianli hydrological station before and after the TGP operation.
After the impoundment of TGP (2003–2014), affected by the continuously scouring of the riverbed, the proportion of coarse sediment in suspended sediment had increased, and the proportion of fine sediment had decreased (Table 1). The proportion of coarse sediment (>0.125 mm) increased to 34.2%, while the proportion of fine sediment (<0.031 mm) and medium sediment (0.031–0.125 mm) in the suspended sediment at the Jianli hydrological station decreased by 22.9% and 0.5%, respectively. Especially, the coarsening trend of suspended sediment is prominent in 2015.
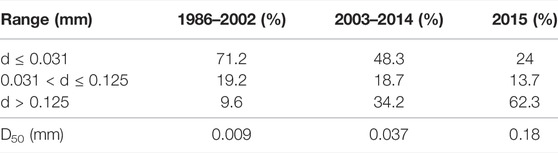
TABLE 1. Percentage of different suspended sediment grain sizes at the Jianli hydrological station.
During the flood season in 2016, the duration of discharges of medium/high (12,000–22,000 m3/s) was about 48%. The flood discharges (>22,000 m3/s) was concentrated in June-July, accounting for only 18% of the flood season, and the peak discharge was about 26,500 m3/s. In addition, the suspended sediment concentration was relatively low and uniform during the flood season, and remained below 0.1 kg/m3, but surged slightly in July-August (Figure 4).
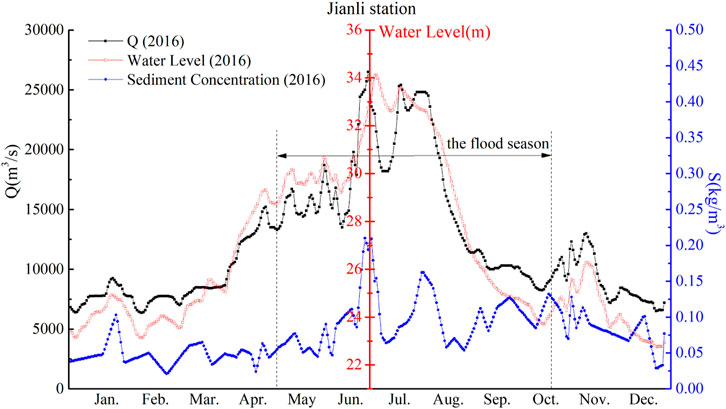
FIGURE 4. Discharge, water level and suspended sediment concentration at Jianli hydrological station in 2016.
3.2 Field Campaign and Data Processing
Ten hydrological survey transects (CS1-CS10) were laid out from Tiaoguan reach (Bend A, CS1-CS4) to Laijiapu reach (Bend B, CS5-CS10), and the surveyed river section was about 18 km long (Figure 1A; Table 2). Three field campaigns (on June, 2016, October, 2016, and July, 2019) were conducted for measurements of flow velocity, water level, suspended sediment concentration and size, bed materials, and morphological changes during medium flow (about 18,000 m3/s), low flow (about 8,000 m3/s) and bankfull flow (about 24,000 m3/s).
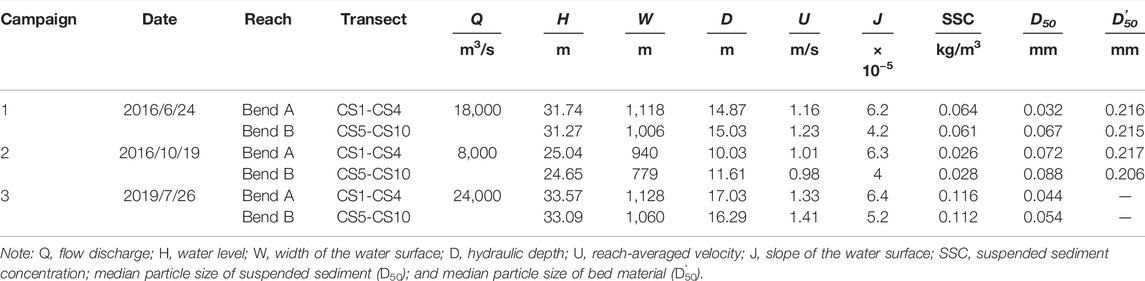
TABLE 2. Reach-averaged hydraulic characteristics obtained from the field campaigns.
The three-dimensional (3D) flow velocity and direction data of ten cross sections (CS1-CS10) were collected on a continuous moving hydrographic vessel (Figure 5A) using an Acoustic Doppler Current Profiler (ADCP) with a resolution of 0.1 cm s−1. During the three field campaigns, the water levels of transects were measured using a total station with a precision of 2 mm, and the error of repeated measurement was within 0.05 m. The bathymetric data were collected on each transect with the real-time kinematic global navigation satellite systems (RTK-GNSS) using Global Positioning System (GPS), and the accuracy of the surveys was ± 0.1 cm for horizontal coordinates and ± 0.2 cm for elevations. Particularly, an echo sounding system (Model HY-1601) was employed in association with the RTK-GNSS in the aquatic zones, achieving a point distance of 15–25 m over the whole measured cross section. In dewatered areas, topographic surveys of ten cross sections were conducted using the total station on non-vegetated zones (steady banks) coupled with the RTK-GNSS.
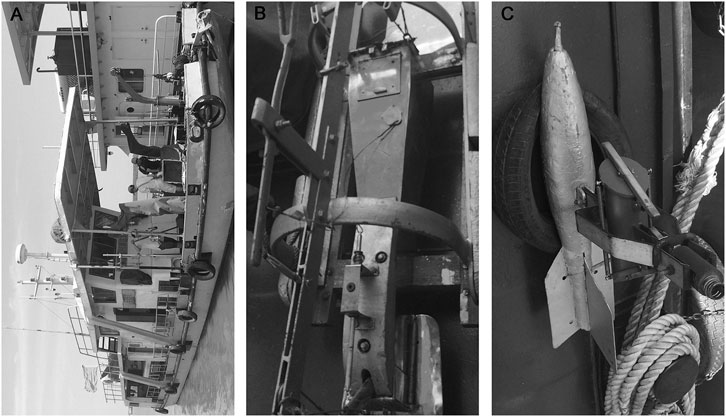
FIGURE 5. Field photographs of (A) hydrographic survey vessel, (B) bedload sampler (Model Y78-1), and (C) horizontal-type suspended sediment sampler.
In addition, sediment trapping systems were mounted on the hydrographic survey vessel, including a bedload sampler (Model Y78-1) (Figure 5B), a horizontal-type suspended sediment sampler (Figure 5C), and a cone or bucket model bed material sampler. During each campaign, we collected sediment samples at ten transects (CS1-CS10) distributed in different parts of Bends A and B. During the collection of suspended load samples, 6–8 perpendicular lines along each cross section were established in the same place during three campaigns, and each perpendicular line contained five observation points from the water surface to bottom (at the water surface, depth of 20%, depth of 60%, depth of 80%, and bottom). To analyze the variation of particle size composition of sediment on the point bars and concave banks during flood season, the bed materials were also sampled in campaigns 1 and 2, and the sampling locations coincided with distribution of specified perpendicular lines during the collection of suspended sediment samples. The bedload samples were collected at 2–5 min intervals at the transects of CS3 (the tail of point bar A), CS6 (the upstream of point bar B), and CS9 (the tail of point bar B) in each field survey, and the observed points coincided with the bed materials. The grain-size distributions of sediment were determined using a laser granulometry, and coarse sediment (>2 mm) was analyzed using standard sieving. In our study, the flow velocity and direction data were extracted from the ADCP measurement according to the distribution of sampled points of suspended sediment. From the measurements, we obtained some detailed hydraulic information as shown in Table 2.
3.3 Methods
3.3.1 Calculation Method for Sediment Carrying Capacity
Based on the energy balance theory and the hypothesis of turbulent kinetic energy balance, Zhang (1989) generalized a suspended sediment carrying capacity formula from a large number of measured data in natural rivers. The formula could be applied well to alluvial rivers, including the Yangtze River. The formula is as follows:
where Sm is the suspended sediment transport capacity in kg/m3; K is a sediment transport capacity coefficient; m is a sediment carrying capacity index; U is the velocity in m/s; h is the water depth in m; g is the gravity acceleration in m/s2; and ω is the settling velocity of sediment particle in m/s. Based on field observation data, the sediment carrying capacity coefficient K is 0.065–0.07, and the sediment transport capacity index m is 1.12–1.41.
3.3.2 Calculation Method for Stream Power
The key parameters of sediment transport capacity were collected at the surveyed points (Figure 1A), including the median diameter of bed sediment (D'50), the critical velocity, the near-bed velocity, and the stream power during different discharges. The Shamov’s critical velocity formula (Shao and Wang, 2005) is adopted:
where Uc is the critical velocity of bed sediment in m/s, γs is the specific weight of sediment in kg/(m s)2, γ is the specific weight of water in kg/(m s)2, D is the particle size of sediment in m and is represented by D’50 in this article, and h is the water depth in m.
Bagnold equation is used to calculate the stream power (Bagnold, 1966), the formula is:
where W is the stream power per unit area in w/m2, ρ is the density of water in kg/m3, g is the gravitational acceleration in m/s2, H is the water depth in m, J is the slope, and v is the velocity in m/s.
4 Results
4.1 Flow Structure in Two Sharp Bends
4.1.1 Bankfull Discharge
During the bankfull discharge (24,000 m3/s), the high velocity core (HVC) in Bend A and Bend B moved downstream from the point bar to concave bank. In the upstream parts of Bend A (CS1) and Bend B (CS5, CS6), the HVC (1.6–2.0 m/s) were “narrow-deep” in shape, and there were obvious slow-flow areas (−0.2 to 0.3 m/s) near the concave banks. In the downstream parts of Bend A (CS2) and Bend B (CS7, CS8), the HVC (1.8–2.2 m/s) had migrated to the outer bank and the deep/middle shoals. Compared with the upstream parts of two bends, the velocities of the downstream parts increased slightly. In addition, in the upstream parts of two bends, the flow direction was mainly downward and outward, and downward flow was concentrated in the shallow/middle shoals, although the intensity was weak. The current began to separate near the convex bank, and the lateral component of the outward flow increased obviously. But the intensity of the cross-stream flow near the concave bank decreased obviously. With the narrowing on convex banks in the downstream parts of two bends, the inward flow with high intensity was founded near the middle/deep shoals. For the Bend A, there was a sign of secondary flow near the thalweg, and the maximum cross-stream velocity (0.51 m/s) occurred near the shallow shoal.
4.1.2 Medium Discharge
For the bankfull and medium discharges, the HVC was closer to the surface in the upstream parts of both bends than in the downstream parts, and the flow velocity in both bends increased from upstream to downstream (Figure 6). During the medium discharge of 18,000 m3/s, in the upstream Bend A (CS1), the area of HVC and the flow velocity decreased significantly (maximum velocity: from 2.2 to 1.3 m/s). As the water depth decreased, a reversed secondary flow (flowing inward on the surface) tended to form near the submerged bar and collided with the secondary flow (flowing outward) on the convex bank. In the downstream Bend A (CS2), the area of HVC shrank on the deep shoal (maximum velocity: from 2.4 to 1.9 m/s). Reversed secondary flow tended to form both near the thalweg and deep shoal, and a weak stagnation point formed in the separation zone. High cross-stream velocity (0.3–0.35 m/s) was mainly distributed in the middle and shallow shoals. For the Bend B, there was no obvious lateral movement of the HVC along the bend (CS5-CS8), and the HVC was mainly distributed in the middle and deep shoals. There was an obvious slow-flow zone near the concave bank in the upstream Bend B, which was more obvious than that of Bend A. The maximum cross-stream velocity decreased to 0.2 m/s, and the variation of transverse current was mainly concentrated near the deep shoal. There was a flow separation at the entrance of Bend B (CS5), and flow near the point bar was downward and inward while flow in the thalweg was outward and downward. The transverse flow intensified in the upstream Bend B (CS6), reaching the maximum velocity of 0.5 m/s near the deep shoal, and the transverse flow of the main channel and the deep shoal moved from the inner bank to the outer bank. The transverse velocity reached the maximum (0.6 m/s) in the downstream of apex (CS7), and downward current was concentrated on the shallow and middle shoals while flow near the concave bank moved inward. At the exits (CS3 and CS8) of both bends, the secondary flow was not dominated by transverse flow and was mainly affected by downward flow, and had a very small velocity (below 0.1 m/s).
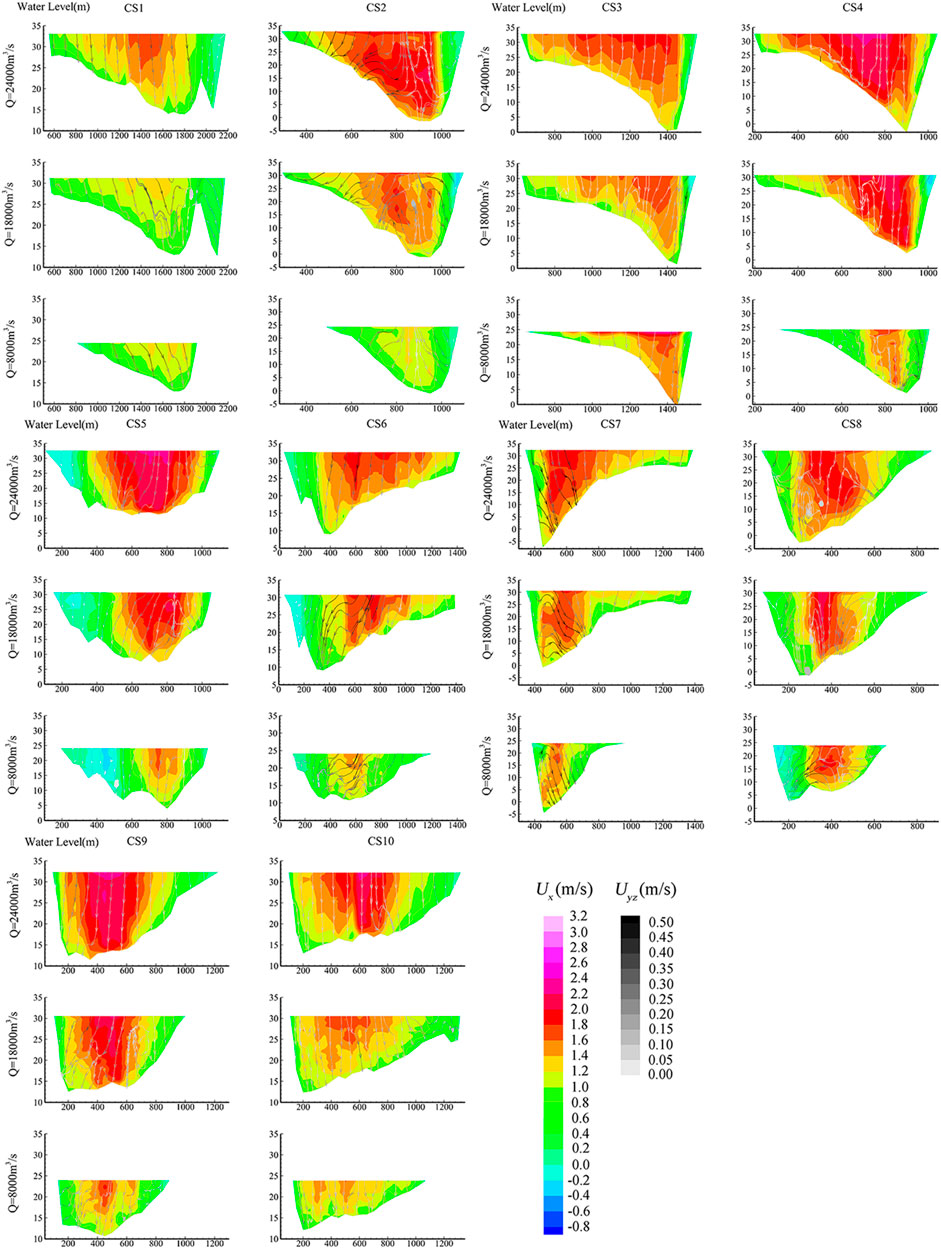
FIGURE 6. The flow distribution on Bend A and Bend B. The streamwise flow velocity (Ux) is shown with a contour map, and the isoline interval is 0.2 m/s, ranging from −0.8 to 3.2 m/s. The cross-stream velocity (Uyz) is shown with streamlines and the value of gray scale represents the velocity magnitude, ranging from 0.00 to 0.50 m/s. Especially, the “shallow shoal” refers to that part (above 24 m) of the convex bank that will be exposed during low water, and the “deep shoal” refers to that part (under 16 m) of the convex bank that is always submerged, while the “middle shoal” refers to that part of the convex bank that is in between “shallow shoal” and “deep shoal” in this article.
4.1.3 Low Discharge
During the low flow (8,000 m3/s), about 40% of the point bars in both bends were exposed, including almost all of shallow shoals, while the middle and deep shoals were still submerged. The area and velocity of HVC along the two bends further reduced and were mainly distributed near the thalweg and deep shoals. As the discharge decreased, the HVC moved from the inner bank to the outer bank and from downstream to upstream (CS1-CS3, CS5-CS7). In addition, the slow-flow zone in Bend A obviously shrank, especially in downstream part of the Bend A apex. However, there was still an obvious slow-flow zone close to the concave bank in the upstream part (CS5, CS6) of Bend B. Although the intensity of secondary flow increased with the discharges, the medium discharge’s effect of promoting secondary flow appeared to be stronger than that of both low-flow discharge and bankfull discharge. The vertical component of the current increased relative to the lateral component near the thalweg in the downstream part of the Bend A apex (CS2) and in the upstream part of Bend B (CS5, CS6). Thus, a weak flow separation was still obvious, leading to the formation of a slow-flow zone on the concave bank. A more obvious flow separation was often located downstream of the apexes in the two bends (CS2, CS8), and as the flow magnitude increased, the flow separation extended further downstream.
4.2 Suspended Sediment Transport
4.2.1 Sediment Distribution
4.2.1.1 Bankfull Discharge
At the bankfull discharge (24,000 m3/s), the high SSC (0.3–0.4 kg/m3) in the Bend A (CS1-CS4) was mainly distributed in the middle and shallow shoals of the convex bank, and the SSC of transect CS3 reached the maximum at the downstream. The variation of SSC in the Bend B (CS5-CS10) was similar to that in Bend A. From the upstream to apex of the bend, the water body with high sediment concentration climbed gradually from the deep shoal of the convex bank to the medium and shallow shoals, but showing an opposite trend from the apex to downstream (Figure 7).
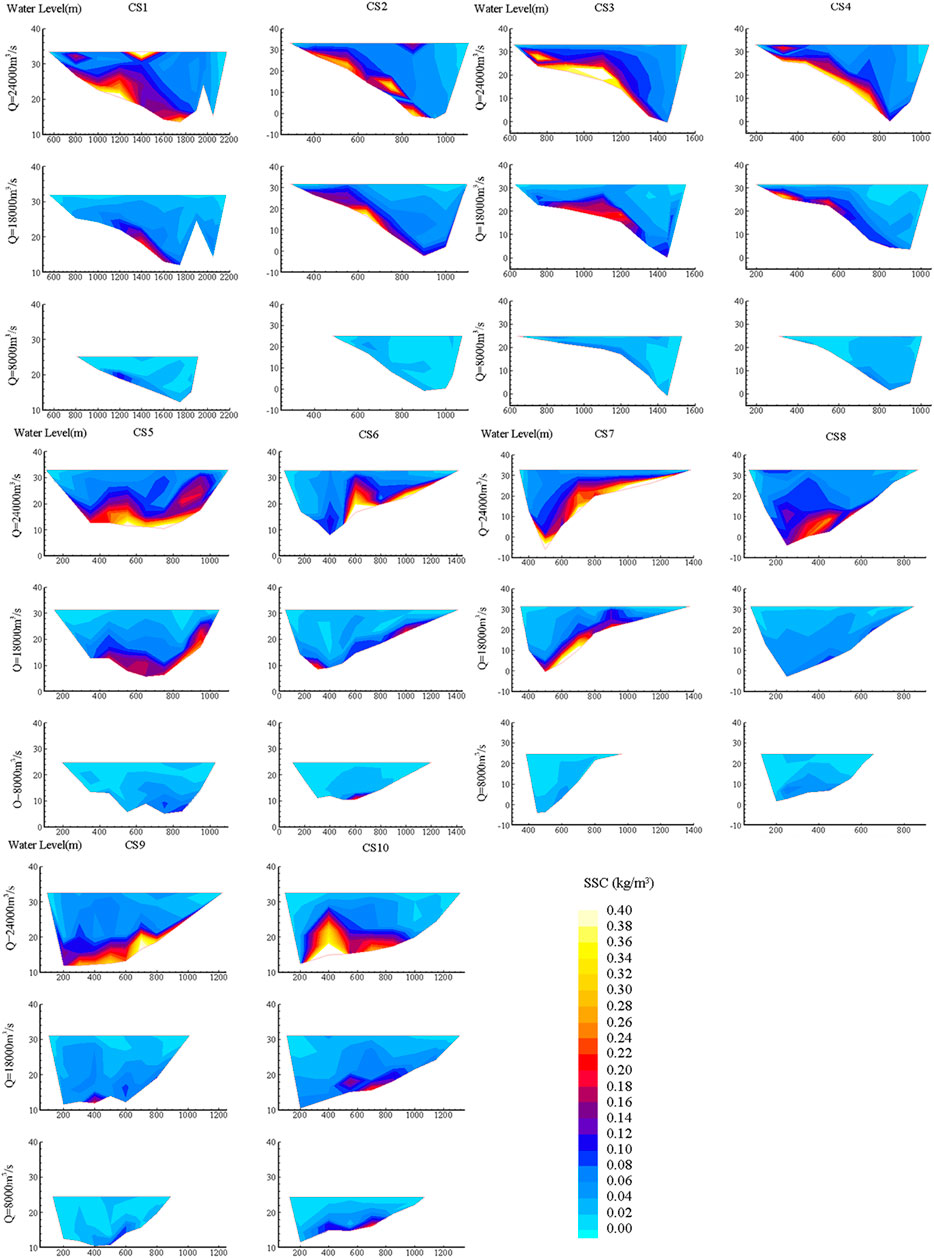
FIGURE 7. Contour map of suspended sediment concentration (SSC) in Bend A and Bend B at different discharges. The suspended sediment concentration varies between 0.00 and 0.40 kg/m3, and the isoline interval is 0.02 kg/m3.
4.2.1.2 Medium Discharge
At the medium discharge (18,000 m3/s), the water column of Bend A (CS1-CS4) was clear on the surface and turbid on the bottom, and high suspended sediment concentration (SSC) was mainly near the bed on the convex bank. Meanwhile, the high SSC of Bend A (CS1) was mainly located near the deep shoal, with a maximum of 0.16 kg/m3. In the downstream part of Bend A (CS2-CS4), the high SSC shifted to the shallow shoal, with a maximum of 0.4 kg/m3 (CS2). In the Bend B (CS5-CS10), the distribution of SSC was similar to that of the Bend A, but the gradient and average value of SSC near the bed was less than that of Bend A. There were two high SSC cores at the entrance of Bend B (CS5), a core was located in the lowest third of the water column above the thalweg, and the other core was in the near-bed area on the convex bank, with a maximum of 0.28 kg/m3. In the downstream part of Bend B, high SSC was detected near the deep shoals (CS7) close to the Bend B apex, with a maximum SSC of 0.4 kg/m3. On the whole, the SSC of the convex bank in the upstream part of Bend B was higher than that in the downstream part.
4.2.2.3 Low Flow
At the low-flow discharge (8,000 m3/s), SSC in both bends was significantly lower than that during high discharge, the gradient of SSC also decreased obviously, and high SSC was still distributed in the near-bed area on the convex bank. In the Bend A, except transect CS1 where high SSC was on the middle shoal just like that during medium flow, high SSC elsewhere shifted to the deep shoal, or even to the thalweg (CS2, CS3, CS4). The maximum SSC was only 0.14 kg/m3 (CS1). Compared to Bend A, the core area with high SSC in Bend B was mainly distributed in the near-bed area of the deep shoal and the thalweg, and the SSC on the middle shoals obviously increased downstream along the bend. The maximum SSC of 0.2 kg/m3 was located near deep shoal in the upstream Bend B (CS6) and at the outlet of Bend B (CS10).
4.2.2 Sediment Carrying Capacity and Median Particle Size (D50)
During the medium and high discharges (18,000 and 24,000 m3/s), the SCC was significantly higher than the SSC on the middle and shallow shoals in the upstream part of Bend A (CS1), the difference between SSC and SCC was smaller or even reversed on the deep shoal and on the concave bank, and coarse suspended sediment with high SSC was mainly concentrated on the middle shoals. In addition, the distribution of SCC at the point bar was similar to the distribution of SSC in the upper part of Bend B (CS5, CS6), but the SSC was significantly higher than the SCC on the concave bank at the entrance of Bend B (CS5). Coarse suspended sediment was mainly concentrated on the point bar, especially on the middle and shallow shoals. In the downstream parts (CS2, CS3, CS7, and CS8) of both bends, the SCC fell below the SSC on the middle and shallow shoals. But at the exits of the two bends (CS4, CS9, and CS10), high SCC and coarse suspended sediment gradually transferred to the thalweg and deep shoals. However, the variation of SCC in Bend A was larger than in Bend B (Figure 8).
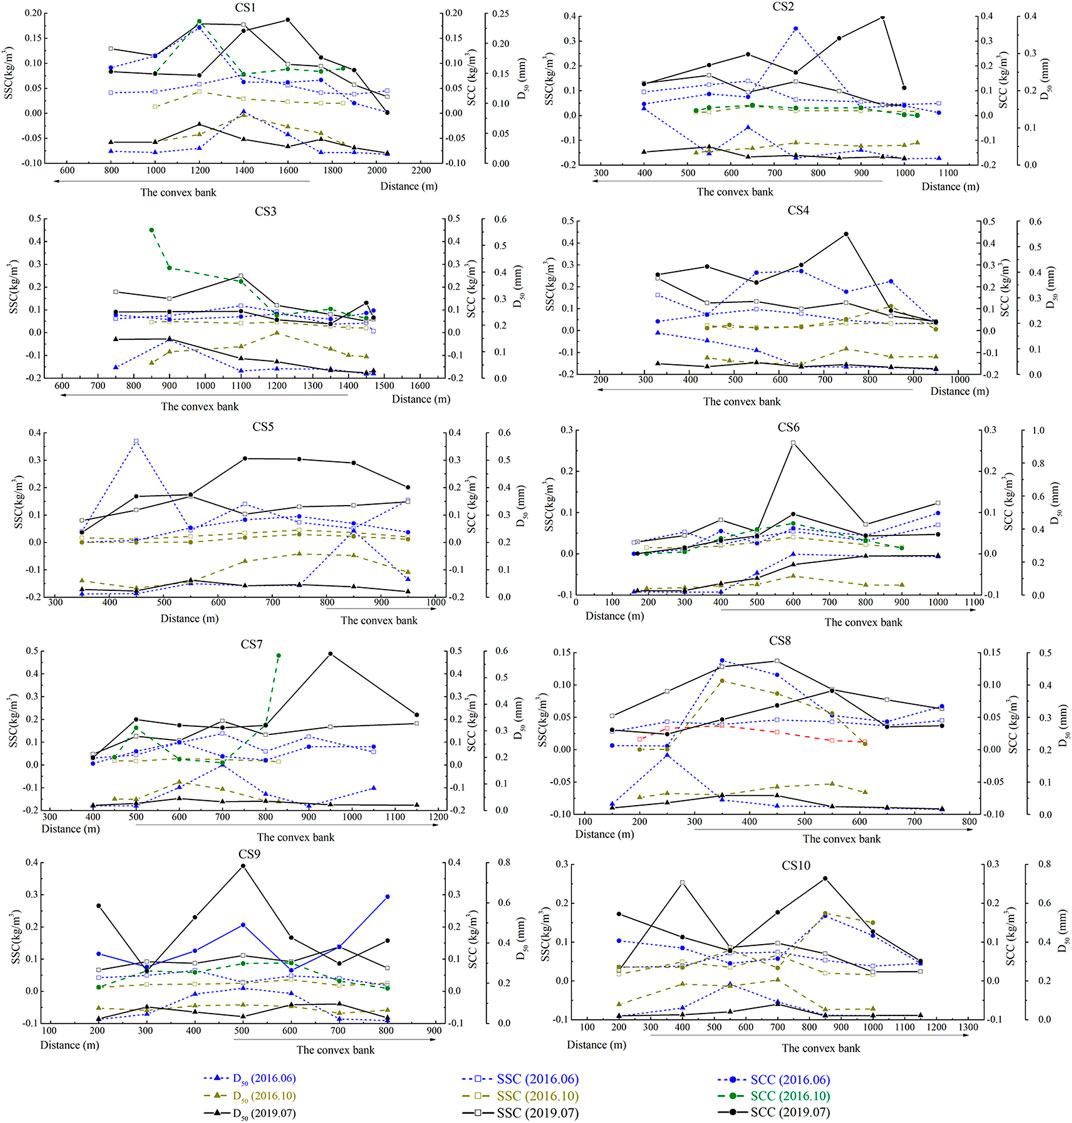
FIGURE 8. Variations of sediment carrying capacity (SCC), suspended sediment concentration (SSC), and suspended sediment median grain size (D50) in Bend A and Bend B during different discharges.
During the low-flow discharge (8,000 m3/s), the SSC along the two bends was significantly lower than that of high flow, and the particle size distribution of suspended sediment along the bends was also more uniform. However, as the water depth decreased, the SCC on deep shoal and near the concave bank of Bend A (CS1) began to increase dramatically, while the SCC in Bend B (CS5,CS6), had a smaller curvature than Bend A, decreased. In the downstream parts of both bends, the middle and shallow shoals tended to have higher SCC than that of high flow, for example, the SCC increased to 0.4 kg/m3 in transect CS3, and to 0.48 kg/m3 in transect CS7. Changes of SCC in other areas were not obvious.
4.3 Stream Power
During the bankfull discharge (24,000 m3/s), the near-bed velocity in the convex bank of Bend A exceeded the critical velocity for incipient motion of D’50 (Table 3). In the upstream part of Bend A (CS1), the minimum value appeared on the shallow shoal (L1, 2.4 w/m2). In the downstream part of Bend A (CS2), the stream power increased gradually from the shallow shoal to the deep shoal on the point bar (L4-L6). But the stream power on the shallow shoal decreased slightly from upstream (L1, 2.4 w/m2) to downstream (L4, 2.16 w/m2), while the stream power on the middle and deep shoals increased double from upstream (L2, L3) to downstream (L5, L6). In the upstream part of Bend A (CS1), the near-bed velocity (R2, 0.12 m/s) on the right margin of submerged sand bar was much lower than the critical velocity of D’50 (0.43 m/s) (Table 4), while the stream power (8.35 w/m2) on the concave bank (R3) of the downstream part (CS2) of Bend A was much higher than that (R1, R2) of the upstream Bend A (CS1). The distribution of stream power along the Bend B was similar with that of Bend A, and the stream power (>8 w/m2) was mainly located near the middle and deep shoals.
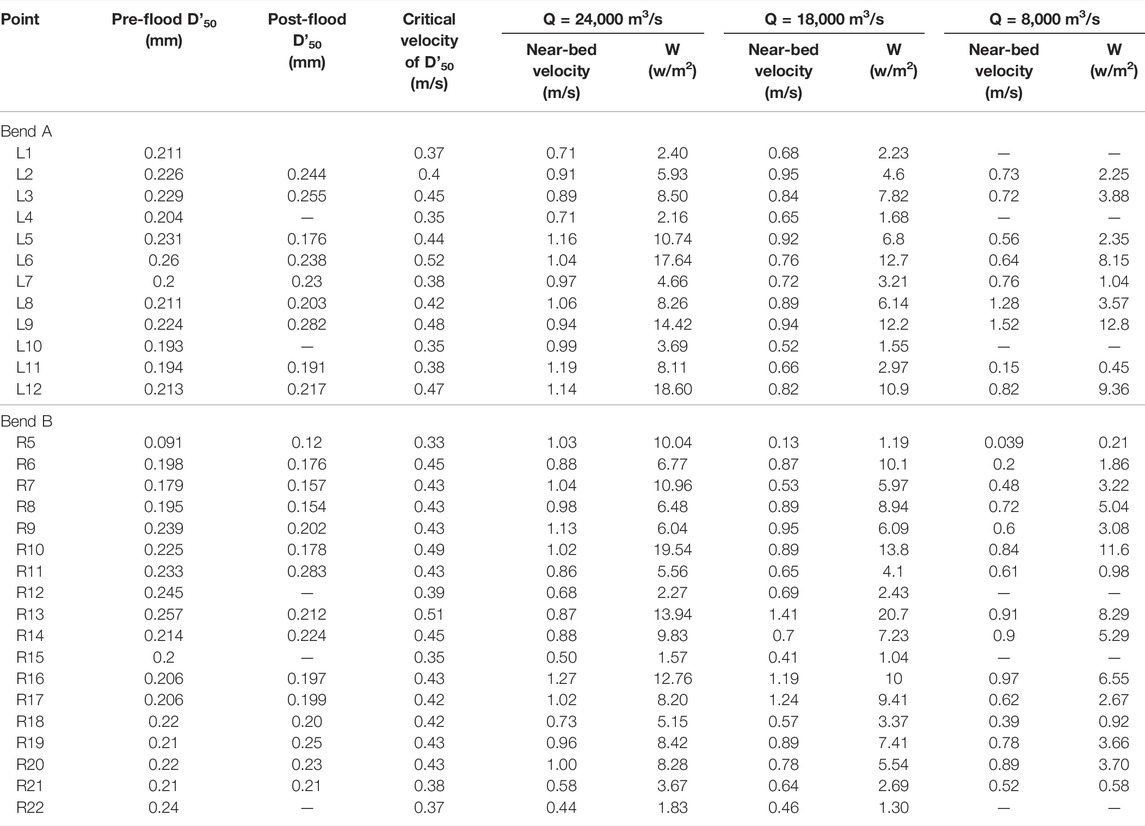
TABLE 3. Comparison between critical velocity of bed material, near-bed velocity, and stream power at different flow discharges on the convex bank.
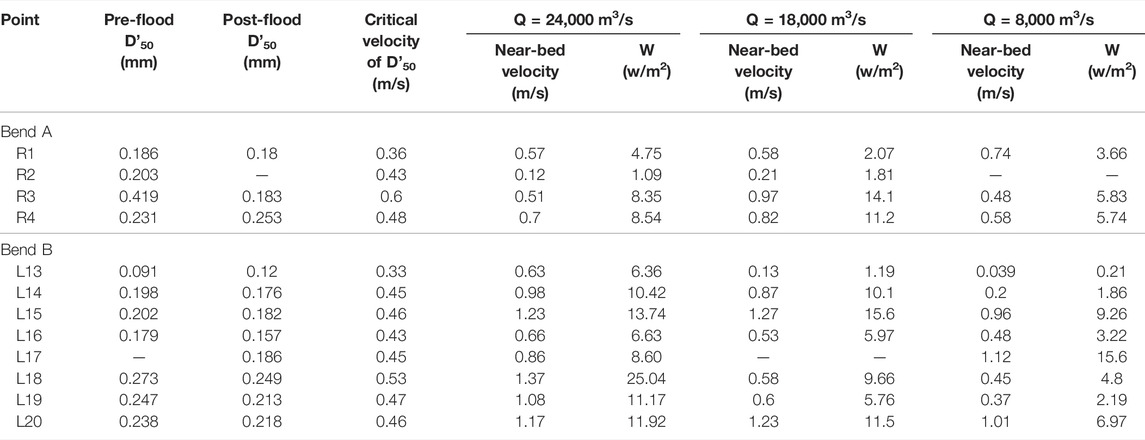
TABLE 4. Comparison between critical velocity of bed material, near-bed velocity, and stream power at different flow discharges on the concave bank.
During the medium flow (18,000 m3/s), the near-bed velocity (except R5) on the point bars of both bends exceeded the critical velocity of D’50 (Table 3), and it was similar to that on the concave banks (except R2 and L13). Compared with that during the bankfull discharge, the stream power decreased in the entire Bend A, but the stream power (7.82 w/m2) on deep shoal (L3) was significantly higher than that of middle shoal (L2) and shallow shoal (L1) in the upstream Bend A (CS1). Stream power increased gradually from shallow shoal to deep shoal along the convex bank, which is different from that of bankfull discharge. What’s more, the more downstream (CS2-CS4), the more difference between the stream powers of shallow, middle, and deep shoals were found. The stream power (10.9 w/m2) on the deep shoal (L12) at the outlet (CS4) of Bend A equaled 3.67 times that of the middle shoal, and 7.03 times that of the shallow shoal, respectively. However, the critical velocity of D’50 (0.33 m/s) was less than the near-bed velocity (R5, 1.19 m/s) of the deep shoal at the entrance of Bend B (CS5), and the stream power (1.19 w/m2) was only 11.8% of that on the shallow shoal (R6). In the upstream Bend B (CS6), high stream power (R8, 8.94 w/m2) transferred to the middle shoal, but high stream power (R10, 13.8 w/m2; R13, 20.7 w/m2) moved to the deep shoal in the downstream (CS7, CS8). Compared with that during the bankfull flow, the stream power near the concave bank (R1, R2, R3) in the Bend A both increased slightly.
During the low flow (8,000 m3/s), some shallow shoals (L1, L4, L10, R12, R15) in the two bends emerged, and some middle shoals (L11, R6, R18) became so shallow that the near-bed velocity dropped below the critical velocity of D’50. The stream power was obviously weaker than that during the high flow. The stream power in Bend A (CS1-CS4) increased from middle shoals to deep shoals. Compared with the high flow, the increase of stream power occurred more upstream in Bend A, and the increment was smaller. In the Bend B, the variation trend of stream power from the convex bank to the thalweg was similar to in Bend A. In the upstream part of Bend B (CS6), the stream power (5.04 w/m2) on middle shoal (R8) was greater than on deep shoal. On the concave bank (R3, L13, L14, L18, L19) of the two bends, the near-bed velocity was less than the critical velocity of D’50, high stream power was distributed near the thalweg, and the stream power along the concave bank was generally weak (less than 5 w/m2).
4.4 Morphological Adjustment After the TGP Operation
4.4.1 Erosion and Deposition
After the TGP operation (2002-2016), both the bends at Tiaoguan and Laijiapu generally experienced the serious erosion (Figure 10). Continuous erosion occurred in the upstream parts of the point bars, and deposition occurred near the upper concave bank. Especially, a bench was forming near the concave bank of the bend at Tiaoguan (Bend A). While the downstream parts of the two bends were characterized by siltation on point bar tails and erosion near the thalweg. This phenomenon actually reflected that the thalweg was deviating from the concave bank and shifted toward the convex bank.
4.4.2 Morphological Changes During Flood Season
The width-depth ratios of the bankfull channel in the upstream parts of Bend A (CS1) and Bend B (CS5, CS6) before flood season were 3.4, 1.7, and 2.9, respectively, which decreased to 3.2, 1.6, and 2.7 after flood season. The width-depth ratios of the bankfull channel in the downstream parts of Bend A (CS2, CS3) and Bend B (CS7, CS8) were higher than the upstream parts of the bends by 0.1–0.2. However, the width-depth ratios of the low flow channel during flood season all decreased to some extent except in the downstream part (CS3) and the outlet (CS4) of Bend A. This decrease was especially strong in the upstream parts of the two bends (Figure 11A). During flood season, the point bars and the entire thalweg were scoured, and the cross-section became deep (Figure 9).
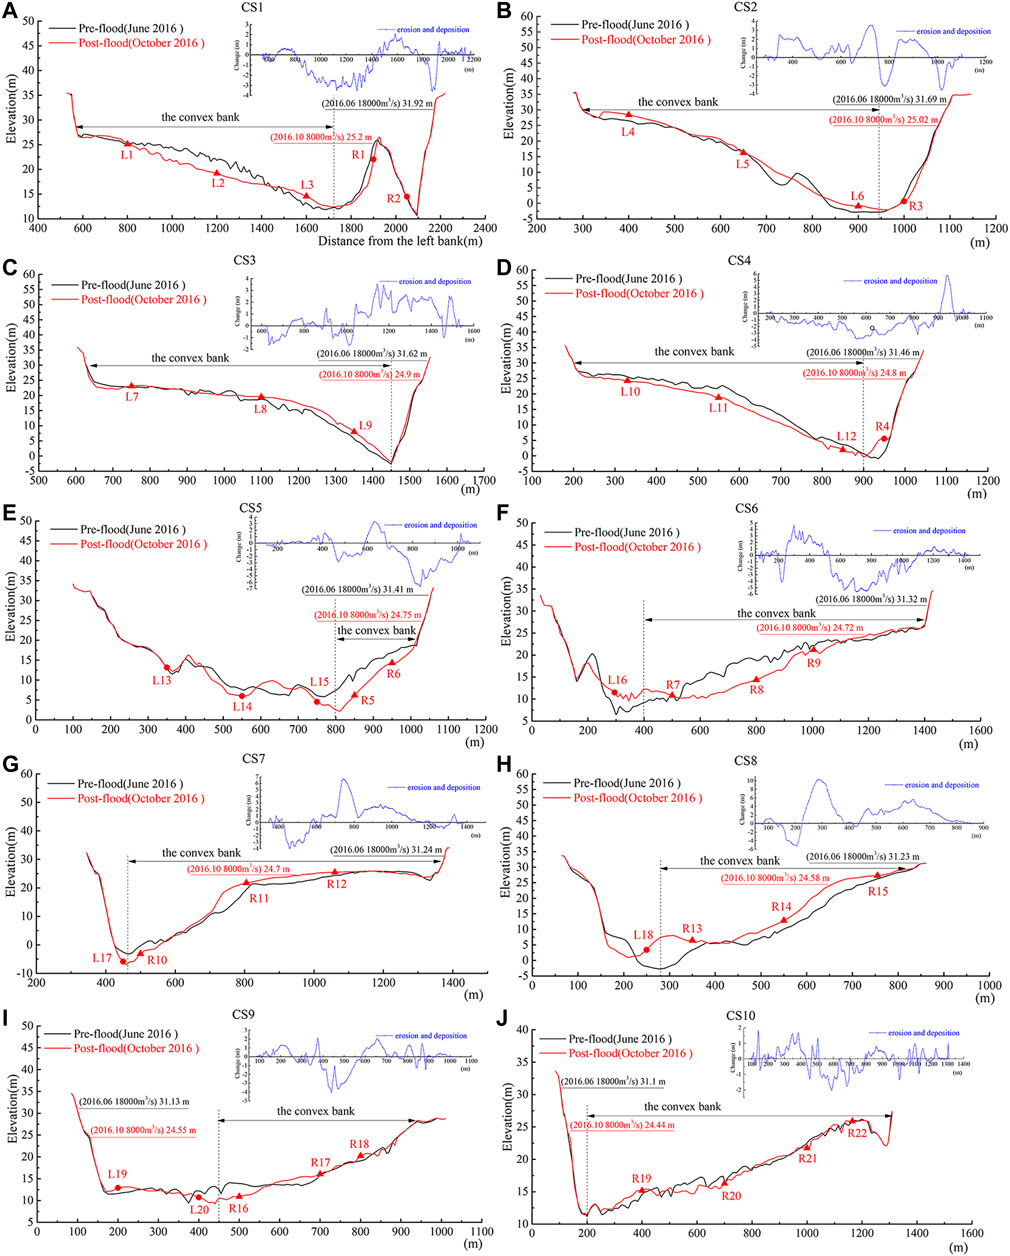
FIGURE 9. Morphological changes of ten surveyed transects (A-J) in the Bend A and Bend B during flood season. These observation points (42) are laid on the convex bank, thalweg, and concave bank to monitor the bed material composition, the near-bed velocity, and the stream power (Tables 3, 4). The triangular points (30) represent the observation points located on the shallow, middle, and deep shoals of the convex bank, and the red dots (12) represent the observation points on the thalweg and on the concave bank.
It can be seen that along the convex banks (Figures 9, 10, 11A), the net erosion area accounted for 53% and 38.9% of the total area in Bend A (CS1-CS4) and in Bend B (CS5-CS10), respectively. In the upstream parts of the two bends along the convex banks, the net erosion area accounted for 62.7% (Bend A: CS1) and 71.3% (Bend B: CS5, CS6) of the total area, respectively. In the downstream parts of two bends along the convex banks, the net erosion area accounted for 50.2% (Bend A: CS2-CS4) and 69% (Bend B: CS7-CS10) of the total area, respectively. There was a large scouring zone on the upstream point bars, while a certain degree of deposition occurred on the downstream point bars, especially for Bend B. The area of high erosion (scouring depth between 2 and 3.7 m) in the upstream part (CS1) of Bend A, accounting for 33% of the total area, was mainly located in the middle shoal of point bar, and the median particle size of bed sediment in the middle shoal of point bar (L2) increased from 0.226 mm (pre-flood) to 0.244 mm (post-flood). The area of high erosion (scouring depth between 2 and 6.7 m) accounted for about 83.1% of the point bar at the entrance of Bend B (CS5), and the median particle size of bed sediment on deep shoal (R5) increased from 0.091 mm (pre-flood) to 0.12 mm (post-flood). In the upstream part of Bend B (CS6), the proportion of high erosion area shrank to 41.1% compared with that at the entrance of Bend B, and was mainly distributed on middle shoal and on deep shoal. Further downstream, the proportion of depositional area began to increase in the downstream parts of Bend A (CS2, CS3) and Bend B (CS7-CS9). The proportion of area with over 2 m of deposition increased in the downstream direction, and gradually shifted from shallow shoal to middle and deep shoals. The mean median particle size of bed sediment in the point bars (L5 and R11) downstream of the apexes (in CS2 and CS7) decreased from 0.231 to 0.225 mm (pre-flood) to 0.176 and 0.178 mm (post-flood), respectively. The pattern of erosion and deposition at the exits of both bends (CS4, CS10) was affected by the boundary of the channel and the downstream bends, and was different from elsewhere, but both erosion and deposition at the exits of the bends were relatively weak. Sediment on the concave side of both bends became finer after flood. For example, the median particle size of point bar (R3) in the downstream part of Bend A (CS2) decreased from 0.419 mm (pre-flood) to 0.183 mm (post-flood) (Tables 3, 4).
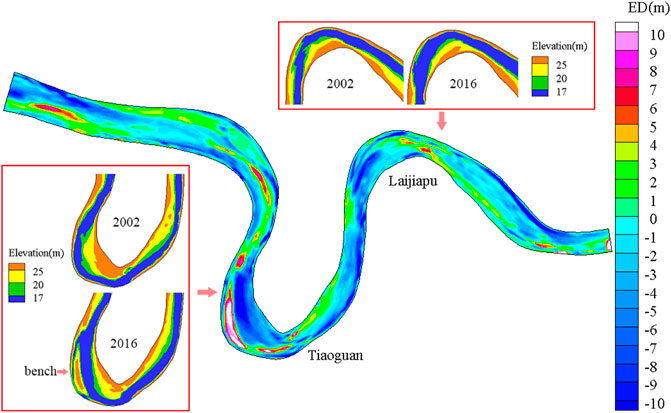
FIGURE 10. Morphological changes of the Bend A and Bend B after the TGP operation. ED represents the depth of erosion and deposition.
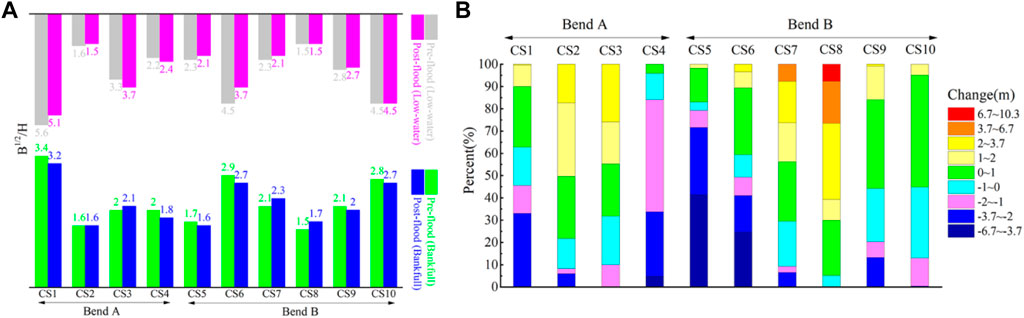
FIGURE 11. (A) Variations of width to depth ratio (B1/2/H) for the bankfull channel and low-flow channel during flood season in 2016. (B) The range proportion of erosion and deposition on the convex bank of Bend A and Bend B during flood season in 2016.
5 Discussion: Morphological Adjustment on Sharp Bends and the Relation to Flow and Sediment
At the present stage, it is not clear how erosion on point bar or deposition near concave bank responds to different flow stages, and what is causing this abnormal pattern of bend evolution. In order to understand the temporal and spatial evolution of meandering channel with reduced sediment supply, the effects of flow dynamic factors and sediment transport on the morphological changes of two sharp bends of the LJR were analyzed.
According to Termini and Piraino (2011), the lateral movement of HVC requires a sufficiently large width-depth ratio, thus indicating which is controlled by the shoaling effect of point bar upon the flow. In the Bend A and Bend B, the HVC shifted further toward the middle or shallow shoals with discharges, increasing the scouring effect on upstream point bars, which was also consistent with the findings of Dietrich and Smith (1984). With the increase of flow depth, the width-depth ratio of the channel decreased, and the shoaling effect of point bar that controlling the flow had reduced, especially when compared with the inertia effect of the flow. During high/bankfull discharges, the HVC moved over the heads of point bars to reach the downstream concave banks, while the stream power along the upstream concave banks had been greatly reduced, and the slow-flow zones were forming. Moreover, the area of the slow zone in Bend A would increase along with the discharge. According to Kasvi et al. (2013), it was difficult for the growth of secondary flow in a wide and deep channel, and the increase of water depth would reduce the impact of point bar on the flow field, thus affecting the development of secondary flow. Therefore, the secondary flow was not fully developed in both bends, except near the apexes, where the secondary flow could be easier to distinguish (Figure 6). However, although the secondary flow was much weaker than the stream-wise flow, the intensity of secondary flow was positively correlated with the discharges, and the locations of flow separation in the two bends moved downstream as the discharge increased (Figure 6), consistent with Ferguson et al. (2003), who stated that the intensity of secondary flow would reduce with the decrease of discharge or water depth. However, although the water-depth of Bend B was greater than that of Bend A at the same flow rate, the flow separation in Bend B was weaker than in Bend A, indicating that the curvature may play an important role in controlling the flow separation. Overall, water depth, curvature, and the shape of point bar are all important factors affecting flow separation in meander bends.
The stream power is the dominant factor deciding the erosion on point bar (Bridge and Jarvis 1982). At the same flow rate, high stream power was found on shallow/middle shoals in the upstream parts of the bends, and transferred to low shoals in the downstream parts of the bends, and the stream power on middle and shallow shoals of point bars gradually decreased along the bends (Tables 3, 4). The stream power in the net erosion zones of the upper point bars increased with discharges, and the values of stream power reached all above 8 w/m2 during the bankfull discharge. Kleinhans and van den Berg (2011) claimed that only when the stream power was above 8–20 w/m2, an effective scouring trough could form in the platform of point bar in a sandy river. However, it could be seen that no obvious chute channels had been observed over the upstream point bars during the flood season (Figure 9), but the net erosion areas of the upper point bars were still significant in the two bends. According to Dietrich and Smith (1984), due to gravitational force, large particle of sediment on the shallow shoal of point bar will more easily move from the convex banks to the pools, intensified by the outward flow. This might be another factor that aggravated the erosion on the shallow/middle shoals and deposition on the margins of the upper point bars (Clayton and Pitlick, 2007).
In flood season, the low-water and bankfull channels in the upstream parts of the two bends both became wide and deep, while in the downstream parts, the bankfull channels became narrow and shallow, but the low-water channels became narrow and deep (Figure 11A). In terms of the morphological changes of two bends during the flood season (Figure 9), the upstream bends were subject to erosion on the heads and platforms of point bars, while the downstream bends were prone to deposition on the point bar tails, aggravating the asymmetry of bend planforms. Comparing the distributions of SSC and SCC along the two bends (Figures 7, 8), it can be seen that high SSC was mainly distributed on the middle/shallow shoals of the upper point bars during medium and high discharges, largely coincided with that of high SCC. However, in the downstream parts of the bends, the SCC fell below the SSC on the middle or shallow shoals of point bars. This indicated that the high SCC caused a potential scouring on the middle/shallow shoals of upstream point bars, leading to the belt of high suspended sediment transport near the bed; hence the median particle size (D50) was relatively large. In the downstream parts of point bars, the insufficient SCC had been noted to cause the filling of suspended sediment, and the D50 was also relatively small (Figure 8). As a result, the tails of the point bars tended to broaden in the transition section. Near the upstream concave banks, the slow flow zone caused the SCC to decrease dramatically, and let sediment deposit in this area. During the low flow, due to sharp decrease of water depth, high SCC was usually found on the deep shoals of point bars, where the SSC was also high, but was significantly lower than that during the bankfull discharge. Therefore, it seems that the low flow did not contribute much to the growth of bars near the concave bank because of low-suspended sediment transportation.
Based on the long-term hydrological and sediment data (Figures 2, 3), reduced incoming sediment upstream was difficult to meet the SCC under the condition of medium or high discharges, thus the erosion effect on the heads and platforms of upper point bars was further enhanced (Figure 9). Moreover, the insufficient sediment supply during high/flood flow might make it difficult to fill the erosion regions of upper point bars, even in the water-falling stage, and the reduced duration of the high/flood discharges also weakened the erosion effect of flow near the concave banks. During medium and high discharges, it could be inferred that fine sediments scoured from the upstream point bars would move downstream by the stream-wise flow and outward to the concave banks by the secondary flow, thus sedimentation occurred near the concave banks and point bar tails, and the slow flow areas near the upstream concave banks would further intensify the deposition (Figure 9; Table 4). Considering reduced sediment supply, erosion on the upper point bars mainly occurred during medium and high discharges, impelling the HVC to shift toward the convex banks, which weakened the stream power near the upper concave bank and promoted the growth of sedimentary bodies. Therefore, the retreat (push inward) of convex bank dominated advance (pull inward) of concave bank, while the deposition near concave bank would further affect the flow process and development of the concave-bank bar.
Therefore, the reduction of sediment supply is the intrinsic cause of erosion on the point bar and formation of concave-bank bar, while the duration of high/flood discharges is the key factor in the morphological adjustment of point bar, supports the finding of Kasvi et al. (2017), who stated that the flood duration and the rate of discharge played the key roles in determining point bar morphology by controlling the flow velocities and depth. In addition, morphological adjustment analysis suggests that Bend A with higher curvature is more conducive to the formation of the concave-bank bench, thus the curvature may also have an important impact on the development of inner and outer banks, and needs further research. In the near future, the meander bends in the LJR may present as the continuous scouring of the main channel and the upper point bar due to the lasting impact of the TGP, but considering the influence of sediment coarsening (Table 1) and bank protection, the degradation trend will also slow down.
6 Conclusion
In this article, the flow structure and sediment movement in two sharp bends with reduced incoming sediment are analyzed at different discharges, combined with the morphological changes of two bends in flood season. Field measurements such as ADCP can also effectively reflect the actual flow field and sediment movement process in the large-scale meandering river. The conclusions are as follows.
(1) The flow stage affects mainly the flow structure and sediment transport process and determines the erosion and deposition patterns of the inner-outer banks in the meandering channel. The formation and development of secondary flow depends upon the flow rate and depth, controlled by the point bar morphology, and the intensity of secondary flow increases with the discharges. During medium and high discharges, it is easier to scour the head and platform of upstream point bar, and the sediment is more likely to be deposited at the point bar tail because of the weakening of SCC. Therefore, both flow velocity and depth affect the morphological change of point bar, and the medium/high discharges provide the main driving force to increase the erosion effect on upper point bar.
(2) The reduction of sediment supply is the intrinsic factor causing this phenomenon of “erosion on the point bar and deposition near the concave bank,” while the type and duration of flood have an important impact on the development of the inner and outer banks. For meandering rivers with reduced incoming sediment, the increased duration of medium and high discharges would intensify the erosion effect on the upstream point bar, promoting the development of the concave-bank bar. Therefore, the retreats (push inward) of the inner (convex) bank leads to the advances (pull inward) of the outer (concave) bank, which plays a dominant role in the evolution of meandering rivers with reduced sediment supply.
(3) In the near future, the point bars and main channels of meander bends in the LJR may continue to experience the erosion because of the lasting impact of the TGP, but considering the influence of sediment coarsening and bank protection, the degradation trend will also slow down. In addition, the curvature may also have an important impact on the development pattern of point bar and concave bank. In future studies, it will be necessary to detect the morphological changes of meander bends with different curvature before and after the operation of the TGP, and further to assess the influence of sediment supply intensity, flow frequency, and bend curvature on controlling the erosional and depositional patterns of banks and point bars.
Data Availability Statement
The original contributions presented in the study are included in the article/Supplementary Material, further inquiries can be directed to the corresponding authors.
Author Contributions
All authors listed have made a substantial, direct, and intellectual contribution to the work and approved it for publication.
Funding
The study was financially supported by the National Natural Science Foundation of China (Grant Nos. U2040219, U2240207, U2240224, and 51579015).
Conflict of Interest
The authors declare that the research was conducted in the absence of any commercial or financial relationships that could be construed as a potential conflict of interest.
Publisher’s Note
All claims expressed in this article are solely those of the authors and do not necessarily represent those of their affiliated organizations, or those of the publisher, the editors and the reviewers. Any product that may be evaluated in this article, or claim that may be made by its manufacturer, is not guaranteed or endorsed by the publisher.
References
Bagnold, R. A. (1966). An Approach to the Sediment Transport Problem from General Physics. Washington, DC: Government Printing Office. Paper No. 422-I: 37.
Blanckaert, K., Kleinhans, M. G., McLelland, S. J., Uijttewaal, W. S. J., Murphy, B. J., van de Kruijs, A., et al. (2013). Flow Separation at the Inner (Convex) and Outer (Concave) banks of Constant-Width and Widening Open-Channel Bends. Earth Surf. Process. Landforms 38 (7), 696–716. doi:10.1002/esp.3324
Bridge, J. S., and Jarvis, J. (1976). Flow and Sedimentary Processes in the Meandering River South Esk, Glen Clova, Scotland. Earth Surf. Process. 1 (4), 303–336. doi:10.1002/esp.3290010402
Bridge, J. S., and Jarvis, J. (1982). The Dynamics of a River bend: a Study in Flow and Sedimentary Processes. Sedimentology 29 (4), 499–541. doi:10.1111/j.1365-3091.1982.tb01732.x
Cao, G. J., and Wang, J. (2015). Measurements and Studies of Hydrological and Sediment Data in the Three Gorges Project. Beijing: Science press. (in Chinese).
Clayton, J. A., and Pitlick, J. (2007). Spatial and Temporal Variations in Bed Load Transport Intensity in a Gravel Bed River bend. Water Resour. Res. 43 (2), W02426. doi:10.1029/2006wr005253
Constantinescu, G., Koken, M., and Zeng, J. (2011). The Structure of Turbulent Flow in an Open Channel bend of strong Curvature with Deformed Bed: Insight provided by Detached Eddy Simulation. Water Resour. Res. 47 (5), W05515. doi:10.1029/2010wr010114
CWRC (Changjiang Water Resources Commission) (2017). Analysis of Channel Degradation in the Reach Downstream of the Three Gorges Dam. Wuhan: Scientific Report of CWRC. (in Chinese).
Dietrich, W. E., and Smith, J. D. (1984). Bed Load Transport in a River Meander. Water Resour. Res. 20 (10), 1355–1380. doi:10.1029/wr020i010p01355
Ding, J. S. (1965). Transverse Sediment Transport in bend Circulation. J. Wuhan Inst. Water Conservancy Electricity 3, 59–80. (in Chinese).
Eke, E., Parker, G., and Shimizu, Y. (2014). Numerical Modeling of Erosional and Depositional Bank Processes in Migrating River Bends with Self-Formed Width: Morphodynamics of Bar Push and Bank Pull. J. Geophys. Res. Earth Surf. 119, 1455–1483. doi:10.1002/2013jf003020
Engel, F. L., and Rhoads, B. L. (2012). Interaction Among Mean Flow, Turbulence, Bed Morphology, Bank Failures and Channel Planform in an Evolving Compound Meander Loop. Geomorphology 163-164, 70–83. doi:10.1016/j.geomorph.2011.05.026
Ferguson, R. I. (1984). “Kinematic Model of Meander Migration,” in Proceedings, River Meandering, Rivers 83 Conference. Editor C. M. Elliot (New Orleans, LA: ASCE), 942–951.
Ferguson, R. I., Parsons, D. R., Lane, S. N., and Hardy, R. J. (2003). Flow in Meander Bends with Recirculation at the Inner Bank. Water Resour. Res. 39 (11), 1322–1334. doi:10.1029/2003wr001965
Flener, C., Wang, Y., Laamanen, L., Kasvi, E., Vesakoski, J.-M., and Alho, P. (2015). Empirical Modeling of Spatial 3D Flow Characteristics Using a Remote-Controlled ADCP System: Monitoring a Spring Flood. Water 7 (12), 217–247. doi:10.3390/w7010217
Frothingham, K. M., and Rhoads, B. L. (2003). Three-dimensional Flow Structure and Channel Change in an Asymmetrical Compound Meander Loop, Embarras River, Illinois. Earth Surf. Process. Landforms 28 (6), 625–644. doi:10.1002/esp.471
Hasegawa, K. (1989). Universal Bank Erosion Coefficient for Meandering Rivers. J. Hydraulic Eng. 115 (6), 744–765. doi:10.1061/(asce)0733-9429(1989)115:6(744)
Hickin, E. J. (1974). The Development of Meanders in Natural River-Channels. Am. J. Sci. 274 (4), 414–442. doi:10.2475/ajs.274.4.414
Hooke, J. M., and Harvey, A. M. (1983). “Meander Changes in Relation to bend Morphology and Secondary Flows,” in Modern and Ancient Fluvial Systems (Wiley Online Library), 121–132.
Hooke, J. M., and Yorke, L. (2010). Rates, Distributions and Mechanisms of Change in Meander Morphology over Decadal Timescales, River Dane, UK. Earth Surf. Process. Landforms 35, 1601–1614. doi:10.1002/esp.2079
Hooke, J. M., and Yorke, L. (2011). Channel Bar Dynamics on Multi-Decadal Timescales in an Active Meandering River. Earth Surf. Process. Landforms 36 (14), 1910–1928. doi:10.1002/esp.2214
Hooke, R. L. B. (1975). Distribution of Sediment Transport and Shear Stress in a Meander bend. J. Geology. 83, 543–565. doi:10.1086/628140
Joeckel, R. M., and Henebry, G. M. (2008). Channel and Island Change in the Lower Platte River, Eastern Nebraska, USA: 1855-2005. Geomorphology 102 (3-4), 407–418. doi:10.1016/j.geomorph.2008.04.016
Kasvi, E., Vaaja, M., Alho, P., Hyyppä, H., Hyyppä, J., Kaartinen, H., et al. (2013). Morphological Changes on Meander point Bars Associated with Flow Structure at Different Discharges. Earth Surf. Process. Landforms 38 (6), 577–590. doi:10.1002/esp.3303
Kasvi, E., Laamanen, L., Lotsari, E., and Alho, P. (2017). Flow Patterns and Morphological Changes in a Sandy Meander Bend during a Flood-Spatially and Temporally Intensive ADCP Measurement Approach. Water 9 (2), 106. doi:10.3390/w9020106
Keller, E. A. (1972). Development of Alluvial Stream Channels: A Five-Stage Model. Geol. Soc. America Bull. 83, 1531–1536. doi:10.1130/0016-7606(1972)83[1531:doasca]2.0.co;2
Kleinhans, M. G., and van den Berg, J. H. (2011). River Channel and Bar Patterns Explained and Predicted by an Empirical and a Physics-Based Method. Earth Surf. Process. Landforms 36 (6), 721–738. doi:10.1002/esp.2090
Leschziner, M. A., and Rodi, W. (1979). Calculation of Strongly Curved Open Channel Flow. J. Hydr. Div. 105 (10), 1297–1314. doi:10.1061/jyceaj.0005286
Lotsari, E., Veijalainen, N., Alho, P., and Käyhkö, J. (2010). Impact of Climate Change on Future Discharges and Flow Characteristics of the Tana River, Sub‐arctic Northern Fennoscandia. Geografiska Annaler: Ser. A, Phys. Geogr. 92 (2), 263–284. doi:10.1111/j.1468-0459.2010.00394.x
Lu, Y. J., and Liu, J. M. (1998). Study on Two Dimensional Mathematical Model for Regulating Typical shoals in Fluvial Jinjiang River. J. Sediment Res. 43 (1), 37–51. (in Chinese). doi:10.16239/j.cnki.0468-155x.1998.01.005
Lu, Y., Zuo, L., Ji, R., and Liu, H. (2010). Deposition and Erosion in the Fluctuating Backwater Reach of the Three Gorges Project after Upstream Reservoir Adjustment. Int. J. Sediment Res. 25 (1), 64–80. doi:10.1016/s1001-6279(10)60028-5
Macklin, M. G., and Lewin, J. (1989). Sediment Transfer and Transformation of an Alluvial valley Floor: The River South Tyne, Northumbria, U.K. Earth Surf. Process. Landforms 14 (3), 233–246. doi:10.1002/esp.3290140305
O’Neal, M. A., and Pizzuto, J. E. (2010). The Rates and Spatial Patterns of Annual riverbank Erosion Revealed through Terrestrial Laser-Scanner Surveys of the South River, Virginia. Earth Surf. Process. Landforms 36 (5), 695–701. doi:10.1002/esp.2098
Pyrce, R. S., and Ashmore, P. E. (2005). Bedload Path Length and point Bar Development in Gravel-Bed River Models. Sedimentology 52 (4), 839–857. doi:10.1111/j.1365-3091.2005.00714.x
Ranzi, R., Le, T. H., and Rulli, M. C. (2012). A RUSLE Approach to Model Suspended Sediment Load in the Lo River (Vietnam): Effects of Reservoirs and Land Use Changes. J. Hydrol. 422-423, 17–29. doi:10.1016/j.jhydrol.2011.12.009
Shao, X. J., and Wang, X. K. (2005). Introduction to River Mechanics. Beijing: Tsinghua University Press. (in Chinese).
Sun, D. P. (1992). Discussion on Lateral Flow and Sediment Transport in Bends. J. North China Univ. Water Resour. Hydropower 3, 60–68. (in Chinese).
Termini, D., and Piraino, M. (2011). Experimental Analysis of Cross-Sectional Flow Motion in a Large Amplitude Meandering bend. Earth Surf. Process. Landforms 36 (2), 244–256. doi:10.1002/esp.2095
Thompson, A. (1984). Long Short Term Channel Change in Gravel-Bed Rivers. Ph.D. Thesis. Liverpool: Liverpool University, 492pp.
Xia, J., Li, X., Li, T., Zhang, X., and Zong, Q. (2014). Response of Reach-Scale Bankfull Channel Geometry to the Altered Flow and Sediment Regime in the Lower Yellow River. Geomorphology 213, 255–265. doi:10.1016/j.geomorph.2014.01.017
Xia, J., Deng, S., Zhou, M., Lu, J., and Xu, Q. (2016). Geomorphic Response of the Jingjiang Reach to the Three Gorges Project Operation. Earth Surf. Process. Landforms 42 (6), 866–876. doi:10.1002/esp.4043
Xu, K., and Milliman, J. D. (2009). Seasonal Variations of Sediment Discharge from the Yangtze River before and after Impoundment of the Three Gorges Dam. Geomorphology 104, 276–283. doi:10.1016/j.geomorph.2008.09.004
Yang, S. L., Milliman, J. D., Xu, K. H., Deng, B., Zhang, X. Y., and Luo, X. X. (2014). Downstream Sedimentary and Geomorphic Impacts of the Three Gorges Dam on the Yangtze River. Earth Sci. Rev. 138, 470–486. doi:10.1016/j.earscirev.2014.07.006
Yao, S. M., and Zhang, Y. Q. (2001). Characteristics of Bed Load Movement in Curved Channel and its Influence on River Evolution. J. Yangtze Acad. Sci. 18 (3), 11–13. (in Chinese). doi:10.3969/j.issn.1001-5485.2001.03.003
Yu, W. C. (2017). Exploration and Consideration of the Yangtze River. Beijing: China Water and Power Press. (in Chinese).
Zhang, R. (1989). River Sediment Dynamics. Beijing: Water Resources and Electric Power Press. (in Chinese).
Zhang, Y. X., and Jiao, A. P. (2002). Development of Sediment-Laden Flow Movement Law Research in the River bend. J. Sediment Res. 47 (2), 53–58. ( in Chinese). doi:10.3321/j.issn:0468-155X.2002.02.009
Keywords: bend morphology, reduced sediment supply, flow structure, sediment transportation, point bar erosion, concave bank deposition
Citation: Wang H, Yao S, Lu Y, Zuo L, Liu H and Zhao Z (2022) Morphological Changes of Sharp Bends in Response to Three Gorges Project Operation at Different Discharges. Front. Earth Sci. 10:876631. doi: 10.3389/feart.2022.876631
Received: 15 February 2022; Accepted: 11 April 2022;
Published: 26 May 2022.
Edited by:
Xijun Lai, Nanjing Institute of Geography and Limnology (CAS), ChinaCopyright © 2022 Wang, Yao, Lu, Zuo, Liu and Zhao. This is an open-access article distributed under the terms of the Creative Commons Attribution License (CC BY). The use, distribution or reproduction in other forums is permitted, provided the original author(s) and the copyright owner(s) are credited and that the original publication in this journal is cited, in accordance with accepted academic practice. No use, distribution or reproduction is permitted which does not comply with these terms.
*Correspondence: Shiming Yao, eXpoc2h5bXFAMTYzLmNvbQ==; Yongjun Lu, eWpsdUBuaHJpLmNu