 J-B. Madore
 C. Fierz
 A. Langlois
- 1Université de Sherbrooke, Département de Géomatique Appliquée, Sherbrooke, QC, Canada
- 2Centre D'Études Nordiques, Université Laval, Québec, QC, Canada
- 3WSL Institute for Snow and Avalanche Research SLF, Davos, Switzerland
Water percolation in snow plays a crucial role in the avalanche risk assessment. Liquid water content and wetting front are hard to measure in the field; hence, accurate simulation of the phenomena can be of great help to forecasters. This study was the first to evaluate water percolation simulations with the SNOWPACK model using Richards’ scheme on Mount Fidelity, Glacier National Park, Canada. The study highlights that, at this site, an updated configuration on precipitation phase transition and new snow density can significantly improve simulations of the snow cover, and water percolation in particular, which can be relevant in an era of an increased occurrence of rain-on-snow (ROS) events. More specifically, emphasis was put on the quality of the input data and parameters. The analysis of the precipitation phase temperature threshold showed that a value of 1.4°C was the best suited to track the rain/snow transition on site. A 10-year analysis of 24-h precipitation measured using the rain gauge and 24-h new snow water equivalent showed an excellent correlation. New snow density sub-models were evaluated using the 24-h new snow density values taken by the park technicians. The BELLAIRE model performed best and was used to drive the snow simulations. Two SNOWPACK snow simulations were evaluated using 1) rain gauge precipitation amount (PCPM) and 2) automatic snow height measurement (HS) at the same site. Both runs simulated the main snowpack layers observed during the dry season (i.e., before spring percolation was observed), and both simulated the snow properties with good accuracy. The water equivalent of snow cover, used as a proxy for a first-order characterization of the simulations generated by both simulations, was slightly underestimated compared with four manual measurements taken on-site during the winter. Nevertheless, the comparison of both measured density and modeled bulk density showed great correspondence. The percolation timing and wetting front depth were evaluated using field measurements from field campaigns and continuous observations from on-site instruments. The main percolation events were correctly simulated and were coincident with the observed wet avalanche cycles. The results highlight the need for accurate input data on valid simulation of the wetting front and percolation timing on site. Good percolation information generated using the SNOWPACK model and Richards’ scheme could be used to assess the snowpack stability by forecasters in areas where such data are available.
1 Introduction
Warming over the 20th century is now indisputable, and Canada is no exception with the mean annual temperature having risen about 1.7°C since 1948 (Bush and Lemmen, 2019). This rate is about twice the global rate, and Canada’s North and British Columbia have been identified as the warmest regions of the country. Of particular interest, a direct consequence of this accelerated warming in mountainous regions is the increased occurrence of meteorological extreme events, which include heavy rain and snowfall, rain-on-snow (ROS), and heat waves. On snow-covered terrain, these events will have significant impact on the surface energy balance through snow’s low thermal conductivity and high albedo (Jordan et al., 2008), while leading to changes in flooding (Beniston and Stoffel, 2016; Berghuijs et al., 2016) and avalanche patterns (Baggi and Schweizer, 2009). However, very little is known about ROS in avalanche terrain and even less about their cumulative impact on the avalanche risk. Liston and Hiemstra (2011) found an increase in ROS days of +0.03 days·decade−1 and an increase in air temperature of +0.17°C·decade−1 when snow was on the ground over the period 1979–2009 in the Arctic. Furthermore, Vincent and Mekis (2006) showed that the period from 1900 to 2003 had a decrease of 10%–20% in the snow-to-total precipitation ratio (suggesting an increased proportion of liquid precipitation) in the southern regions of Canada. Given that ROS events are projected to be more frequent and over a wider spatial extent (Semmens et al., 2013), there is a critical need for improved monitoring of such events from a public safety perspective of mountain users.
For multi-scale modeling of these processes, there is a need for long-term monitoring of wet snow in mountain regions in order to improve the existing avalanche risk assessments. The main issues with wet snow, from ROS or melt events, are two-fold: 1) water infiltration weakening the snow grain bonds and 2) creation of ice-layer interfaces which can generate weak layers through changes in the snow temperature gradient and metamorphism adjacent to those layers. ROS events are considered the main cause of avalanches in maritime climates, and they often trigger immediate and delayed wet snow avalanches following water infiltration within the snowpack. These events are quite common in the Pacific Northwest (McCabe et al., 2007), leading to a variety of avalanche types (Clarke and Mcclung, 1999). In this context, the infiltration of liquid water can lead to wet snow avalanches (e.g., Conway and Raymond, 1993; Baggi and Schweizer, 2009; Techel and Pielmeier, 2009) and the creation of vertically located ice layers that represent persistent weak layers through faceting above and below the crusts (e.g., Colbeck and Jamieson, 2001). Although the stability issues from ice-layer formation are well known, few studies have looked into the potential of current snow models, such as SNOWPACK, to simulate such layers and understand how they form and evolve (Wever et al., 2016a, b; Quéno et al., 2020). This ice-layer formation process has been studied in the past (Jamieson and Fierz, 2004) and represents the real potential for avalanches, especially where fatalities have occurred due to this problem in several locations in Western Canada (Jamieson, 2001). The use of multi-layered snow modeling has been proved to be relevant for wet snow avalanche evaluation and forecasting (Mitterer et al., 2011; Bellaire et al., 2017; Valero et al., 2018; Wever et al., 2018). They showed that wet snow instability was influenced by snow stratigraphy, atmospheric warming, and water infiltration patterns. To date, an approach designed for Canadian avalanche terrain has to be developed yet. The spatial variability in avalanche danger (i.e., snow and soil properties) within large forecast regions leads to an imperfect assessment of the avalanche risk (Jamieson et al., 2009), while the increased number of mountain users in remote areas increases the need for improved predictions at large scales.
Wet snow avalanches are extremely complex, and several snow avalanche modeling studies have attempted to determine the potential for an avalanche to occur. Recently, a new percolation scheme has been implemented in SNOWPACK (Wever et al., 2014, 2015). The integration of this scheme using Richards’ equations for porous materials allowed to postulate new hypotheses on the evaluation of the stability of wet snow (Wever et al., 2018) while evaluating the model’s potential in forming ice layers. To date, this percolation scheme has not been evaluated in Canada, while its potential in helping avalanche risk assessment in a changing avalanche terrain environment is significant (Mitterer et al., 2011). As such, the main objective of this paper is to evaluate the performance of SNOWPACK in simulating water percolation in the snow cover in Canadian avalanche terrain, more specifically, the Rogers Pass area in Glacier National Park, British Columbia. More specifically, this paper aims to evaluate simulated LWC profiles in SNOWPACK using in situ measurements and discuss the best configuration and use of internal models to improve snow simulations, focusing on water percolation in Glacier National Park. The paper’s objectives rely on the following two main hypotheses: 1) the SNOWPACK percolation scheme using Richards’ equations allows for an adequate representation of water percolation and 2) measurements of LWC combined with simulated percolation can contribute to wet avalanche danger determination in Glacier National Park.
2 Model and theory
2.1 SNOWPACK and water percolation
The physical snow model SNOWPACK was developed by the WSL Institute for Snow and Avalanche Research (SLF) of the Swiss Federal Institute for Forest, Snow, and Landscape Research (WSL). The model was developed for avalanche studies, and it solves the partial differential equations governing snow mass and energy fluxes using a Lagrangian finite element implementation (Bartelt and Lehning, 2002; Wever et al., 2015). The SNOWPACK model simulates the main characteristics and evolution of the snow on the ground, including height, snow water equivalent (SWE), density, snow temperature, and microstructure. The model’s main inputs are three text files: configuration parameters, meteorological data, and the initial state and properties of the snow and the ground layer properties at the location (https://snowpack.slf.ch/). Mandatory meteorological variables are air temperature (°C), relative humidity (%), wind speed (m·s−1), incoming shortwave radiation (W·m−2), and incoming longwave radiation (W·m−2). Accumulation is driven by either precipitation (kg m−2) or positive changes in snow height (m). Snow surface temperature can be simulated or provided to the model, the latter being the preferred method when the required observations are available.
Snow is formed by a matrix of air, ice, and liquid water for which the individual fractions vary over time and space. More specifically, the physical and mechanical properties will vary following various thermodynamic (i.e., metamorphism) and dynamic (i.e., compaction) processes (Colbeck, 1997). As such, snow can be described by the individual fraction of its constituents:
where θi, θw, and θa are volume fractions of ice, liquid water, and air, respectively. Snow density, ρs, can then be expressed as:
In dry snow, θw is negligible, and porosity, ϕ, can be defined by:
Given that liquid water will accumulate in pores, porosity will change very quickly under wet snow conditions. As such, water percolation is very complex, where the speed of water percolating can be simplified using Darcy’s law:
where ki is the permeability, ηw corresponds to the water dynamic viscosity, ѱ is the capillary pressure in the z direction, and g is the gravitational acceleration. Snow porosity, tortuosity, the connectivity between pores, and grain size will influence the capillary pressure and hydraulic conductivity (Hirashima et al., 2010). Several studies have been conducted to simulate these processes where hydraulic conductivity has been calculated for snow using grain size and density (Shimizu, 1970) and optical grain size (Calonne et al., 2012). On the other hand, the capillary pressure slows down the percolation of water and depends on grain size and porosity (Yamaguchi et al., 2010). However, simulating liquid water in snow remains difficult, given the numerous parameters that are needed to simulate percolation. Initially, SNOWPACK simulated water movement using the so-called bucket scheme based on a maximal threshold of water content within a layer using the Coléou and Lesaffre (1998) equations. Those equations were based on the density of wet layers. Following this work, Hirashima et al. (2010) developed a percolation scheme (NIED) based on Darcy’s law, detailed previously, which only allowed percolation downward, focusing the effects of wet snow on the various internal processes of SNOWPACK.
Richards’ equation (Richards, 1931), which explains water movement in porous materials, was implemented as a percolation scheme in the model (Wever et al., 2014). This percolation scheme assumes a continuum between the snow and the soil and now simulates water percolation in a more realistic manner (Wever et al., 2015) when compared to the bucket approach. This said, lingering uncertainties remain with regards to the distribution and accumulation of LWC using Richards’ equations, for which the potential biases remain unknown. Further uncertainties arise from the snow grain size simulations for which the bias depends on the metamorphism equation in place. More specifically, Madore et al. (2018) have demonstrated that while density can be reproduced with reasonable accuracy over the range of 100–500 kg m−3 in Canada, the snow grain size overestimation is more important in an equilibrium metamorphism environment than a kinetic growth environment. Given that porosity will increase with the increasing grain size and decreasing density (Clifton et al., 2008), this is of primary importance in water flow (i.e., percolation) and ultimately stability computation, where overestimated grain size will overestimate porosity.
2.2 LWC in snow, a context for snow stability
A transition exists between the pendular regime when the water content is very low that the water is trapped around snow grain bonds and the funicular regime when LWC increases to a point where water can no longer be held in these rings by capillary pressure. Under unsaturated conditions, the high liquid content tends to leave the snow grains separated from each other, leading to grain clusters (Denoth, 1982). Mass transfer exists between the grains of a given cluster, and the concordant growth is faster than in the case of equilibrium metamorphism in dry snow. In the presence of high liquid content (saturated conditions), snow metamorphism will be more different than that in dry snow (Colbeck, 1982), where the snow grains are separated from each other. Heat flow propagating through saturated snow will then cause the melting of the smaller particles due to their lower temperature of melting (Colbeck, 1982).
In terms of stability, the presence of liquid water in the starting zone along with isothermal conditions is necessary to trigger a wet snow avalanche (Schweizer et al., 2015; Fierz and Föhn, 1994; Mitterer et al., 2013). More specifically, it was shown that the increase in LWC to 5%–7% will considerably decrease the cohesive forces in snow (Brun, 1989; Ito et al., 2012). Gravitational forces dominate infiltration (Waldner et al., 2004; Techel and Pielmeier, 2011), leading to rapid changes in grain size and shape (Brun, 1989) and density (Jordan et al., 2008). However, water percolation is not vertically uniform, and accumulation will occur at capillary barriers caused by changes in density and grain size and shape (Waldner et al., 2004). Furthermore, Baggi and Schweizer (2009) suggested three different triggering mechanisms for wet snow avalanches: 1) loss of cohesion caused by water infiltration at the capillary barriers; 2) weight surcharge caused by additional precipitation on an already wet snowpack; and 3) weakening of the snowpack when warmed to 0°C.
Despite its importance in controlling snow stability, it remains extremely difficult to simulate LWC and its associated effect on snow stability owing to its great temporal and spatial variability. Several studies have focused on meteorological conditions to try and predict wet snow avalanches (e.g., Baggi and Schweizer, 2009; Peitzsch et al., 2012; Mitterer and Schweizer, 2013; Helbig et al., 2015; Bellaire et al., 2017). Nonetheless, the development of multi-layered snow models, such as Crocus or SNOWPACK, has allowed the calculation of LWC in individual layers (Mitterer et al., 2013; Bellaire et al., 2017). This said, despite a growing empirical understanding of wet snow avalanches, the use of simulations of water percolation and the accumulation at the capillary barriers using snow physical models could improve stability prediction in an operational context (Wever et al., 2018).
3 Methodology
3.1 Study site and instrumentation
Data for this project were collected in Glacier National Park (GNP), located in the interior belt of British Columbia, Canada, more specifically in the Selkirk chain of the Columbia Mountain range. The transitional and warm climate leads to abundant precipitation influenced by warm air masses from the Pacific with an important orographic component from the Columbia Mountains (Hägeli and McClung, 2003). Dry and cold eastern air masses can also reach the park, so three distinct climatic zones can be considered where the western Illecillewaet Valley will be impacted by warm Pacific air masses with heavy precipitation, while the eastern Beaver Valley will present continental climatic characteristics. Our main study site, the Fidelity station on Mount Fidelity, is disputed between the two influences and is considered one of the snowiest places in Canada (Schleiss, 1990; Smith and Clung, 1997; Hägeli and McClung, 2003), where the typical maximum snow depth is reached in March and regularly reaches 4 m in thickness. GNP, which is home to the largest Canadian avalanche control operation, has been operating this station since the 1960s. Parks Canada is also responsible for avalanche bulletins for outdoor users within GNP. Due to large amounts of snowfall and steep slopes, large avalanche cycles are common in the park. Natural and artillery-triggered avalanches are commonly recorded up to size 4 on the Canadian Avalanche Association size classification (CAA, 2016). The instabilities are mostly due to fast loading from snowstorms and widespread surface hoar. Despite the fact that air temperatures in such climates are generally colder, the important snow height leads to an environment promoting equilibrium metamorphism with limited periods of kinetic metamorphism. The region is no exception to the global warming stated previously in Introduction. For instance, Bellaire et al. (2016) demonstrated that Rogers Pass witnessed a significant increase in winter air temperatures along with an increased formation of rain crusts earlier in the season. However, establishing trends in avalanche activity under such warming remains very difficult owing to the limited number of meteorological stations available in the region needed for data homogenization (Venema et al., 2012; Sharma and Déry, 2016). Bellaire et al. (2016) highlighted the fact that higher air temperatures can lead to the stabilization of the snowpack. Nevertheless, an increase in LWC can lead to instability, motivating our goal to investigate microstructure and percolation from a model perspective, as suggested by Haegeli and McClung (2007). The Fidelity station is located on a flat site on the east flank of Mount Fidelity at the tree line around an altitude of 1,900 m (Figure 1). The station is within a large, restricted area dedicated to research and snow monitoring. It is the main station where Parks Canada keeps track of snow properties and instabilities for avalanche forecasting. The main weather station is equipped to measure air temperature, relative humidity, snow height (sonic height ranger), and precipitation using a weighing rain gauge (OTT2). A second set of instruments contains incoming long- and shortwave radiation as well as wind speed and direction. The data from the station were available with a 10 min timestep. A Vaisala PWD40 visibility sensor measuring the precipitation phase and rate at a timestep of 15 min was also available.
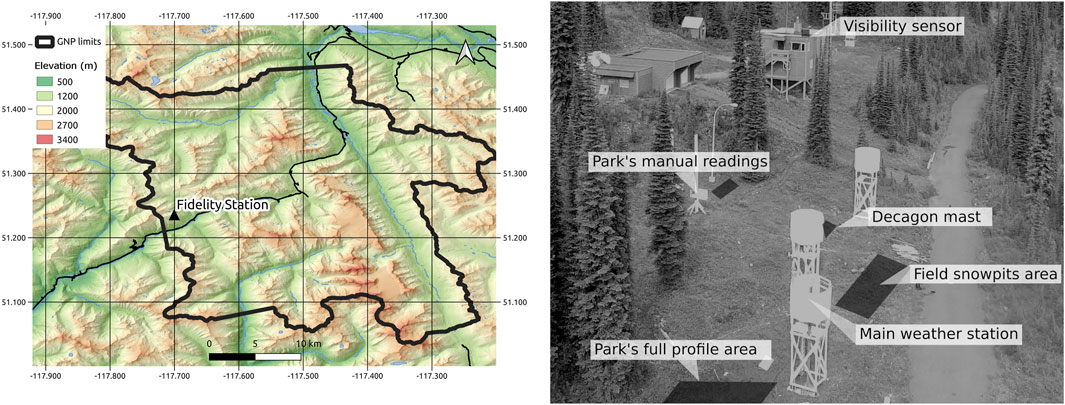
FIGURE 1. Overview of the Fidelity station in Glacier National Park. Dark zones indicate the location of the instrument and manipulation on site. Note that the Decagon mast is absent in the image.
During the period 2018–2019, some datasets had to be completed or removed. The instrument measuring shortwave radiation had problems, and the whole dataset was not used. It was replaced by the North American Regional Reanalysis (NARR) product. Since NARR spatial (∼30 km) and time (3 h) resolutions were coarser, NARR incoming longwave radiation was evaluated for previous years (2012–2014), and the statistical results showed good agreement with past measurements using the instrument with a 10 min timestep linear interpolation (y=0.814x+14.14; R2 0.63). In addition, early season (September–October) wind measurements were not available for Fidelity. The Round Hill station, located 500 m uphill on Mount Fidelity, was used to complete the dataset. Historic wind data from this station were compared with those from Fidelity so that wind speed and direction could be adjusted. A mast was installed in fall 2018, equipped with 10 Decagon 5 TE every 30 cm to measure the snow temperature and permittivity of the snow at different depths for a total height of 300 cm (Figure 1). The 5 TE Decagon measurements are made at 70 MHz. The instruments were installed vertically to diminish the possible accumulation of water around it. The goal of this installation was to monitor the percolation and presence of water at different depths, along with snow temperature variability and the timing of isothermal conditions.
3.2 Snow measurements
3.2.1 Parks Canada measurements
The Parks Canada team visited the Fidelity site multiple times per week during the avalanche season, and manual measurements were taken on every visit. The accumulated depth of snowfall (24 h; HN24) along with HN24 density and water equivalent of snowfall (HNW) was recorded by the park. The total snow depth is also manually recorded at each visit. During the 2018–2019 season, HN24 was measured 49 times. Once per month, the Parks Canada employees carried out a full profile of the snowpack at the Fidelity site, resulting in a total of six profiles for this period. Wetness, resistance, type, grain size, and density were measured on every identified layer in the profile. The snow temperature was observed systematically along the whole profile. In addition, SWE was measured monthly from December to April, with Federal sampling tubes. All measurements by Parks Canada are made at the Fidelity site, near the weather instrumentation. The measurements were specifically used to assess the quality of the precipitation measurements and quality of the dry season SNOWPACK simulation from November 2018 to April 2019. All measurements from Parks Canada were made in accordance with the CAA Observation Guidelines & Recording Standards for Weather, Snowpack, and Avalanches (CAA, 2016).
3.2.2 Liquid water content and field measurements
A field campaign from the Groupe de Recherche Interdisciplinaire sur les Milieux Polaires (GRIMP; Université de Sherbrooke) was conducted in GNP from March 23 to May 8 in the spring of 2019. During that period, intensive and advanced snow measurements were recorded at the Fidelity site. A total of seven profiles were dug with two being full profiles. The other profiles were in the top part of the snowpack (1.75–2 m deep) to track surface water percolation. Geophysical measurements were taken systematically on every profile. The density measurements were made by weighting a sample from a 250-cm3 wedge style snow cutter at a 5 cm vertical interval. The snow temperature was measured using a digital thermometer every 10 cm. Layering, snow hardness, grain size, and grain type were observed and recorded following the OGRS and the International Classification for Seasonal Snow on the Ground (Fierz et al., 2009). Liquid water content was measured using two different devices. The first device was the SLF snow sensor, which uses a capacitance sensor to measure the dielectric constant of the snow sample at 20 MHz. LWC measurements were taken here by applying the sensor on the vertical snowpit wall of freshly revealed snow, so the sample is the least affected by the outside condition (Figure 2). The sensor’s dimensions are 45 mm × 95 mm, and the samples are 17 mm deep into the snow. It is rated for wetness between 0 and 20% v/v LWC. The measurements using this instrument were made with a 5 cm vertical interval for the evaluated profiles. The SLF snow sensor working principles are based on empirical measurements made of dry snow density (weighted) and LWC measured using the dilution method (https://fpga-company.com/slf-snow-sensor/). The relation between the dry snow density ρ and snow permittivity ε is given as:
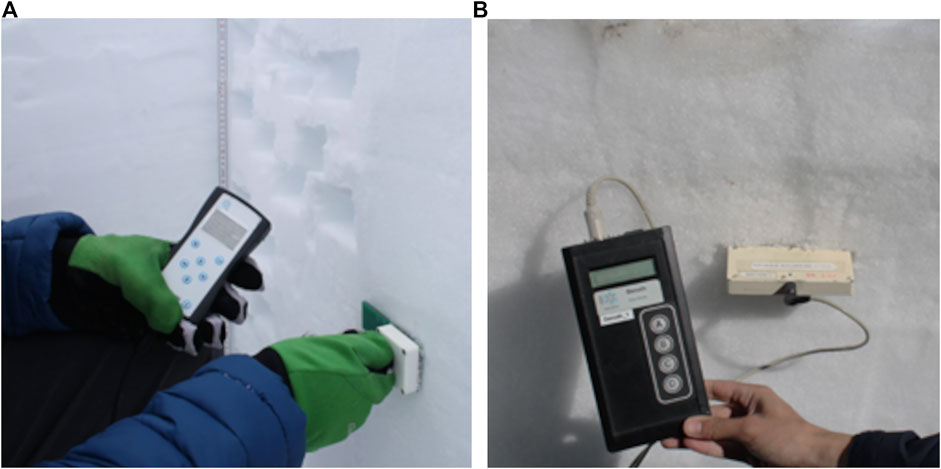
FIGURE 2. Demonstration of measurements of LWC using the (A) SLF sensor and (B) the Denoth meter. Note that for the SLF sensor, the snow on the wall must be freshly revealed.
Then, LWC is estimated in the following equation:
where
Here, ε moist is the measured permittivity of the moist snow sample. Knowing the density of the snow sample, εdry is calculated using Equation 5.
The Denoth instrument was used in the second part of the field work simultaneously with the SLF snow sensor in order to measure the vertical profiles of LWC (Figure 2). This instrument is also a capacitance plate and measures at the 20.00 MHz frequency (Denoth, 1994). The sensor’s dimensions are 13.5 cm by 12.5 cm, and measure a sample of 1.5 cm above and below the plate. This sensor has to be inserted into the snow before the measurement. The permittivity
where Uref is the measured air reference measurement taken before the snow measurement U and k is the sensor-specific calibration factor. The dielectric loss,
where
3.3 SNOWPACK simulation configuration
All the simulations were made using the SLF snow model SNOWPACK version 3.5. Only the Richards’ percolation scheme was used. Multiple studies have demonstrated that this scheme was optimal for water percolation (Wever et al., 2014) at small spatial scales such as those used in avalanche studies, as such, the other SNOWPACK percolation schemes, Bucket and NIED, were not evaluated. The soil was simulated using 32 layers with a thickness range of 0.2–1.6 m. Both snow height and precipitation were used to force simulations which were then compared to see how they simulated water percolation.
The visibility sensor was used to evaluate the phase of precipitation to adjust the rain threshold of the model for optimization at the Fidelity site. We specifically focused our analysis on the first months of accumulation (i.e., during the fall), where the rain threshold has a significant impact on the simulation for early-season snow layering and metamorphism that persist throughout the winter. The 24-h “new snow” measurements by Parks Canada were used to validate the 24-h precipitation measurement obtained from the rain gauge and then evaluate the new snow density models within SNOWPACK (see details in 4.3). The first validation of the simulations was made during the dry snow season. The dry season was defined to be from the beginning of the snow season (snow onset without subsequent melt) to a week before the first spring melt event. For the 2018–2019 winter season, the dry season was from the end of September 2018 to March 7, 2019. The validation included a matching of the observed and simulated layer thicknesses and vertical locations. It was conducted layer-per-layer with an identification of the match between field observations and simulated layers. We did not “stretch” (i.e., increasing simulated snow-layer thickness) or “compress” (i.e., decreasing simulated snow-layer thickness) the simulations to match the field measurements, given that doing so assumes a linear bias of the layering. Furthermore, the validation conducted in this study targets the geophysical properties driving percolation (i.e., density and grain size), so a layer-per-layer approach is more appropriate in this context.
4 Results
4.1 Precipitation phase threshold identification
During fall 2018, two rain events that impacted the snowpack stratigraphy were recorded. The first event occurred on October 26, 2018 and wetted the whole vertical profile with air temperatures well above the precipitation phase threshold value of the model initially set at +1.2°C (Tths(1.2)). The second event was more relevant given that it occurred at air temperatures close to Tths(1.2). During this event, in addition to solid precipitation, only mixed precipitations were detected by the visibility sensor (Figure 3). In this particular case, the Tths(1.2) overestimated the liquid precipitation by simulating rain before the visibility sensor began to measure mixed precipitations. As such, our group conducted a four-season analysis of the precipitation phase at the Fidelity station, and the results showed that solid precipitation represented half of the precipitation type (snow, rain, and mixed) at 1.4°C air temperature (Blanchette, 2021). This empirically derived 1.4°C (Tths(1.4)) rain threshold, which showed a good timing concordance with the recorded precipitation type by the visibility sensor. The impact of the Tths(1.4) threshold on the microstructure of the snowpack was validated with a manual snow profile conducted on November 4, 2018 (Figure 4). The crust can be identified clearly in the Tths(1.4) simulations in accordance with the manual measurements. The Tths(1.2) simulated water percolation all the way to the ground; hence, the melt–freeze crust was not simulated. The snow height of the simulation driven by the precipitation (PCPN) was also underestimated using the Tths(1.2) threshold due to the overestimation of rain with a lower Tair threshold. The total snow height generated by both HS-driven simulations was underestimated. This was caused by the difference between the manual profile snow height and the measured snow height using the sensor. Thus, the relevant differences in both Tths(1.2) and Tths(1.4) HS-driven simulations were only within the simulated microstructure. Thresholds of more than 1.4°C did not simulate the crust formed on November 2, 2018 and were not evaluated. Late-season precipitation phase transitions from solid to liquid were more challenging to track and evaluate. Given that LWC is increasingly present throughout the snowpack during this period, the threshold’s effect was not apparent so changing the threshold to 1.4°C did not significantly affect the percolation in the spring.
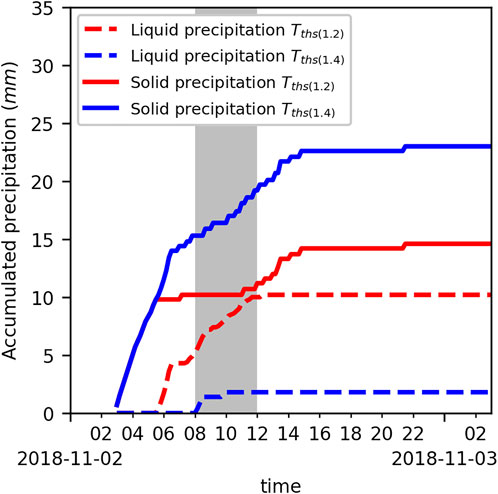
FIGURE 3. 24-h accumulation of simulated precipitations per phase during the November 2 rain event on both 1.2 and 1.4°C thresholds. The gray area represents the period where the visibility sensor measured mixed precipitations.
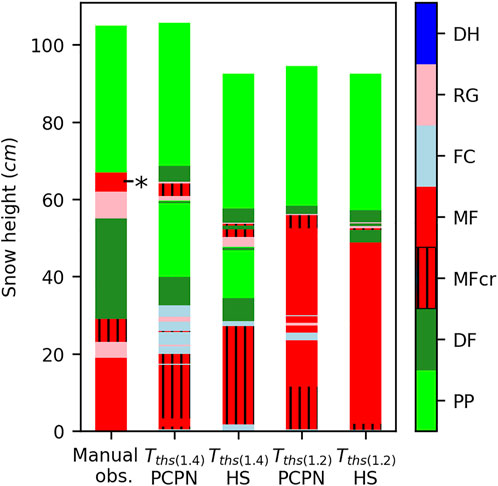
FIGURE 4. Grain-type comparison between manual observation on November 4 and simulations with the rain threshold set at 1.4°C and 1.2°C. The November 2 rain event is identified as “*” on the observed profile (left). The simulations were driven by a precipitation amount (PCPN) or/and the snow depth (HS).
4.2 Rain gauge validation
The amount of precipitation P (24 h) in kg m measured using the OTT 2 rain gauge at Fidelity was evaluated from 2011 to 2019. A total of 464 HN24 measurements were used to validate the instrument, with four removed values due to apparent errors. The comparison results showed an excellent correlation between the HNW (24 h) and P (24 h) accumulation from the instrument (Figure 5), suggesting that no apparent issues related to the undercatch from wind speed can be expected (Smith et al., 2020). The Fidelity station is indeed well protected with daily averaged wind speeds generally <2 m s−1, so no corrections for undercatch were applied to the precipitation dataset.
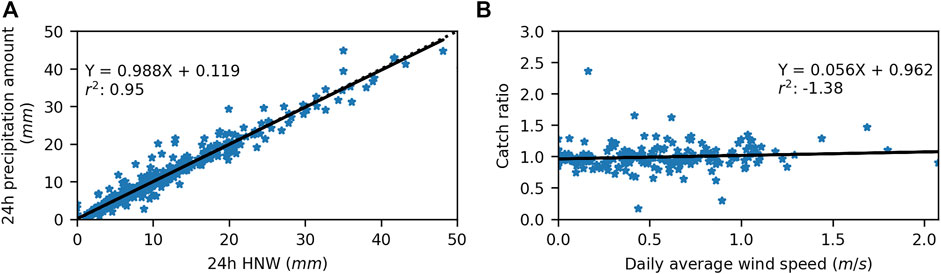
FIGURE 5. Comparison of (A) 24-h precipitation amount and 24 h measured HNW at the Fidelity station. The catch ratio (B) calculated using the ratio between 24 h HNW and 24 h precipitation amount is depicted as a function of the daily wind speed.
4.3 New snow density configurations and simulation parameters
Bellaire et al. (2011) underlined the problems related to SNOWPACK’s parameterization of the density of new snow. Since all the models were developed empirically in the Alps or at places where low-density new snow events were less frequent, those events might not be simulated correctly in the Columbia Mountains. The evaluation of the different density parametrizations of new snow highlighted variability in accuracy when compared to the HN24 measurements. Those models are responsible for the new snow height when using the precipitation (i.e., PCPN) to drive the model. When the SNOWPACK model is driven by the snow height (i.e., HS) measured on site, the HNW, thus the density, is derived from the new snow accumulated over the timestep. In both cases, the input data must be as precise as possible to simulate the snow properties well. The tested models were LEHNING_OLD, LEHNING_NEW, BELLAIRE, ZWART, PAHAUT, and NIED. Both the LEHNING models’ equations are based on air temperature, surface temperature, wind speed, and relative humidity. BELLAIRE, ZWART, PAHAUT, and NIED are based on air temperature and wind speed, with BELLAIRE being adjusted for the altitude and ZWART considering a fixed value for RH. All the equations were used to simulate the 2018–2019 snowpack. The chosen new snow density model is the BELLAIRE model, which had the best overall results and performed well for low-density snow (Figure 6). The model performed best when driven by precipitations with a slope of 0.805 and an intercept of 1.88 cm. The linear model had a coefficient of determination of 0.96. In this model, the density of new snow is calculated as:
Here, α (3.946), β (0.07703), ζ (0.0001701), µ (0.05371), and η (0.2222) are constants internal to the model as a function of wind speed U in m s−1. The slope and coefficient of determination of the other models are in the range of 0.571–0.75 and 0.390–0.87, respectively. All the new density models underestimated the new snow height when HN24 > 18 cm. All the models generally underestimated the HN24.
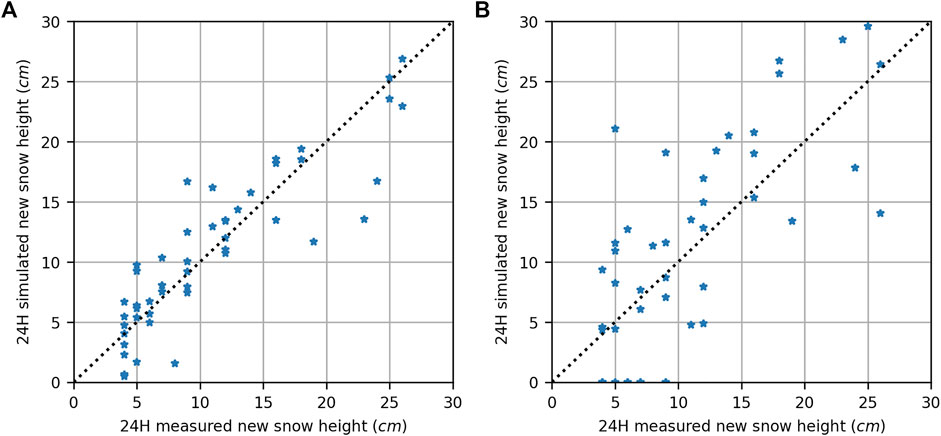
FIGURE 6. Validation of simulated “new snow” height from SNOWPACK using (A) accumulation driven by measured precipitation amount (PCPN) and (B) accumulation driven by observed snow depth (HS) configurations.
4.4 Input data, rain events, and Parks Canada
The 2018–2019 winter season in GNP was characterized by a lower than average seasonal snow accumulation. The maximum snow height was reached at the beginning of February with less than 3 m, a value lower than the long-term maximum average of 3.5 m (Figure 7). The maximum SWE measured at the end of April was 1,210 mm w. e., which is also lower than the yearly maximum value of 1,380 mm w. e. The spring season was characterized by a series of melt periods followed by snowfall accumulations. Spring melt began on March 16, caused by air temperatures rising above 0°C and high solar radiation during the day with a surface refreezing overnight. These diurnal melt/freeze cycles of the surface were observed until March 24 from where the spring conditions alternated between snowfall accumulation and diurnal melt/freeze cycles. The first significant percolation event occurred on April 18 and 19th with a rain-on-snow event that brought the whole snowpack to a 0°C isothermal state. The isothermal state of the snowpack and the wetting front were identified by the Decagon instruments (Figure 7). Water percolation was detected from the top of the snowpack to a depth of about 30 cm and the wetting front was observed below 30 cm from May 13 onward. The last significant solid precipitation event occurred on May 2 and was followed by the beginning of the snowpack ablation period.
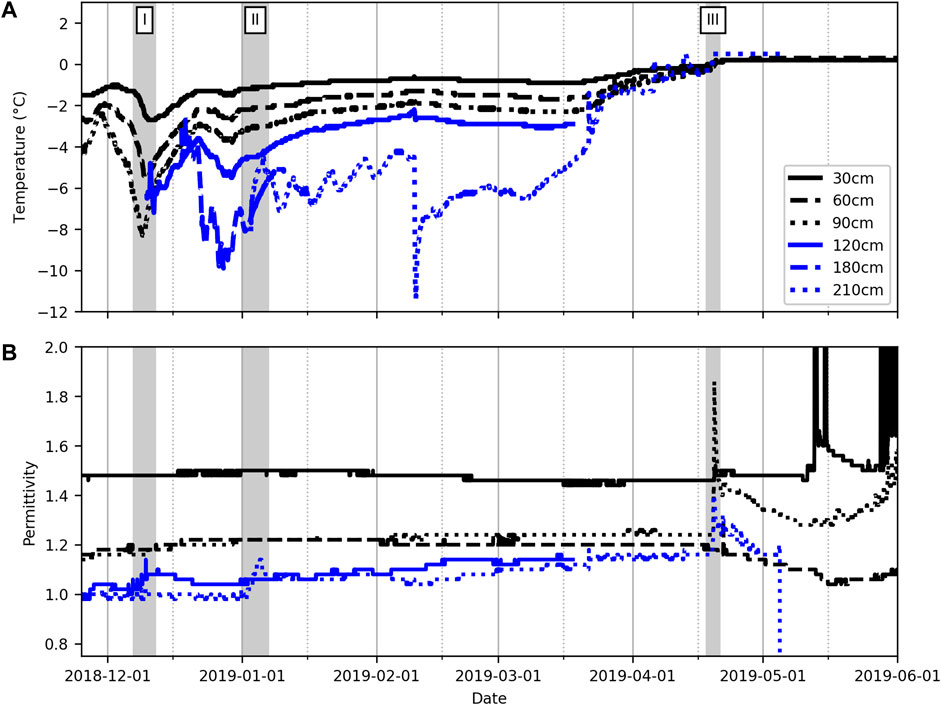
FIGURE 7. Vertical snow temperatures (A) and permittivity (B) measured using the Decagon during the winter season of 2018–2019. Some instruments stopped recording during the winter season. The 120-cm Decagon got buried around December 10, 2018 (I). The 210-cm Decagon got fully buried after a precipitation event at the beginning of January 2019 (II). The isothermal state of the snowpack at 0°C was observed on April 19 2019 (III).
4.5 Validation of the simulations
Before validating profiles of LWC, a first-order validation of snow depth, layering, density, and grain size must be conducted, given that they drive percolation within SNOWPACK. The HS simulation was driven with measured snow height, while precipitation amounts measured at the weather station drove the PCPN simulation.
4.5.1 Snow depth
Both simulations underestimated the total snow height during most of the season (Figure 8). Again, it can be expected that the simulation forced on observed snow height (HS) does not match perfectly with the observations during settling. This is partly due to the fact that in between the observations, various processes in the model will have an impact on depth, such as erosion, sublimation, wind redistribution, and compaction. While one may think that this simulation configuration should provide better results, the fact remains that observed snow height data are required, whilst not always available. This motivates the configuration that does not require snow height but instead is driven by precipitation (PCPN). The PCPN simulation showed more disparity, which can be explained by high settling rates after storm events. SWE was underestimated (Figure 8), and the February measurements suggest significant differences between both simulations, whereas the spring values were similar. This said, the HS simulation generated more SWE when compared to PCPN during two accumulation periods, mid-December and early January. Since the simulated snow depth is lower than what was measured on site, it was expected that the SWE would be underestimated. Those differences could be explained by local snow depth variability. The SWE difference between the two simulations was event-dependent and inconsistent throughout the season. To account for this variability, bulk density was calculated for each SWE measurement and compared with the simulations. For both SWE and bulk density, the March measurement was the furthest from the simulations. This measurement was suspected to be erroneous and was discarded. For all other measurements, the bulk density differences were less than 7%, with a mean error of −3.24% and −4.19% for the HS and PCNP simulations, respectively.
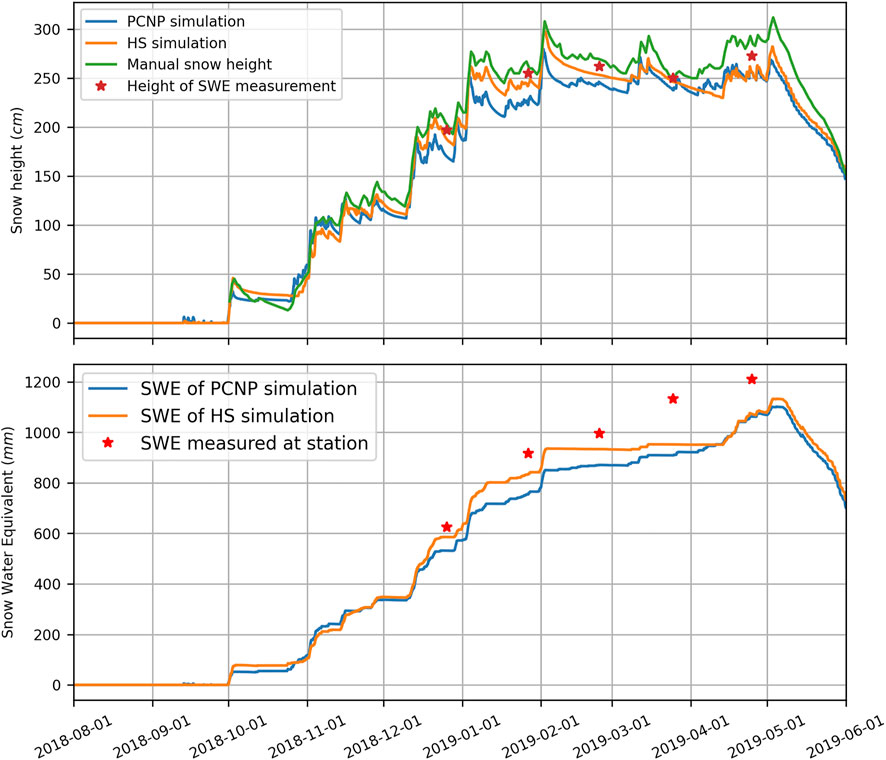
FIGURE 8. Total height of measured and simulated snowpacks. Total simulated SWE from the PCPN and HS simulations compared to field measured SWE with a Federal sampler.
4.5.2 Density, layer thickness, and grain size
In order to validate LWC as prescribed by our main objective, first, the geophysical parameters governing percolation must be validated in order to understand the biases and differences between measured and simulated LWC profiles. Corresponding layers between simulated profiles and observed profiles were selected manually. For each monthly profile, corresponding groups of observed layers were associated with groups of simulated layers. Both observed and simulated layers were aggregated following their creation date, similar grain type, and resistance (i.e., small modeled layers could be grouped to fit a storm event that was observed as one layer in the field). The water equivalent measurements of each layer were not carried out during the full profiles performed by the Parks Canada’s technician.
4.5.2.1 Density
The density validation was conducted by depth-averaging the corresponding group of layers weighted by their respective height, for both measured and simulated data. Both simulations (i.e., PCPN and HS) showed a good agreement with the field density measurements, with the mid-range densities (i.e., 200–00 kg m−3) being slightly overestimated (Figure 9). In both cases, it appears that low densities are overestimated and high densities (>350 kg m−3) are underestimated. This said, reasonable accuracy is reached overall with slopes of 0.85 and 0.88, respectively, for the PCPN and HS simulations.
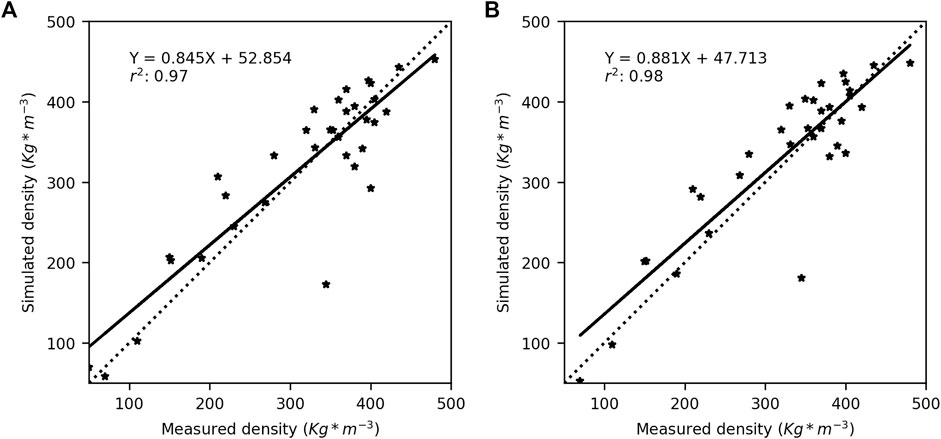
FIGURE 9. Comparison between simulated and measured snow density for simulations driven with (A) precipitations (PCPN) and (B) observed snow depth (HS). The dotted line represents 1:1.
4.5.2.2 Layer thickness
The layer thickness was also compared for both PCPN and HS (Figure 10). The same pattern as density was observed where thin layers tend to be overestimated and thick layers tend to be underestimated, although the overall accuracy is good with slopes of 0.78 and 0.85 for PCPN and HS, respectively. The scatter tends to be more pronounced for thick layers, which can be expected given that thick layers are usually located in the middle or bottom of the snowpack (along with high density), where the transition between the layers can sometimes be difficult to identify in the field (i.e., more scatter comparing measured vs. simulated layer thickness).
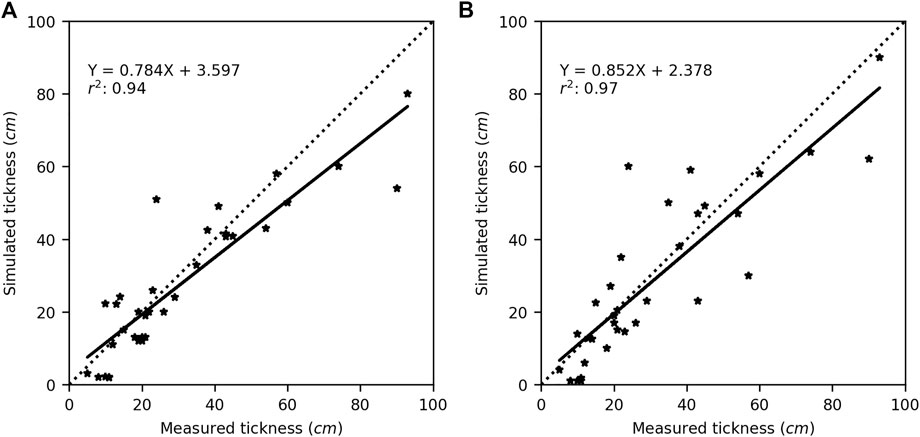
FIGURE 10. Comparison between simulated and measured layer thickness for simulations driven with (A) precipitations (PCPN) and (B) observed snow depth (HS). The dotted line represents 1:1.
4.5.2.3 Grain size and type
Finally, grain size and type were also evaluated. Madore et al. (2018) have shown that biases between the observed and simulated snow grain size can be attributed to the metamorphic process in place. Given that the metamorphic processes are mainly driven by the temperature gradient, it can be expected that the biases between the observed and simulated grain size can vary with climatic conditions. This work was conducted by comparing the simulated optical grain size with the measurements from the InfraRed Integrating Sphere (IRIS, Montpetit et al., 2012), so that a quantitative comparison could be conducted. Here, in the context of LWC and water percolation, traditional grain size was needed to be evaluated for the following problem: simulated grain size is quantitative, whereas observations are often qualitative with two means representing the average extent of the dominant grain size and the average maximum extent of larger grains provided from a sample on a grid card. In such cases, it is hard to compare a qualitative observation with a quantitative measurement, given that manual observations on a gridded card is highly dependent on the grain type. For example, SNOWPACK sets the size of new snow crystals to a fixed value of 0.3 mm, while field observations of snow grain maximum extent can vary, which leads to systematic underestimation by the model of newly fallen snow grain size. However, the model does not allow grain size to decrease, a phenomenon observed in the field with decomposing particles. The snow grain size is underestimated by the model until the grains are decomposed and rounded, in which case the model will start to overestimate the grain size. Typical measured rounded grains at the site were evaluated as equal to or smaller than 0.5 mm, whereas the model simulated grain size was between 0.3 and 0.7 mm. In terms of grain type, most of the main layers were either rounded grains (RG) or faceting rounded grains (RGxf). Those layer types were well identified in the field and simulated by the model. Weak layers were generated by the model and measured in the field. However, no evaluation of those layers was carried out because of the scope of this paper and the amount of snow to evaluate, which brings challenges in following those types of layers.
4.5.3 Liquid water content
4.5.3.1 LWC simulations
The LWC simulation of the PCPN and HS configurations gave similar results overall but differed at several specific levels (Figure 11). First, it was possible to identify three clear periods of spring percolation in both simulations: the initiation period, the transition period, and finally, the ablation period or the ripe period. The initiation period is defined as the first spring percolation until the wetting front reaches the ground. From there, the transition period is characterized by the whole snowpack being moist with a global LWC below 3%. Finally, the ablation period or the ripe period is when LWC is generally higher than 3% and significant ablation is observed. The percolation initiation period occurred between March 15 and April 22, 2019. During this period, the wetting front did not penetrate into the ground, and the night/refreeze effect was present and significant. The absence of snow precipitation on March 27 and April 12, 2019 in the HS simulation led to deeper percolation. The difference in precipitation between the two simulations affected the modeling of the layers in both the simulations. This difference is reflected in different LWC accumulations between the simulations during the percolation initiation period.
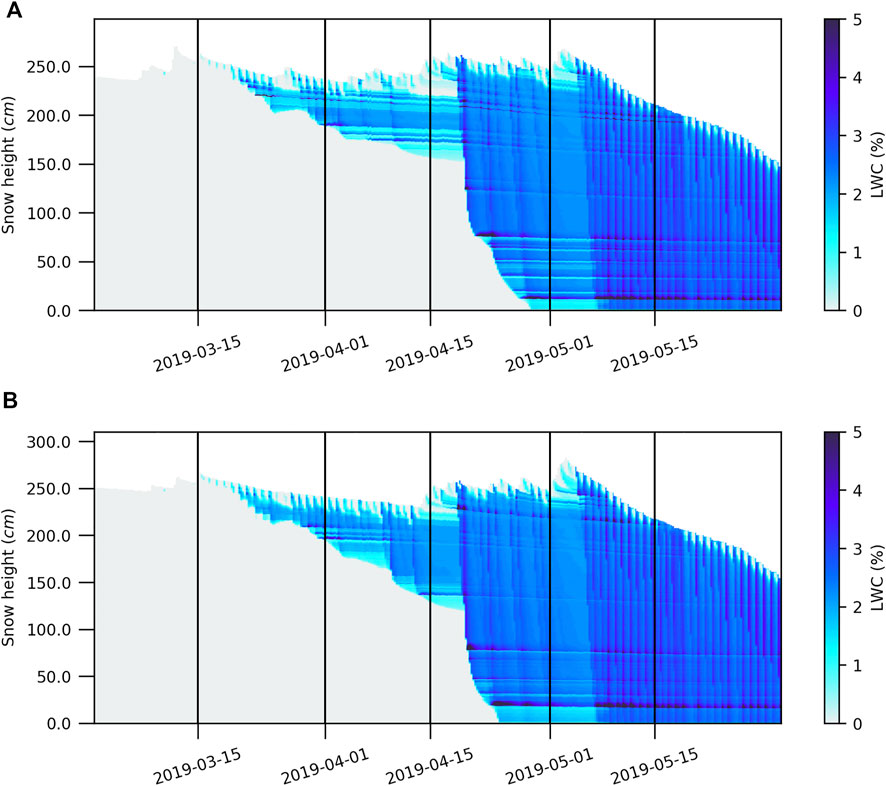
FIGURE 11. Simulated LWC percolation (%) with (A) PCPN configuration and (B) HS configuration.
On April 9 and April 12, 2019, the simulated percolation in HS was higher than that in PCPN. Starting on April 9, 2019, the wetting front in HS penetrated the snowpack more rapidly. The transition period began on April 19 and ended on May 4, 2019. The wetting front of the PCPN simulation slowed down when the water reached 75 cm, while the HS simulation continued to the ground (Figure 11). The HS simulation percolation reached the ground on April 24 and the PCPN simulation on April 28. Both the simulations transited into the ablation phase starting on May 4.
4.5.3.2 Wetting front
The wetting front was evaluated as the deepest value of LWC simulated during the spring melt period (Figure 12). The vertical location of the wetting front of the two simulations differed primarily on two occasions. On April 9, the wetting front was deeper on the HS simulation than that of PCPN. From then on, the percolation simulated by HS was faster and deeper than that stimulated by PCPN for the rest of the season. Then, during the transition phase, the wetting front of the PCPN simulation reached the ground on April 28, 4 days after HS. When evaluating the deepest snow depth with a LWC content of >2%, we observed water accumulation in specific layers before penetrating deeper. This phenomenon is apparent for the HS simulation between April 1 and April 9. During this period, significant accumulation was simulated at the interface between the rounded grains and faceted crystals. This accumulation was not generated by PCPN even though the HS-metamorphosed layer was present in both the simulations. The study of the Decagons allowed us to observe when the wetting front reached their depth. Since many of the installed Decagons were broken during the winter, only the 210, 90, 60, and 30 cm devices allowed the wetting front to be read. The depth of the devices is relative to the snow height measurement instrument at the research site. From these data, we noted that the timing of the percolation was consistent with the arrival of LWC at the Decagons. The 30-cm Decagon did not record water until May 14. These data seem aberrant, given that the snow ablation period had begun, i.e., the snowpack was losing mass by runoff, and thus the entire snowpack was moist since May 4. Local dry conditions within the snow cover could be possible in the presence of an ice lens, but snow temperatures suggest otherwise, so a problem with the instrument is likely to be the cause in this particular situation. Finally, the analysis of the LWC profile data from the SLF device confirmed that the wetting front was indeed simulated at the right time and depth.
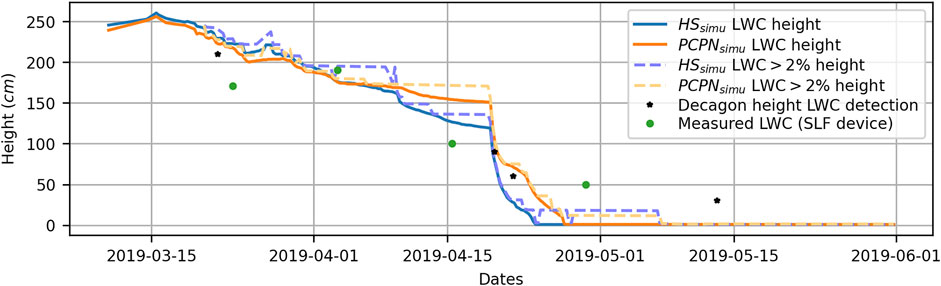
FIGURE 12. Wetting front depth simulated by PCPN and HS. The maximum depth with a LWC value of 2% is the dashed line. The water detection from various Decagon instruments is represented with *, where each point represents the deepest Decagon recording at least 2% LWC, while the dots represent using the SLF device.
4.5.3.3 LWC accumulation zone
Comparison of the profile data between the SLF and Denoth devices showed considerable variability. The LWC measurements of the upper layers of the snowpack were much higher by the SLF device than by the Denoth within the eight different profiles where both measures were taken (Figure 13). This could be explained by the difference between the measurement techniques used by the two devices (please refer to Mavrovic et al., 2020, for a complete review of the different LWC sensors used in this study). This difference became less pronounced when the measurements were made in the center and lower part of the snowpack. Evaluation of the LWC profiles during the first percolation phase revealed that both simulations generated maximum water concentrations, comparable to what was measured in the field, i.e., about 2%. The positioning of the main accumulation layer was directly related to that of the wetting front. Thus, the depth of the accumulation zone measured was greater than that simulated at the beginning of the season. Measurements obtained on April 15, 2019 revealed that the models differ from the vertical variability observed in the field. The amount of LWC was overestimated compared to the field observation. The simulations generated profiles with LWC values between 2.5 and 3%, while values ranging from 0 to 2% were measured. The simulated LWC profile was within the depth of the identified wetting front measured using the SLF device (Figure 12). The main difference between the PCPN and HS simulations was mainly due to the differences in snow accumulation at the start of the spring percolation. We observed that the models simulated similar accumulations after mid-April.
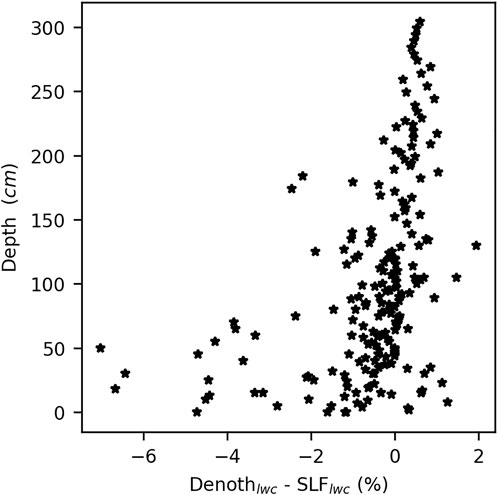
FIGURE 13. Measured LWC differences between the Denoth and SLF devices with respect to depth.
5 Discussion
5.1 Adjustment for the local precipitation phase threshold
The investigation into the precipitation phase showed that small changes in this parameter have a significant impact on the simulation of the snowpack layering and metamorphism. The evaluation of the default 1.2°C showed that early-season crust formation was missed using this threshold. While the 1.4°C was better suited for the 2018–2019 season simulation, variability in air temperature during the solid/liquid precipitation transition elsewhere suggests that it could vary from season to season. The parameter is quite event-dependent, and there could be seasons without a precipitation episode occurring directly at the threshold. Changes in the threshold had a minimum impact in assessing percolation events in the spring. The effect of the phase change temperature in spring is difficult to evaluate because of all the other processes involved in snow water percolation, such as positive air temperatures and incoming shortwave radiation. Nevertheless, not taking this parameter into account when assessing the layering and metamorphism, especially at the start of the season, could lead to wrong evaluation of the state of the snowpack that could last during the whole season.
5.2 Improvements from empirical optimization of SNOWPACK processes
The evaluation of the LWC proposed in this paper required not only accurate simulation of bulk snow properties such as depth and SWE but also accurate stratigraphy and microstructure as presented in Section 4.5. The simulations were achieved by empirically optimizing several key processes in SNOWPACK, namely: new snow density and layer thickness. As such, we evaluated all the models for new snow density, for which the accuracy in the simulated new snow height varied greatly. This can be attributed to the fact that different variables drive the new snow density models. In our case, the best results were obtained using the BELLAIRE parametrization, which is driven by air temperature and wind speed, while being adjusted for altitude. Given that our site is well protected from undercatch by wind, the model performed well when driven by precipitation measurements. This said, as mentioned previously, all new snow density models underestimated the new snow height. In the context of using SNOWPACK elsewhere in the park, especially in areas exposed to wind, empirical modifications to the model would be required. As such, Bellaire et al. (2011) suggested that low densities may not be properly simulated so that the underestimation in new snow height highlighted previously might be more sustained in open alpine areas of the park. Developing a new empirical new snow density model or further adapting the BELLAIRE parametrization to the conditions in Rogers Pass would help improve not only new snow height but also snow depth (underestimated in this study, both using HS or PCPN), density, and compaction, which in turn would improve the percolation timing.
The aforementioned biases in the new snow density would therefore have an impact on the layer thickness, which was also manually adjusted to match the reference profiles taken by the Parks Canada employees. This work highlighted a substantial inter-layer variability attributed to 1) snow depth and 2) the manual assessment of layer matching. In terms of layering, the main layers identified by Parks Canada were simulated by the model, but lingering uncertainties remained regarding layer thicknesses. Given that the layers are mainly driven by a minimum thickness provided by the user, layer fusion by the model, and compaction, it can be expected that a parametrization of the latter could help improve the simulated initial stratigraphy while improving percolation timing. Compaction is calculated using time and snow overburden, so if the new snow density prediction can be improved, it can be expected that compaction and percolation timing will be improved as well. Further improvement could arise from a modification to the grain size, given that grain size is one of the parameters driving percolation (Yamaguchi et al., 2010). The previous work from Madore et al. (2018) suggested that SNOWPACK overestimated snow grain size, an overestimation that increases as the grain size increases, which could lead to biases in the percolation. They suggested the biases to be a function of the metamorphic process in place (i.e., kinetic growth vs. equilibrium) so that an empirical correction to grain size adapted to Rogers Pass could further improve the percolation simulation.
Despite future development potential, the proposed work in this paper clearly shows that the optimization of the simulation’s parameters allows the model to simulate water percolation correctly compared to field data. The overestimation of LWC by the model observed on April 15 could be linked to the high variability in LWC measurements, as shown in Figure 13. LWC observations for this profile were within the upper part of the snowpack, where more measurement variability was observed. Furthermore, it appears that the first moist avalanche cycle is well correlated with the beginning of percolation in the model. As mentioned previously, the percolation initiation period occurred between March 15 and April 22nd, 2019, which corresponds to a strong cycle of avalanches, including avalanches of size >2.5 (CAA, 2016), at the end of March (Figure 14). We also suggest that the cycle of April 7 and the big wet avalanche cycle beginning on April 19 are well correlated with the simulation (Figure 9), where the wetting front in HS penetrated the snowpack more rapidly between April 5 and 10 and the isothermal period began on April 19.
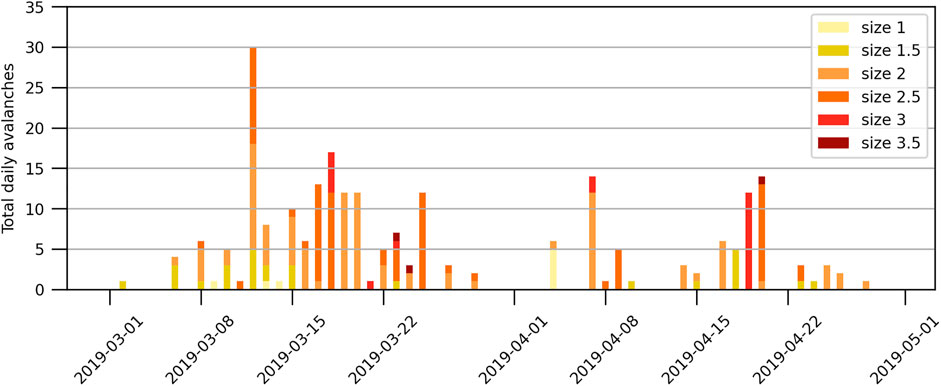
FIGURE 14. Number of avalanches by typical size reported by Parks Canada during our study period.
6 Conclusion
Motivated by the need to improve our understanding of wet snow avalanches, the work presented in this paper aimed to evaluate the performance of the SNOWPACK model to simulate liquid water content in snow and percolation in the avalanche climate of the Canadian Columbia Mountains. To this date, the water percolation using Richards’ equation in SNOWPACK was not evaluated in a Canadian environment, despite its potential in improving wet snow avalanche assessment. The work focused on Glacier National Park in British Columbia, where our group has collected snow data since 2014. Our strategy was twofold: 1) provide a model configuration best suited for the conditions in Glacier National Park and 2) use measurements of liquid water content (LWC) and field observations to evaluate the SNOWPACK model’s performance in simulating LWC and percolation in Glacier National Park.
In our efforts to parameterize the SNOWPACK model to the conditions of Glacier National Park, we empirically verify the need for adjusting the precipitation phase transition from 1.2°C to 1.4°C, which improved stratigraphy as well as grain type and size for deep layers. We also showed that there were no apparent problems regarding precipitation undercatch from the wind, given that the new snow water equivalent (HNW) and the measured precipitation amount over the same 24 h were well correlated. Our configuration also included an evaluation of the new snow density models, for which we did not present individual results but the BELLAIRE parameterization proposed provided the best results. New snow density tends to be underestimated but is the best when driven by precipitation (R2 = 0.96).
The validation was conducted for both the simulations driven by the precipitation (PCPN) and the snow height (HS), and with the aforementioned configuration proposed, the snow height was slightly underestimated, mostly throughout the seasons but with good overall accuracy. In order to validate LWC and percolation, our validation strategy focused on snow geophysical variables driving percolation in SNOWPACK (i.e., density, layer thickness, and grain size/type). Our results showed a good agreement with the field density measurements, with the mid-range densities being slightly overestimated. In both cases, it appears that low densities are overestimated and high densities are underestimated. The same behavior was observed for layer thickness, but again, the accuracy is quite good, with slopes of 0.78 and 0.85 for PCPN and HS, respectively. Finally, percolation is also affected by snow grains, which is hard to evaluate. A previous work in our group (Madore et al., 2018) suggested that the optical snow grain size bias is a function of the dominant metamorphic process in place. In our case, an overestimation of the optical grain size was measured. One must consider, however, that percolation is driven in part by the geometrical grain size and not the optical grain size. This said, the optical grain size in SNOWPACK is derived from the geometrical grain size such that an overestimation of the latter can be expected, thus leading to an accelerated and biased percolation. The percolation analysis showed good timing using the Decagon measurements. The LWC profiles using the SLF snow sensor suggested that the wetting front was simulated with good accuracy with some differences between HS and PCPN, which are event-related.
Overall, this paper proposes a configuration of the SNOWPACK model well adapted to the conditions of Glacier National Park, leading to accurate melt and percolation timing, as well as a good correlation with wet snow avalanche cycles. Future work will include further empirical development of new snow density parameterization as well as further investigation into grain size and type biases in the model following the approach of Madore et al. (2018), in order to propose a snow grain correction function adapted to our study region. These results are relevant for the ongoing development of the SNOWPACK model as well as for the snow modeling community that makes use of similar thermodynamic snow models for climate scenarios, snow mass balance studies, surface-atmosphere feedback, hydrological processes, etc. Understanding the impact of percolation on avalanche risk is critical for the general public, scientists, and other stakeholders in order to develop mitigative responses and adaptive strategies in avalanche terrain.
Data availability statement
The raw data supporting the conclusions of this article will be made available by the authors without undue reservation.
Author contributions
J-BM led the data analysis and the writing of the document. FC and AL contributed to the data analysis, simulations, and overall discussion on simulation performance and document review.
Funding
This project was funded by the Search and Rescue New Initiatives Fund from Public Safety Canada (SAR-NIF), the Natural Sciences and Engineering Research Council of Canada (NSERC), the Fonds de Recherche du Québec—Nature et Technologies (FRQNT), and the Canada Foundation for Innovation (CFI).
Acknowledgments
The authors would like to thank Jeff Goodrich and the Mount Revelstoke and Glacier National Parks staff. The authors also thank, Alex Mavrovic, Jacob Laliberté, Francis Meloche, Paul Billecocq, and Alex Blanchette for assistance in data collection and support during fieldwork. Thanks to Alec Van Herwijnen and Fabian Wolfsperger for their help with the Denoth sensor and the SLF snow sensor.
Conflict of interest
The authors declare that the research was conducted in the absence of any commercial or financial relationships that could be construed as a potential conflict of interest.
Publisher’s note
All claims expressed in this article are solely those of the authors and do not necessarily represent those of their affiliated organizations, or those of the publisher, the editors, and the reviewers. Any product that may be evaluated in this article, or claim that may be made by its manufacturer, is not guaranteed or endorsed by the publisher.
References
Baggi, S., and Schweizer, J. (2009). Characteristics of wet-snow avalanche activity: 20 years of observations from a high alpine valley (Dischma, Switzerland). Nat. Hazards 50, 97–108. doi:10.1007/s11069-008-9322-7
Bartelt, P., and Lehning, M. (2002). A physical SNOWPACK model for the Swiss avalanche warning Part I: Numerical model. Cold Reg. Sci. Technol. 35, 123–145. doi:10.1016/S0165-232X(02)00074-5
Bellaire, S., Jamieson, B., Thumlert, S., Goodrich, J., and Statham, G. (2016). Analysis of long-term weather, snow and avalanche data at Glacier National Park, B.C., Canada. Cold Reg. Sci. Technol. 121, 118–125. doi:10.1016/j.coldregions.2015.10.010
Bellaire, S., Jamieson, J. B., and Fierz, C. (2011). Forcing the snow-cover model SNOWPACK with forecasted weather data. Cryosphere 5, 1115–1125. doi:10.5194/tc-5-1115-2011
Bellaire, S., van Herwijnen, A., Mitterer, C., and Schweizer, J. (2017). On forecasting wet-snow avalanche activity using simulated snow cover data. Cold Reg. Sci. Technol. 144, 28–38. doi:10.1016/j.coldregions.2017.09.013
Beniston, M., and Stoffel, M. (2016). Rain-on-snow events, floods and climate change in the Alps: Events may increase with warming up to 4 °C and decrease thereafter. Sci. Total Environ. 571, 228–236. doi:10.1016/j.scitotenv.2016.07.146
Berghuijs, W. R., Woods, R. A., Hutton, C. J., and Sivapalan, M. (2016). Dominant flood generating mechanisms across the United States. Geophys. Res. Lett. 43, 4382–4390. doi:10.1002/2016GL068070
Blanchette, A. (2021). Sensibilité du modèle SNOWPACK à la paramétrisation de la phase de précipitation dans un contexte de stabilité du couvert nival : Étude de cas au Col Rogers, Parc national des Glaciers, Colombie-Britannique. Lettres Sci. humaines – Mémoires. http://hdl.handle.net/11143/18722.
Brun, E. (1989). Investigation on wet-snow metamorphism in respect of liquid-water content. Ann. Glaciol. 13, 22–26.
Caa, (2016). Observation Guidelines and recording Standards for weather, snowpack and avalanches. Revelstoke, Canada: Canadian Avalanche Association. https://www.avalancheassociation.ca/page/GuidelinesStandards.
Calonne, N., Geindreau, C., Flin, F., Morin, S., Lesaffre, B., Rolland Du Roscoat, S., et al. (2012). 3-D image-based numerical computations of snow permeability: Links to specific surface area, density, and microstructural anisotropy. Cryosphere 6, 939–951. doi:10.5194/tc-6-939-2012
Clarke, J., and Mcclung, D. (1999). Full-depth avalanche occurrences caused by snow gliding, Coquihalla, British Columbia, Canada. J. Glaciol. 45, 539–546. doi:10.1017/S0022143000001404
Clifton, A., Manes, C., Rüedi, J.-D., Guala, M., and Lehning, M. (2008). On Shear-driven Ventilation of snow. Bound. Layer. Meteorol. 126, 249–261. doi:10.1007/s10546-007-9235-0
Colbeck, S. (1997). A review of Sintering in seasonal snow. New Hampshire, NH, USA: U.S. Army Cold Regions Research and Engineering Laboratory.
Colbeck, S. C. (1982). An overview of seasonal snow metamorphism. Rev. Geophys. 20, 45–61. doi:10.1029/RG020i001p00045
Colbeck, S. C., and Jamieson, J. B. (2001). The formation of faceted layers above crusts. Cold Reg. Sci. Technol. 33, 247–252. doi:10.1016/S0165-232X(01)00045-3
Coléou, C., and Lesaffre, B. (1998). Irreducible water saturation in snow: Experimental results in a cold laboratory. Ann. Glaciol. 26, 64–68. doi:10.1017/s0260305500014579
Conway, H., and Raymond, C. F. (1993). Snow stability during rain. J. Glaciol. 39, 635–642. doi:10.1017/s0022143000016531
Denoth, A. (1994). An electronic device for long-term snow wetness recording. Ann. Glaciol. 19, 104–106. doi:10.3189/s0260305500011058
Denoth, a., Foglar, A., Weiland, P., Mätzler, C., Aebischer, H., and Tiuri, M. (1984). A comparative study of instruments for measuring the liquid water content of snow. J. Appl. Phys. 56, 2154–2160. doi:10.1063/1.334215
Denoth, A. (1989). Snow dielectric measurements. Adv. Space Res. 9, 233–243. doi:10.1016/0273-1177(89)90491-2
Fierz, C., and Föhn, P. M. B. (1994). “Long-term observation of the water content of an alpine snowpack,” in Proceedings of the 1984 International Snow Science Workshop, 117–131.
Fierz, C., Armstrong, R. L., Durand, Y., Etchevers, P., Greene, E., McClung, D. M., et al. (2009). The International Classification for Seasonal Snow on the Ground. Paris, France: IHP-VII Technical Documents in Hydrology N°83, IACS Contribution N°1, UNESCO-IHP.
Haegeli, P., and McClung, D. M. (2007). Expanding the snow-climate classification with avalanche-relevant information: Initial description of avalanche winter regimes for southwestern Canada. J. Glaciol. 53, 266–276. doi:10.3189/172756507782202801
Hägeli, P., and McClung, D. M. (2003). Avalanche characteristics of a transitional snow climate—Columbia mountains, British Columbia, Canada. Cold Reg. Sci. Technol. 37, 255–276. doi:10.1016/S0165-232X(03)00069-7
Hirashima, H., Yamaguchi, S., Sato, A., and Lehning, M. (2010). Numerical modeling of liquid water movement through layered snow based on new measurements of the water retention curve. Cold Reg. Sci. Technol. 64, 94–103. doi:10.1016/j.coldregions.2010.09.003
Ito, Y., Matsushita, H., Hirashima, H., Ito, Y., and Noro, T. (2012). Change in snow strength caused by rain. Ann. Glaciol. 53, 1–5. doi:10.3189/2012AoG61A027
Jamieson, J. B. (2001). “Snow avalanches,” in A Synthesis of Geological Hazards in Canada, 81–100. doi:10.4095/212210
Jamieson, B., and Fierz, C. (2004). Heat flow from wet to dry snowpack layers and associated faceting. Ann. Glaciol. 38, 187–194. doi:10.3189/172756404781814762
Jamieson, J. B., Haegeli, P., and Schweizer, J. (2009). Field observations for estimating the local avalanche danger in the Columbia Mountains of Canada. Cold Reg. Sci. Technol. 58, 84–91. doi:10.1016/j.coldregions.2009.03.005
Jordan, R., Albert, M., and Brun, E. (2008). “Physical processes within the snow cover and their parametrization,” in Snow And Climate: Physical Processes, Surface Energy Exchange and Modeling. Editors R. Armstrong, and E. Brun (Cambridge University Press), 12–69.
Liston, G. E., and Hiemstra, C. A. (2011). The changing cryosphere: Pan-Arctic snow trends (1979-2009). J. Clim. 24, 5691–5712. doi:10.1175/JCLI-D-11-00081.1
Madore, J.-B., Langlois, A., and Côté, K. (2018). Evaluation of the SNOWPACK model’s metamorphism and microstructure in Canada: A case study. Phys. Geogr. 39, 406–427. doi:10.1080/02723646.2018.1472984
Mavrovic, A., Madore, J.-B., Langlois, A., Royer, A., and Roy, A. (2020). Snow liquid water content measurement using an open-ended coaxial probe (OECP). Cold Reg. Sci. Technol. 171, 102958. doi:10.1016/j.coldregions.2019.102958
McCabe, G. J., Hay, L. E., and Clark, M. P. (2007). Rain-on-Snow events in the western United States. Bull. Am. Meteorol. Soc. 88, 319–328. doi:10.1175/BAMS-88-3-319
Mitterer, C., Hirashima, H., and Schweizer, J. (2011). Wet-snow instabilities: Comparison of measured and modelled liquid water content and snow stratigraphy. Ann. Glaciol. 52, 201–208. doi:10.3189/172756411797252077
Mitterer, C., and Schweizer, J. (2013). Analysis of the snow-atmosphere energy balance during wet-snow instabilities and implications for avalanche prediction. Cryosph. 7, 205–216. doi:10.5194/tc-7-205-2013
Peitzsch, E. H., Hendrikx, J., Fagre, D. B., and Reardon, B. (2012). Examining spring wet slab and glide avalanche occurrence along the Going-to-the-Sun Road corridor, Glacier National Park. Cold Reg. Sci. Technol. 78, 73–81. doi:10.1016/j.coldregions.2012.01.012
Quéno, L., Fierz, C., Van Herwijnen, A., Longridge, D., and Wever, N. (2020). Deep ice layer formation in an alpine snowpack: Monitoring and modeling. Cryosphere 14, 3449–3464. doi:10.5194/tc-14-3449-2020
Richards, L. A. (1931). Capillary conduction of liquids through porous mediums. Physics 1, 318–333. doi:10.1063/1.1745010
Schleiss, V. G. (1990). Rogers Pass snow avalanche control - a summary. British Clumbia Canada: Glacier National Park.
Schweizer, J., Bartelt, P., and van Herwijnen, A. (2015). “Snow Avalanches,” in Snow and Ice-Related Hazards, Risks and Disasters (Elsevier), 395–436. doi:10.1016/B978-0-12-394849-6.00012-3
Semmens, K. A., Ramage, J., Bartsch, A., and Liston, G. E. (2013). Early snowmelt events: Detection, distribution, and significance in a major sub-arctic watershed. Environ. Res. Lett. 8, 014020. doi:10.1088/1748-9326/8/1/014020
Sharma, A. R., and Déry, S. J. (2016). Elevational dependence of air temperature variability and trends in British Columbia’s Cariboo mountains, 1950–2010. Atmosphere-Ocean 54, 153–170. doi:10.1080/07055900.2016.1146571
Smith, C. D., Ross, A., Kochendorfer, J., Earle, M. E., Wolff, M., Buisán, S., et al. (2020). Evaluation of the WMO Solid Precipitation Intercomparison Experiment (SPICE) transfer functions for adjusting the wind bias in solid precipitation measurements. Hydrol. Earth Syst. Sci. 24, 4025–4043. doi:10.5194/hess-24-4025-2020
Smith, M. J., and Clung, D. M. M. (1997). Avalanche frequency and terrain characteristics at Rogers’ Pass, British Columbia, Canada. J. Glaciol. 43 (143), 165–171. doi:10.3189/S0022143000002926
Techel, F., and Pielmeier, C. (2009). Wet snow diurnal evolution and stability assessment. Proc. Int. Snow Sci. Work. 2009, Davos. Switz. 01, 256–261.
Techel, F., and Pielmeier, C. (2011). Point observations of liquid water content in wet snow–Investigating methodical, spatial and temporal aspects. Cryosphere 5, 405–418. doi:10.5194/tc-5-405-2011
Valero, C. V., Wever, N., Christen, M., and Bartelt, P. (2018). Modeling the influence of snow cover temperature and water content on wet-snow avalanche runout. Nat. Hazards Earth Syst. Sci. 18, 869–887. doi:10.5194/nhess-18-869-2018
Venema, V. K. C., Mestre, O., Aguilar, E., Auer, I., Guijarro, J. A., Domonkos, P., et al. (2012). Benchmarking homogenization algorithms for monthly data. Clim. Past. 8, 89–115. doi:10.5194/cp-8-89-2012
Vincent, L. A., and Mekis, É. (2006). Changes in daily and extreme temperature and precipitation indices for Canada over the twentieth century. Atmosphere-Ocean 44, 177–193. doi:10.3137/ao.440205
Waldner, P. A., Schneebeli, M., Schultze-Zimmermann, U., and Flühler, H. (2004). Effect of snow structure on water flow and solute transport. Hydrol. Process 18, 1271–1290. doi:10.1002/hyp.1401
Wever, N., Fierz, C., Mitterer, C., Hirashima, H., and Lehning, M. (2014). Solving Richards Equation for snow improves snowpack meltwater runoff estimations in detailed multi-layer snowpack model. Cryosphere 8, 257–274. doi:10.5194/tc-8-257-2014
Wever, N., Schmid, L., Heilig, A., Eisen, O., Fierz, C., and Lehning, M. (2015). Verification of the multi-layer SNOWPACK model with different water transport schemes. Cryosphere 9, 2271–2293. doi:10.5194/tc-9-2271-2015
Wever, N., Vera Valero, C., and Fierz, C. (2016a). Assessing wet snow avalanche activity using detailed physics based snowpack simulations. Geophys. Res. Lett. 43, 5732–5740. doi:10.1002/2016GL068428
Wever, N., Vera Valero, C., and Techel, F. (2018). Coupled snow cover and avalanche dynamics simulations to evaluate wet snow avalanche activity. JGR. Earth Surf. 123, 1772–1796. doi:10.1029/2017JF004515
Wever, N., Würzer, S., Fierz, C., and Lehning, M. (2016b). Simulating ice layer formation under the presence of preferential flow in layered snowpacks. Cryosphere 10, 2731–2744. doi:10.5194/tc-10-2731-2016
Keywords: water percolation, snow simulation, liquid water content, Richards’ equation, parameterization
Citation: Madore J-B, Fierz C and Langlois A (2022) Investigation into percolation and liquid water content in a multi-layered snow model for wet snow instabilities in Glacier National Park, Canada. Front. Earth Sci. 10:898980. doi: 10.3389/feart.2022.898980
Received: 18 March 2022; Accepted: 27 October 2022;
Published: 11 November 2022.
Edited by:
Ramanathan Alagappan, Jawaharlal Nehru University, IndiaReviewed by:
Ward J. J. van Pelt, Uppsala University, SwedenZhiwen Dong, Chinese Academy of Sciences (CAS), China
Copyright © 2022 Madore, Fierz and Langlois. This is an open-access article distributed under the terms of the Creative Commons Attribution License (CC BY). The use, distribution or reproduction in other forums is permitted, provided the original author(s) and the copyright owner(s) are credited and that the original publication in this journal is cited, in accordance with accepted academic practice. No use, distribution or reproduction is permitted which does not comply with these terms.
*Correspondence: J-B. Madore, amVhbi1iZW5vaXQubWFkb3JlQHVzaGVyYnJvb2tlLmNh