 Haiyang Liu
 Xiaodong Tang
- Key Laboratory of Mesoscale Severe Weather, Ministry of Education and School of Atmospheric Sciences, Nanjing University, Nanjing, China
The aerosol−cloud impacts of the Tongan volcanic eruptions on the nearby tropical cyclone (TC) Cody on January 14∼15, 2022 are investigated by the MODIS satellite and ERA5 reanalysis data. Both the precipitation and intensity of Cody were obviously enhanced after the main blast of the Tongan volcanic eruption on January 15, although the sea surface temperature and vertical wind shear of the environmental wind did not change much according to ERA5 data. The vision that a large amount of volcanic aerosol flowed from the Tongan eruption into the inflow of Cody was captured by the MODIS observations on January 15. The cloud top temperature dropped, and the cloud particle effective radius decreased in Cody from then on, which indicated the occurrence of deep convection. The analyzed results of ERA5 show that convection was strengthened in the periphery of Cody at the beginning of the volcanic eruption at 03:00 UTC on January 15 and later in Cody’s inner core after the main blast at 06:00 UTC on January 15. This could be because of the microphysical process of aerosol−cloud interactions, which inhibited stratiform precipitation, increased vertical velocity and enhanced convective precipitation further. Since the deep convection in the inner core was conducive to the development of Cody, both the total precipitation and intensity of Cody increased after the main blast of the volcanic eruption. The result also suggests that major volcanic eruptions could increase the convective intensity and induce heavy precipitation in a nearby organized convective system (e.g., TC or mesoscale convective systems).
Introduction
The eruption of Hunga Tonga–Hunga Ha’apai that devastated Tonga on January 15, 2022 lasting for 11 h sent a plume of ash soaring into the upper atmosphere for nearly 30 km (Witze, 2022). Researchers have been scrambling to understand what long-term impact it might have and even compared it to the Pinatubo eruption in the Philippines in the last century (1991), which temporarily cooled the planet by nearly
In addition to climate effects, a volcanic eruption also changes the regional atmospheric composition quickly. Observations have shown that volcanic aerosols could convert into cloud condensation nuclei (CCNs) to participate in cloud microphysical processes, which significantly reduce the effective radius of liquid cloud droplets and precipitation efficiency in addition to increasing cloud top height (e.g., Gasso, 2008; Yuan et al., 2011; Malavelle et al., 2017). As it happens, there is a tropical cyclone (TC) Cody on the ocean about 500 km away from the Tonga volcano during the eruption. What are the effects of aerosols from Tonga volcanic eruptions on cloud microphysical processes in Cody?
The simulation studies reveal that aerosol−cloud effects in TC depend on the region where it worked. The impact of aerosol−cloud interactions on the inner core of tropical cyclones can strengthen the convection there, thus maintaining the warm core structure and enhancing the intensity of the TC (Liang et al., 2021). However, it is also found in other studies that the aerosol−cloud effect in the periphery could invigorate the peripheral convection. The enhancement of peripheral clouds draws more ascending air at the periphery of the storm, thereby bleeding the low-level inflow toward the eyewall, which is not conducive to TC development (Khain et al., 2010; Rosenfeld et al., 2012; Lynn et al., 2016). This phenomenon was also captured by satellite observation (Rosenfeld et al., 2012). On the contrary, a few observations show the enhancement process of convection induced by the effects of aerosol−cloud interaction in the inner core of TCs, so far.
Could the people verify and understand these opposed effects of the aerosol−cloud interaction in the TC? The MODIS satellite and ERA5 reanalysis data are used to study the effect of volcanic aerosols on the evolution of the TC Cody (2022), which provides a rare chance to verify the previously simulated results of aerosol–cloud effects on TC. The data and method are described in Data and Method. The results are presented and discussed in Results, followed by a summary in Conclusion and Discussion.
Data and Method
MODIS
The Moderate Resolution Imaging Spectroradiometer (MODIS) is one of the five instruments aboard the Terra Earth Observing System (EOS) platform launched into a sun-synchronous polar orbit in December 1999. The instrument is also being flown on the Aqua spacecraft, launched in May 2002. The MODIS provides one daytime and one nighttime image in a 24-h period. A comprehensive set of remote sensing algorithms for cloud detection and the retrieval of cloud physical and optical properties have been developed by the members of the MODIS atmosphere science team. The archived products from these algorithms have applications in climate change studies, climate modeling, numerical weather prediction, and fundamental atmospheric research (Platnick et al., 2003). The aerosol optical thickness (AOT) product from the MODIS provides the observation of global aerosol distribution (Remer et al., 2005). The data retrieved by the MODIS have been widely used in Earth science, including volcanic eruption monitoring, air quality detection, tsunami, and atmospheric activity detection. Here, we use the cloud and AOT product of 1-km and 3-km spatial resolutions to analyze the interaction of volcanic aerosol with the TC. The scanning time of Terra was about 22:00 (UTC) and Aqua 03:00 when the satellite cross the area of Tonga volcano.
ERA5 Reanalysis Data
ERA5, produced by ECMWF, is one of the most advanced reanalysis data with a 31-km horizontal resolution and hourly output of atmosphere, land surface, and ocean. ERA5 is based on the Integrated Forecasting System (IFS) Cy41r2, which was operational in 2016. ERA5 thus benefits from a decade of developments in model physics, core dynamics, and data assimilation (Hersbach et al., 2020). The wind field, cloud ice content, cloud water content, precipitation, and sea surface temperature are used to analyze the convective activities and the intensity of the TC during the Tongan volcanic eruption. To estimate the effects of the Tonga volcanic eruption on the convection in the inner core of Cody, the precipitation is partitioned as convective and stratiform following the methods mentioned by Tao et al. (1993), Braun et al. (2010), and Wang et al. (2010). First, grid points with rain rates, twice as large as the average of their nearest four neighbors, are identified as convective cell cores. Second, all grid points with a surface precipitation rate greater than 10
FNL Analysis Data
FNL analysis data are the output from NECP’s Global Data Assimilation System, which uses the same forecast model as GFS. The difference is that the FNL assimilates as many observations as possible in the start-up stage to obtain more real atmospheric analysis fields and thus provide more accurate atmospheric states. This study uses the FNL to double-check the results of ERA5.
Results
Satellite Observation of Aerosols From Tongan Volcanic Eruptions and Cody’s Cloud Development
An observation suggests that the intensity of the convection in the inner core implies TC intensification (Rodgers et al., 1991; Guimond et al., 2010; Lin and Qian, 2019). It is characterized by a deep convection outbreak in the inner core of TCs. The cloud top temperature could be seen as a representation of the convective intensity as the cloud top temperature below 200 K can be considered a deep convection (Guimond et al., 2010; Mote and Frey, 2006). As shown in Figure 1, there was still a lot of deep convective activity in Cody at 03:00 UTC on January 13 before the volcano erupted, indicating that the TC was still developing and slowly moving southward (Figure 1A). After 19 h, the strong convection in the TC weakened and the rain band dissipated greatly, indicating that Cody began to weaken (Figure 1B). But at 03:00 UTC on January 14, a strong convection was invigorated in the TC inner core again. At the same time, there was a large area of low cloud top temperature over the Tonga volcano, which could be because of some weak eruptions in the Tonga volcano (Figure 1C) [see also the picture in Witze (2022)]. Although the convection in the inner core of Cody was strengthened at this time (Figure 1C), the weakening trend remains unchanged (Figures 1C–E). After 24 h, there is almost no strong convection in the inner core of Cody. However, at 00:00 UTC on January 15, the formidable eruption began, which expelled an estimated 400,000 tons of
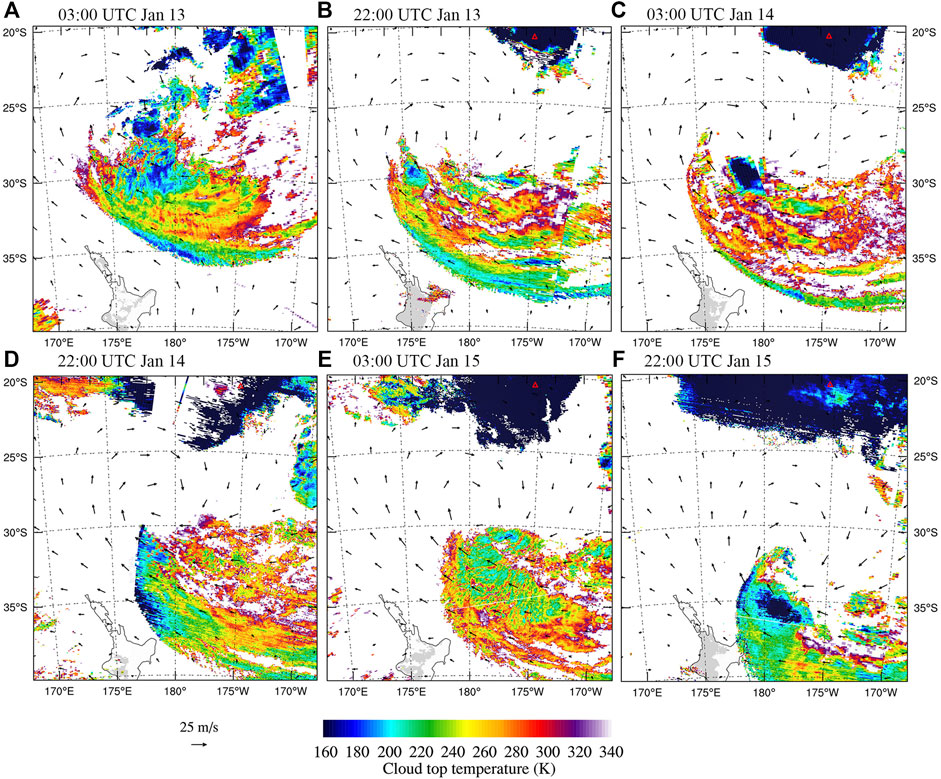
FIGURE 1. Cloud top temperature from the MODIS and wind field at 10 m of ERA5. Red triangles indicate the location of the Tonga volcano. The UTC time and date is on each panel from (A–F).
An AOT observation from the MODIS manifested a large amount of volcanic aerosol into Cody’s inner core after about 3 hours of the volcanic eruption, as shown in Figure 2A. The MODIS has no ability for aerosol observation in the high-albedo region (e.g., cloud cluster). Therefore, the volcanic aerosols could not be observed in the cloud cluster of Cody directly. However, a large amount of aerosol in the inflow direction (purple arrow in Figure 2C) around the cloud (Figure 2A) indicates that volcanic aerosols were entrained into the convection of Cody’s inner core (Figure 2C). It is reasonable to speculate that more aerosol will enter the inner core of Cody after the main blast at about 04:00 UTC on January 15, thus affecting the convective activity tremendously. The results for 22:00 UTC January 15 confirmed it further. There were still a lot of volcanic aerosols in the circulation of Cody even 11 h after the volcanic eruption ended (Figure 2B). In addition, the average wind field indicates that the volcanic aerosol could enter Cody’s circulation by the low-level inflow during the eruption (Supplementary Figure S1). However, plenty of moisture in the boundary layer of Cody is beneficial to aerosols converting into CCN. Meanwhile, the effective cloud droplet radius in the inner core decreased (Figure 2D), which means that the convection there was enhanced greatly by the aerosol−cloud effect and is consistent with the result shown in Figure 1F.
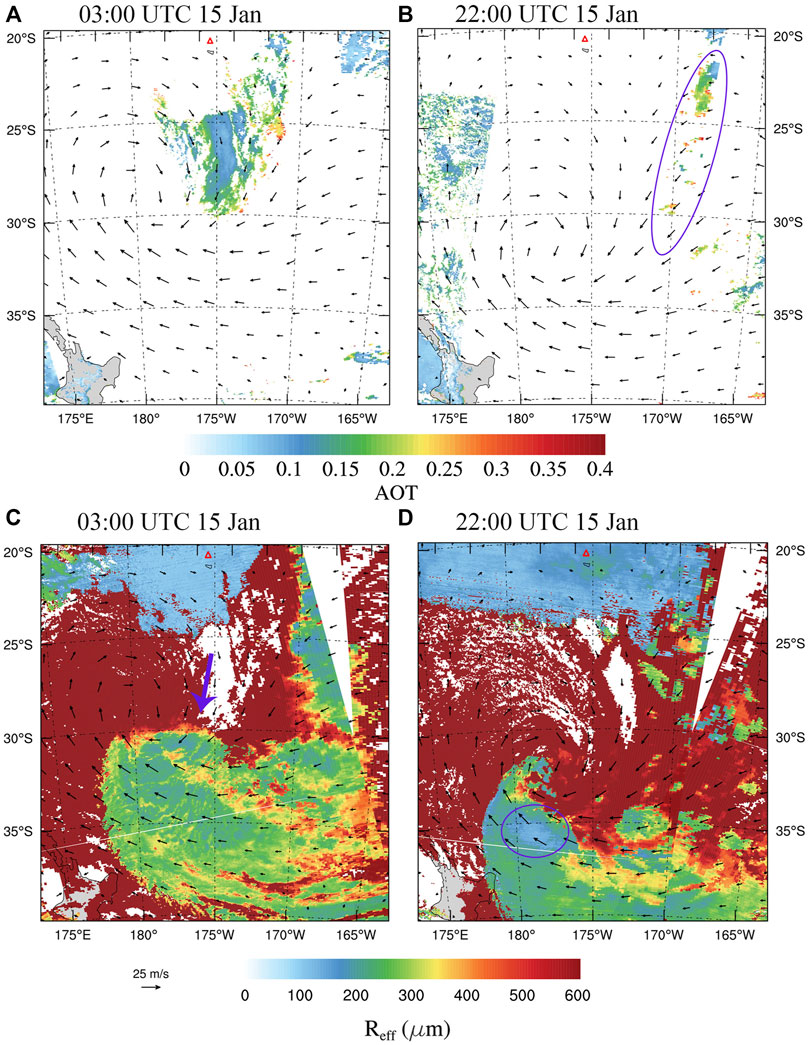
FIGURE 2. MODIS observation with the wind field at 10 m of EAR5 on January 15, 2022. (A,B) Aerosol optical thickness (AOT); (C,D) cloud particle effective radius. Red triangles indicate the location of the Tonga volcano, the purple circle in (B) shows high-concentration aerosol and that in (D) shows deep convection, and the purple arrow in (C) denoted the inflow with high-concentration aerosol.
In summary, a large amount of aerosol from the Tongan volcanic eruption entered the tropical cyclone Cody, which enhanced the convection and reduced the effective radius of cloud droplets in the inner core of Cody. The effects of volcanic aerosols on the precipitation and intensity of Cody will be analyzed in the following sections.
Effects of the Tongan Volcanic Aerosols on the Precipitation and Intensity of Cody
The column-integrated ice and liquid water content of ERA5 largely manifested the convective evolution in Cody on January 15 because the hydrometeor content can well represent the convective activity, especially ice water. After the Tongan volcano began erupting on January 15, volcanic aerosols with the in-draft of Cody’s circulation strengthened the convection in the periphery of Cody first (Figures 3A,B), which was unfavorable to the TC’s intensification (Rosenfeld et al., 2012; Khain et al., 2010; Lynn et al., 2016). However, the precipitation on the periphery could not deposit such a large amount of aerosol after the main blast of the eruption. Then, more volcanic aerosols entered the inner core of Cody, which invigorated the inner core convection (Figure 3C). With the enhancement of the inner convection, Cody appeared to separate the inner and outer rain bands, and the TC structure became more organized (Figure 3D), which indicated that Cody was intensified. Then, the intensity of convection in the inner core of Cody began to weaken, and the inner rain band expanded outward with the cessation of volcanic eruption (Figures 3E–I). Figure 4 shows the evolution of the convective activity in the inner core clearly. As Figure 4 shows, the mass of hydrometeor in Cody’s inner core increases rapidly after the main blast. The increase in cloud liquid water at the beginning corresponds to the increase in precipitation (Figure 5). However, with the increase in the aerosol concentration in the inner core, more small droplets are produced, which began to inhibit rain (Figure 5). Then, many droplets were transported to the upper layers to form ice crystals (corresponding to a smaller effective radius of cloud droplets as shown in Figure 2D). More latent heating releases and upward vertical velocity also increased in the aforementioned process, which means intense deep convection (Figure 4). Deep convection even attached to the top of the troposphere. The increase in cloud ice water coincided with the falling of the minimum sea-level pressure (MSLP), suggesting that the process of convection enhancement in the inner core corresponds to the intensification of Cody (Figures 4, 5). It is also consistent with that of previous studies which have confirmed that the deep convection in the inner core is conducive to the TC’s intensification (Shapiro and Willoughby, 1982; Rogers et al., 2013; Tang & Zhang, 2016; Tang et al., 2019; Wu and Ruan, 2021). Therefore, the intensity of Cody increased after the explosive deep convection in the inner core. But the TC did not intensify further, because of the end of the eruption and the unfavorable environment (Figures 6, 7). Meanwhile, the results of FNL show the same trend that the intensity and precipitation of Cody increased during the Tongan volcanic eruption (Supplementary Figure S2).
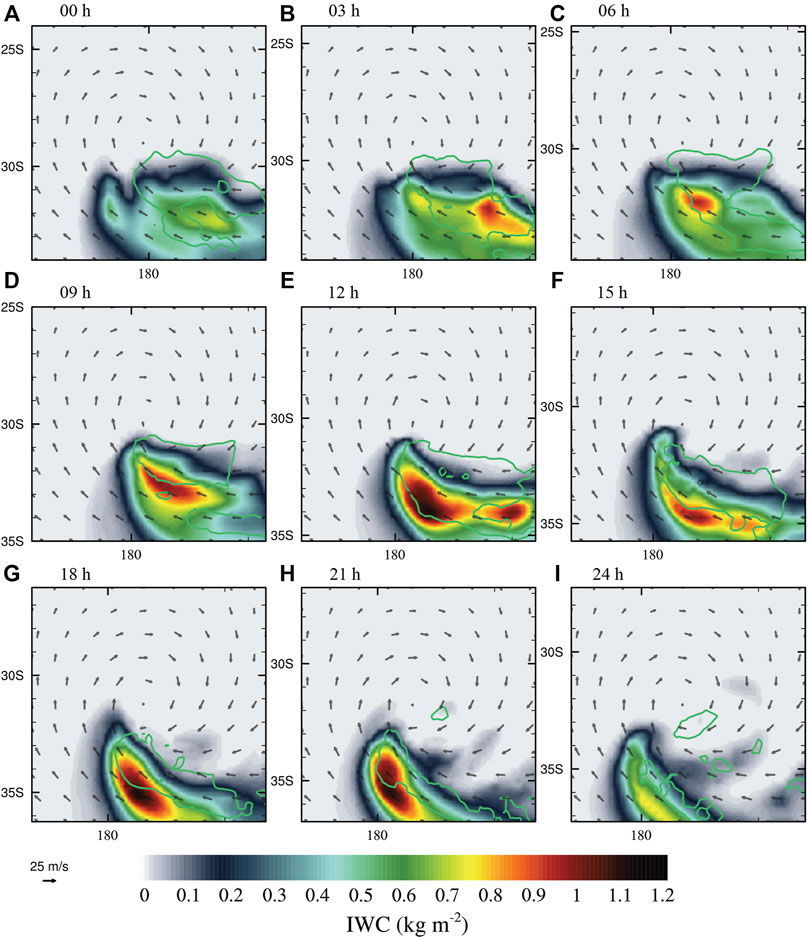
FIGURE 3. Total column liquid (green lines at 0.4
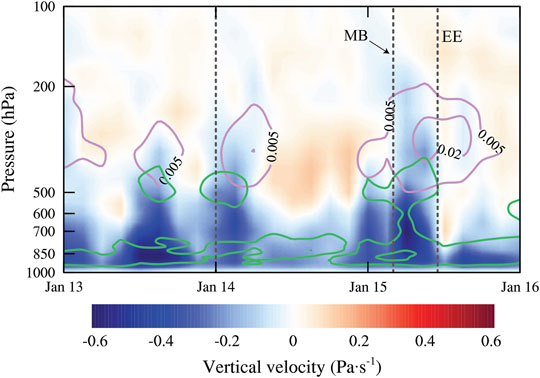
FIGURE 4. Time series of averaged vertical velocity (shading), cloud ice water content (purple contours at 0.005, 0.02
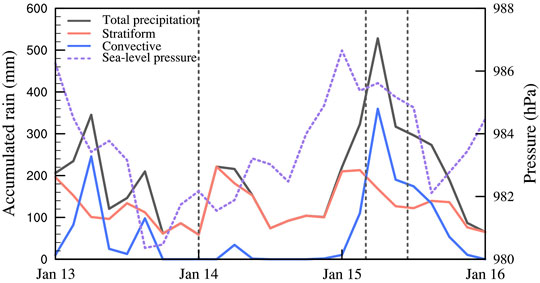
FIGURE 5. Time series of minimum sea-level pressure (purple dashed, hPa), total (black curve), convective (blue), and stratiform (red) precipitation within a radius of 150 km of Cody every 3 h from 0000 UTC January 13 to 0000 UTC January 16 The three dashed lines are the same as in Figure 4.
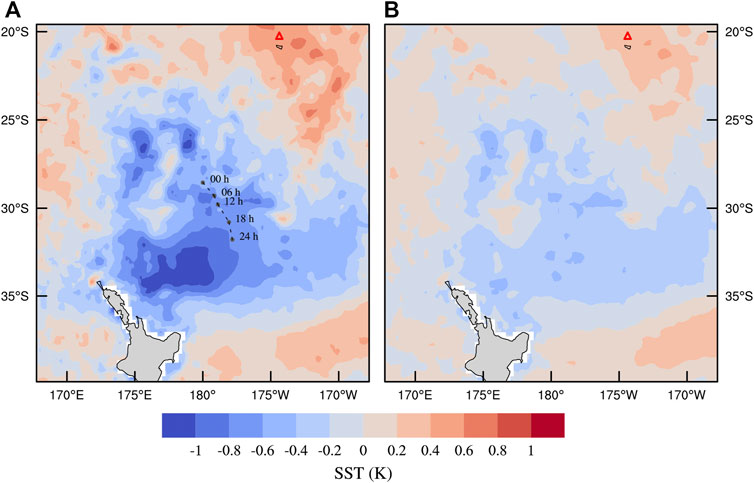
FIGURE 6. Difference of averaged sea surface temperature. (A): January 15 minus January 13, and (B) January 15 minus 3-day average of January 13 to January 15. Gray points denote the locations of Cody on January 15, with the UTC time at the right.
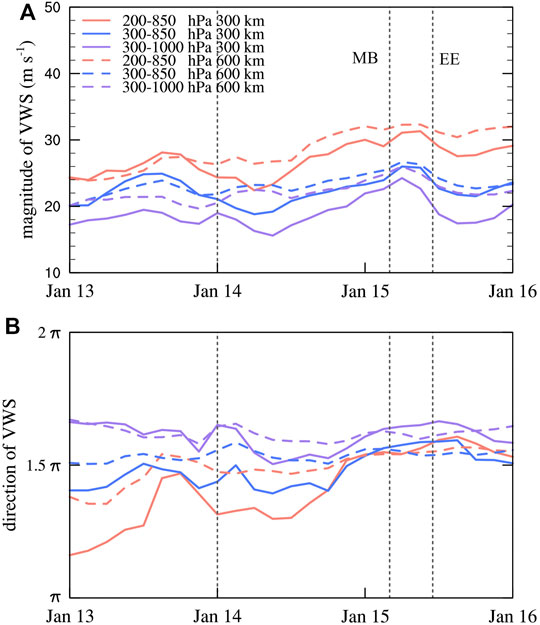
FIGURE 7. Time series of average deep layer vertical wind shear over a circular area within the radii of 300 and 600 km (dashed) every 3 h from 0000 UTC on January 13 to 0000 UTC on January 16. (A) Magnitude of vertical wind shear and (B) direction of vertical wind shear (π for south, 1.5π for west, 2π for north). The three dashed lines are the same as in Figure 4.
In addition to volcanic aerosol, the Tongan volcanic eruption also heated and evaporated a large area of sea surface water as the volcanic vent that erupted at Hunga Tonga–Hunga Ha’apai on January 15 was underwater about several tens to 250 m depth (Witze, 2022). Therefore, the low-level warm and humid air from the volcano flowing into Cody could also contribute to its intensification (Supplementary Figure S3).
Effects of Sea Surface Temperature and Deep Layer Vertical Wind Shear
The development of the TC is also often affected by large-scale environments, especially sea surface temperature (SST) and deep-layer vertical wind shear (VWS) (Wang et al., 2015; Emanuel, 2000; Holland, 1997). Therefore, it is necessary to analyze whether the implicit impacts of these factors on Cody’s intensification could be excluded. The change of the SST between January 15 and January 13 (Figure 6A) or the 3-day average (Figure 6B) shows that the SST could not contribute to the intensification of Cody on January 15 as the SST was cooled at the positions of Cody, which usually implied a weaker surface heat flux from the ocean to the TC. Wang et al. (2015) suggest that the weak deep-layer wind shear is beneficial for intensifying the TC. Their results also indicate that the shear between 300 and 1,000 hPa (
Conclusion and Discussion
In this study, we investigated the aerosol−cloud effects of the Tongan volcanic eruption on the development of the tropical cyclone Cody (2022) using the MODIS satellite observation and ERA5 reanalysis data. Although the model system of ERA5 doesn’t explicitly include the volcanic aerosol‐cloud interaction, it has assimilated lots of satellite observations of cloud and precipitation. Therefore, the effects of volcanic aerosol on Cody were already manifested in the reliable evolution of Cody’ convection and precipitation provided by ERA5 data to a large extent. The results show that the aerosols from the Tonga volcano eruption in the TC inner core significantly intensified the convection in the TC. This could be because a large amount of volcanic aerosol caused extra droplet condensation on small droplets and freezing of the supercooled water. It releases extra latent heat at the mid- to high-level troposphere, causing an increase in updraft velocities. The strong updrafts transferred more moisture to the upper atmosphere and inhibited the stratiform rain, thus intensifying the convection further. Finally, the enhancement of deep convection in the inner core increased convective precipitation and intensified the TC later.
Our results here are consistent with those of the simulation studies of Liang et al. (2021), which suggest that the aerosol−cloud effect could invigorate the convection in the inner core and intensify the TC. On the other hand, our results are not consistent with those of some other studies that the aerosol−cloud effect would weaken the TC as aerosol ingested by the TC circulation invigorates the convection at a TC’s periphery, limiting low-level inflow toward the eyewall and TC development (Khain et al., 2010; Rosenfeld et al., 2012; Lynn et al., 2016). A likely physical explanation is that the aerosol concentration in Cody was too high to deposit mostly by peripheral cloud activity, and a large amount of aerosol flowed into the inner core because the Tongan eruption expelled an estimated 400,000 tons of
The effect of volcanic aerosols from the Tongan eruption into Cody is similar to that of anthropogenic aerosols on landfalling TCs as the aerosol concentration on shores with large human activity is very high (e.g., East Asia and North America). Zhao et al. (2018) found the enlarging rainfall area of TCs over the western North Pacific by atmospheric aerosols. In addition, the simulation study of Jiang et al. (2016) suggested that the pollution increased the convective precipitation of landfalling TCs. In summary, our results provide evidence for the effects of volcanic aerosols on the evolution of a TC’s intensity and precipitation. These further imply that an accurate description of the interaction between aerosol and the TC might improve the forecast of TC precipitation and intensity change.
Data Availability Statement
MODIS data were downloaded at https://ladsweb.modaps.eosdis.nasa.gov/search/. ERA5 data were downloaded at https://cds.climate.copernicus.eu/cdsapp#!/dataset/reanalysis-era5-pressure-levels?tab=overview. FNL data were downloaded at http://rda.ucar.edu/datasets/ds083.2/.
Author Contributions
XT conceptualized this study. HL and XT contributed to the figures included in the manuscript. HL and XT wrote the manuscript. All authors contributed to the article and approved the submitted version of the manuscript.
Funding
This work was supported by the National Key R&D Program of China (Grant 2017YFC1501601), the National Natural Science Foundation of China (Grant 42192555 and 41675054), and the Fundamental Research Funds for the Central Universities (Grant XJ2021001601).
Conflict of Interest
The authors declare that the research was conducted in the absence of any commercial or financial relationships that could be construed as a potential conflict of interest.
Publisher’s Note
All claims expressed in this article are solely those of the authors and do not necessarily represent those of their affiliated organizations, or those of the publisher, the editors, and the reviewers. Any product that may be evaluated in this article, or claim that may be made by its manufacturer, is not guaranteed or endorsed by the publisher.
Acknowledgments
The authors thank Prof. Zhe-Min Tan for helpful discussions.
Supplementary Material
The Supplementary Material for this article can be found online at: https://www.frontiersin.org/articles/10.3389/feart.2022.904128/full#supplementary-material
References
Braun, S. A., Montgomery, M. T., Mallen, K. J., and Reasor, P. D. (2010). Simulation and Interpretation of the Genesis of Tropical Storm Gert (2005) as Part of the NASA Tropical Cloud Systems and Processes Experiment. J. Atmos. Sci. 67 (4), 999–1025. doi:10.1175/2009jas3140.1
Demaria, M. (1996). The Effect of Vertical Shear on Tropical Cyclone Intensity Change. J. Atmos. Sci. 53, 2076–2088. doi:10.1175/1520-0469(1996)053<2076:teovso>2.0.co;2
Emanuel, K. (2000). A Statistical Analysis of Tropical Cyclone Intensity. Mon. Wea. Rev. 128, 1139–1152. doi:10.1175/1520-0493(2000)128<1139:asaotc>2.0.co;2
Gassó, S. (2008). Satellite Observations of the Impact of Weak Volcanic Activity on Marine Clouds. J. Geophys. Res. 113 (D14), 14. doi:10.1029/2007jd009106
Guimond, S. R., Heymsfield, G. M., and Turk, F. J. (2010). Multiscale Observations of Hurricane Dennis (2005): The Effects of Hot Towers on Rapid Intensification. J. Atmos. Sci. 67 (3), 633–654. doi:10.1175/2009jas3119.1
Hersbach, H., Bell, B., Berrisford, P., Hirahara, S., Horányi, A., Muñoz‐Sabater, J., et al. (2020). The ERA5 Global Reanalysis. Q.J.R. Meteorol. Soc. 146 (730), 1999–2049. doi:10.1002/qj.3803
Holland, G. J. (1997). The Maximum Potential Intensity of Tropical Cyclones. J. Atmos. Sci. 54, 2519–2541. doi:10.1175/1520-0469(1997)054<2519:tmpiot>2.0.co;2
Jiang, B., Huang, B., Lin, W., and Xu, S. (2016). Investigation of the Effects of Anthropogenic Pollution on Typhoon Precipitation and Microphysical Processes Using WRF-Chem. J. Atmos. Sci. 73 (4), 1593–1610. doi:10.1175/jas-d-15-0202.1
Khain, A., Lynn, B., and Dudhia, J. (2010). Aerosol Effects on Intensity of Landfalling Hurricanes as Seen from Simulations with the WRF Model with Spectral Bin Microphysics. J. Atmos. Sci. 67 (2), 365–384. doi:10.1175/2009jas3210.1
Liang, Z., Ding, J., Fei, J., Cheng, X., and Huang, X. (20212009). Direct/indirect Effects of Aerosols and Their Separate Contributions to Typhoon Lupit (2009): Eyewall versus Peripheral rainbandsEyewall versus Peripheral Rainbands. Sci. China Earth Sci. 64, 2113–2128. doi:10.1007/s11430-020-9816-7
Lin, J., and Qian, T. (2019). Rapid Intensification of Tropical Cyclones Observed by AMSU Satellites. Geophys. Res. Lett. 46 (12), 7054–7062. doi:10.1029/2019gl083488
Lynn, B. H., Khain, A. P., Bao, J. W., Michelson, S. A., Yuan, T., Kelman, G., et al. (2016). The Sensitivity of Hurricane Irene to Aerosols and Ocean Coupling: Simulations with WRF Spectral Bin Microphysics. J. Atmos. Sci. 73 (2), 467–486. doi:10.1175/jas-d-14-0150.1
Malavelle, F. F., Haywood, J. M., Jones, A., Gettelman, A., Clarisse, L., Bauduin, S., et al. (2017). Strong Constraints on Aerosol-Cloud Interactions from Volcanic Eruptions. Nature 546 (7659), 485–491. doi:10.1038/nature22974
McCormick, M. P., Thomason, L. W., and Trepte, C. R. (1995). Atmospheric Effects of the Mt Pinatubo Eruption. Nature 373 (6513), 399–404. doi:10.1038/373399a0
Mote, P. W., and Frey, R. (2006). Variability of Clouds and Water Vapor in Low Latitudes: View from Moderate Resolution Imaging Spectroradiometer (MODIS). J. Geophys. Res. 111 (D16). doi:10.1029/2005jd006791
Platnick, S., King, M. D., Ackerman, S. A., Menzel, W. P., Baum, B. A., Riedi, J. C., et al. (2003). The MODIS Cloud Products: Algorithms and Examples from Terra. IEEE Trans. Geosci. Remote Sensing 41 (2), 459–473. doi:10.1109/tgrs.2002.808301
Remer, L. A., Kaufman, Y. J., Tanré, D., Mattoo, S., Chu, D. A., Martins, J. V., et al. (2005). The MODIS Aerosol Algorithm, Products, and Validation. J. Atmos. Sci. 62 (4), 947–973. doi:10.1175/jas3385.1
Reynolds, R. W., and Smith, T. M. (1994). Improved Global Sea Surface Temperature Analyses Using Optimum Interpolation. J. Clim. 7 (6), 929–948. doi:10.1175/1520-0442(1994)007<0929:igssta>2.0.co;2
Rodgers, E. B., Chang, S. W., Stout, J., Steranka, J., and Shi, J.-J. (1991). Satellite Observations of Variations in Tropical Cyclone Convection Caused by Upper-Tropospheric Troughs. J. Appl. Meteorol. 30 (8), 1163–1184. doi:10.1175/1520-0450(1991)030<1163:soovit>2.0.co;2
Rogers, R., Reasor, P., and Lorsolo, S. (2013). Airborne Doppler Observations of the Inner-Core Structural Differences between Intensifying and Steady-State Tropical Cyclones. Mon. Weather Rev. 141 (9), 2970–2991. doi:10.1175/mwr-d-12-00357.1
Rosenfeld, D., Lohmann, U., Raga, G. B., O'Dowd, C. D., Kulmala, M., Fuzzi, S., et al. (2008). Flood or Drought: How Do Aerosols Affect Precipitation? Science 321 (5894), 1309–1313. doi:10.1126/science.1160606
Rosenfeld, D., Woodley, W. L., Khain, A., Cotton, W. R., Carrió, G., Ginis, I., et al. (2012). Aerosol Effects on Microstructure and Intensity of Tropical Cyclones. Bull. Amer. Meteorol. Soc. 93 (7), 987–1001. doi:10.1175/bams-d-11-00147.1
Shapiro, L. J., and Willoughby, H. E. (1982). The Response of Balanced Hurricanes to Local Sources of Heat and Momentum. J. Atmos. Sci. 39 (2), 378–394. doi:10.1175/1520-0469(1982)039<0378:trobht>2.0.co;2
Tang, X., Tan, Z.-M., Fang, J., Munsell, E. B., and Zhang, F. (2019). Impact of the Diurnal Radiation Contrast on the Contraction of Radius of Maximum Wind during Intensification of Hurricane Edouard (2014). J. Atmos. Sci. 76 (2), 421–432. doi:10.1175/jas-d-18-0131.1
Tang, X., and Zhang, F. (2016). Impacts of the Diurnal Radiation Cycle on the Formation, Intensity, and Structure of Hurricane Edouard (2014). J. Atmos. Sci. 73 (7), 2871–2892. doi:10.1175/jas-d-15-0283.1
Tao, W.-K., Simpson, J., Sui, C. H., Ferrier, B., Lang, S., Scala, J., et al. (1993). Heating, Moisture, and Water Budgets of Tropical and Midlatitude Squall Lines: Comparisons and Sensitivity to Longwave Radiation. J. Atmos. Sci. 50 (5), 673–690. doi:10.1175/1520-0469(1993)050<0673:hmawbo>2.0.co;2
Wang, Y., Rao, Y., Tan, Z.-M., and Schönemann, D. (2015). A Statistical Analysis of the Effects of Vertical Wind Shear on Tropical Cyclone Intensity Change over the Western North Pacific. Mon. Weather Rev. 143 (9), 3434–3453. doi:10.1175/mwr-d-15-0049.1
Wang, Z., Montgomery, M. T., and Dunkerton, T. J. (2010). Genesis of Pre-Hurricane Felix (2007). Part II: Warm Core Formation, Precipitation Evolution, and Predictability. J. Atmos. Sci. 67 (6), 1730–1744. doi:10.1175/2010jas3435.1
Witze, A. (2022). Why the Tongan Eruption Will Go Down in the History of Volcanology. Nature 602 (7897), 376–378. doi:10.1038/d41586-022-00394-y
Wu, Q., and Ruan, Z. (2021). Rapid Contraction of the Radius of Maximum Tangential Wind and Rapid Intensification of a Tropical Cyclone. Geophys. Res. Atmos. 126 (3), e2020JD033681. doi:10.1029/2020JD033681
Yuan, T., Remer, L. A., and Yu, H. (2011). Microphysical, Macrophysical and Radiative Signatures of Volcanic Aerosols in Trade Wind Cumulus Observed by the A-Train. Atmos. Chem. Phys. 11 (14), 7119–7132. doi:10.5194/acp-11-7119-2011
Zhao, C., Lin, Y., Wu, F., Wang, Y., Li, Z., Rosenfeld, D., et al. (2018). Enlarging Rainfall Area of Tropical Cyclones by Atmospheric Aerosols. Geophys. Res. Lett. 45 (16), 8604–8611. doi:10.1029/2018gl079427
Keywords: Tongan volcanic eruption, tropical cyclone Cody, aerosol−cloud interaction, convection, MODIS observation
Citation: Liu H and Tang X (2022) Tongan Volcanic Eruption Intensifies Tropical Cyclone Cody (2022). Front. Earth Sci. 10:904128. doi: 10.3389/feart.2022.904128
Received: 25 March 2022; Accepted: 08 April 2022;
Published: 19 May 2022.
Edited by:
Yuqing Wang, University of Hawaii at Manoa, United StatesReviewed by:
Yanluan Lin, Tsinghua University, ChinaXuyang Ge, Nanjing University of Information Science and Technology, China
Copyright © 2022 Liu and Tang. This is an open-access article distributed under the terms of the Creative Commons Attribution License (CC BY). The use, distribution or reproduction in other forums is permitted, provided the original author(s) and the copyright owner(s) are credited and that the original publication in this journal is cited, in accordance with accepted academic practice. No use, distribution or reproduction is permitted which does not comply with these terms.
*Correspondence: Xiaodong Tang, eGR0YW5nQG5qdS5lZHUuY24=