 Wen Huo1,2,3
 Xiefei Zhi4
 Shunqi Hu5*
 Wenyue Cai6,7*
 Fan Yang1,3
 Chenglong Zhou1,8
 Ali MamtiMin1,2,9
 Qing He2
 Honglin Pan1,2,8
 Meiqi Song1,2,8
 Cong Wen1,3,9
 Yu Wang1,3,8
 Xinghua Yang1,3
 Lu Meng1,3
- 1Institute of Desert Meteorology, China Meteorological Administration, Urumqi, China
- 2National Observation and Research Station of Desert Meteorology, Taklimakan Desert of Xinjiang, Urumqi, China
- 3Xinjiang Key Laboratory of Desert Meteorology and Sandstorm, Urumqi, China
- 4Key Laboratory of Meteorological Disaster, Ministry of Education, Nanjing University of Information Science and Technology, Nanjing, China
- 5Linyi Meteorological Bureau Shandong, Linyi, China
- 6National Climate Center, China Meteorological Administration, Beijing, China
- 7State Key Laboratory of Severe Weather (LASW), Chinese Academy of Meteorological Sciences, Beijing, China
- 8Key Laboratory of Tree-Ring Physical and Chemical Research, China Meteorological Administration, Urumqi, China
- 9Taklimakan Desert Meteorology Field Experiment Station of China Meteorological Administration, Urumqi, China
As an important part of surface hydrothermal process, the study of evapotranspiration has been paid more attention, and it has an important reference value for the optimal allocation of regional water resources. It hinders the accurate assessment of evapotranspiration in arid zones and its response to climate change because human activities have changed the original underlying surface of deserts and increased the complexity of calculations. In this study, the encrypted observations of natural sand land (hereinafter referred to as NSL) and constructed green land (hereinafter referred to as CGL) in the heartland of the Taklimakan Desert were analyzed by the Penman-Monteith-H (PM-H) numerical model to accurately assess the applicability of the evapotranspiration calculation method to different underlying surfaces, analyze the associated errors, and quantify the effects and contributions of the main impacting meteorological factors on the evapotranspiration calculation. Our study finds that the PM-H algorithm exhibits good applicability in Tarim Basin, where the vegetation growth period significantly affects evapotranspiration. The evapotranspiration calculation is positively affected by the difference between saturated and actual vapor pressures and the 2-m mean wind speed and negatively affected by the 2-m mean temperature and gradient of saturated water pressure. Based on high-resolution grid data, the applicability of the PM-H algorithm has been improved, and our calculations show that the mean annual potential evapotranspiration in the Tarim Basin is 2,750 mm.
Introduction
The Taklimakan Desert is the second largest mobile desert on earth and the largest desert in China, a representative of global arid areas. The Taklimakan desert is extremely dry, with very low annual precipitation (26.0 mm per year) (Zhou et al., 2017a). It is also one of the area most seriously affected by wind-sand disaster in China, directly limiting regional production, life, and economic development. In recent years, the Chinese government has been committed to the construction of artificial greenbelts to prevent and manage sand with the goal of improving the environment of the Taklimakan Desert and its surroundings. Since 2005, to ease the contradiction between resources and the environment, a functional constructed green land has gradually been built at the oil base in the heartland of the Taklimakan Desert for external sand protection and internal production and living needs. Meanwhile, changes in the uniform quicksand surface have also caused variations in the land-air exchange, resulting in influences on desert ecological circulation (Li et al., 2005; Zhang et al., 2011). However, how the construction of green land affects the land-air exchange of the original surface covered by quicksand remains ambiguous and will be the focus of this study.
As an important process during land-atmosphere interaction, evapotranspiration is closely related to surface heat and water balance, and in turn, studies on evapotranspiration can further improve our understanding of climate change and water cycle variation patterns (Shen and Sheng, 2008; Kidron, 2009; Fan and Thomas, 2013; Wagle et al., 2017). Despite its scarce precipitation, desert is worth our attention given its strong evaporation capability. Zhang et al. (1995) found that river segments across deserts in northwest China experience strong evaporation, and thereby to be dried. Houston (2006) pointed out that the Atacama desert is a typical potential evaporation area due to its bare surface, which is more obvious after the regional extreme precipitation. Potential evaporation is mainly related to precipitation, temperature, wind speed, altitude, the density of the evaporated liquid, and groundwater level (Houston, 2006; Hu et al., 2008; Liu and Feng, 2012; Olchev et al., 2013; Attarod et al., 2015; Gao et al., 2015; Ma and Wang, 2016). In the past few years, many models based on remotely sensed data have been developed for regional evapotranspiration estimation. Collaborative inversion of surface parameters based on multi-source remote sensing data, improvement of evapotranspiration models and multi-model integration, surface processes and data assimilation, spatial reproducibility of observed latent fluxes, and scaling issues in evapotranspiration estimation and validation all need further research in the future. (Li et al., 2011; Zhang et al., 2012). In China, the effects of meteorological factors on potential evapotranspiration are as follows: water vapor pressure > maximum temperature > solar radiation > wind speed > minimum temperature; and there is a linear correlation between each meteorological factors and altitude (Liu and Zhang, 2011). The decrease in potential evapotranspiration is most pronounced in the Tarim River basin oasis after the detrending of wind speed. Changes in potential evapotranspiration from oases are significantly influenced by anthropogenic regional changes (Han et al., 2009). However, the two studies mentioned above exclude desert regions.
Given the many influencing factors, large uncertainties are involved in estimating the potential evaporation (Liu and Feng, 2012; Badgley et al., 2015; Gao et al., 2017). The standardized precipitation evapotranspiration index (SPEI) is computed and compared in China using reference evapotranspiration calculated using the Thornthwaite (TH) approach and the Penman–Monteith (PM) equation. The analysis reveals that SPEI_PM outperforms the SPEI_TH with regard to drought monitoring during the period 1961–2012 over China, especially in arid regions of China (Chen and Sun, 2015). Menenti (1984) proposed a theory of evaporation in terms of multidimensional geometry and demonstrated how to derive approximate formulae to calculate actual evaporation by making use of satellite data only. This working hypothesis does not hold for regions with large desert area. Hence, it is necessary to conduct scientific experiments and keep focusing on evapotranspiration problems in deserts, especially by improving the accuracy and applicability of algorithms.
Observational site, instruments, data collection, and estimation method
Site and instruments
The research area is located in the center of the Taklimakan Desert (Figure 1) and is 220 km from the edge of the desert. Within the research area, the ground surface is covered by quicksand so that the vegetation cover is extremely low with low species richness. According to multiyear observations compiled by the Tazhong weather station, the mean annual evapotranspiration reaches 3,800 mm in the research area (Zhou et al., 2017a). Strong winds and sandstorms are the main characteristics of weather: The mean annual number of sandstorm days is 16 days (Zhou et al., 2017b), and the mean annual sand index is 235 (Yuan et al., 2016).
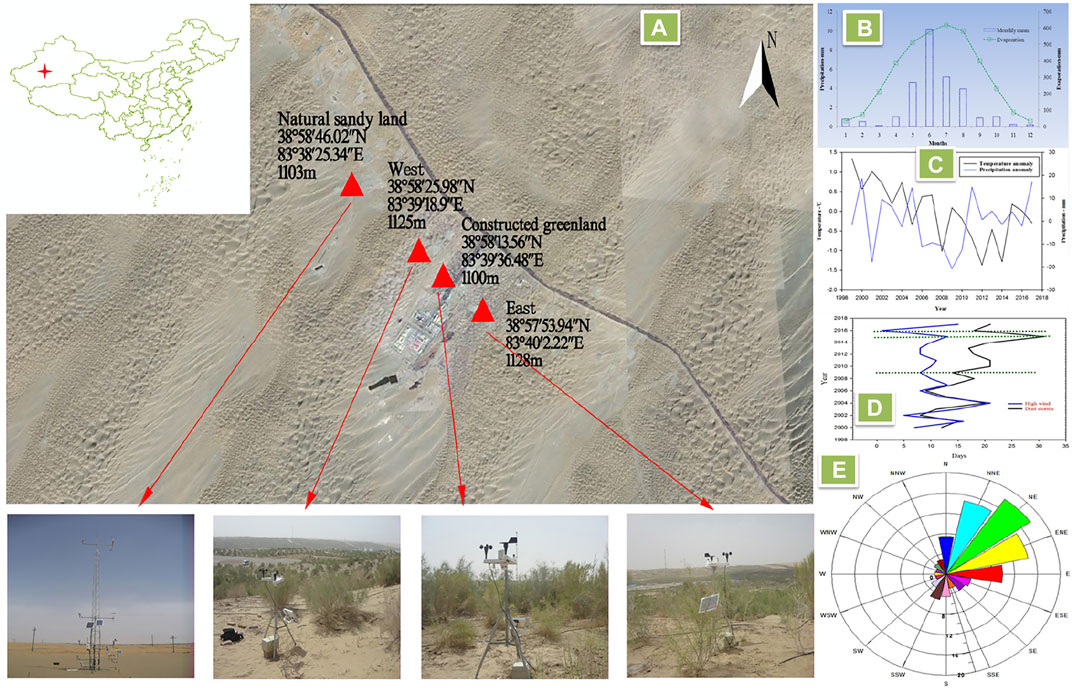
FIGURE 1. Research area overview and arrangement of the experiment sites (A) Distribution of the four stations, (B) mean annual precipitation and monthly variations in evaporation at the Tazhong weather station, (C) annual precipitation and temperature anomalies during 1998–2018 at Tazhong, (D) annual variations in strong sandstorm days at Tazhong, and (E) direction frequency of strong wind for multiple years).
Considering the unique landform and climate characteristics of the Taklimakan Desert, observational studies need to be conducted in experimental areas that include CGL and desert to test whether the PM-H calculation model is suitable for desert areas after artificial greening. Thus, the Urumqi Desert Meteorology Research Institute of the China Meteorological Administration chose typical NSL and CGL within the research area in 2014–2015 and designed and conducted simultaneous intensified observational experiments (Figure 1). The information of experimental sites is given as follows. The Taklimakan Desert west station (hereafter NSL-west) (38°58′46.02″N, 83°38′25.34″E) has an altitude of 1,103 m, a smooth topography, a quicksand-dominated underlying surface, and no vegetation coverage. The CGL experiment region includes three sites that lie across the CGL protective belt, and the differences in linear distance and altitude between the three sites are 1 km and approximately 25 m, respectively. The underlying surface of the green belt west edge station (hereafter CGL-west) (38°58′25.98″N, 83°39′18.9″E, altitude: 1,125 m) is scarcely covered by shrubs, such as Tamarix chinensis and Alhagi maurorum. Located in the center of the greenbelt is the CGL botanic garden station (hereafter CGL-middle) (38°58′13.56″N, 83°39′36.48″E, altitude: 1,100 m), which is 1.5 km from the NSL (west). CGL-middle has smooth topography. The underlying surface of CGL-middle is covered by psammophytes such as Tamarix chinensis, Calligonum mongolicum, and Haloxylon ammodendron. The underlying surface of the greenbelt east edge station (hereafter CGL-east) (38°57′53.94″N, 83°40′2.22″E, altitude: 1,128 m) is covered by a small quantity of shrubs, such as Tamarix chinensis, Alhagi maurorum, and Haloxylon ammodendron. Observation items at the four stations are listed in Table 1 in detail.
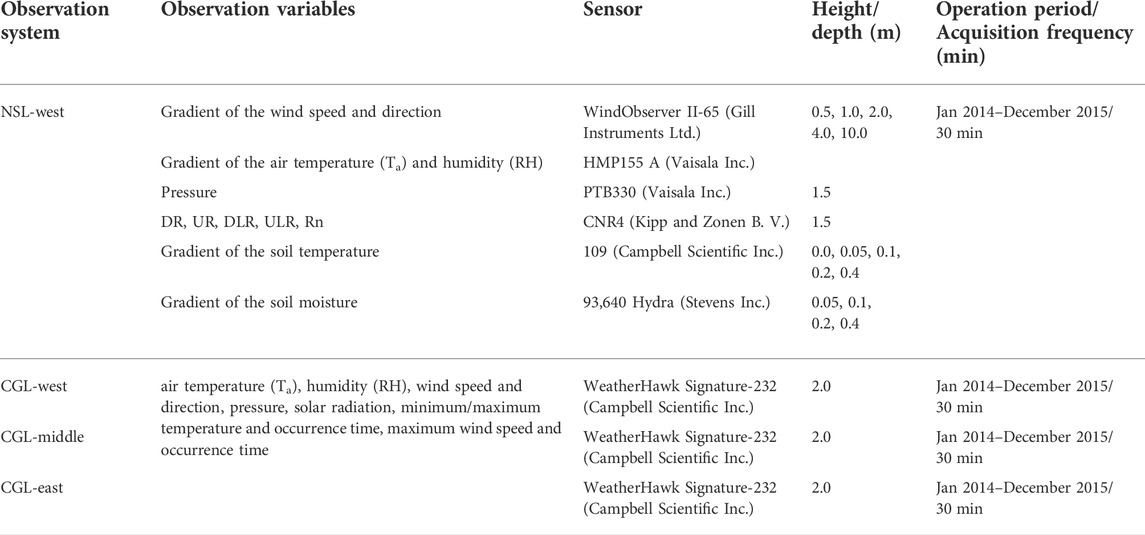
TABLE 1. Introduction to observation systems (NSL-West, CGL-West, CGL-Middle, CGL-East).
During the early experiment period, we conducted 48-h parallel comparison observations at automated observation stations within the CGL at a sampling frequency of 1 min. The goal was mainly to control the quality of observations, record the working status and voltage parameter of data acquisition units, assess data continuity and truthfulness, and control data quality by eliminating outliers based on climate extremes.
Data collection and estimation method
The evapotranspiration calculated in this manuscript is potential evapotranspiration.
a) The 2015 hourly encrypted observations obtained by the green land and NSL observational system were adopted for calculating evapotranspiration according to the PM-H evolutionary algorithm (Huo et al., 2019). Based on the PM model, the PM-H algorithm uses observations for different underlying surfaces to replace empirical values in the model to reduce calculation errors. Among them, the calculation of potential evapotranspiration of NSL is based on the observation elements of NSL in Table 1, and the calculation of potential evapotranspiration of CGL is based on the observation elements of CGL in Table 1.
b) We also used the evaporating dish data collected by the National Tazhong Meteorological Station as the standard evapotranspiration values, assessed the accuracy and applicability of our calculated evapotranspiration value in comparison to the corresponding observational value, and analyzed the associated errors and the causes. We conducted sensitivity studies on assigned values for the main impacting meteorological factors as follows. First, based on the calculation process, we chose the main impacting factors; second, we defined four main impacting factors as univariates, while keeping the other main impacting factors invariable, and calculated the percentage of hourly evapotranspiration difference (hereafter abbreviated as PED) and the cumulative annual evapotranspiration difference (hourly difference × 8,760 h, hereafter abbreviated as CED) between stations within the NSL and CGL, based on which we analyzed the positive and negative effects of the main impacting factors on evapotranspiration. The assignment interval for each of the variables refers to the variation range of observations, and linear growth was adopted as the assignment method.
c) We extracted the basic data, such as occurrence times of different weather conditions, from the 2015 monthly observation report from the National Tazhong Meteorological Station and analyzed the contributions of different weather conditions to evapotranspiration. Seven types of weather conditions were identified: floating dust, blowing dust, sandstorm, fog, snow, sleet, and shower. Sunny days were excluded, which is convenient for the comparative analysis of potential evapotranspiration under other weather conditions. The contribution rate of a weather condition to evapotranspiration refers to the percentage of evapotranspiration during the weather condition to the total daily evapotranspiration.
d) We adopted the hourly data for 2-m dewpoint temperature, 2-m temperature, 10-m wind speed, surface net solar radiation and near-infrared albedo for direct radiation in the 2015 ERA5 reanalyzed data (0.25° × 0.25°) and calculated the mean potential evapotranspiration in the Taklimakan Desert. First, we determined whether a grid point belonged to desert or oasis according to the albedo values for desert (0.23–0.26), oasis (0.2), and Gobi (0.27) (Yalkun et al., 2019; Zhang et al., 2019; Yalkun, 2020). Secondly, we used PM-H evolutionary algorithm for different surfaces to calculate the evaporation values for the grid points. Thirdly, the annual values of each grid point in the study area are calculated according to different algorithms and the cumulative amounts are calculated to obtain the calculated values of annual evapotranspiration.
Furthermore, because of the adverse observation environment, fracture of artificial drip irrigation pipes led to damage to the power supply equipment for the observational system, resulting in considerable missing data in 2014. Thus, we focused mainly on 2015 in this study.
Results
Comparison and assessment of observed and calculated evapotranspiration values
The linear regression between the calculated and observed evapotranspiration values for NSL is characterized by R2 = 0.952 and p < 0.001; the linear regressions for CGL (middle), CGL (east), and CGL (west) exhibit (R2 = 0.933, p < 0.01) (R2 = 0.943, p < 0.01), and (R2 = 0.942, p < 0.01), respectively, as shown in Figure 2. Figure 3 illustrates that the PM-H algorithm has high applicability and high reliability for desert regions. The calculation results for different underlying surfaces vary considerably, and the calculated values for NSL are closer to the observed values than those for CGL. Thus, given the observed values, our calculated values for NSL more accurately describe the variation trend than those for CGL. Our highly correlated results also further demonstrate its applicability in desert areas.
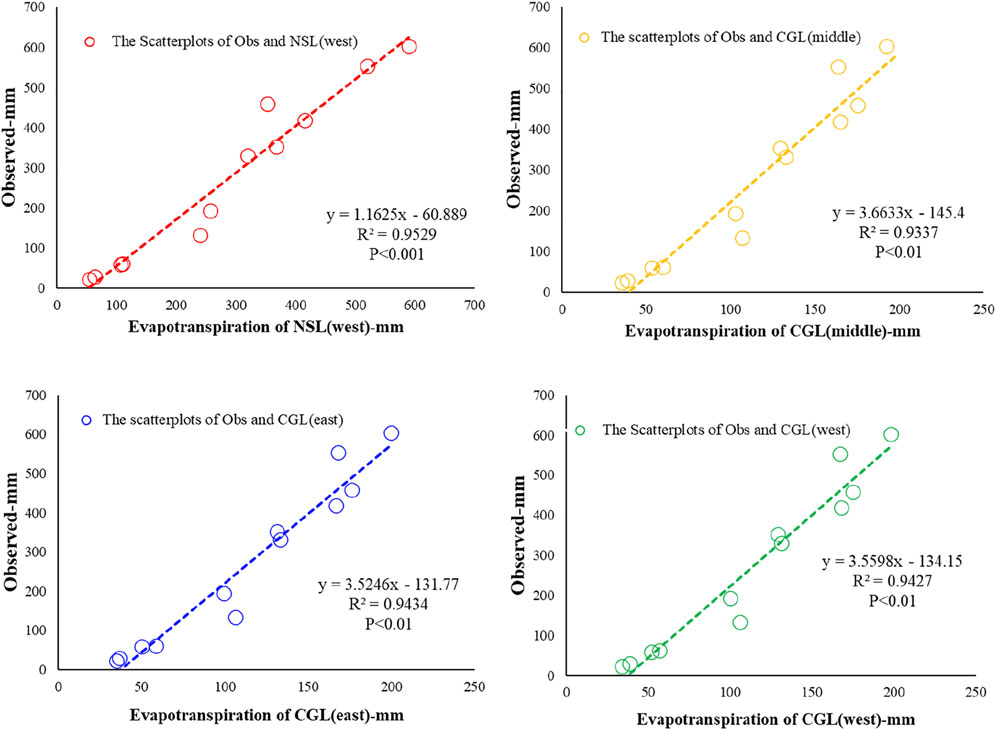
FIGURE 2. Scatter plots of correlation (2015) of the calculated evapotranspiration value and the observed evaporation value at the Tazhong weather station [in the order of NSL (west), CGL (middle), CGL (east), CGL (west).
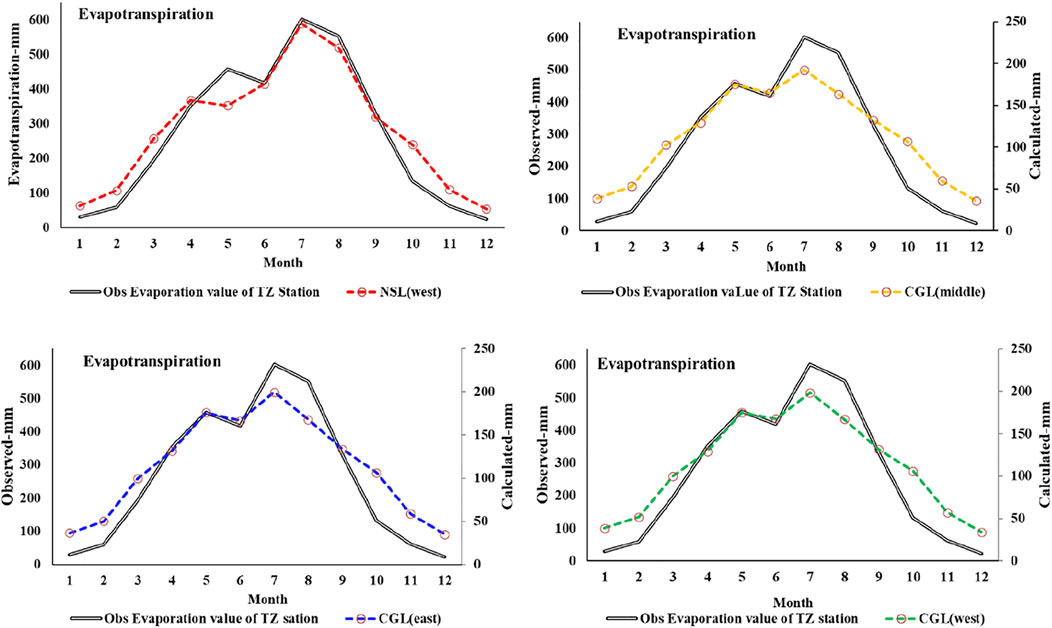
FIGURE 3. Intra-annual variation (2015) of the calculated evapotranspiration value and observed evaporation value from the Tazhong weather station [in the order of NSL (west), CGL (middle), CGL (east), CGL (west).
In Figure 3, the calculated values for NSL are slightly higher than the observed values only in cold seasons (January–April and October–December) and that the observed and calculated monthly mean evapotranspiration values for NSL are 268.26 and 283.14 mm, respectively, which differ by approximately 15 mm. The calculated evapotranspiration values generally agree for the three observation sites within the CGL, and the calculated monthly mean evapotranspiration values for CGL (middle), CGL (east), and CGL (west) are 112.92-mm, 113.49 mm, and 113.04 mm, respectively, with errors of less than 2 mm. In addition to the systematic error of the observational equipment, errors might come from the differences in observation location, altitude, and dune topography. Our results demonstrate that when the underlying surface and vegetation property remain the same, the PM-H algorithm can yield highly consistent results.
The differences between calculated and observed values are larger for CGL than for NSL in cold seasons (January–March and October–December) and the growing season (April–September) and are further enlarged during the vegetation growing season (Figure 4), as the monthly differences all lie above 150 mm throughout the growing season and are the largest in July and August, the time with the most flourishing vegetation, in which the maximum difference reaches 400 mm in July. During cold seasons, the monthly differences are relatively small, no higher than 50 mm. This attribute may be related to the vegetation growing period (April–September) and dormant period (January–March and October–December) at the observation sites, thus suggesting that the vegetation growing period substantially affects evapotranspiration. When functional green land is shaped by human activities and the original quicksand surface is changed, variations occur in the original land–air energy pattern and changes in the factors (including temperature, wind speed, humidity, and soil moisture within the region) that affect the calculation of evapotranspiration, thus resulting in differences between functional green land and NSL (Huo, 2020). When humans plant vegetation in the desert and formed green areas, they change the original desert underlying surface, leading to a change in the pattern of ground-air exchange and affecting the evapotranspiration. Furthermore, because the current meteorological observation standard requires the use of different evaporating dishes for ice and no-ice periods, and the observed results need to be corrected according to the empirical correction coefficient (Xie et al., 2014), the correction process unavoidably causes certain errors, i.e., systematic errors.
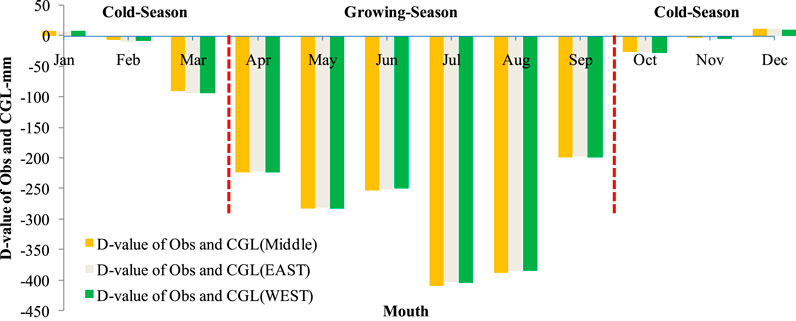
FIGURE 4. Difference between observations and results calculated from CGL (middle, east, west).
Assessment of the main impacting factors
It is worth further discussing which main impacting factors significantly affect the calculation of evapotranspiration in the PM-H algorithm. During our early calculation, we found that among the main variables in the PM-H model, except for net radiation, the difference between saturated and actual vapor pressures, the 2-m mean temperature, the 2-m mean wind speed, and the saturated vapor pressure gradient are main impacting factors that affect the calculation result. In the context of NSL and CGL, the mean values in the four factors (8,760 times within a year) are significantly different between different underlying surfaces, as illustrated in Table 2.
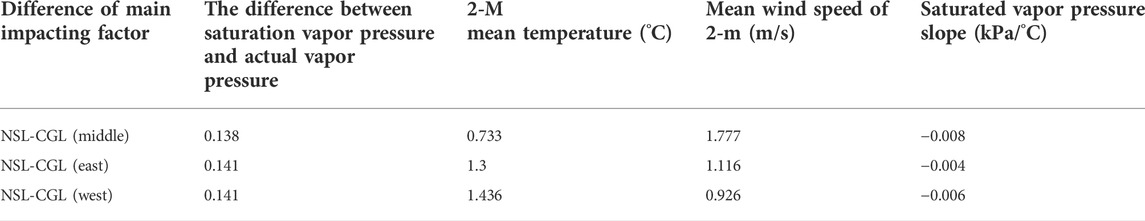
TABLE 2. Difference in main impacting factors between CGL and NSL (mean values of 8,760 times within a year).
To further quantify the effects of four main impacting factors on the calculation of evapotranspiration, we conducted an assignment sensitivity study. Table 3 reveals that with increasing difference between saturated and actual vapor pressures, PED and CED increase. Specifically, when the assignment value is increased by 0.02 (kPa), PED is increased by 4–6%, and CED is increased by approximately 240 mm. According to the PAO56-PM calculation model, we conclude that 1) the 2-m mean temperature negatively affects the calculation result, 2) with a 0.5°C increase in the variation factor, PED stabilizes at 62–63% but weakly declines, and 3) the CED value fluctuates around 2,300 mm with an approximately 4–5 mm rate of decrease. In addition, when the 2-m mean wind speed increases at an assignment value of 0.5 (m/s), PED and CED show substantial linear increases at continuously decreasing rates. Few studies have focused on the saturated vapor pressure gradient. The saturated vapor pressure gradient
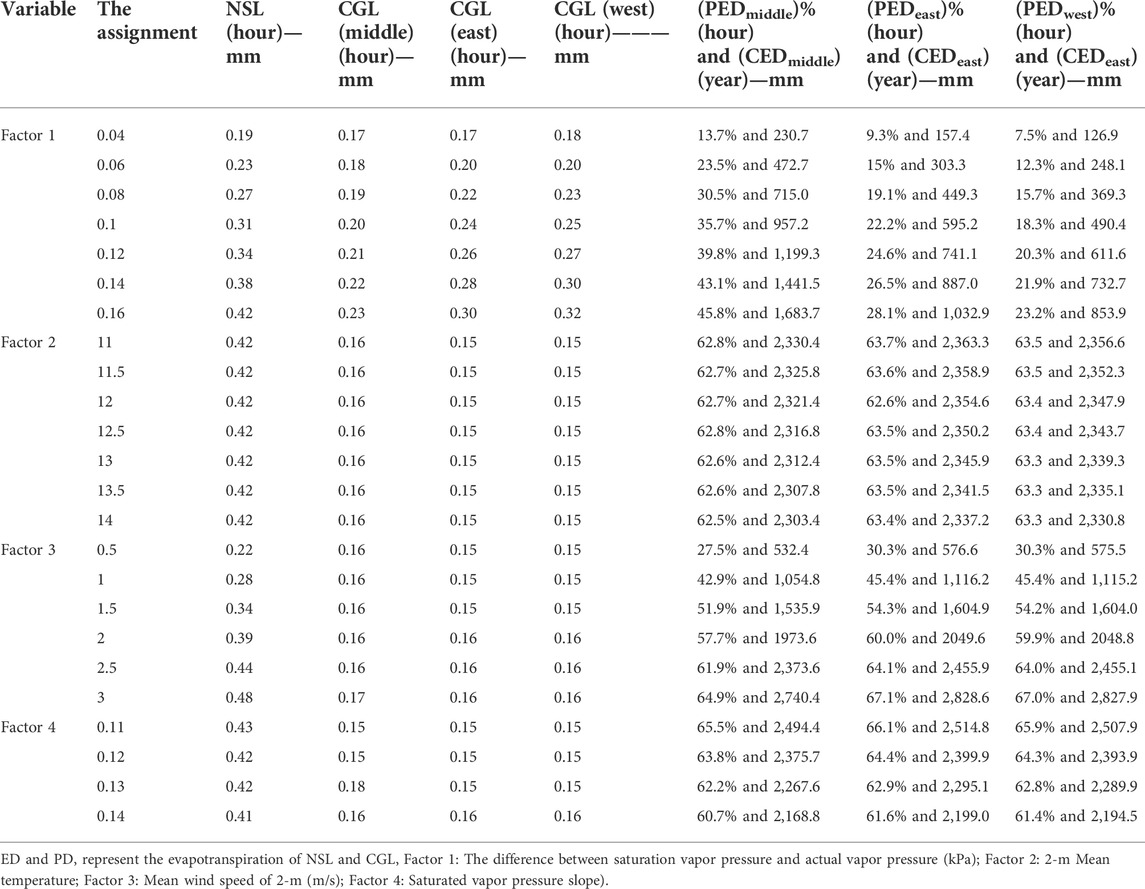
TABLE 3. Per hour PED and CED of evapotranspiration under the different underlying surfaces based on the assignment calculation of various impacting factors between CGL and NSL.
According to Table 3 and the analyses above, the calculated evapotranspiration for CGL is smaller than those for NSL and the corresponding observed value because of the significant influence of vegetation growth on evapotranspiration. The construction of CGL induces a change in the key factor for the calculation of evapotranspiration, resulting in decreases in the difference between saturated and actual vapor pressures, mean temperature, and mean wind speed and an increase in the saturated vapor pressure gradient
Contribution rates of weather conditions to evapotranspiration
Meteorological factors show different patterns of variation with weather conditions, and meteorological factors are determinants of potential evapotranspiration, therefore the contribution rates of different weather conditions to evapotranspiration need to be assessed. Figure 5 reveals that among the seven weather conditions, floating dust and blowing sand contribute the largest proportions to evapotranspiration, reaching 60 and 35%, respectively.
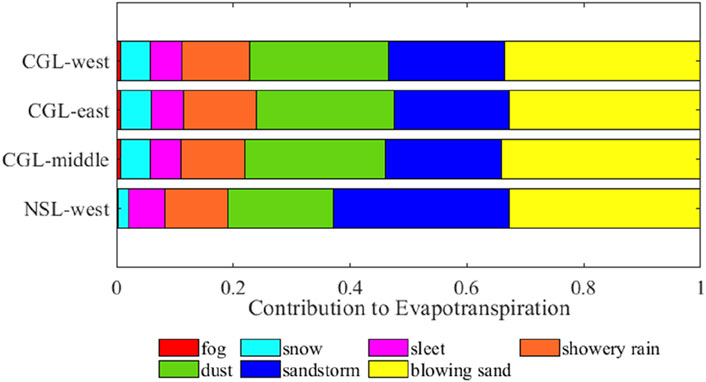
FIGURE 5. Contribution rates of different weather conditions to evapotranspiration.
Floating dust, sand and dust storms have the highest contribution to evapotranspiration among the seven weather conditions, with interannual contributions of 60 and 35% for floating dust and sand percentages, respectively (Figure 5).
This finding may be due to that floating dust and blowing sand are two dominant weather types, thus objectively reflecting the unique regional climate characteristics of the Taklimakan Desert with frequent sand and dust weather (Huo, 2011). Because other weather conditions are rare, their contribution rates to evapotranspiration are relatively small. In the following discussion, we will analyze the mean seasonal and hourly contribution rates of these different weather conditions to evapotranspiration to further our understanding. From the aspect of the season (Figure 6), the contribution rate of floating dust weather to evapotranspiration was highest in all four seasons. The contribution rates of blowing sand and sandstorm to evapotranspiration are significantly higher in spring and summer than in autumn and winter because spring and summer are the seasons during which the floating dust weather dominantly occurs in the Taklimakan Desert (Zhou et al., 2017b). Increased wind speed in the afternoon and the development of boundary layers are favorable conditions for desert evaporation (Felipe et al., 2021). The periodic precipitation occurs more frequently in summer, so the contribution rate of shower to evapotranspiration is higher in summer than in other seasons. Snow occurs more frequently in winter, so the contribution rate of snow to evapotranspiration is higher in winter than in the other seasons.
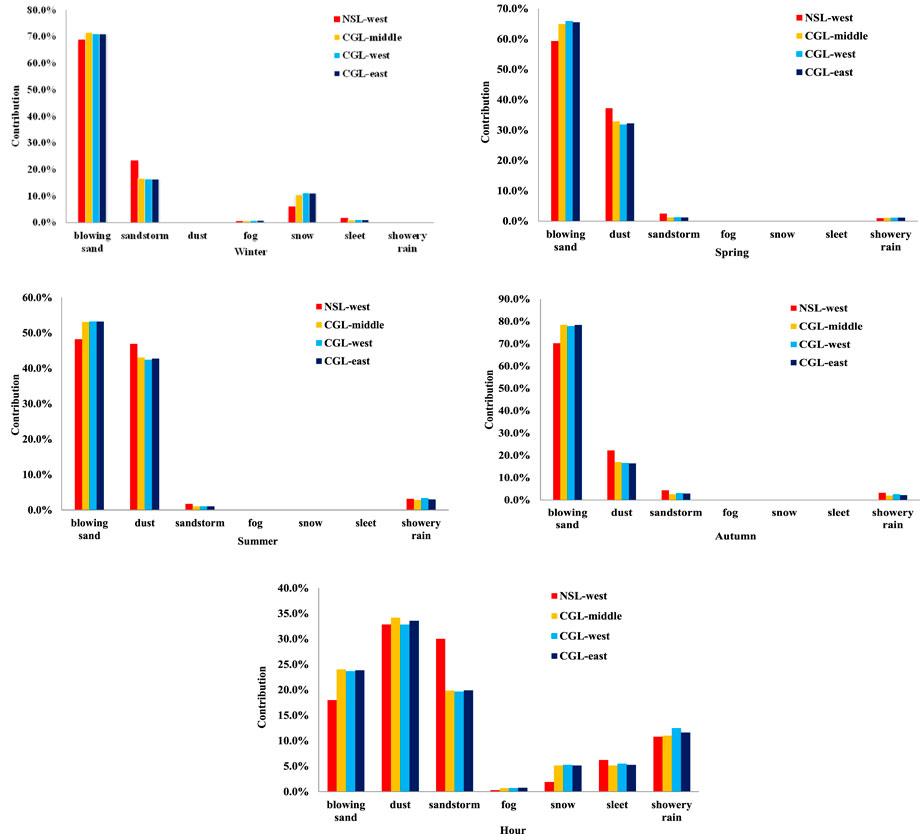
FIGURE 6. Seasonal and hourly contribution rates of different weather conditions to evapotranspiration.
From the aspect of the hourly contribution rate, wind speeds are higher during blowing sand and sandstorm than during floating dust, so the hourly contribution rates of blowing sand and sandstorm to evapotranspiration were significantly higher than that of floating dust. Notably, the contribution rate of sandstorm to evapotranspiration is 10% higher in NSL than in CGL, possibly because of the suppressing effect of vegetation on wind speed. Huo (2020) noted that the desert–green land boundary can reduce the near-surface wind speed by 30%, while the center of the green land can reduce the near-surface wind speed by 70%. Weather conditions such as precipitation, snow, and sleet can increase humidity, which can assist evaporation and lower the temperature. The analysis in Section 3.2 shows that the above weather phenomena lead to an increase in the contribution of evapotranspiration due to temperature decrease processes.
Therefore, different weather types affect evapotranspiration in two ways: first, on a time scale, weather types with high frequencies throughout the year have a high contribution to evapotranspiration, and weather types with low frequencies have a low contribution to evapotranspiration. Secondly, different weather types affect meteorological factors such as wind speed, temperature and humidity due to their different weather conditions, and they are the intrinsic determinants that affect evapotranspiration.
Discussion
According to the calculation of ERA5 high-resolution reanalysis grid data, the average potential evaporation in 2015 for the Tarim Basin is 2750 mm (Figure 7). Based on the FAO PM model, the analysis of Zhang et al. (2009) indicated mean annual potential evapotranspiration of 523–1,528 mm in the Tianshan mountainous area. Xie and Wang (2007) adopted the PM equation and conventional meteorological data to calculate the potential evapotranspiration variations in North China and found that the potential evapotranspiration is 2,200–2,800 mm in the western region. Wang et al. (2013) calculated the average annual evapotranspiration of the Taklamakan Desert as 1,339.29–3,800 mm by PM model. Some scholars estimated the annual evapotranspiration potential of the Tarim River basin in the Tarim Basin as 2,778 mm by using remote sensing data and SEBAL model (Li et al., 2011). Jia et al. (2022) indicated that the annual evapotranspiration of Kubuqi Desert is 2,161.4 mm.
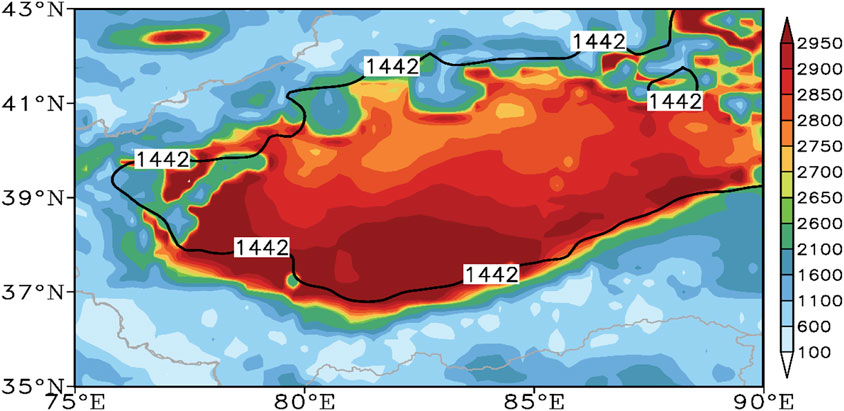
FIGURE 7. Spatial distribution of evapotranspiration in the Tarim Basin based on ERA-5 fine grid data (the black line denotes the boundary of the Tarim basin).
Thus, compared with the -findings of other scholars, we can see that based on high-resolution reanalyzed data and the PM-H algorithm, our calculated mean potential evapotranspiration for the Tarim Basin lies within a reasonable numerical range, which further demonstrates that the PM-H algorithm can be applied to calculate surface evapotranspiration. The PM-H algorithm can quite accurately assess the evapotranspiration values in the arid area with a patchy distribution of green land and desert, which indicates the global applicability of the algorithm and provides a scientific basis for research on the sustainable development and ecological environment of arid regions.
The reasons for the influence of different weather types on evapotranspiration are very complex, and there are also subtle differences in different subsurface conditions. Different meteorological conditions affect the trends of meteorological factors and also influence the potential evapotranspiration. For example, in our study area, dusty weather including (sandstorm, blowing sand) is a weather phenomenon that occurs with high frequency, accompanied by dynamical causes, and an increase in near-surface wind speed triggers an increase in the calculated value of evapotranspiration. In fog, snow, sleet, and showery rain weather conditions, the increase in moisture conditions leads to a decrease in the difference between saturated and actual vapor pressures, which affects the decrease in the calculated value of evapotranspiration. In addition, it is worth noting that precipitation has a heat-absorbing and cooling effect, which also affects evapotranspiration. When several dominant factors change simultaneously, the magnitude of the effect of that dominant factor on evapotranspiration is decisive.
Potential evapotranspiration values of CGL and NSL calculated based on PM-H algorithm (Huo et al., 2019), compared with the actual observed value of the evaporating dish, the annual variation trend of the potential evapotranspiration value of NSL is basically consistent with the observed value, and the calculated magnitude is consistent, It highlights the applicability of the evapotranspiration model in the estimation of drought conditions, and better proves that the refined observation data can improve the calculation accuracy of the model, such as net radiation, wind speed, applicable dry and wet surface constants, the difference between saturated water vapor pressure and actual water vapor pressure, etc. There is a large difference between the potential evapotranspiration of artificial green space and the observation of evaporating dishes in the growing season. The main reasons are: the vegetation on the underlying surface affects the regional microclimate, changes the energy distribution pattern of the underlying surface, and there are great differences between the observed temperature, wind speed, relative humidity and other major meteorological elements and the natural sand.
In the context of this regional microclimate, the impact assessment of key meteorological factors on potential evapotranspiration is particularly important. This is a typical model of seeing the big from the small. Functional artificial green space has widely appeared in the desert to meet the needs of human production and life, forming a patchy spatial pattern. The human settlement environment in Tarim Basin and its surrounding areas is also this oasis desert model. Using natural test sites and data, we can accurately quantify the positive and negative feedback of key meteorological factors on the calculated value of potential evapotranspiration. It is also conducive to an in-depth understanding of the laws of regional climate change and water cycle change (Shen and Sheng, 2008). It is the basis for studying the interaction law between climate, hydrological cycle and human activities in the Tarim Basin and its surrounding areas, and can provide scientific basis for correctly formulating the development strategy of the Tarim Basin and protecting the regional ecological environment.
Limited by water conditions, the actual evapotranspiration of Taklimakan desert is very small, but the transpiration capacity is very strong (Li et al., 2011), which poses a challenge to the sustainable development of ecology. A refined assessment of the potential evapotranspiration of Tarim basin can provide a scientific reference for the rational allocation of limited water resources in Oasis ecosystem, which is the premise of ecological sustainable development.
Conclusion
Based on refined observations for different underlying surfaces, we conducted a refined assessment of the evapotranspiration in NSL and CGL and reached the following conclusions.
When human activities change the original, uniform underlying surface in some desert areas, the calculation of evapotranspiration becomes more complicated, but the PM-H algorithm can quite accurately assess evapotranspiration within desert and oasis regions. The difference between calculated and observed evapotranspiration values for CGL is smaller in cold seasons but higher in warm seasons (growing seasons). In contrast, the difference between the calculated and observed values for NSL is smaller in warm seasons but larger in cold seasons. The calculated and observed evapotranspiration values for the three observation sites within CGL are generally consistent in 2015, lying within 1,355–1,360 mm, while the calculated evapotranspiration for NSL is 3,398 mm. The vegetation growth period significantly affects evapotranspiration. This finding is also confirmed by the study of Xie et al. (2020), who noted that evapotranspiration is greatest where the sparse vegetation is the primary or secondary determinant. Moreover, our results reveal that the difference between saturated and actual vapor pressures, the 2-m mean wind speed, the 2-m mean temperature, and the saturated vapor pressure gradient ∆ are the leading factors that influence the calculation of evapotranspiration. The former two factors are positive influencing factors, while the latter two are negative influencing factors. Our study also quantified their influencing magnitudes.
Different weather conditions have different interannual contribution rates to evapotranspiration, and our study quantified their contribution rates to evapotranspiration. For instance, the contribution rate of sandstorm to evapotranspiration is 10% higher for NSL than for CGL. The PM-H evolutionary algorithm can use EC high-resolution reanalyzed data as calculation input to accurately quantify and assess the evapotranspiration in deserts and oases. Our calculations showed that 1) the mean potential evapotranspiration was 2,750 mm in the Tarim Basin in 2015, that 2) evapotranspiration in the Tarim Basin is stronger in the south and weaker in the north, that 3) evapotranspiration is higher in the center of the basin than in the surrounding green oases (Figure 7), and that 4) the Taklimakan Desert is characterized by high evapotranspiration values, with the mean annual potential evapotranspiration reaching approximately 3,000 mm, while the observed evapotranspiration in the center of the desert is 3,800 mm (Zhou et al., 2017a).
To extend the applicability of PM-H, by using hourly data such as 2-m dew point temperature, 2-m temperature, 10-m wind speed, surface net solar radiation, and near-infrared albedo for direct radiation in the 2015 ERA5 reanalyzed data (0.25° × 0.25°), the average potential evapotranspiration of the Taklamakan Desert was calculated. First, we determined whether the grid points belonged to desert or oasis based on albedo values for desert (0.23–0.26), oasis (0.2), and Gobi (0.27) (Yalkun et al., 2019; Zhang et al., 2019; Yalkun, 2020). Second, we used the PM-H evolutionary algorithm for different surfaces to calculate the evaporation values of the grid points. Third, we calculate the annual values for each grid point in the study area based on different algorithms and calculate their accumulation to obtain the calculated values of annual evapotranspiration. We calculated the average potential evaporation of 2,750 mm in 2015 for the Tarim Basin based on the grid data from the high-resolution reanalysis.
Data availability statement
The data that support the findings of this study are available from the authors upon reasonable request.
Author contributions
WH, WC, and SH contributed equally to this work. XZ Give good meteorological professional advice. FY and AM conducted the fieldwork and obtained and processed the EC data. QH, HP, CZ, MS, CW, YW, XY, and LM Contributed to the result analysis and interpretation. All authors commented on and approved the final paper.
Funding
This research was funded by the National Natural Science Foundation of China (41975010, 41875023, and 41905009), the Strategic Priority Research Program of Chinese Academy of Sciences (XDA20100306) and the Xinjiang Natural Science Founds of China (2021D01A197).
Acknowledgments
We thank all those who participated in the experiment and all members of the desert meteorological boundary layer research team for their support.
Conflict of interest
The authors declare that the research was conducted in the absence of any commercial or financial relationships that could be construed as a potential conflict of interest.
Publisher’s note
All claims expressed in this article are solely those of the authors and do not necessarily represent those of their affiliated organizations, or those of the publisher, the editors and the reviewers. Any product that may be evaluated in this article, or claim that may be made by its manufacturer, is not guaranteed or endorsed by the publisher.
References
Attarod, P., Kheirkhah, F., Sigaroodi, S. K., and Sadeghi, S. M. M. (2015). Sensitivity of reference evapotranspiration to global warming in the Caspian Region, North of Iran. J. Agr. Sci. Tech. Iran. 17, 869–883. Available at: https://www.researchgate.net/publication/278291068.
Badgley, G., Fisher, J. B., Jimenez, C., Tu, K. P., and Vinukollu, R. (2015). On uncertainty in global terrestrial evapotranspiration estimates from choice of input forcing datasets. J. Hydrometeorol. 16, 1449–1455. doi:10.1175/JHM-D-14-0040.1
Chen, H. P., and Sun, J. Q. (2015). Changes in drought characteristics over China using the standardized precipitation evapotranspiration index. J. Clim. 28, 5430–5447. doi:10.1175/jcli-d-14-00707.1
Duan, C. F., Miao, Q. L., and Cao, W. (2012). Spatio—Temporal variations of potential evapotranspiration around Taklimakan desert and the main influencing factors. J. Desert Res. 32, 1723–1730. doi:10.1007/s11783-011-0280-z
Fan, Z. X., and Thomas, A. (2013). Spatiotemporal variability of reference evapotranspiration and its contributing climatic factors in Yunnan Province, SW China, 1961–2004. Clim. Change 116, 309–325. doi:10.1007/s10584-012-0479-4
Felipe, L. R., Oscar, H., Jordi, V. G. D. A., Alberto, D. L. F., Ricardo, M., Jose, R., et al. (2021). Local evaporation controlled by regional atmospheric circulation in the Altiplano of the Atacama Desert. Atmos. Chem. Phys. 21, 9125–9150. doi:10.5194/acp-21-9125-2021
Gao, X. R., Sun, M., Zhao, Q., Wu, P., Zhao, X. N., Pan, W. X., et al. (2017). Actual ET modelling based on the Budyko framework and the sustainability of vegetation water use in the Loess Plateau. Sci. Total Environ. 579, 1550–1559. doi:10.1016/j.scitotenv.2016.11.163
Gao, Z. D., He, J. S., Dong, K. B., Bian, X. D., and Li, X. (2015). Sensitivity study of reference crop evapotranspiration during growing season in the West Liao River basin, China. Theor. Appl. Climatol. 124, 865–881. doi:10.1007/s00704-015-1453-7
Han, S. J., Hu, H. P., Yang, D. W., and Liu, Q. C. (2009). Differences in changes of potential evaporation in the mountainous and oasis regions of the Tarim Basin, northwest China. Sci. China Ser. E-Technol. Sci. 39, 1981–1989. doi:10.1007/s11431-009-0123-3
Houston, J. (2006). Evaporation in the Atacama desert: An empirical study of spatio-temporal variations and their causes. J. Hydrology 330, 402–412. doi:10.1016/j.jhydrol.2006.03.036
Hu, S. J., Lei, J. Q., Xu, X. W., Song, Y. D., Tian, C. Y., and Chen, X. B. (2008). Theoretical analysis of ultimate evaporation intensity of wind-blown sand soil in Taklimakan Desert. Chin. Sci. Bull. 53, 107–111. doi:10.1360/csb2008-53-zkII-107
Huo, W., Hu, S. Q., Zhi, X. F., Yang, F., Yang, X. H., Zhou, C. L., et al. (2019). A variation study on calculation of evapotranspiration over constructed green land and natural sandy land. Acta Meteorol. Sin. 77, 949–959. doi:10.11676/qxxb2019.047
Huo, W. (2011). The analysis of the weather development characteristics and causes of sandstorm in Xinjiang. Urumqi: Xinjiang Normal University. Available at: https://cdmd.cnki.com.cn/Article/CDMD-10762-1012006816.htm.
Huo, W. (2020). The difference study of Local climate on artificial shelter forest land and natural sandy land in Taklimakan Desert hinterland. Nanjing: Nanjing University of Information Science and Technology. doi:10.27248/d.cnki.gnjqc.2020.000835
Jia, X. P., Ma, Q. M., Long, Y. P., and Wang, H. B. (2022). Soil evaporation monitored with medium-lysimeter in an artificial forest in the Hobq Desert, China. J. Desert Res. 42, 211–222. doi:10.7522/j.issn.1000-694X.2021.00212
Kidron, G. J. (2009). The effect of shrub canopy upon surface temperatures and evaporation in the Negev Desert. Earth Surf. Process. Landf. 34, 123–132. doi:10.1002/esp.1706
Li, B. F., Chen, Y. N., Li, W. H., and Cao, Z. C. (2011). Remote sensing and the SEBAL model for estimating evapotranspiration in the Tarim River. Acta Geogr. Sin. 66, 1230–1238. doi:10.11821/xb201109008
Li, X. Y., Li, S., and He, Q. (2005). An overview of study on sandy desertification. Arid. Meteorol. 23, 73–82. Available at: http://www.ghqx.org.cn/EN/Y2005/V23/I4/73.
Liu, C. M., and Zhang, D. (2011). Temporal and spatial change analysis of the sensitivity of potential evapotranspiration to meteorological influencing factors in China. Acta Geogr. Sin. 66, 579–588. doi:10.11821/xb201105001
Liu, H. Z., and Feng, J. W. (2012). Seasonal and interannual variations of evapotranspiration and energy exchange over different land surfaces in a semiarid area of China. J. Appl. Meteorol. Climatol. 51, 1875–1888. doi:10.1175/JAMC-D-11-0229.1
Ma, N., and Wang, N. A. (2016). On the simulation of evaporation from lake surface in the hinterland of the BadainJaran Desert. Arid Zone Res. 33, 1141–1149. doi:10.13866/j.azr.2016.06.01
Menenti, M. (1984). Physical aspects and determination of evaporation in deserts applying remote sensing techniques. Wageningen: Menenti. Available at: https://edepot.wur.nl/205770.
Olchev, A., Volkova, E., Karataeva, T., and Novenko, E. (2013). Growing season variability of net ecosystem CO2 exchange and evapotranspiration of asphagnum mire in the broad-leaved forest zone of European Russia. Environ. Res. Lett. 8, 035051. doi:10.1088/1748-9326/8/3/035051
Shen, S. H., and Sheng, Q. (2008). Changes in pan evaporation and its cause in China in the last 45 years. Acta Meteorol. Sin. 66, 452–460. doi:10.11676/qxxb2008.041
Wagle, P., Xiao, X. M., Gowda, P., Basara, J., Brunsell, N., Steiner, J., et al. (2017). Analysis and estimation of tall grass prairie evapotranspiration in thecentral United States. Agric. For. Meteorology 232, 35–47. doi:10.1016/j.agrformet.2016.08.005
Wang, Y. D., Li, S. Y., Jin, X. J., Xu, X. W., Li, C. J., and Wang, Q. (2013). Changes of reference crop evapotranspiration and p-an evaporation in hinderland of Taklimakan Desert. J. Arid Land Resour. Environ. 27, 114–117. doi:10.13448/j.cnki.jalre.2013.02.023
Xie, W. Y., Chen, Y., and Xu, B. (2014). Analysis on small type and E-601 type evaporation conversion coefficient in Minqin of Gansu Province. J. Arid Meteorology 32, 481–486. doi:10.11755/j.issn.1006-7639(2014)-03-0481
Xie, X. Q., and Wang, L. (2007). Changes of potential evaporation in Northern China over the past 50 years. J. Nat. Resour. 22, 683–691. doi:10.11849/zrzyxb.2007.05.002
Xie, Y. Y., Liu, S. Y., Fang, H. Y., and Wang, J. C. (2020). Global autocorrelation test based on the Monte Carlo method and impacts of eliminating nonstationary components on the global autocorrelation test. Stoch. Environ. Res. Risk Assess. 34, 1645–1658. doi:10.1007/s00477-020-01854-5
Yalkun, A., Mamtimin, A., Liu, S. H., Yang, F., He, Q., Qi, F. F., et al. (2019). Coefficients optimization of the GLASS broadband emissivity based on FTIR and MODIS data over the Taklimakan Desert. Sci. Rep. 9, 18460. doi:10.1038/s41598-019-54982-6
Yalkun, A. (2020). Remote sensing inversion of surface characteristic parameters and energy fluxs over the Taklimakan Desert. Urumqi: Xinjiang University. doi:10.27429/d.cnki.gxjdu.2020.000588
Yuan, T. G., Chen, S. Y., Kang, L. T., Chen, Z. Q., Luo, Y., and Zou, Q. (2016). Temporal and spatial distribution characteristics and change trends of dust intensity in dust source regions of northern China during 1961-2010. J. Arid Meteorology 34, 927–935. doi:10.11755/j.issn.1006-7639(2016)-06-0927
Zhang, J., Takahashi, K., Wushiki, H., Yabuki, S., Xiong, J. M., and Masuda, A. (1995). Water geochemistry of the rivers around the Taklimakan Desert (NW China): Crustal weathering and evaporation processes in arid land. Chem. Geol. 119, 225–237. doi:10.1016/0009-2541(94)00088-P
Zhang, J. G., Sun, S. G., Xu, X. W., Lei, J. Q., and Li, S. Y. (2011). Characterizing and estimating soil evaporation in Taklimakan Desert highway shelterbelt. Bull. Soil Water Conservation 31, 145–148+248. doi:10.13961/j.cnki.stbctb.2011.01.047
Zhang, K., Liu, Y. Q., Yalkun, A., Liu, Z. H., Nie, Z. X., and Li, H. Q. (2019). Parameterization and remote sensing inversion of surface albedo in Taklimakan Desert. J. Xinjiang Agric. Univ. 42, 299–306.
Zhang, M. J., Li, R. X., Jia, W. X., and Wang, X. F. (2009). Temporal and spatial changes of potential evaporation in Tianshan Mountains from 1960 to 2006. Acta Geogr. Sin. 64, 798–806. doi:10.3321/j.issn:0375-5444.2009.07.004
Zhang, R. H., Du, J. P., and Sun, R. (2012). Review of estimation and validation of regional evapotranspiration based on remote sensing. Adv. Earth Sci. 27, 1295–1307. doi:10.11867/j.issn.1001-8166.2012.12.1295
Zhou, C. L., Yang, X. H., Huo, W., Zhong, X. J., Yang, F., and He, Q. (2017a). Characteristics of precipitation at the hinterland of the Taklimakan desert. J. Desert Res. 37, 343–348. doi:10.7522/j.issn.1000-694X.2015.00250
Keywords: potential evapotranspiration, desert, CGL, NSL, refinement
Citation: Huo W, Zhi X, Hu S, Cai W, Yang F, Zhou C, MamtiMin A, He Q, Pan H, Song M, Wen C, Wang Y, Yang X and Meng L (2022) Refined assessment of potential evapotranspiration in the tarim basin. Front. Earth Sci. 10:904129. doi: 10.3389/feart.2022.904129
Received: 25 March 2022; Accepted: 08 July 2022;
Published: 11 August 2022.
Edited by:
Haishan Chen, Nanjing University of Information Science and Technology, ChinaReviewed by:
Zengyun Hu, Chinese Academy of Sciences (CAS), ChinaNing Chen, Lanzhou University, China
Copyright © 2022 Huo, Zhi, Hu, Cai, Yang, Zhou, MamtiMin, He, Pan, Song, Wen, Wang, Yang and Meng. This is an open-access article distributed under the terms of the Creative Commons Attribution License (CC BY). The use, distribution or reproduction in other forums is permitted, provided the original author(s) and the copyright owner(s) are credited and that the original publication in this journal is cited, in accordance with accepted academic practice. No use, distribution or reproduction is permitted which does not comply with these terms.
*Correspondence: Shunqi Hu, aHVzaHVucWkyMTVAMTYzLmNvbQ==; Wenyue Cai, Y2Fpd3lAY21hLmdvdi5jbg==