 Miao Zhang
 Christopher James Spiers
 Jinfeng Liu
 Hongwei Zhou5
- 1State Key Laboratory of Earthquake Dynamics, Institute of Geology, China Earthquake Administration, Beijing, China
- 2HPT Laboratory, Faculty of Geosciences, Utrecht University, Utrecht, Netherlands
- 3School of Earth Sciences and Engineering, Sun Yat-Sen University, Guangzhou, China
- 4Guangdong Provincial Key Lab of Geodynamics and Geohazards, Sun Yat-Sen University, Zhuhai, China
- 5School of Energy and Mining Engineering, China University of Mining and Technology, Beijing, China
The swelling-shrinkage behavior of smectites induced by interlayer uptake or sorption of CO2 and H2O has been investigated with increasing interest recent years, primarily because of its potential impact on the sealing efficiency of clay-bearing caprocks overlying CO2 storage reservoirs. To get a better understanding of the stress-strain-sorption coupling in smectite exposed to supercritical CO2, we performed multiple stepwise axial loading and unloading, oedometer-type experiments on ∼1 mm thick discs of pre-pressed Na-SWy-1 and of Ca-SAz-1 montmorillonite. Initially air-dry (AD) samples were first tested in the presence of wet CO2 (20% RH) at 10 MPa pressure, and in the vacuum-dry (VD) state in the presence of pure (dry) CO2 at 10 MPa. The samples were incrementally loaded and unloaded at 40°C, employing effective axial stresses ranging from 0.5 to 44 MPa. Control tests using wet and dry He or Ar instead of CO2, were performed to distinguish strains due to loading-related CO2 sorption/desorption from purely poroelastic effects. All samples saturated with CO2 exhibited 30–65% lower apparent stiffness moduli than when saturated with He or Ar, showing that CO2 adsorption/desorption altered the mechanical response of pre-pressed smectites. Relative to the He and Ar tests, swelling strains of a few % (corrected for poroelastic effects) were measured for AD Na-SWy-1 smectite exposed to wet CO2, decreasing from 4.9 to 3.8% with increasing effective axial stresses in the range 1.6–36.2 MPa. AD SAz-1 material exhibited similar tends. VD samples tested with dry CO2 showed much smaller relative swelling strains (0.5–1.5%), which also decreased with increasing applied effective stresses. The experimental data on relative swelling strain versus effective stress are well fitted by a recent thermodynamic model for stress-strain-sorption behavior in coal. Results derived from model fits indicate that smectite-rich rocks have significant storage capacity for CO2 at shallow depths (up to 1.5–2 km) through CO2 sorption by the clay minerals. However, this component of storage capacity is reduced by more than 80% with increasing burial depth beyond 3 km. The model provides a first step towards modelling stress-strain-sorption effects in smectite rich caprocks penetrated by CO2, though further refinements are needed for broader application to the smectite-CO2-H2O system.
Introduction
Geological storage of CO2 by injection into depleted hydrocarbon reservoirs and saline aquifers, as well as enhanced oil and gas recovery operations combined with CO2 storage, are all under consideration for reducing anthropogenic greenhouse gas emissions into the atmosphere (Holloway, 1997; Alvarado and Manrique, 2010; Bachu, 2008). Safe, long-term storage of CO2 via these routes depends on the sealing capacity of the storage system, i.e. on good caprock integrity (Gaus, 2010; Kaldi et al., 2013). Since smectite clays are a significant component (3–20 wt%) of many clay-rich caprocks and faults (Chadwick et al., 2004; Espinoza and Santamarina, 2017; Nooraiepour et al., 2017), the swelling-shrinkage behavior exhibited by smectites, due to intercalation of supercritical (Sc) CO2 and H2O in their interlayer structure, has been investigated vigorously in the past few years (Cygan et al., 2012; Giesting et al., 2012a; Giesting et al., 2012b; Loring et al., 2012; Rother et al., 2013; Schaef et al., 2015). The aim of such studies has been to determine whether CO2-induced swelling-shrinkage effects are large enough to significantly impact the geo-mechanical and transport properties of smectite-bearing caprocks and crosscutting faults and fractures.
Montmorillonite is the most common group of smectite clays in caprocks. Montmorillonites consist of stacked aluminosilicate layers, each consisting of one octahedrally-coordinated Al-O sheet (O-sheet) sandwiched by two tetrahedrally-coordinated Si-O sheets (T-sheets). Isomorphous substitutions of lower valency cations for Al and Si mean that the T-O-T layers carry a charge deficiency. This is balanced by intercalation of cations (e.g. Na+, Ca2+) between the T-O-T layers. Hydration of these cations by uptake of 0, 1, 2 or 3 layers of water molecules into the T-O-T interlayer region, causes the (001) interlayer spacing (d001) to increase by an amount equal to the thickness of water layers intercalated (i.e. by 2.5–3Å per layer). The corresponding hydration states are referred to as the 0, 1, 2 and 3 W states. The magnitude of the associated swelling effect depends on the properties of the interlayer cation, the T-O-T layer charge density, temperature, relative humidity and other factors.
Swelling due to water (vapor) uptake into the interlayer structure of montmorillonite and other smectites is a well-known problem in soil mechanics and has been studied extensively through experiments (Moore and Hower, 1986; Ferrage et al., 2005; Ferrage et al., 2007a; Ferrage et al., 2007b; Ferrage et al., 2007c; Michot et al., 2016) and molecular dynamic simulations (Suter et al., 2012; Cygan et al., 2015; Greathouse et al., 2015). Intercalation of CO2 plus associated interlayer swelling is a more recent finding, first proved by Loring et al. (2012) using spectroscopic methods. Subsequently, much work has been done on the topic, revealing the following key points.
First, dry (pure) (Sc)CO2 can cause either expansion or contraction of the interlayer spacing of the smectite crystallites, depending primarily on the initial hydration state of the smectite, the types of interlayer cations present, and the TOT layer charge (Loring et al., 2011; Giesting et al., 2012a; Giesting et al., 2012b; Ilton et al., 2012; Loring et al., 2012; Rother et al., 2013). Expansion is due to CO2 uptake in the interlayer, whereas contraction is due to interlayer water loss driven by dissolution in the external CO2 environment. As an example, when exposed to ScCO2 at 9 MPa pressure and 40–50°C, Na-montmorillonite, with an initial d001 spacing of 11.0Å and corresponding to sub 1 W hydration state, exhibits CO2 uptake alongside an increase in interlayer spacing toward that of the completely monohydrated state (1 W, 12.3Å). This causes swelling strains up to 12% (Rother et al., 2013). By contrast, Ca-montmorillonite with an initial hydration state of 1W<H < 2 W (d001 = 14.4Å) shows contraction of the interlayer to 12.4Å (−14% strain) when exposed to pure ScCO2, due to interlayer water loss (Schaef et al., 2012).
Second, smectite swelling/shrinkage caused by exposure to mixed (Sc)CO2 and water vapor are determined by repartitioning of CO2 and water in the interlayer. This in turn depends on the composition of the mixture (partial pressures of CO2 and H2O) and the initial hydration state of the clay. Available data on this repartitioning of CO2/H2O in the interlayer gallery suggest that intercalation of H2O and CO2 is competitive in montmorillonite, with H2O uptake being preferable (Loring et al., 2014; Schaef et al., 2015).
Third, besides interlayer intercalation, H2O and CO2 uptake also occur via sorption at sites located on the external surfaces of the clay platelets, including inter-particle pore surfaces and crystallites edges, causing a swelling effect as well (Prost et al., 1998; Loring et al., 2014; Zhang et al., 2018). In the present paper, CO2 uptake both into the smectite interlayer and onto the external smectite grain surfaces, will be referred to as sorption or adsorption.
Against this background, CO2/H2O-related swelling and/or shrinkage of smectite clays can be expected to lead to substantial changes in stress-strain state and hence transport properties of smectite-bearing caprock and faults under subsurface CO2 storage conditions (Rother et al., 2013; Song and Zhang, 2013). Zhang et al. (2018) experimentally measured the swelling stresses exerted by volumetrically confined Na-SWy-1 and Ca-SAz-1 montmorillonite aggregates upon exposure to ScCO2 under P-T conditions relevant to CO2 storage, finding values of 5–11 MPa, when swelling strains were limited to 1–3%. The measured swelling stresses also showed an inverse dependence on the initial effective stress applied to the clay samples, demonstrating coupled stress-strain-sorption characteristics, similar to those reported for coal exposed to CH4 and CO2 (e.g. Hol et al., 2012; Liu et al., 2016b). Zhang (2019) went on to measure the permeability of laterally confined Opalinus Claystone cores (∼5% smectite) and simulated smectite fault gouge (all initially air-equilibrated), to dry and wet CO2 and He, at a mean pressure of 10 MPa. Self-sealing (i.e. permeability reduction) was observed in all samples tested with CO2 versus He. Moreover, alternating flow of wet then dry CO2 through the simulated fault gouge correspondingly decreased and increased sample permeability. The observed effects were attributed to clay swelling and shrinkage and clearly depended on initial smectite hydration state and the water content of the injected CO2. However, the magnitude and impact of these coupled stress-strain-sorption phenomena on clay-rich caprock integrity and storage capacity, under the subsurface hydration states, CO2 pressures and effective stress conditions associated with CO2 storage, remain unclear.
In the present paper, we aim to achieve a better understanding of the effect of applied (Terzaghi) effective stress on the strain response of smectites subject to interactions with CO2 and H2O. To this end, we performed oedometer–type, cyclic loading and unloading experiments on pre-compressed, ∼1 mm-thick discs, prepared from Na-SWy-1 and Ca-SAz-1 montmorillonite, injecting CO2, Ar and/or He as pore fluid. We focus on how the strain response of the smectite to loading is changed due to sorptive interactions of smectite with CO2 and H2O versus the inert gases. In addition, we compare the experimental data with a thermodynamic model developed for stress-strain-sorption phenomena in coal (Hol et al., 2012; Liu et al., 2016a; Liu et al., 2016b), showing that such models can at least qualitatively explain the behaviour seen. We go on to consider the implications for both the CO2 storage capacity and sealing integrity of clay-rich formations.
Experimental Methods
The experiments consisted of 1-D oedometer tests aimed at measuring the volumetric response (i.e. change in thickness) of pre-pressed smectite discs, exposed to CO2 at a pressure of 10 MPa at 40°C, to incremental cycling of the applied axial effective stress (Terzaghi) under varying hydration conditions. Multiple experiments were performed on one Na-montmorillonite and one Ca-montmorillonite sample, employing repeated loading cycles. The samples were tested first in an air-dry (AD) hydration state (pre-equilibrated with heated lab air having relative humidity RH ≈ 20% at 40°C) and then vacuum dry (VD). Control experiments were performed on both samples in the AD and VD conditions, employing inert gas (He and/or Ar) at 10 MPa in place of CO2. This was done to discriminate purely mechanical effects of effective stress (e.g. poroelastic volume change) from effects related to sorption and desorption of CO2 and/or H2O. In all tests performed on AD samples, water-bearing (“wet”) pore fluids (with RH ≈ 20%) were employed to buffer the initial AD hydration state, while tests on VD samples employed pure (dry) pore fluids.
Materials
Raw Clays and Pore Fluids
The raw clays used were naturally occurring Na-SWy-1 and Ca-SAz-1 montmorillonite obtained from the Source Clay Repository of the Clay Mineral Society. The Na-SWy-1 is a Na-rich Wyoming type (SWy-1) low charge montmorillonite (CEC = 80 cmolc kg−1) with solid substitutions occurring in both the tetra- and octahedral sheets (Jaynes and Bigham, 1986). The Ca-SAz-1 material is a high charge (CEC = 120 cmolc kg−1) (Borden and Giese, 2001) Arizona type with solid substitutions occurring solely in the tetrahedral sheet. The interlayer cations present in this montmorillonite are mainly calcium, with smaller amounts of potassium and sodium. Both types of clay were used as-received, without any chemical pre-treatment or grain size fractionation. Baseline studies of both montmorillonite can be found in previous literature (Chipera and Bish, 2001; Madejova and Komadel, 2001; Mermut and Lagaly, 2001). The pore fluids used here were respectively CO2, He and Ar, with a purity >99.99% supplied in cylinder form by Air Products NL. “Wet” pore fluids with a water content equivalent to the lab air humidity of ∼20% (at 40°C) were prepared by introducing a controlled amount of water vapor into the pore fluid system using a multistep MgNO3 salt buffer method described inAppendix 1.
Sample Preparation
The experiments were performed on one disc-shaped sample derived from the SWy-1 montmorillonite and one derived from the SAz-1 montmorillonite. The samples were pre-formed in a stainless steel die with the same inner diameter (19.15 mm) as the 1-D compaction vessel subsequently used in the experiments. For the sample pre-forming, ∼0.6 g of sample powder (0.55 and 0.608 g respectively for SAz-1 and SWy-1), which had been pre-dried in lab air at 40°C, was distributed evenly in the die and lightly compressed between an upper and a lower stainless steel piston by hand. The sample was subsequently compressed at an axial stress of 10 MPa for ∼3 min using a hydraulic press, to obtain a flat, disc-shaped sample of ∼1.1 mm thickness, which was then transferred to the main experimental apparatus.
Experimental Set-Up
The experimental setup (Figure 1) consists of a uniaxial, oedometer-type (i.e. one dimensional) compaction vessel, constructed of Remanit 4,122 stainless steel, mounted in an Instron 8562 servo-controlled loading frame to apply axial load (Figure 1A, c.f. Zhang et al., submitted). The pre-formed sample was axially loaded, within the Remanit vessel, via two Remanit pistons (diameter 19 mm) sealed against the Remanit compaction vessel using Viton O-rings. Applied axial load was measured external to the compaction vessel using a 100 kN capacity Instron load cell, which allows load measurement and control to within ±2.3 N. Instron ram displacement was measured with an internally mounted linear variable differential transformer (LVDT). Axial displacement of the upper piston relative to the Remanit vessel top (i.e. axial sample deformation) was measured using a high precision external LVDT (measurement range ± 1 mm, accuracy better than ± 0.1 μm). This allowed changes in sample thickness to be measured accurately at any instant, by correcting for piston distortion.
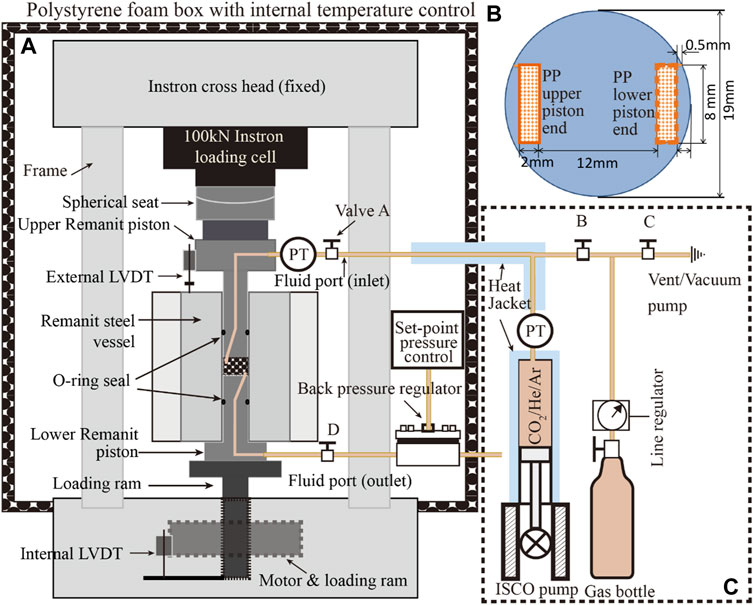
FIGURE 1. Schematic illustration of the experimental set-up. (A) The uniaxial compaction vessel located in the Instron loading frame. (B) Schematic illustration of the piston ends, in contact with the upper and lower sample surfaces. Note that the porous stainless steel plates (PP) were located on opposite sides of the sample, and penetrated ∼0.3 mm into the sample (refer to a). (C) Pore fluids system consisting of an ISCO 65D syringe pump and gas supply cylinder.
The pore fluid system (Figure 1C) consisted of an ISCO 65D, servo-controlled syringe pump employed to introduce pressurized fluid (e.g. CO2) into the sample through an inlet in the upper Remanit piston. The fluid pressure was measured and controlled using a Honeywell TJE pressure transducer (range 0–137.90 MPa, absolute accuracy ± 0.6895 MPa), located at the top of the ISCO pump cylinder. For better measurement accuracy, a more sensitive MSI 0–35 MPa (±0.035 MPa) pressure transducer was installed at the fluid inlet in the upper piston. Fluid pressure at the bottom of the sample was limited using an Equilibar back pressure regulator connected to a pore fluid port in the lower piston. Note that the pore fluid entered and exited the sample via bar-shaped, porous stainless steel plates located at diametrically opposite sides of the sample, above and below it (see Figures 1A,B). The porous plates penetrated 0.3 mm into the sample surface and were employed in this configuration to achieve horizontal fluid flow through the sample, when fluid pressure applied by the ISCO pump was set higher than the set-point of the back pressure regulator.
The temperature of the compaction vessel and sample were controlled at 40°C (±0.1°C) by means of an external heater mounted around the Remanit compaction vessel. This was regulated using a Eurotherm temperature controller, connected to a type K thermocouple located in the external furnace windings. Sample temperature was measured using a second type K thermocouple placed in a small recess in the compaction pressure vessel at a distance of a few mm from the sample. The experimental set-up, excluding the ISCO syringe pump, was enclosed in a 1.5 m3 foam-polystyrene box (wall thickness∼50 mm). The air temperature inside the box was controlled within ±0.2°C at 40°C, using a lamp (500 W) regulated by a Pt-100 element plus a CAL 9900 PID-controller, with a fan circulating the air to guarantee homogeneity of temperature (c.f. Hol and Spiers, 2012). The ISCO pump and the pipelines of the pore fluid system were heated at 40°C using purpose-built heating jackets.
The output signals of all transducers and sensors were recorded using a National Instruments, 16-channel DAOPad-6015 A/D convertor and VI-logger data acquisition system, using a sampling rate of 0.2 Hz. Signals recorded included those obtained from the external LVDT (mm), the Instron load (kN) and internal LVDT position (mm), the pressure (MPa) measured by the MSI pressure transducer at the upper pore fluid inlet, and ISCO output pressure and volume signals, as well as the thermocouple signals representing the temperature (°C) of the sample and the air in the polystyrene box.
Experimental Procedure
The following multistage testing procedure was applied to each of the two samples investigated (Na-SWy-1 and Ca-SAz-1, see Table 1).
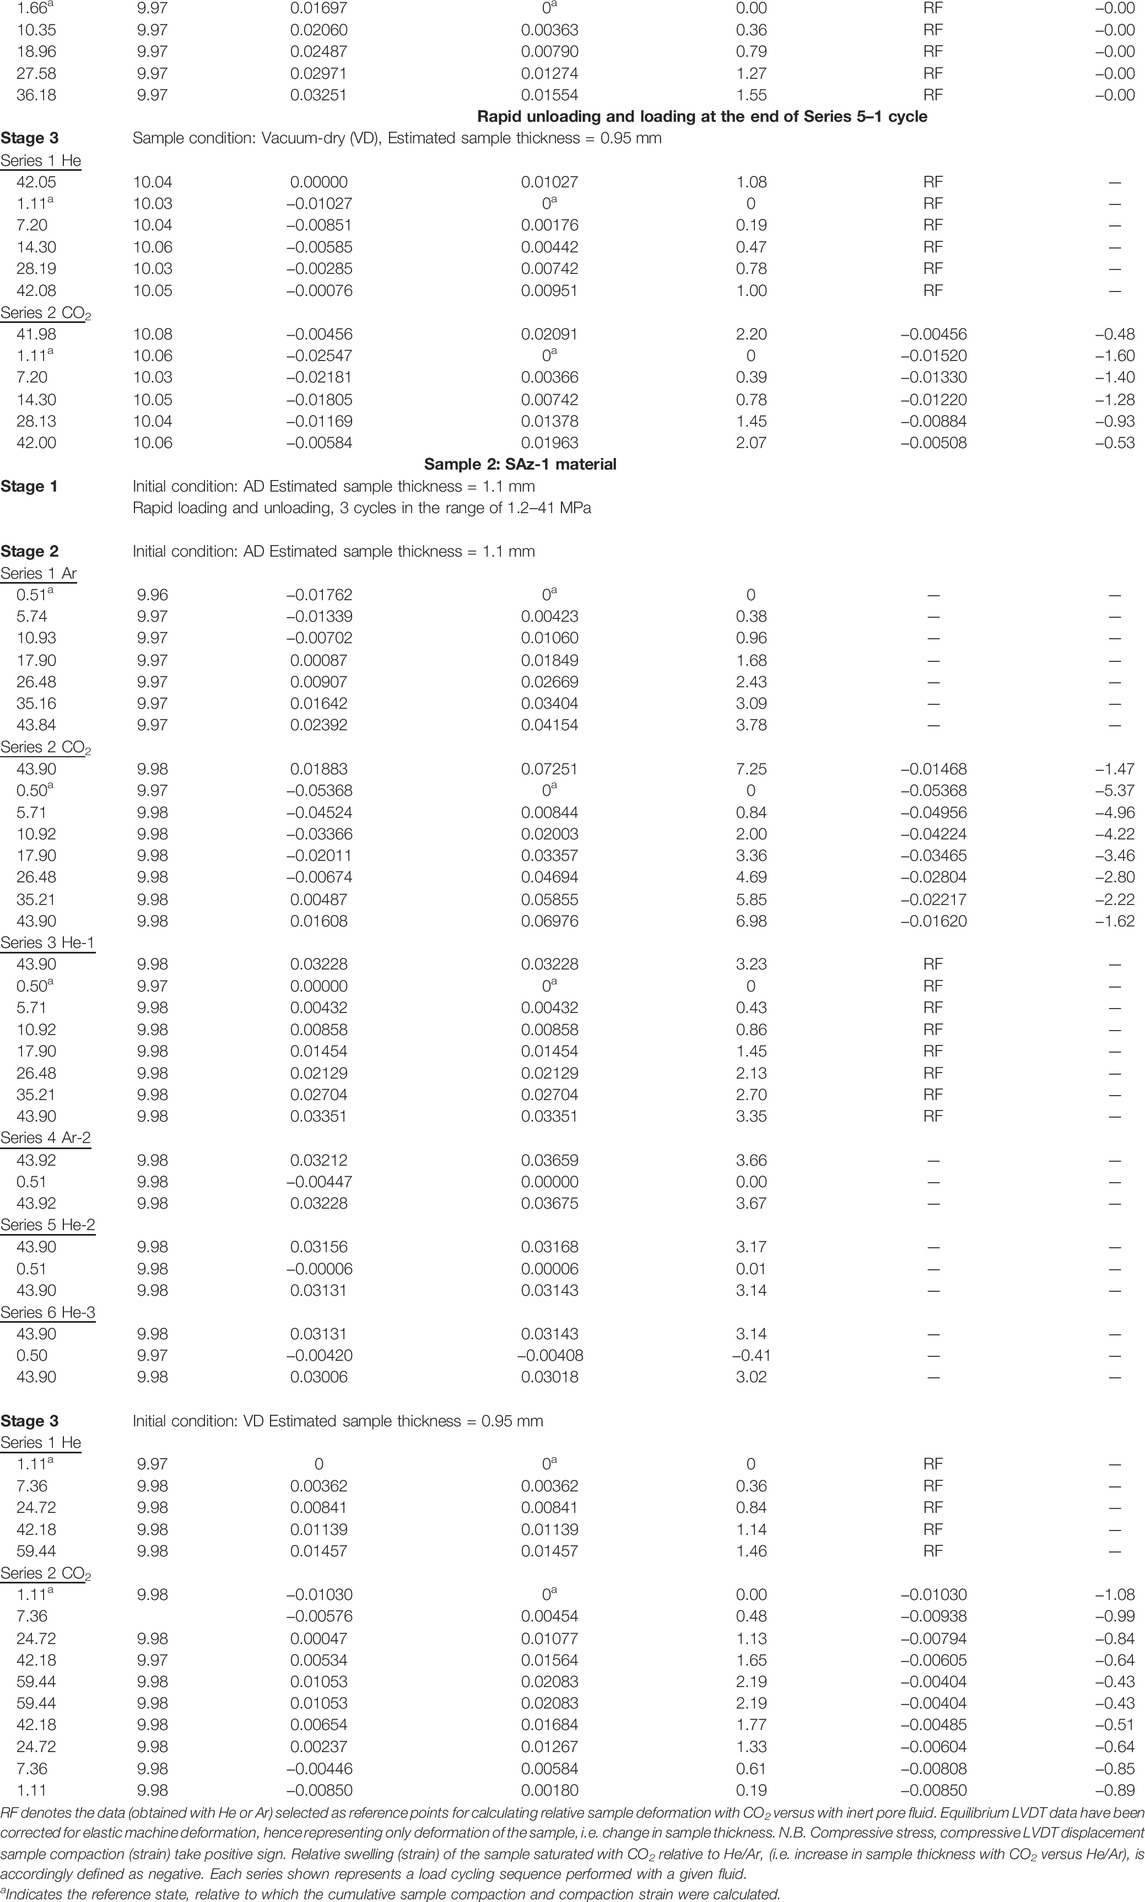
TABLE 1. Summary of experiments, experimental conditions and key data obtained.
Stage 1: Pre-compaction and Cyclic Loading With Pore Fluid Inlets Open to Lab Air (AD Condition)
After pre-forming, the sample disc was carefully removed from the die and located in the compaction vessel. The apparatus was subsequently heated to the target experimental temperature (40°C) and the sample was pre-compacted under an axial (effective) stress of 70 MPa, with the sample exposed to lab air humidity by keeping the fluid inlet port in the top piston open to the heated lab air (RH ≈ 23%, T = 40°C). Pre-compaction was continued for 50 h, i.e. until ∼5 h after the external LVDT position had reached a stable asymptotic value. Pre-compaction aimed to minimize irreversible sample deformation in the subsequent load-cycling tests at lower (effective) stress, and to allow the sample to approach equilibrium with lab air humidity in the loaded state.
Following pre-compaction, the axial stress was adjusted to a lower value, equal to the starting effective stress for subsequent Stage 1 cycling experiments, i.e. 2.5 MPa for the Na-SWy-1 sample and to 0.5 MPa for the Ca-SAz-1 sample. Minor time-dependent expansion of the samples was observed after lowering the axial stress, presumably due to relaxation of residual elastic stress by reverse creep processes and/or stress-dependent changes in hydration state. To further minimize permanent deformation effects during subsequent testing, a series of two to three continuous loading and unloading cycles were conducted in the range of 0.5 or 2.5–70 MPa. A similar number of rapid loading and unloading cycles was then applied between the minimum and maximum effective stresses employed in the subsequent Stage 2 and Stage 3 tests. This was done to determine the time-independent elastic response of the samples under Stage 2 and 3 conditions and was conducted in either continuous or stepwise (step interval = 4–6 MPa) loading mode at an active loading rate of ∼0.1–0.3 MPa/s. Each loading and unloading cycle was finished within 30 min, and indeed exhibited more or less fully recoverable elastic behaviour.
Stage 2: Load Cycling Applied to AD Samples Exposed to Wet CO2, He and Ar
After completion of Stage 1 load cycling on samples pre-equilibrated with lab air humidity, the axial load was adjusted to ∼60 MPa, and the Instron switched from load to displacement control mode, such that the piston position was fixed. The set-point value of the back pressure regulator was subsequently adjusted to ∼10.05 MPa. The compaction vessel plus the sample and pore fluid system was then briefly evacuated and pore fluid (CO2, He, or Ar, all with controlled moisture content equivalent to RH ≈ 20% at 40°C) was introduced into the sample from the ISCO pump via the inlet in the upper piston (Figure 1, see also Appendix 1). The ISCO pump was operated in constant pressure mode, with a set-point of 10 MPa. When the pore fluid pressure stabilized at 10 MPa, with little/no further volume change recorded by the ISCO pump, the Instron load was adjusted to the chosen starting axial effective stress (σe0) for initiating stress cycling. Thereafter, the Instron was operated in load control mode.
After the sample reached apparent equilibrium, i.e. when no further change in external LVDT signal was seen for a period of ∼3 h, the axial effective stress was cycled in steps of ∼5–9 MPa, allowing apparent equilibrium to be re-established after each step and continuously monitoring the (time-dependent) sample deformation response. Cycling was performed in both up/down and down/up modes, depending on the value of σe0 (low versus high, see Table 1). Return cycles were sometimes performed in a single step at fixed rate (∼0.3 MPa/s) (see Table 1 for stress path employed).
Following load cycling with a given pore fluid, the pore fluid system was briefly evacuated and refilled by flushing the system and sample with the next pore fluid. The above initialization and stepwise loading/unloading procedure was then repeated using the new pore fluid, again cycling several times. In a few cases, early pore fluids were reintroduced to examine the effects of varying the fluid sequence. Such tests were usually conducted using a simplified stress path, i.e. directly cycling between the maximum and minimum effective stresses, without intermediate steps (Table 1). In addition, when cycling with a specific pore fluid was completed using the AD Na-SWy-1 sample, rapid continuous loading and unloading (loading rate = 0.3 MPa/s) was performed to assess any changes in the poroelastic behaviour of the sample after being saturated with CO2 and He or Ar.
Stage 3: Load Cycling Applied to VD Samples Exposed to dry CO2 and He
After completion of the Stage 1 and 2 experiments on each of the initially AD samples, the sample was evacuated in the compaction vessel at 40°C (Na-SWy-1) or 108°C (Ca-SAz-1), for 60–70 h, under an axial stress of ∼40 MPa. This treatment was aimed at dehydrating the samples to the collapsed interlayer or 0 W hydration state (following the findings of Ferrage et al., 2007b). When the sample had reached apparent equilibrium under vacuum (i.e. stopped compacting), the pore fluid system was isolated from the vacuum pump. Sample temperature was then readjusted to 40°C and continuous rapid load cycling was applied, as in Stage 1. Pure (dry) CO2 or pure (dry) He was then introduced at 10 MPa from the ISCO pump and the stepwise loading and unloading procedure applied in Stage 2 was repeated for the VD samples. For the specific sequence of fluids and stress paths used, see Table 1.
Data Processing
The thermocouple and pressure transducer signals obtained from the apparatus directly yielded temperature and pore fluid pressure data versus time. Axial force given by the Instron load cell was not corrected for seal friction acting on the upper piston, since calibration runs showed this to be less than 0.4 MPa. Displacement measured using the external LVDT was corrected for machine stiffness to obtain sample length change using a pre-determined, fifth order machine stiffness calibration characterized at true test P-T conditions using a 1 mm thick stainless steel dummy sample. Hysteresis in the machine stiffness calibration, induced by the effect of O-ring friction acting between the upper piston and vessel wall, caused a maximum discrepancy of ∼2 µm between displacements measured in loading versus unloading runs, with a standard deviation of 1.4 µm implying an error limit of ±1.4 µm in obtaining sample length changes from corrected LVDT data.
In the present paper, compressive stress, compressive displacement and compaction (strain) of the sample take a positive sign. Axial strain measured during continuous loading and/or unloading was calculated using the relation
Results
A complete list of the experimental runs performed on the two samples investigated is shown in Table 1, along with the experimental conditions and key data obtained.
Stage 1 Data: Rapid Cyclic Loading and Unloading of AD Samples Exposed to Lab Air
Data illustrating the stress cycling procedure and stress-strain data obtained in the rapid loading cycles applied to AD samples in Stage 1, i.e. to assess their time-independent elastic behaviour prior to pore fluid addition, are shown in Figure 2.
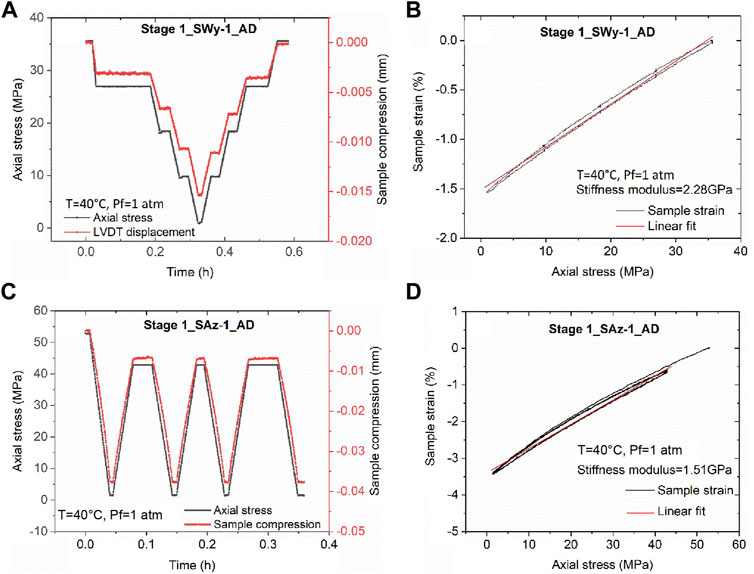
FIGURE 2. Data obtained in rapid Stage 1 stress cycling runs performed to assess the elastic properties of the AD samples before pore fluid addition. (A) Stress path employed in a rapid unloading/loading cycle applied to the AD Na-SWy-1 sample, plus concurrent change in sample thickness. (B) Corresponding sample strain versus applied axial stress data for the AD Na-SWy-1 sample. Note the largely reversible elastic behaviour and constrained stiffness modulus of 2.28 GPa. (C) Stress path and concurrent change in sample thickness for the AD SAz-1 sample during a rapid Stage 1 unloading/loading cycle. (D) Corresponding sample strain versus applied axial stress data for the AD Ca-SAz-1, giving a constrained stiffness modulus of 1.51 GPa.
Figure 2A illustrates the stress path and sample thickness change data measured as a function of time, during the loading and unloading runs on AD Na-SWy-1 sample. Note that, on the time scale of the Stage 1 runs, sample thickness changes (mm) and strains, were largely instantaneous, recoverable and linear with stress, confirming essentially elastic behaviour of the AD SWy-1 sample in Stage 1-see Figure 2B. Best fitting to the stress versus strain data gave an apparent constrained stiffness of 2.28 GPa.
Similar stress path and sample deformation data were obtained in a typical rapid cyclic loading run on the AD SAz-1 sample and shown in Figure 2C. The corresponding sample strain versus axial stress data is plotted in Figure 2D. Reversible, linear stress versus strain behaviour was again seen for the AD Ca-SAz-1 sample, as for the AD Na-SWy-1 sample, but the best-fit stiffness modulus was lower, amounting to 1.23 GPa (Figure 2D).
Stage 2 Data: Stepwise Cyclic Loading of AD Samples Saturated With “Wet” Fluids
The results obtained in Stage 2 of the experiments performed on the AD Na-SWy-1 and the AD Ca-SAz-1 samples were qualitatively closely similar. We therefore present “raw” cycling data for the AD Ca-SAz-1 sample in Figure 3, as representative for both AD samples. Figure 3A plots the effective stress applied to the sample versus time elapsed throughout the stepwise loading runs performed on the AD Ca-SAz-1 sample using wet Ar, wet CO2 and wet He pore fluid at 10 MPa. Sample thickness change relative to the starting point of the Stage 2 experimental series is presented in Figure 3B. This plot shows that the sample expanded when wet Ar is displaced by wet CO2. Compaction then occurs upon displacement of wet CO2 by wet He, but no axial dimensional change occurs when the wet He is replaced by wet Ar. These data clearly show that swelling/shrinkage of the AD Ca-SAz-1 sample is induced by interaction with CO2. In addition, Figure 3B shows that all up/down steps in applied effective stress are accompanied by an instantaneous compaction/expansion response of sample AD SAz-1, followed by time-dependent compaction/expansion until a steady asymptotic (equilibrium) strain is achieved. This behaviour is seen regardless of fluid type, through the magnitude of the instantaneous and time-dependent response is greater for cycling performed with wet CO2, than using wet Ar and He (which showed similar responses per step). Figures 3B,C also show that the equilibration time for time-dependent compaction increases with increasing applied effective stress, again for all fluids used. Note that both trends, i.e. an increased strain response in the presence of wet CO2, and an increase in equilibration time with increasing effective stress for all pore fluids, were seen not only for the AD Ca-SAz-1 sample but also for the AD Na-SWy-1 sample.
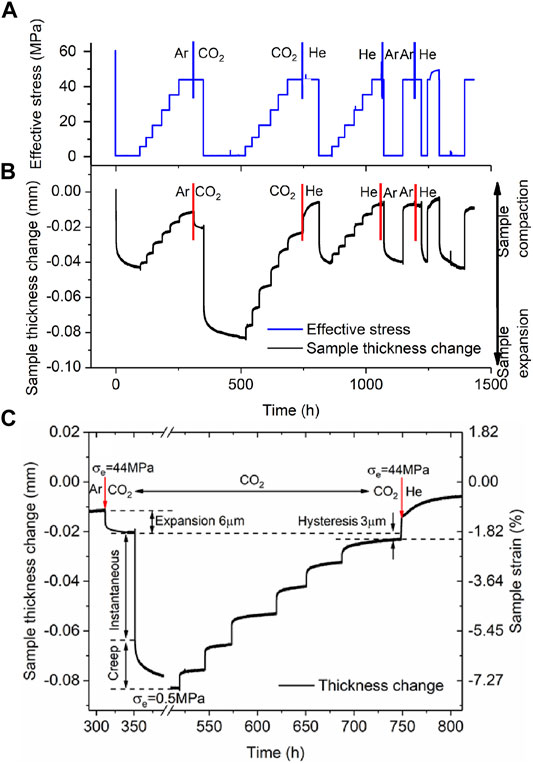
FIGURE 3. Stress cycling and associated sample thickness change and strain data collected from the Stage 2 runs performed on the AD Ca-SAz-1 sample using “wet” CO2, Ar and He pore fluids. Similar data was obtained for the AD SWy-1 sample tested with wet He and CO2. (A) Stress path employed in Stage 2 tests on AD SAz-1 sample, sequentially charged with “wet” Ar, CO2, He, Ar and He at a pressure of 10 MPa. (B) Sample thickness change (relative to the starting point of the cycling series) as a function of experimental time. (C) Enlargement from (B) Sample thickness change and strain response to stress cycling in the presence of wet CO2. The moments at which the pore fluid composition was switched are indicated with vertical bars/arrows.
A final observation for the Stage 2 runs on both the AD Ca-SAz-1 and AD Na-SWy-1 samples is that the total strain response of the samples to load cycling (i.e. the combined time-dependent and time-independent response) was close to reversible (Figures 3B,C). Hysteresis that was observed was minor and of similar magnitude to the hysteresis (∼2 µm) induced by seal friction and seen in Stage 1 cycling.
We turn now to the data obtained in the rapid load cycling runs performed on the Na-SWy-1 samples only in the final stages of the Stage 2 tests on this material. Typical data obtained for the Na-SWy-1 sample charged with wet Ar and wet CO2 are presented in Figures 4A,B. Both stress-strain curves indicate largely reversible mechanical behaviour, with best linear fits giving similar values of apparent stiffness modulus for the Ar and CO2 runs of 2.65 and 2.44 GPa respectively.
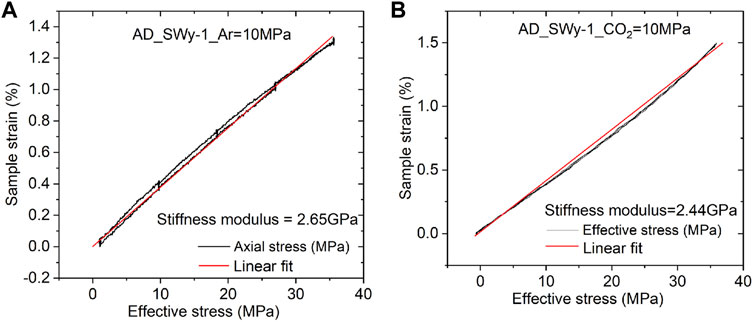
FIGURE 4. Effective stress versus sample strain measured in the rapid stress cycling runs performed on the AD SWy-1 sample at the end of Stage 2 experimentation. (A) Stress-strain data obtained in cycle performed using wet Ar. Best linear fit shows a constrained axial stiffness modulus of 2.65 GPa (B) Stress-strain data obtained in cycle performed using wet CO2. Best linear fit shows a constrained axial stiffness modulus of 2.44 GPa.
Stage 3 Data: Stepwise Cyclic Loading of VD Samples Saturated With Pure (dry) He and Pure (dry) CO2
Representative data obtained from the Stage 3 cyclic loading and unloading steps applied to both samples in the VD state shown in Figure 5 (see also Table 1). Figure 5A shows the history of pore fluid charging and stress stepping applied to the VD Ca-SAz-1 sample, while Figure 5B shows the corresponding changes in sample thickness as a function of elapsed experimental time. The Na-SWy-1 sample showed qualitatively very similar behaviour. Both exhibited a largely reversible and reproducible strain response to stress cycling when saturated with either dry He or dry CO2 (see Figure 5B). In addition, the samples expanded by a small amount (∼10 µm for the Ca-SAz-1 sample) when the pore fluid was switched from dry He to dry CO2 at a reference effective stress of ∼1.1 MPa and standard pore pressure of 10 MPa. These trends are typical for both samples tested in Stage 3 (VD) and are similar to those observed for AD samples (Stage 2). However, in contrast to the AD samples tested in Stage 2 employing wet pore fluids, the VD samples saturated with dry CO2 or dry He (Stage 3) show only very minor time-dependent compaction in response to changes in effective stress (c.f. Figures 5B versus 3B).
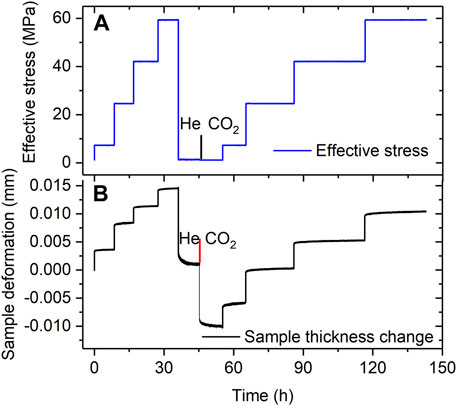
FIGURE 5. Representative data obtained in Stage 3 experiments performed on VD samples using pure (dry) He and CO2 (illustrated here for the VD Ca-SAz-1 sample). (A) Stress path employed in runs on VD sample SAz-1, sequentially charged with dry He and dry CO2 at a pressure of 10 MPa. (B) Corresponding sample thickness change versus experimental time. All data measured relative to the starting state in the Stage 3 experimental series.
Equilibrium Thickness Changes Versus Applied Effective Stress in Stage 2 and 3 Runs
Both smectite samples showed time-dependent strain development towards equilibration, following the stress steps applied in the Stage 2 stress cycling runs (AD samples plus wet fluid) and in the Stage 3 runs (VD samples, dry fluid). The stable equilibrium value in sample thickness change attained after each stress step, are listed in Table 1 and plotted as a function of effective stress in Figure 6 - for both samples and for the Stage 2 and 3 runs. These data show that equilibrium deformation of both samples was largely recoverable with only minor permanent strain accumulating during load cycling. This is evidenced by 1) the closely similar stress-displacement curves obtained in repeated loading runs performed on the same sample using the same pore fluid, regardless of pore fluid sequence (see Figure 6A, wet Ar_1 versus wet Ar_4), and 2) the minor hysteresis in sample thickness change observed in loading and unloading cycles performed with a given sample and fluid (e.g. Figures 6A–D). In addition, all experiments performed with CO2, dry or wet, yield lower values of equilibrium sample compaction than He and Ar under otherwise identical conditions (Figures 6A–D). This is observed at all stresses applied, and can alternatively be expressed as a relative expansion or swelling with respect to equivalent runs saturated with He or Ar. Notably, all data (Figure 6) show a decrease in magnitude of this relative swelling with increasing effective stress.
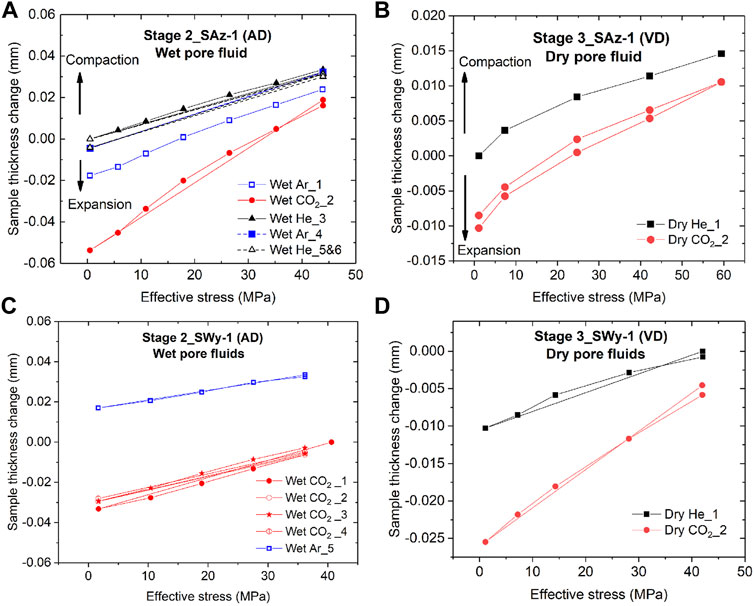
FIGURE 6. Equilibrium sample thickness change (hence strain) versus effective stress data obtained in the Stage 2 and Stage 3 stress cycling experiments. Note that Stage 2 experiments were conducted on AD samples saturated with wet pore fluids, while Stage 3 runs were conducted on VD samples saturated with dry pore fluids. (A) Stage 2 data for the initially AD Ca-SAz-1 sample. (B) Stage 3 data for the VD SAz-1 sample. (C) Stage 2 data for the initially AD Na-SWy-1 sample. (D) Stage 3 data for the VD Na-SWy-1 sample.
Cumulative Equilibrium Strain Versus Applied Effective Stress Data (Stage 2 and 3 Runs)
The cumulative equilibrium strains (
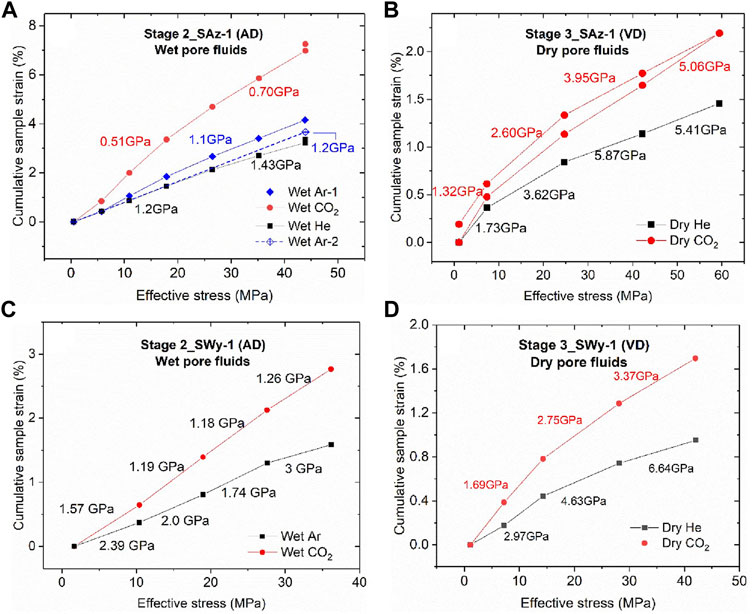
FIGURE 7. Cumulative compressive sample strains, measured at equilibrium per stress step, plotted against applied effective stresses, for the Stage 2 and 3 stress cycling experiments performed on both the SAz-1 and SWy-1 samples. Cumulative sample strains are calculated relative to sample thickness at the lowest effective stress applied, i.e. lowest effective stress in each plot. Values of cumulative strain measured at the same effective stress but in different loading cycles were averaged and only the mean value was plotted for a given stress. The apparent stiffness values (GPa) shown per stress interval are tangent moduli

TABLE 2. Apparent stiffness data for samples tested in Stages 2 and 3.
Discussion
The rapid load cycling data obtained here for the AD SWy-1 and SAz-1 samples before pore fluid addition (Stage 1), and in the presence of wet Ar and CO2 at 10 MPa (AD sample SWy-1, end Stage 2), demonstrated reversible near-linear stress-strain behaviour, implying a constrained elastic stiffness of the samples of ∼2.1 ± 0.5 GPa. This range narrowed to 2.44–2.65 GPa for the AD SWy-1 sample exposed to wet CO2 and wet Ar respectively, pointing to little effect of CO2 versus inert gas on elastic behaviour obtained in rapid loading. By contrast, our stepwise loading and unloading experiments performed on the AD Ca-SAz-1 and Na-SWy-1 montmorillonite discs using wet gases (Stage 2), and on the vacuum-dried samples using dry gases (Stage 3), showed that CO2 enhanced compressive strains and reduced sample stiffness in comparison with He and/or Ar, in the wet and dry equilibrium states. In this section, we analyze and discuss the effect of CO2 versus He and Ar on the mechanical response and stepwise equilibration behaviour of our pressed smectites discs. We go on to compare our equilibrium stress-strain data with the thermodynamic model for stress-strain-sorption processes developed by Hol et al. (2012) and Liu et al. (2016b). Finally, the implications of our findings for geological storage of CO2 are considered.
Effect of CO2 Versus He and Ar on Mechanical Behaviour of the SWy-1 and SAz-1 Samples
The present stepwise stress cycling data obtained using wet pore fluids (AD SWy-1 and SAz-1, Stage 2) and dry pore fluids (VD SWy-1 and SAz-1 samples, Stage 3) show that all samples exposed to CO2 attained larger equilibrium strains than those exposed to Ar and He, following any increment in effective stress (Figure 7). The apparent equilibrium stiffness for samples saturated with CO2 versus He and Ar was accordingly 20–65% lower (see Table 2 and Figure 7).
These effects of CO2 in the wet and dry states, mean that CO2 somehow caused excess compression (lower stiffness) relative to tests employing He or Ar. A possible role of changing hydration state on basal spacing (Schaef et al., 2012; Loring et al., 2013; Romanov, 2013) due to pore fluid switching, can be excluded by the fact that all pore fluids employed in the Stage 2 tests on initially AD samples contained similar water content (i.e. RH or activity), while the Stage 3 runs on VD samples used fully dry fluids. Other mechanisms potentially contributing to the axial strain response to effective stress steps include: 1) Permanent deformation associated with clay plate plasticity or kinking, crystallite cleavage or platelet rearrangement and alignment; 2) poroelastic strain (εel); and 3) time-dependent reversible deformation (εtd) due to reversible CO2 (and possibly H2O) expulsion from sorption sites in the interlayer structure, from surface sorption sites or intergranular pores as the aggregate deforms poroelastically. Each of these is considered below.
First, permanent deformation effects caused by CO2 can be ruled out because all stepwise loading and unloading experiments demonstrated almost completely recoverable behaviour, with little hysteresis in sample thickness change using CO2, He or Ar as pore fluid, wet or dry (see Figure 6). The small permanent strains and minor hysteresis effects that are seen are too small to explain the much larger sample thickness changes and cumulative compressive strains visible in experiments employing CO2 as opposed to He or Ar (Figures 6, 7). Taking into account that ∼2 µm of this is related to seal friction, permanent strains can only account for sample strains <0.3%. These values are well below the total strains measured for samples tested with CO2 and the amount of hysteresis in sample thickness changes appears no change with different pore fluid phases.
Second, we examine the possibility of CO2-induced reduction in elastic stiffness. This has been considered previously as a possible interpretation for lowering of the apparent uniaxial stiffness modulus of coal seen upon CO2 or CH4 sorption (Viete and Ranjith, 2006; Hol et al., 2014). However, this mechanism is not supported by the results of the fast load cycling runs performed on the SWy-1 sample at the end of Stage 2 testing (see Figure 4), which yielded almost the same values of axial stiffness for Ar and CO2 tests, specifically 2.65 and 2.44 GPa. To further examine if CO2 caused any change in time-independent sample response, we extracted the instantaneous strains (see Figure 2) developed, per stress increment applied, in the Stage 2 tests performed on the AD Ca-SAz-1 sample using wet He and wet CO2 as pore fluid. These stress-strain data are plotted in Figure 8. Though more bi-linear than linear (perhaps due to difficulty in identifying truly instantaneous strain), linear best fitting showed no significant difference between He runs and CO2 runs (∼2 versus 1.8 GPa – see Figure 8). On this basis, we infer that the CO2- induced decrease in apparent stiffness modulus seen in our (slow) incremental loading tests is not achieved through lowering of the samples’ elastic modulus.
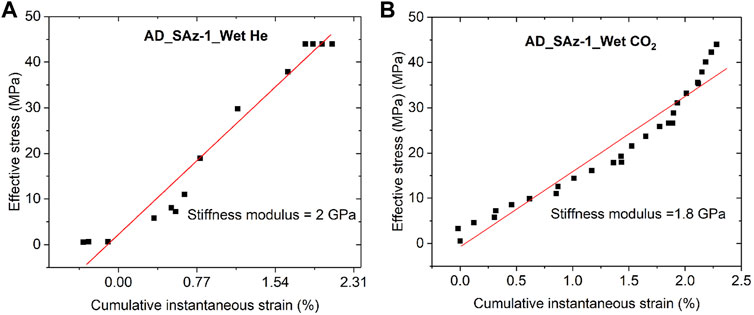
FIGURE 8. Cumulative instantaneous strain developed in the AD SAz-1 sample during Stage 2 stress stepping using (A) wet He and (B) wet CO2 as pore fluid. Best linear fits yield similar values of axial stiffness for both fluids used.
Rather, our results from the slow stepwise (equilibrated) load cycling runs, versus the fast loading experiments, imply that the reduction of apparent sample stiffness in the slow stepwise runs with CO2 likely involves a mechanism featuring reversible, time-dependent strain - at least in the wet Stage 2 experiments. This assertion is supported by the fact that the time-dependent and equilibrium strains occurring in the wet CO2 stepping tests on both sample types(Stage 2) are much larger than in the wet He and Ar tests, over the same increments in effective stresses.
Against this background, and given the reversibility (and variable degree of time-dependence) of deformation seen in our stress increment/decrement tests employing wet and dry gases (Stages 2 and 3), it seems likely that the relevant mechanism for the increased equilibrium strain response of samples tested with CO2, as opposed to He or Ar (Figures 6, 7), is one of stress-driven desorption of CO2 molecules (or H2O molecules or both). Alternatively stated, we infer that increasing compressive effective stress leads to desorption of CO2 (and/or H2O) molecules that were previously adsorbed and at equilibrium in the montmorillonite interlayer or surface sorption sites. Such behaviour is closely similar to the stress-driven desorption of CH4 and CO2 observed in coal exposed to these fluids/gases at fixed fluid pressure, and to the predictions of thermodynamic models for the effects of stress on sorption (Hol et al., 2011; Brochard et al., 2012; Hol et al., 2013; Espinoza et al., 2016; Liu et al., 2016a).
The strongly time-dependent deformation seen following stress steps imposed in all (wet) Stage 2 runs on both Na-SWy-1 and Ca-Saz-1 samples (Figure 3), in particular the wet CO2 runs, is similarly inferred to represent the approach to a new equilibrium state between clay, H2O and CO2 (or He/Ar). The much smaller degree of time-dependent deformation seen in the dry Stage 3 tests (Figure 5) may reflect a correspondingly smaller equilibration effect. Possible reasons for the observed time dependence, assuming zero interaction between our smectite samples and inert He and Ar (following Busch and Gensterblum, 2011), include a time-dependent release of CO2 and/or H2O from the sample due to reversible stress-induced desorption. However, since rates of CO2 and H2O sorption/desorption by montmorillonite are known to be rapid (Ferrage et al., 2007a; Giesting et al., 2012a; Giesting et al., 2012b; de Jong et al., 2014) and generally limited by transport of CO2 and H2O into or out of the sample (depending on sample size), we suggest that the time-dependent effects seen in our samples were likely controlled by their permeability to CO2, H2O, He, Ar or notably to mixed CO2 and H2O.
Relative Swelling Induced by CO2 Versus He/Ar
Our Stage 2 (wet) and Stage 3 (dry) stepping experiments performed on the SWy-1 and SAz-1 samples, in the initially AD (Stage 2) and VD (Stage 3) states, consistently showed sample expansion when the pore fluid was switched from Ar or He to CO2 under constant effective stress condition, thus indicating a swelling effect induced by exposure to CO2 (refer to Figures 3, 4). Relative swelling of samples tested with CO2 versus He or Ar is also evident in the equilibrium thickness change versus stress data derived from our Stage 2 (wet) and Stage 3 (dry) stepping tests on both samples, as reported in Figure 6. Being inert pore fluids, He and Ar do not intercalate into clay interlayer structures (Eltantawy and Arnold, 1972), and volumetric strain effects due to sorption of He and Ar onto clay platelet surfaces has been shown to be negligible (e.g. Giesting et al., 2012a; Heller and Zoback, 2014; Zhang et al., 2018). Therefore, we assume that sample thickness changes observed in the present He/Ar tests reflect the poroelastic behaviour of the sample in response to changes in effective stress. We further use the differences in equilibrium sample thickness changes measured between the CO2 and He/Ar tests to quantify the relative swelling deformation (in excess of poroelastic effects) due to CO2 exposure (Figure 6). These differences are listed as a function of corresponding applied effective stress in Table 1, for both the Ca-SAz-1 and Na-SWy-1 samples and for the Stages 2 (wet) and 3 (dry) experiments. All differential values of equilibrium sample thickness changes are negative (see Table 1), confirming a relative swelling or expansion effect caused by exposure to CO2 at 10 MPa pressure. The corresponding CO2-induced swelling strains were calculated as the ratio of the relative swelling deformation to the referential (initial) sample thickness (L0). The results are listed against applied effective stress in Table 1 and plotted versus applied effective stress in Figure 9.
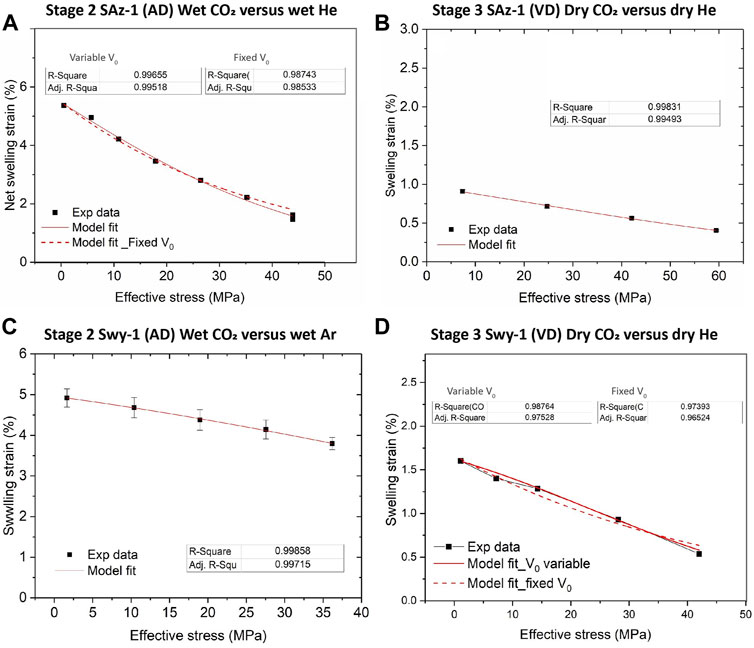
FIGURE 9. Experimentally derived data on relative swelling strain as a function of applied stress, as obtained for CO2 versus He and/or Ar in the Stage 2 (wet) and Stage 3 (dry) tests. Model fits using Eq. 2 are added (red curves) for comparison. (A) Stage 2 data for the initially AD Ca-SAz-1 sample. (B) Stage 3 data for the VD SAz-1 sample. (C) Stage 2 data for the initially AD Na-SWy-1 sample. (D) Stage 3 data for the VD Na-SWy-1 sample.
With reference to Figure 9, it is clear that the relative swelling strains calculated for AD samples saturated with wet CO2 versus wet Ar/He are substantial, i.e. 4%–5% for the AD Na-SWy-1 sample at effective axial stresses of 1.6–36.2 MPa, and ∼1.5–5.5% at 0.5–44.0 MPa effective stress for the AD SAz-1 sample. Lower swelling strains of 0.5–1.5% and 0.4–0.9% were recorded for vacuum-dried (VD) SWy-1 and SAz-1 samples tested with pure dry CO2 versus dry He/Ar. For all samples, relative swelling strain attained decreased consistently with increasingly applied effective stresses (Figure 9). This trend is again qualitatively consistent with that predicted by the thermodynamic model for single species gas/fluid adsorption by stressed solids put forward by Hol et al. (2011, 2012) and Liu et al. (2016b) (Brochard et al., 2012; cf. models by; Espinoza et al., 2014; Nikoosokhan et al., 2014; and Espinoza et al., 2016).
Experimental Results for CO2 Charged Samples Versus the Hol-Liu-Spiers Model
The Hol-Liu-Spiers model predicts that applied effective stress reduces the sorption capacity of solid sorbents, desorbing the sorbate and causing associated solid shrinkage/strain. To assess the applicability of this model to our results for the AD and VD SWy-1 and SAz-1 samples tested with wet and dry CO2 versus wet and dry He or Ar, we now fit the Hol-Liu-Spiers model to our experimental data on relative swelling strain versus effective stress (Figure 9), evaluating the quality of the fit and the physical viability of the parameter values obtained.
Summary of Hol-Liu-Spiers Model and Application to Present Experiments
The Hol-Liu-Spiers model presents an expression for the adsorbed concentration of a gas or fluid species in a stressed solid by obtaining the condition of equilibrium between the free gas or fluid at pressure P and its adsorbed equivalent. In doing so, the free energy of adsorption is modified to include a stress-strain work term associated with the Terzaghi effective stress supported by the solid, in addition to the pressure-volume work term found in conventional sorption models that assume identical hydrostatic pressure in both the solid and fluid phases (see Hol et al., 2012; Espinoza et al., 2014; Espinoza et al., 2016; Liu et al., 2016b). The model predicts that the equilibrium concentration (Cσ) of adsorbed molecules of a single sorbing species (mol/kg) in a solid adsorbent phase decreases with total hydrostatic stress (σn) applied to the solid according to the relation
Here Cs (mol/kg) is the adsorption site density in the adsorbent, θ is the adsorption site occupancy, ag is the activity of the sorbing gas/fluid at given pressure and temperature conditions,
To apply the above equation to describe our experimental results, and to assess its suitability, we must now assume 1) that the relative strains derived from our CO2 tests and the equivalent He/Ar tests are solely due to CO2 sorption/desorption, 2) that CO2 sorption takes place in both clay interlayer and platelet surface sites, 3) that the parameters in equation 1 are constant and apply to both sites with equal values, 4) that ad/de-sorption of CO2 and H2O are fully independent, and 5) that swelling/shrinkage due to CO2 sorption/desorption occurs in the axial loading direction only (i.e. normal to the expected alignment of [001] basal planes in the compacted samples). It then follows that the sorption-induced volumetric and axial swelling strain
Where
Fitting to Present Data
To assess its applicability, the above model was fitted to the experimental data on relative, CO2-induced swelling strain versus effective stress presented in Figure 9 (and Table 1), using a nonlinear fitting routine. Regression iterations were continued until the fit converged with a Chi-Sqr tolerance value of 10–9. The model fits to the experimental data are superimposed on Figure 9, and the key parameters derived from the fits are given in Table 3. The primary fitting parameters obtained from the regression were a1, a2 and V0. The adsorption site density (Cs) present per kilogram of sample material was derived from values of a1 and V0. The density of the adsorbed CO2 phase (ρads) was calculated from the partial molar volume V0 determined from our model fit, using ρads= M(CO2)/V0 where M(CO2) is the molar mass of CO2. The adsorbed concentration of CO2 (Cσ) was simultaneously obtained as a function of effective stress using Eqs 1, 2.
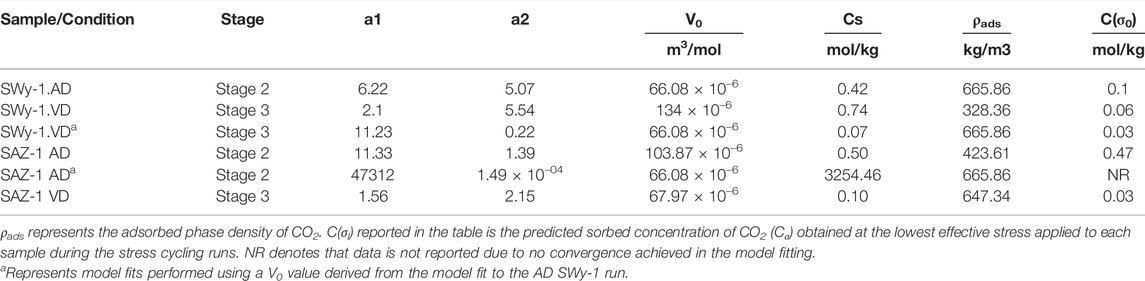
TABLE 3. Parameter values obtained from best fit of Hol-Liu-Spiers Model (Eq. 2) to our data for samples exposed to CO2 relative to He and/or Ar.
Comparison of Fit-Derived Parameters and Model Predictions With Previous Data
Fit-Derived Parameters and Sorbed Concentration Versus Previous Data
We now compare the parameter values obtained above with previous data on sorption site density (Cs), partial molar volume (V0) and density (ρads) of sorbed CO2 (Table 3). We also compare the present fitting results for the adsorbed concentration of CO2 (Cσ) under stressed conditions with previous information.
Several studies have reported the sorption capacity of smectite clays for CO2 at P-T conditions relevant to CO2 storage but at fully hydrostatic conditions, i.e. at zero effective stress. Schaef et al. (2014) reported that the CO2 sorption capacity of dry Ca-rich SWy-2 montmorillonite at 9 MPa CO2 pressure and 50°C was 0.92 mol/kg. Busch et al. (2008) reported ∼0.3 and ∼1.0 mol/kg CO2 excess sorption capacities for Na and Ca montmorillonites, respectively, at a CO2 pressure of 10 MPa and a temperature of 45°C. The sorbed CO2 concentrations (Cσ) at low effective stress (0.5–1.5 MPa), as derived from fitting our experimental data for Stages 2 (wet) and 3 (dry) to the Hol-Liu-Spiers model (Eq. 2), are 0.1 mol/kg for Na-SWy-1 montmorillonite and 0.47 mol/kg for Ca-SAz-1 montmorillonite (Table 3). These values are of the same order as reported in the above studies. However, the Cs value of 0.5 mol/kg for AD Ca-SAz-1 montmorillonite tested with wet CO2 versus wet He, as derived from the present model fit, is ∼50% lower than that reported for Ca-montmorillonite at similar P-T conditions by Busch et al. (2008) and Schaef et al. (2015). For AD Na-SWy-1 tested with wet gases, our Cs of 0.42 mol/kg is ∼35% of that reported by Busch et al. (2008). These discrepancies might be caused by the different compositions of the samples tested and/or different hydration states attained by the samples when charged with CO2. On the other hand, the discrepancies might result from the assumptions made in applying the Hol-Liu-Spiers model or from other factors not accounted for.
The values of ρads listed in Table 3 show similar densities for CO2 adsorbed by our AD SWy-1 and VD SAz-1 montmorillonite samples, respectively 665 kg/m3 and 647 kg/m3. These are slightly higher than the bulk density (ρbulk = 628 kg/m3) of free supercritical CO2 at the present experimental conditions (i.e. 10 MPa and 40°C), implying positive excess sorption. By contrast, our ρads values for VD SWy-1 and AD SAz-1 are much lower than ρbulk, being 326 kg/m3 and 424 kg/m3 and indicating negative excess sorption. Our ρads value for the VD SWy-1 and AD SAz-1 samples are, however, consistent with the densities (0.3–0.4 g/cm3) reported by Rother et al. (2013) for CO2 adsorbed in the interlayer space of Na montmorillonite with <1W hydration state. On the other hand, the ρbulk values obtained for the adsorbed CO2 phase in the AD SWy-1 and VD SAz-1 samples (Table 3) are closer to the density of H2O adsorbed in the interlayer of smectite clays (Fu et al., 1990). This suggests that H20 adsorption/desorption might occur alongside CO2 adsorption/desorption, contributing to the overall stress-strain-sorption behaviour observed for the AD SWy-1 and VD SAz-1 samples in the Stages 2 (wet) and 3 (dry) experiments respectively.
Model Predictions Versus Previous Experimental Data on Swelling Stress
We now apply the Hol-Liu-Spiers model, with the (He-relative) parameter values for VD SWy-1 material given in Row 2 of Table 3, to predict swelling stresses (σsw) developed in VD SWy-1 montmorillonite charged with dry CO2 at 10 MPa at 50°C under restricted swelling strain (εsw) conditions, i.e. under the same conditions and same restricted swelling strain condition as the swelling stress experiments reported in Zhang (2019) (see Table 4). First, we combine the Hol-Liu-Spiers model with Hook’s Law to establish a relationship between (total) restricted sample strain (
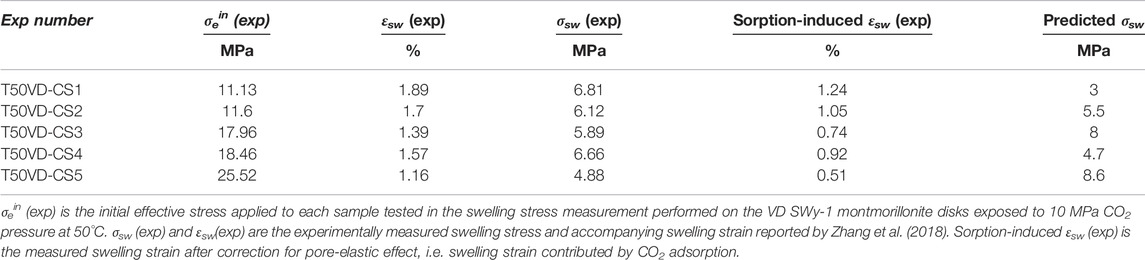
TABLE 4. Comparison of model prediction with experimental data on swelling stresses measured for VD SWy-1 samples exposed to CO2 pressure at 10 MP at 50°C (Zhang, 2019).
Here,
Model Evaluation
On the basis of the above, we can conclude that the Hol-Liu-Spiers model, applied with the additional assumption made here, can be fitted to accurately describe the relative CO2-induced swelling data, and its inverse dependence on applied effective stress, obtained in our Stage 2 (wet) and Stage 3 (dry) experiments on SWy-1 and SAz-1 montmorillonites (Figure 9). The parameter values obtained in the fitting procedure are in reasonable, broad agreement with values independently reported in the literature. Moreover, the model fits obtained for Na-Swy-1 material under VD conditions (see Table A1) adequately predict the CO2 exposure-induced swelling stresses measured for similar material at slightly higher temperatures (50°C) conditions in Zhang (2019) and Zhang (2019). In detail, however, there are a variety of inconsistencies between model and measurements, presumably reflecting inadequacies of the model assumptions, such as non-equivalence of interlayer and clay surface sorption sites, or interdependence and competition between CO2 and H2O uptake (Busch et al., 2008; see also; Giesting et al., 2012a; Loring et al., 2013; Loring et al., 2014; as reported by; Schaef et al., 2015). Future application of the Hol-Liu-Spiers model to describe stress-strain-sorption behaviour of smectite clays under CO2 storage conditions, in a more reliable and exact way, therefore requires extension of the model to take into account factors such as these.
Implications for CCS
CO2 Storage Capacity of Smectite-Rich Rocks Under Subsurface Stress and Temperature Conditions
Conventional CO2 sorption experiments conducted on montmorillonite clays at zero effective stress conditions (clay sample “immersed” in (Sc) CO2), show that sorbed concentrations at P-T conditions relevant for CO2 storage conditions are equivalent to bulk sorption capacities in the range of 380–900 mol/m3, assuming that the density of the clay rock is 2250 kg/m3 (Rother et al., 2013; Busch et al., 2016). This suggests that adsorption could provide storage capacity for CO2 in clays present in reservoir rocks and caprocks (Song and Zhang, 2013; Busch et al., 2016). Our fits of the Hol-Liu-Spiers model to our experimental data (see Figure 9 and Table 3) imply adsorbed concentrations of CO2 at low effective stress conditions that are consistent with this speculation. For example, the fit of Eq. 2 shown in Figure 9A implies Cσ = 0.47 mol/kg, equivalent to 1058 mol/m3, at a CO2 pressure of 10 MPa at 40°C under an effective axial stress of ∼0.5 MP. On the other hand, the results of model fitting show that the CO2 sorption capacity of both Na- and Ca-montmorillonites, decreases dramatically with increasing effective stress acting on the clay, especially under “wet” (RH ≈ 20%) conditions (Figures 9A,B). Indeed, from the fit of Eq. 2 in Figure 9A, the CO2 concentration sorbed by AD Ca-SAz-1 montmorillonite decreases from the above mentioned 0.47 mol/kg at an effective stress of 0.5MPa to 0.08 mol/kg at 40 MPa (see also Table 3). In addition, predictions using the Hol-Spiers-Liu model (Eq. 2) show a negative effect of increasing temperature on sorption capacity. Applying our model fits for typical upper crustal geothermal and lithostatic stress gradients implies that positive contributions to CO2 storage capacity by sorption onto smectites are likely to be prominent only at shallow depths, where the temperature and lithostatic stress are relatively low. For example, at depths up to 1.5–2 km (i.e. T ≤ 60°C and σe ≤ 25 MPa), bulk sorption capacities in the range of 500–1100 mol/m3 are predicted for smectite clays. However, at greater depth (e.g. >3 km), storage capacity contributed by uptake of CO2 by smectites will quickly become negligible, decreasing to <210 mol/m3, i.e. <20% of that at zero effective stress conditions. Investigations into these aspects of ScCO2-smectite interactions, at pressures, temperatures and water activities characteristic of geologic sequestration of CO2, in particular under the effect of overburden stresses, have only recently begun (Schaef et al., 2015; Zhang et al., 2018), and still need further study to achieve a better understanding.
Numerical Modelling of Caprock Integrity
Comparing the Hol-Liu-Spiers model with the swelling stress experiments presented in Zhang (2019), it gives a reasonable match to the experimental results. The model can therefore be used as a first quantification of the stress-strain-sorption relationships needed for numerical modelling to assess stress-strain-permeability changes when CO2 penetrates into a fractured clay-rich caprock or fault, i.e. at slow rates which do not change the clay hydration state. The coupling to fracture permeability changes can be achieved using an appropriate elastic (Hertzian-contact) relationship between stress and fracture apertures, of the type put forward by Walsh (1981) - see also Cook, 1992; Connell et al., 2010). Numerical modelling work of this type has already been performed in the context of enhanced coalbed methane extraction and CO2 storage in coal (Pan and Connell, 2007; Espinoza et al., 2013; Espinoza et al., 2014; Espinoza et al., 2016; Liu et al., 2017). In line with the conclusions drawn by Zhang et al. (2018) on CO2-induced swelling stress, the expectation is that penetration of CO2 into smectite-bearing clay caprocks and faults will in general cause swelling strains and swelling stresses that will tend to close migration pathways, unless desiccation of interlayer water occurs as described in Zhang (2019). To account for this in a numerical model, the present (Hol-Liu-Spiers) modelling approach would need to be extended to account for H2O sorption and desorption, alongside CO2.
Conclusion
We performed oedometric, stress-cycling experiments (i.e. laterally confined, uniaxial strain tests) on two pre-compressed discs (∼1 mm thick), respectively made of Na-SWy-1 and Ca-SAz-1 montmorillonite and initially equilibrated with He, Ar and CO2 at 10 MPa at a temperature of 40°C. The effective stress exerted on the samples was cycled at this temperature, both continuously and incrementally (stepwise), in the range from 0.5 to 1.7 to ∼43 MPa. The samples were pre-treated to obtain reference hydration states equilibrated with lab air humidity at 40°C (RH ≈ 20%) or else pre-dried under vacuum at temperatures designed to remove all interlayer water. The air-dried (AD) samples were tested using wet (RH = 20%) pore fluids while the vacuum-dried (VD) samples were tested with dry (pure) pore fluids. Our findings can be summarized as follows:
1. When subjected to rapid load cycling under atmospheric pressure or under Ar and CO2 pressure at 10MPa, the AD Na-SWy-1 and Ca-SAz-1 samples showed reversible and recoverable stress-strain behaviour indicating elastic behaviour with a constrained uniaxial stiffness modulus in the range of 1.3–3.1 GPa when in AD state and 1.7–6.3 GPa when in VD state. This behaviour observed is more or less independent of exposure to gas type, wet or dry.
2. When subjected to stepwise stress -cycling runs, the Na-SWy-1 and Ca-SAz-1 samples, tested in initially AD state in presence of wet pore fluids (Stage 2 tests) or in initially VD state using pure (dry) pore fluids (Stage 3 tests), showed a time-dependent approach to equilibrium after each stress step. The stress-strain behaviour measured for each stepwise equilibrium state was reproducible and reversible Both samples, tested in either the AD/wet or VD/dry state, exhibited 20–65% lower apparent stiffness, i.e. more strain, when equilibrated with CO2 as opposed He or Ar, showing that CO2-smectite interactions altered the equilibrium mechanical response of pre-pressed smectites.
3. The above effect of (wet and dry) CO2 on enhancing deformation or reducing the apparent stiffness of the present smectite discs is related to the increased equilibrium strain response of samples tested with CO2, as opposed to He or Ar. This is inferred to be induced by stress-driven desorption of CO2 molecules (or H2O molecules or both) from the smectite interlayer region and possibly from clay surface sites. Desorption occurs in a time-dependent manner, especially in the case of AD samples exposed to wet pore fluid (Stage 2), probably because of permeability limited expulsion of gas/water mixtures. Only minor time-dependence was observed for VD samples exposed to dry CO2 (Stage 3).
4. Equilibrium sample thickness changes measured in our Stage 2 (wet) and Stage 3 (dry) stress stepping experiments performed on both samples, show a relative swelling/expansion of the sample charged with CO2 as opposed to He/Ar, per stress step applied. The magnitude of the relative swelling strain consistently decreased with increasing applied stress, being in the range of 1.5–5.5% for AD samples charged with wet CO2, and only 0.5–1.8% relative swelling strain in the case of the VD samples exposed to dry CO2.
5. We fitted thermodynamics-based Hol-Liu-Spiers model (Hol et al., 2012; Liu et al., 2016a; Liu et al., 2016b) for stress-strain-sorption behaviour of a binary sorbent-sorbate system to the data on the relative swelling strain versus stress obtained in our experiments. The model fits described the experimental data accurately and yielded parameter values for CO2 sorption capacity, sorption site concentration and density of the adsorbed CO2 phase that are similar to independently determined values from other studies. Moreover, the fitted model predicts swelling stresses that favourably match those measured under restricted strain conditions. This suggests potential for applying such thermodynamically based models to describe and predict the stress-strain-sorption behaviour of smectite in the presence of varying CO2 and water activities, though the model has yet to be developed to consider the mutual interaction between CO2, H2O and smectites.
6. The present experimental results and model fits indicate that smectite-rich rocks have significant storage capacity for CO2 at shallow depths (up to 1.5–2 km) by means of CO2 sorption by the clay minerals. However, the sorption capacity of CO2 by smectite clays decreases with increasing Terzaghi effective stress and temperature, implying that the contribution of sorption by clay minerals to storage capacity is weakened by more than 80% with increasing burial depth beyond 3 km.
7. The model fitted to our data provides a first way of modelling stress-strain-sorption effects in smectite rich caprocks, and of modelling permeability changes due to penetration by CO2. However, the assumptions behind it are strong and improvements are needed to account for interdependence and competition between H2O and CO2 sorption/desorption.
Data Availability Statement
The raw data supporting the conclusions of this article will be made available by the authors, without undue reservation.
Author Contributions
The authors confirm contribution to the paper as follows: MZ carried out the experimental studies and data analysis and drafted the manuscript. CS supervised the project, participated in results interpretation and helped to draft the manuscript. JL contributed to the Modelling work. HZ participated in the result discussion and helped in manuscript preparation. All authors contributed to the final manuscript.
Conflict of Interest
The authors declare that the research was conducted in the absence of any commercial or financial relationships that could be construed as a potential conflict of interest.
Publisher’s Note
All claims expressed in this article are solely those of the authors and do not necessarily represent those of their affiliated organizations, or those of the publisher, the editors and the reviewers. Any product that may be evaluated in this article, or claim that may be made by its manufacturer, is not guaranteed or endorsed by the publisher.
Acknowledgments
The China Scholar Council and Shell International are acknowledged for funding the first author MZ and the research presented in this paper. Suzanne Hangx, Andreas Busch and Hendrik M. Wentinck are thanked for their valuable discussion during the course of this study. Eimert de Graaff, Gert Kastelein, Peter van Krieken and Floris van Oort are thanked for their technical support.
References
Alvarado, V., and Manrique, E. (2010). Enhanced Oil Recovery: An Update Review. Energies 3, 1529–1575. doi:10.3390/en3091529
Bachu, S. (2008). CO2 Storage in Geological Media: Role, Means, Status and Barriers to Deployment. Prog. Energy Combust. Sci. 34, 254–273.
Borden, D., and Giese, R. (2001). Baseline Studies of the Clay Minerals Society Source Clays: Cation Exchange Capacity Measurements by the Ammonia-Electrode Method. Clays Clay Minerals 49, 444–445. doi:10.1346/ccmn.2001.0490510
Brochard, L., Vandamme, M., Pellenq, R. J.-M., and Fen-Chong, T. (2012). Adsorption-Induced Deformation of Microporous Materials: Coal Swelling Induced by CO2–CH4 Competitive Adsorption. Langmuir 28, 2659–2670. doi:10.1021/la204072d
Busch, A., and Gensterblum, Y. (2011). CBM and CO2-ECBM Related Sorption Processes in Coal: A Review. Int. J. Coal Geol. 87, 49–71. doi:10.1016/j.coal.2011.04.011
Busch, A., Alles, S., Gensterblum, Y., Prinz, D., Dewhurst, D., Raven, M., et al. (2008). Carbon Dioxide Storage Potential of Shales. Int. J. Greenh. Gas Control 2, 297–308. doi:10.1016/j.ijggc.2008.03.003
Busch, A., Bertier, P., Gensterblum, Y., Rother, G., Spiers, C. J., Zhang, M., et al. (2016). On Sorption and Swelling of CO2 in Clays. Geomech. Geophys. Geo-energ. Geo-resour. 2, 111–130. doi:10.1007/s40948-016-0024-4
Chadwick, R. A., Zweigel, P., Gregersen, U., Kirby, G. A., Holloway, S., and Johannessen, P. N. (2004). Geological Reservoir Characterization of a CO2 Storage Site: The Utsira Sand, Sleipner, Northern North Sea. Energy 29, 1371–1381. doi:10.1016/j.energy.2004.03.071
Chipera, S. J., and Bish, D. L. (2001). Baseline Studies of the Clay Minerals Society Source Clays: Powder X-Ray Diffraction Analyses. Clays Clay Minerals 49, 398–409. doi:10.1346/ccmn.2001.0490507
Connell, L. D., Lu, M., and Pan, Z. (2010). An Analytical Coal Permeability Model for Tri-axial Strain and Stress Conditions. Int. J. Coal Geol. 84, 103–114. doi:10.1016/j.coal.2010.08.011
Cook, N. G. W. (1992). Natural Joints in Rock: Mechanical, Hydraulic and Seismic Behaviour and Properties Under Normal Stress. Int. J. Rock Mech. Min. Sci. Geomechan. Abstr. 29, 198–223. doi:10.1016/0148-9062(92)93656-5
Cygan, R. T., Romanov, V. N., and Myshakin, E. M. (2012). Molecular Simulation of Carbon Dioxide Capture by Montmorillonite Using an Accurate and Flexible Force Field. J. Phys. Chem. C 116, 13079–13091. doi:10.1021/jp3007574
Cygan, R. T., Daemen, L. L., Ilgen, A. G., Krumhansl, J. L., and Nenoff, T. M. (2015). Inelastic Neutron Scattering and Molecular Simulation of the Dynamics of Interlayer Water in Smectite Clay Minerals. J. Phys. Chem. C 119, 28005–28019. doi:10.1021/acs.jpcc.5b08838
de Jong, S. M., Spiers, C. J., and Busch, A. (2014). Development of Swelling Strain in Smectite Clays through Exposure to Carbon Dioxide. Int. J. Greenh. Gas Control 24, 149–161. doi:10.1016/j.ijggc.2014.03.010
Eltantawy, I. M., and Arnold, P. W. (1972). Adsorption of N-Alkanes by Wyoming Montmorillonite. Nat. Phys. Sci. 237, 123–125. doi:10.1038/physci237123a0
Espinoza, D. N., and Santamarina, J. C. (2017). CO2 Breakthrough-Caprock Sealing Efficiency and Integrity for Carbon Geological Storage. Int. J. Greenh. Gas Control 66, 218–229. doi:10.1016/j.ijggc.2017.09.019
Espinoza, D. N., Vandamme, M., Dangla, P., Pereira, J.-M., and Vidal-Gilbert, S. (2013). A Transverse Isotropic Model for Microporous Solids: Application to Coal Matrix Adsorption and Swelling. J. Geophys. Res. Solid Earth 118, 6113–6123. doi:10.1002/2013jb010337
Espinoza, D. N., Vandamme, M., Pereira, J.-M., Dangla, P., and Vidal-Gilbert, S. (2014). Measurement and Modeling of Adsorptive–Poromechanical Properties of Bituminous Coal Cores Exposed to CO2: Adsorption, Swelling Strains, Swelling Stresses and Impact on Fracture Permeability. Int. J. Coal Geol. 134-135, 80–95. doi:10.1016/j.coal.2014.09.010
Espinoza, D. N., Vandamme, M., Dangla, P., Pereira, J.-M., and Vidal-Gilbert, S. (2016). Adsorptive-mechanical Properties of Reconstituted Granular Coal: Experimental Characterization and Poromechanical Modeling. Int. J. Coal Geol. 162, 158–168. doi:10.1016/j.coal.2016.06.003
Ferrage, E., Lanson, B., Malikova, N., Plançon, A., Sakharov, B. A., and Drits, V. A. (2005). New Insights on the Distribution of Interlayer Water in Bi-hydrated Smectite from X-Ray Diffraction Profile Modeling of 00l Reflections. Chem. Mater. 17, 3499–3512. doi:10.1021/cm047995v
Ferrage, E., Kirk, C. A., Cressey, G., and Cuadros, J. (2007a). Dehydration of Ca-Montmorillonite at the Crystal Scale. Part 2. Mechanisms and Kinetics. Am. Mineral. 92, 1007–1017. doi:10.2138/am.2007.2397
Ferrage, E., Kirk, C. A., Cressey, G., and Cuadros, J. (2007b). Dehydration of Ca-Montmorillonite at the Crystal Scale. Part I: Structure Evolution. Am. Mineral. 92, 994–1006. doi:10.2138/am.2007.2396
Ferrage, E., Lanson, B., Sakharov, B. A., Geoffroy, N., Jacquot, E., and Drits, V. A. (2007c). Investigation of Dioctahedral Smectite Hydration Properties by Modeling of X-Ray Diffraction Profiles: Influence of Layer Charge and Charge Location. Am. Mineral. 92, 1731–1743. doi:10.2138/am.2007.2273
Fu, M. H., Zhang, Z., and Low, P. (1990). Changes in the Properties of a Montmorillonite-Water System during the Adsorption and Desorption of Water: Hysteresis. Clays Clay Minerals 38, 485–492. doi:10.1346/ccmn.1990.0380504
Gaus, I. (2010). Role and Impact of CO2-rock Interactions during CO2 Storage in Sedimentary Rocks. Int. J. Greenh. Gas Control 4, 73–89. doi:10.1016/j.ijggc.2009.09.015
Giesting, P., Guggenheim, S., Koster van Groos, A. F., and Busch, A. (2012a). Interaction of Carbon Dioxide with Na-Exchanged Montmorillonite at Pressures to 640bars: Implications for CO2 Sequestration. Int. J. Greenh. Gas Control 8, 73–81. doi:10.1016/j.ijggc.2012.01.011
Giesting, P., Guggenheim, S., Koster van Groos, A. F., and Busch, A. (2012b). X-Ray Diffraction Study of K- and Ca-Exchanged Montmorillonites in CO2 Atmospheres. Environ. Sci. Technol. 46, 5623–5630. doi:10.1021/es3005865
Greathouse, J. A., Hart, D. B., Bowers, G. M., Kirkpatrick, R. J., and Cygan, R. T. (2015). Molecular Simulation of Structure and Diffusion at Smectite–Water Interfaces: Using Expanded Clay Interlayers as Model Nanopores. J. Phys. Chem. C 119, 17126–17136. doi:10.1021/acs.jpcc.5b03314
Heller, R., and Zoback, M. (2014). Adsorption of Methane and Carbon Dioxide on Gas Shale and Pure Mineral Samples. J. Unconv. Oil Gas Resour. 8, 14–24. doi:10.1016/j.juogr.2014.06.001
Hol, S., Gensterblum, Y., and Massarotto, P. (2014). Sorption and Changes in Bulk Modulus of Coal - Experimental Evidence and Governing Mechanisms for CBM and ECBM Applications. Int. J. Coal Geol. 128, 119–133.
Hol, S., and Spiers, C. J. (2012). Competition between Adsorption-Induced Swelling and Elastic Compression of Coal at CO2 Pressures up to 100MPa. J. Mech. Phys. Solids 60, 1862–1882. doi:10.1016/j.jmps.2012.06.012
Hol, S., Peach, C. J., and Spiers, C. J. (2011). Applied Stress Reduces the CO2 Sorption Capacity of Coal. Int. J. Coal Geol. 85, 128–142. doi:10.1016/j.coal.2010.10.010
Hol, S., Peach, C. J., and Spiers, C. J. (2012). Effect of 3-D Stress State on Adsorption of CO2 by Coal. Int. J. Coal Geol. 93, 1–15. doi:10.1016/j.coal.2012.01.001
Hol, S., Zoback, M. D., and Spiers, C. J. (2013). “Role of Adsorption in the Creep Behavior of Coal and Shale,” in Poromechanics V: Proceedings of the Fifth Biot Conference on Poromechanics (ASCE), 668–677.
Holloway, S. (1997). An Overview of the Underground Disposal of Carbon Dioxide. Energy Convers. Manag. 38, S193–S198. doi:10.1016/s0196-8904(96)00268-3
Ilton, E. S., Schaef, H. T., Qafoku, O., Rosso, K. M., and Felmy, A. R. (2012). In Situ X-ray Diffraction Study of Na+ Saturated Montmorillonite Exposed to Variably Wet Super Critical CO2. Environ. Sci. Technol. 46, 4241–4248. doi:10.1021/es300234v
Jaynes, W. F., and Bigham, J. (1986). Multiple Cation-Exchange Capacity Measurements on Standard Clays Using a Commercial Mechanical Extractor. Clays Clay Minerals 34, 93–98. doi:10.1346/ccmn.1986.0340112
Kaldi, J., Daniel, R., Tenthorey, E., Michael, K., Schacht, U., Nicol, A., et al. (2013). Containment of CO2 in CCS: Role of Caprocks and Faults. Energy Proc. 37, 5403–5410. doi:10.1016/j.egypro.2013.06.458
Liu, J., Peach, C. J., and Spiers, C. J. (2016a). Anisotropic Swelling Behaviour of Coal Matrix Cubes Exposed to Water Vapour: Effects of Relative Humidity and Sample Size. Int. J. Coal Geol. 167, 119–135. doi:10.1016/j.coal.2016.09.011
Liu, J., Spiers, C. J., Peach, C. J., and Vidal-Gilbert, S. (2016b). Effect of Lithostatic Stress on Methane Sorption by Coal: Theory vs. Experiment and Implications for Predicting Iin-Ssitu Coalbed Methane Content. Int. J. Coal Geol. 167, 48–64. doi:10.1016/j.coal.2016.07.012
Liu, J., Fokker, P. A., and Spiers, C. J. (2017). Coupling of Swelling, Internal Stress Evolution, and Diffusion in Coal Matrix Material during Exposure to Methane. J. Geophys. Res. Solid Earth 122, 844–865. doi:10.1002/2016jb013322
Loring, J. S., Thompson, C. J., Wang, Z., Joly, A. G., Sklarew, D. S., Schaef, H. T., et al. (2011). In Situ Infrared Spectroscopic Study of Forsterite Carbonation in Wet Supercritical CO2. Environ. Sci. Technol. 45, 6204–6210. doi:10.1021/es201284e
Loring, J. S., Schaef, H. T., Turcu, R. V. F., Thompson, C. J., Miller, Q. R. S., Martin, P. F., et al. (2012). In Situ Molecular Spectroscopic Evidence for CO2 Intercalation into Montmorillonite in Supercritical Carbon Dioxide. Langmuir 28, 7125–7128. doi:10.1021/la301136w
Loring, J. S., Schaef, H. T., Thompson, C. J., Turcu, R. V., Miller, Q. R., Chen, J., et al. (2013). Clay Hydration/dehydration in Dry to Water-Saturated Supercritical CO2: Implications for Caprock Integrity. Energy Procedia 37, 5443–5448. doi:10.1016/j.egypro.2013.06.463
Loring, J. S., Ilton, E. S., Chen, J., Thompson, C. J., Martin, P. F., Bénézeth, P., et al. (2014). In Situ Study of CO(2) and H(2)O Partitioning between Na-Montmorillonite and Variably Wet Supercritical Carbon Dioxide. Langmuir 30, 6120–6128. doi:10.1021/la500682t
Madejová, J., and Komadel, P. (2001). Baseline Studies of the Clay Minerals Society Source Clays: Infrared Methods. Clays Clay Minerals 49, 410–432. doi:10.1346/ccmn.2001.0490508
Mermut, A. R., and Lagaly, G. (2001). Baseline Studies of the Clay Minerals Society Source Clays: Layer-Charge Determination and Characteristics of Those Minerals Containing 2: 1 Layers. Clays Clay Minerals 49, 393–397. doi:10.1346/ccmn.2001.0490506
Michot, L. J., Ferrage, E., DelvilleJimenez-Ruiz, M., and Jiménez-Ruiz, M. (2016). Influence of Layer Charge, Hydration State and Cation Nature on the Collective Dynamics of Interlayer Water in Synthetic Swelling Clay Minerals. Appl. Clay Sci. 119, 375–384. doi:10.1016/j.clay.2015.11.005
Moore, D. M., and Hower, J. (1986). Ordered Interstratification of Dehydrated and Hydrated Na-Smectite. Clays Clay Minerals 34, 379–384. doi:10.1346/ccmn.1986.0340404
Nikoosokhan, S., Vandamme, M., and Dangla, P. (2014). A Poromechanical Model for Coal Seams Saturated with Binary Mixtures of CH4 and CO2. J. Mech. Phys. Solids 71, 97–111. doi:10.1016/j.jmps.2014.07.002
Nooraiepour, M., Haile, B. G., and Hellevang, H. (2017). Compaction and Mechanical Strength of Middle Miocene Mudstones in the Norwegian North Sea – the Major Seal for the Skade CO2 Storage Reservoir. Int. J. Greenh. Gas Control 67, 49–59. doi:10.1016/j.ijggc.2017.10.016
Pan, Z., and Connell, L. D. (2007). A Theoretical Model for Gas Adsorption-Induced Coal Swelling. Int. J. Coal Geol. 69, 243–252. doi:10.1016/j.coal.2006.04.006
Prost, R., Koutit, T., Benchara, A., and Huard, E. (1998). State and Location of Water Adsorbed on Clay Minerals: Consequences of the Hydration and Swelling-Shrinkage Phenomena. Clays Clay Minerals 46, 117–131. doi:10.1346/ccmn.1998.0460201
Romanov, V. N. (2013). Evidence of Irreversible CO2 Intercalation in Montmorillonite. Int. J. Greenh. Gas Control 14, 220–226. doi:10.1016/j.ijggc.2013.01.022
Rother, G., Ilton, E. S., Wallacher, D., Hauβ, T., Schaef, H. T., Qafoku, O., et al. (2013). CO2 Sorption to Subsingle Hydration Layer Montmorillonite Clay Studied by Excess Sorption and Neutron Diffraction Measurements. Environ. Sci. Technol. 47, 205–211. doi:10.1021/es301382y
Schaef, H. T., Ilton, E. S., Qafoku, O., Martin, P. F., Felmy, A. R., and Rosso, K. M. (2012). In Situ XRD Study of Ca2+ Saturated Montmorillonite (STX-1) Exposed to Anhydrous and Wet Supercritical Carbon Dioxide. Int. J. Greenh. Gas Control 6, 220–229. doi:10.1016/j.ijggc.2011.11.001
Schaef, H. T., Davidson, C. L., Owen, A. T., Miller, Q. R. S., Loring, J. S., Thompson, C. J., et al. (2014). CO2 Utilization and Storage in Shale Gas Reservoirs: Experimental Results and Economic Impacts. Energy Procedia 63, 7844–7851. doi:10.1016/j.egypro.2014.11.819
Schaef, H. T., Loring, J. S., Glezakou, V.-A., Miller, Q. R. S., Chen, J., Owen, A. T., et al. (2015). Competitive Sorption of CO2 and H2O in 2:1 Layer Phyllosilicates. Geochim. Cosmochim. Acta 161, 248–257. doi:10.1016/j.gca.2015.03.027
Song, J., and Zhang, D. (2013). Comprehensive Review of Caprock-Sealing Mechanisms for Geologic Carbon Sequestration. Environ. Sci. Technol. 47, 9–22. doi:10.1021/es301610p
Suter, J. L., Sprik, M., and Boek, E. S. (2012). Free Energies of Absorption of Alkali Ions onto Beidellite and Montmorillonite Surfaces from Constrained Molecular Dynamics Simulations. Geochim. Cosmochim. Acta 91, 109–119. doi:10.1016/j.gca.2012.04.060
Viete, D. R., and Ranjith, P. G. (2006). The Effect of CO2 on the Geomechanical and Permeability Behaviour of Brown Coal: Implications for Coal Seam CO2 Sequestration. Int. J. Coal Geol. 66, 204–216. doi:10.1016/j.coal.2005.09.002
Walsh, J. B. (1981). Effect of Pore Pressure and Confining Pressure on Fracture Permeability. Int. J. Rock Mech. Min. Sci. Geomech. Abstr. 18, 429–435. Elsevier. doi:10.1016/0148-9062(81)90006-1
Zhang, M., de Jong, S. M., Spiers, C. J., Busch, A., and Wentinck, H. M. (2018). Swelling Stress Development in Confined Smectite Clays through Exposure to CO2. Int. J. Greenh. Gas Control 74, 49–61. doi:10.1016/j.ijggc.2018.04.014
Zhang, M. (2019). Stress-strain-sorption Behaviour and Permeability Evolution in Clay-Rich Rocks under CO2 Storage Conditions. Utrecht Studies in Earth Sciences 188, 217.
Appendix 1 Preparation of Water-Bearing/Wet Pore Fluid
Pore fluids employed in all tests on AD samples were prepared having a partial water vapor pressure (RH∼20%) equivalent to that characterizing the AD samples in the pre-equilibration stage. This was necessary to minimize any desiccation effects induced by flow of pore fluids through the samples. The wet pore fluid was produced following the steps below:
1. Connect the ISCO pump to a flask containing saturated Mg(NO3)2 solution with excess salt and the solid, solution and vapor phases present.
2. Adjust the ISCO to operate in constant volume mode. Briefly evacuate the ISCO pump plus flask system, and then isolate the system from the external atmosphere for ∼5 h. In this procedure, the pump and pipes of the pore fluid system are primed with water vapor pressure equivalent to RH≈20%.
3. Close the connection between the pore fluid system and the flask, then introduce the target pore fluid from the gas cylinder into the ISCO pump at 10MPa using a regulator mounted at the outlet of the gas cylinder. Note that pore fluid introduction was done in multiple steps via a “trial and error” method. In each step, a small amount of fluid at room temperature (∼22°C) and ∼10 MPa was injected into the pump (heated at 40°C). The fluid pressure in the pump changed with time due to thermal expansion, and was monitored using a pressure transducer attached to the ISCO pump. When the measured (total) pressure reached a stable value it was further incremented until the target pressure of 10 MPa) was attained.
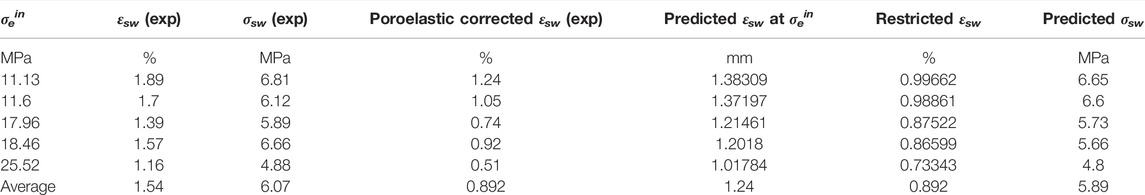
TABLE A1. Comparison of model prediction with experimental data on swelling stresses measured by Zhang (2019) for VD SWy-1 samples exposed to CO2 pressure at 10 MP at 50°C
Keywords: CO2 geological storage, CO2 sorption, swelling clay, CO2 -smectite interactions, stress-strain-sorption
Citation: Zhang M, Spiers CJ, Liu J and Zhou H (2022) Stress-Strain-Sorption Behaviour of Smectites Upon Exposure to Dry and Wet CO2. Front. Earth Sci. 10:911247. doi: 10.3389/feart.2022.911247
Received: 02 April 2022; Accepted: 25 April 2022;
Published: 20 May 2022.
Edited by:
Lidong Dai, Chinese Academy of Sciences, ChinaCopyright © 2022 Zhang, Spiers, Liu and Zhou. This is an open-access article distributed under the terms of the Creative Commons Attribution License (CC BY). The use, distribution or reproduction in other forums is permitted, provided the original author(s) and the copyright owner(s) are credited and that the original publication in this journal is cited, in accordance with accepted academic practice. No use, distribution or reproduction is permitted which does not comply with these terms.
*Correspondence: Miao Zhang, em1jdW10YkBxcS5jb20=