 YuanChang Dong
 GuoPing Li2,3*
- 1Institute of Plateau Meteorology, China Meteorological Administration (CMA)/ Heavy Rain and Drought-Flood Disaster in Plateau and Basin Key Laboratory of Sichuan Province, Chengdu, China
- 2School of Atmospheric Sciences, Chengdu University of Information Technology, Chengdu, China
- 3Collaborative Innovation Center on Forecast and Evaluation of Meteorological Disasters, Nanjing University of Information Science and Technology, Nanjing, China
- 4Chengdu Academy of Environment Sciences, Chengdu, China
During 29–30 UTC June 2013, a severe rainfall event with a long and narrow region of strong precipitation occurred in the central of the Sichuan Basin (SCB). Under the combined influence of a Tibetan Plateau vortex (TPV) and a southwest vortex (SWV), two banded strong radar echoes existed and developed simultaneously over the SCB. The analysis reveals that the vertical wind shear (VWS) caused by the circulations of the TPV and the SWV was the dominant factor of the formation and development of the radar echoes over the SCB. During the coupling period of the two vortices, the SWV provided abundant water vapor at the middle and lower levels over the SCB and the updrafts of the two vortices break through that formed deep convection, which made the precipitation in the SCB reach the maximum intensity. The enhancement of horizontal vorticity caused by the baroclinicity and the secondary circulation related to the two vortices created conditions for the formation of the double-band radar echoes. The matching degree of water vapor and heating conditions accompanying the circulation of the two vortices could affect the developments of convective storms and precipitation.
1 Introduction
The formation and development of Tibetan plateau vortices and southwest vortices (TPSWVs), as well as the rainstorms and flood disasters caused by them, have always been an important topic concerned by meteorologists. Tao (1980) earlier revealed that typhoons, fronts, and cyclonic vortices (mainly the Tibetan Plateau vortices (TPVs) and the southwest vortices (SVWs) (Xiao et al., 2017)) moving eastward from the Tibetan Plateau and its downstream areas were the main triggering systems of extreme heavy precipitation events in China. TPSWVs might cause high-impact and severe weather events, such as heavy rains, thunderstorms, and windstorms over the Sichuan Basin (SCB) and its surrounding areas (Luo et al., 1993; Qian and Jiao, 1997). After years of research, many aspects about TPSWVs have been recognized, including the weather situation of rainstorms caused by the TPVs (Gao and Yu, 2017), water vapor conditions of TPSWVs (Pan et al., 2011; Yue and Li, 2016), the role of Mesoscale Convective Systems (MCSs) in the rainstorms caused by SVWs (Hu et al., 2014), the role of Tibet plateau shear line in the formation of the rainstorms caused by SVWs (Hao et al., 2016), and the energy budget of TPVs (Dong and Li, 2015; Fu et al., 2015). The Tibetan plateau vortex (TPV) and the southwest vortex (SWV) usually developed independently, but there were also weather events in which they appeared simultaneously over the SCB or its surrounding areas. Chen et al. (2004) and Zhao and Wang (2010) studied the interaction mechanism when the two vortices appeared simultaneously and pointed out that the coupling of the two vortices was an important inducement to trigger heavy precipitation in the SCB. Zhou et al. (2014) used radar mosaic reflectivity data to analyze the characteristics of radar echoes in the SCB under the influence of a TPV and a SWV, which helped us to further understand the relationship between the two vortices and the formation and development of mesoscale convective systems.
Heavy rains are the main meteorological disaster caused by TPVs or SVWs. Over the course of about 50 years of research, meteorologists tried lots of methods including theoretical derivation (Yeh and Gao, 1979), weather analysis (Huang et al., 2010; Zhao et al., 2011), numerical simulation (Liu and Li, 2014), multi-source data (Du et al., 2013; Li and Deng, 2013; Ni et al., 2017), and multi-diagnosis (Huang et al., 2011; Song and Li, 2016) to establish the relationships between the development of the two vortices and heavy rains in order to make breakthroughs in the prediction of related heavy precipitation. Precipitation regions caused by TPVs or SVWs were more frequent on the east or southeast side of the vortex (Li et al., 2015). Jiang et al. (2014) and Yang et al. (2017) found that heavy rains mostly appeared in the right front side of the forward direction of the vortex center mainly because the positive vorticity advection transported by the vortex to this region stimulated the upward motion of the airflow. However, in the actual forecast, the uncertainty of the region and intensity of precipitation caused by a vortex is great. The main reason for this situation is that we do not know enough about the relationships between the occurrence and development of the two vortices and the convective systems in their circulation. Chen et al. (2011) established the connection between MCSs and a SWV by using a numerical simulation method, which promoted our understanding of the interaction between the SWV and MCSs. Nevertheless, little is known about how the variation of convective intensity, distribution characteristics, and development are related to the TPSWVs.
The strong convective precipitations caused by the TPSWVs are closely related to the development of mesoscale convective systems in the circulation of the two vortices. In recent years, with the development of the new generation weather radar network of China Meteorological Administration (CMA), we have made lots of achievements in the study of mesoscale convective systems. In many research conclusions, it has become a consensus that environmental vertical wind shear (VWS) plays an important role in the occurrence and development of convective systems. Zhang et al. (2012) believed that among the environmental elements conducive to the occurrence of convective systems, the convective available potential energy (CAPE) only needed to reach moderate intensity, but large deep VWS was required. Klemp (1987) used numerical simulation methods to verify that VWS was the main source of vorticity in the early stage of convective systems development, and also the important dynamic factors for the splitting and renewal of convective storms during the middle and late development periods.
Previous studies have pointed out the distribution of precipitation region and given the mechanism explanation when the SWV or the TPV developed alone. As introduced above, precipitation regions influenced by the SWV or the TPV were closely related to its circulation. However, when the two vortices were coupled, the intensity and distribution of precipitation would change significantly. Considering that the interaction of the circulations of the vortices during the coupling period might be an important factor leading to the change of precipitation region and the development of MCSs was closely related to the enhancement of rainfall intensity, the relationship between the two vortices and convective systems was established by VWS based on a strong precipitation event over the SCB, and the effects of the atmospheric dynamic and thermodynamic fields of the two vortices and terrain were investigated. The aim of our work is to reveal the new characteristics of the location of precipitation region when the two vortices were coupled and the mechanism that causes such new characteristics. The results will provide reference for the prediction of strong precipitation of the two vortices. The data and methods utilized in this work are introduced in Section 2. The relationships between the two vortices’ circulations and the convective storms over the SCB are analyzed in Section 3. In Section 4, we analyze the new characteristics, formation and development mechanism, and fine radar echo structures of precipitation related to the two vortices. A summary and discussion are given in Section 5.
2 Data and methods
The data used and their functions mainly include:
1) The geographical location and motion path of the two vortices and the characteristic of the winds, temperature, and humidity were analyzed by using the ERA5 reanalysis hourly data (Hersbach et al., 2020) with a horizontal resolution of 0.5°*0.5° during June–July 2013.
2) The structure and variation of radar echoes were analyzed by using the radar mosaic reflectivity (RMR) data and the radar mosaic combination reflectivity (RMCR) data with a horizontal resolution of 1 km*1 km and 6 min temporal interval. The RMR data were derived from raw data observed by four CMA operational S-band (10 cm) Doppler radars located at Mianyang (MY), Chengdu (CD), Nanchong (NC), and Yibin (YB) (Figure 1) during 28–30 UTC June 2013. The RMR data could make up for the limitation of single radar detection range (Xiao and Liu, 2006) and improve the data quality in the complex terrain area so that it is more suitable for the analysis and research of mesoscale weather systems in a larger spatio-temporal range.
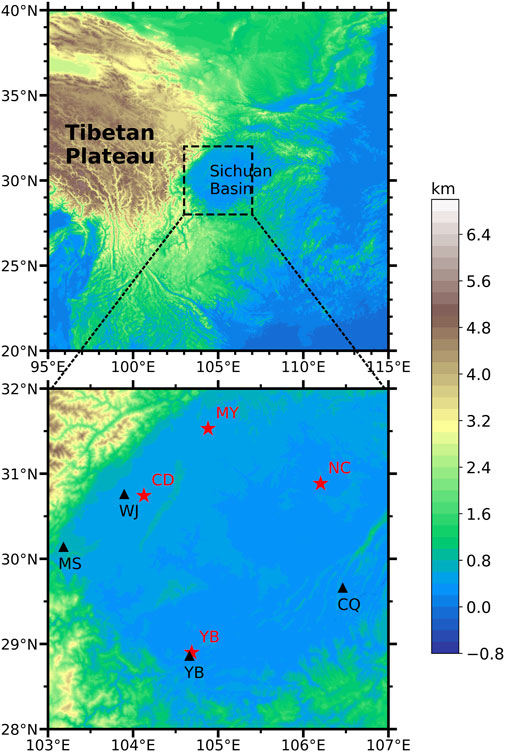
FIGURE 1. Observations used in this study and the topographic feature of the SCB and its surrounding areas. The location of the sounding sites (WJ, MS, YB, and CQ) is marked by the black triangles. The locations of selected ground-based S-band Doppler radar sites (MY, CD, YB, and NC) are marked by the red asterisks. The locations of AWS sites are too many (about 1,500 sites) to be marked. The area highlighted by the dotted box is the DWCPO.
3) The intensity and distribution of precipitation were studied by using the data observed by the automatic weather system (AWS) with more than 1,500 stations in SCB and its surrounding areas during 28–30 UTC June 2013.
4) The data observed by sounding sites located at Wenjiang (WJ), Mingshan (MS), YB, and Chongqin (CQ) (Figure 1) on 29 UTC June 2013 were used to analyze the atmospheric stratification for the formation and development of the convective systems over the SCB. The intensive observation experiment of the southwest vortex in Sichuan Province was conducted by the Institute of Plateau Meteorology from late June to early August.
VWS is an important condition for the formation and development of mesoscale convective systems. The main activity heights of TPVs and SVWs are 500 hPa and 700 hPa, respectively. The change of the position of the two vortices can form VWS zones with different intensity and distribution over the SCB. Therefore, the magnitude of VWS is an important connection between the development of the two vortices and the formation and development of convective systems over the SCB.
where VWSV1 and VWSV2 are the magnitude of the VWS vector of 500–700 hPa and 400–850 hPa, respectively (unit: m/s), and
VWSV1 and VWSV2 were used to measure the influence of the two vortices on the magnitude and distribution of VWS and the depth of VWS over the domain where convection and precipitation occurred (DWCPO). As can be seen from Figure 1, DWCPO is a sub-region of the SCB.
3 Influence of the two vortices’ circulations on the occurrence and development of convection over the SCB
3.1 Overview of the two vortices
At 0000 UTC 29 June 2013, the TPV was generated in Gande County, Guoluo Tibetan Autonomous Prefecture, Qinghai Province. Meanwhile, the SWV was generated in Daocheng County, Ganzi Prefecture, Sichuan Province. After the formation of the two vortices, they moved towards the SCB. In the following 12 h, the positions of the two vortices experienced a process of rapid proximity from distance to coupling of their circulations over the SCB. At 1800 UTC 29 June, the intensity of the SWV gradually weakened and disappeared in the northern part of the SCB 12 h later. Compared with the SWV, the TPV stayed over the SCB for a long time. The center of the TPV entered the SCB at 1800 UTC 30 June and kept wandering in the central and northern part of the SCB. In the following 48 h, its position moved less, and disappeared to the northern part of the SCB at 0000 UTC 2 July (Figure 2). Considering the research focus of this paper and the integrity of observation data, the research period was determined as the period of simultaneous existence of the two vortices (from 0000 UTC 28 June to 0600 UTC 30 June 2013).
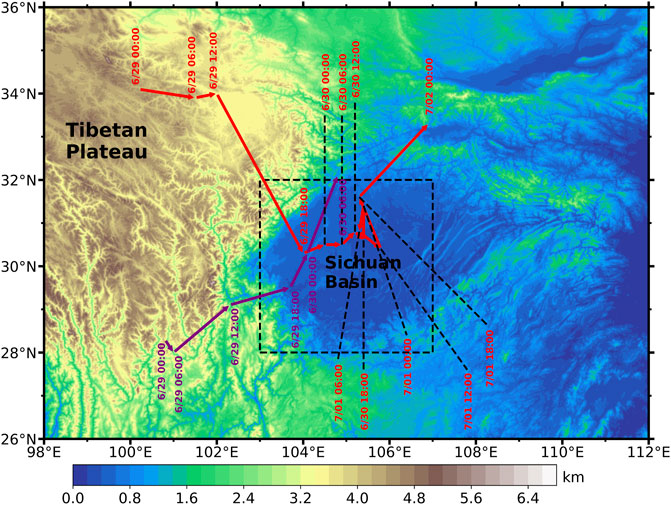
FIGURE 2. Topographic feature of the SCB and its surroundings and motion path of the two vortices (the red arrows represent the TPV motion path at 500 hPa and the purple arrows represent the SWV motion path at 700 hPa). The area highlighted by the dotted box indicates the DWCPO.
3.2 Influence of the two vortices’ development on VWS over the SCB
From June to July, southerly winds prevailed at 700 hPa and westerly winds prevailed at 500 hPa over the SCB and its surrounding areas, and there was a cyclonic transition from northerly winds to southerly winds over the SCB (figures omitted). Therefore, an obvious region of VWS was formed in the central and western parts of the SCB, with a magnitude of about 7.5 m/s. When the VWS reached a certain intensity, it would become a favorable factor for genesis of convective systems over the SCB.
At 0000 UTC 29 June 2013, the TPV was initially generated, and the westerly airflow to the south of the TPV center was obviously strengthened. The westerly winds showed cyclonic transition from the west side to the east of the SCB at 500 hPa. The direction of the changed winds tended to be consistent with the direction of the southerly winds at 700 hPa, which was not conducive to the enhancement of VWSV1 over the SCB (Figure 3B). Hence, the increase of VWSV1 over the DWCPO was mainly due to the increase of wind velocity at 500 hPa and 700 hPa. At 0000 UTC 29 June, the centers of the two vortices moved to 102°E. At this time, winds at 500 hPa did not increase significantly over the DWCPO, but the cyclonic shift of winds direction moved east to 106°E, which made the VWSV1 over the DWCPO was significantly strengthened only by the larger angle of the wind vectors between 500 hPa and 700 hPa. The maximum VWSV1 increased to about 12.5 m/s, and the region with large value of the VWSV1 showed an obvious north-south distribution (Figure 3C). At 1200 UTC 29 June, the centers of the two vortices moved rapidly toward the SCB, and the circulation fields of the two vortices tended to be coupled, resulting in the gradual decrease of VWSV1 over the DWCPO (Figure 3D).
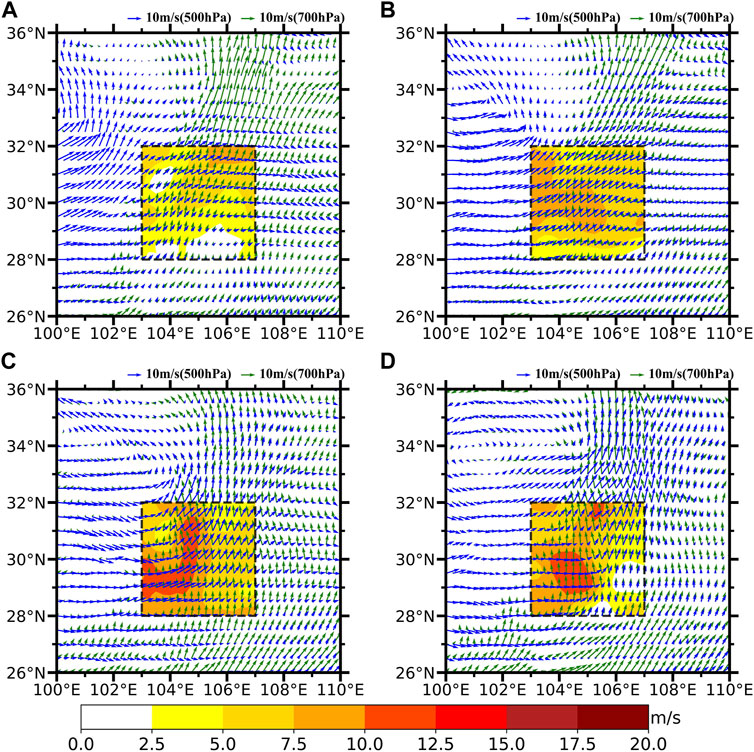
FIGURE 3. (A–D) Horizontal winds (m/s; the blue vectors represent winds at 500 hPa and the green vectors represent winds at 700 hPa) and VWSV1 (m/s; color shading) over the DWCPO from 1800 UTC 28 June to 1200 UTC 29 June 2013 at 6-h intervals. The inserted boxes (dotted boxes) indicate the DWCPO.
Based on the formation time and position changes of the two vortices, the research period could be divided into stages Ⅰ, Ⅱ, and Ⅲ, as indicated in Figure 4. In stage Ⅰ, before the two vortices generated, large average VWSV2 and small average VWSV1 were observed over DWCPO (from 0000 UTC 28 June to 0000 UTC 29 June 2013). The two vortices moved towards the SCB, and the VWS over the DWCPO was gradually strengthened due to the change of the position of the two vortices in stage Ⅱ (from 0000 UTC 29 June to 1200 UTC 29 June 2013). Convective systems over the DWCPO developed rapidly during the period from two vortices coupling to decoupling in stage Ⅲ (from 1200 UTC 29 June to 0600 UTC 30 June 2013).
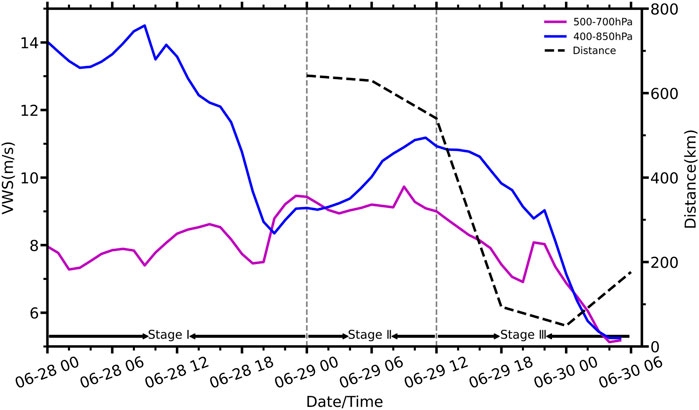
FIGURE 4. Time series of average VWSV1(m/s; purple solid line) and average VWSV2(m/s; blue solid line) over the DWCPO from 0000 UTC 28 June to 0600 UTC 30 June 2013 at 1-h intervals and the horizontal distance (km; black dotted line) between the centers of the two vortices from 0000 UTC 29 June to 0600 UTC 30 June 2013 at 6-h intervals. The time windows of stages Ⅰ, Ⅱ, and Ⅲ are also marked.
The average VWSV1 over the DWCPO ranges from 7 m/s to 8.5 m/s in stage Ⅰ (Figure 4), which was close to the average value of June and July. The average VWSV2 was about 14 m/s, much larger than the average VWSV1. At the early phases of the two vortices, the distance between the centers of the two vortices was about 600 km (in stage Ⅱ). As the two vortices moved slowly, the distance between the two vortices became smaller. The cyclonic shear zone of westerly winds over the DWCPO moved eastward due to the movement of the TPV at 500 hPa, and the angle of wind vectors between 700 hPa and 500 hPa layers increased, resulting in a rapid increase of the average VWSV1 over the DWCPO from 2100 UTC 28 June to 1200 UTC 29 June 2013. Meanwhile, both the average VWSV1 and the average VWSV2 had an increasing trend, and the VWS of the whole atmosphere was relatively consistent. The deep VWS created good conditions for the occurrence of convection over the DWCPO. As the distance between the two vortices rapidly approached, the circulations of the two vortices tended to be coupled, which was the main reason for the rapid decline of the average VWSV1 and the average VWSV2 in stage Ⅲ.
3.3 Influence of VWS on the development of precipitation echoes
As can be seen from Figure 3, at 1200 UTC 29 June 2013, the VWSV1 over the DWCPO reached its maximum with the changes of the positions of the two vortices, and the strong VWS region presented an obvious north-south zonal distribution. In the following hours, the VWS gradually weakened, the zonal distribution gradually disappeared, and the large value center was mainly in the southern part of the SCB. The above distribution characteristics and intensity changes of VWSV1 were highly consistent with the development of radar echoes over the DWCPO during this period (Figure 5). At 1130 UTC 29 June 2013, radar echoes began to form over the DWCPO, and the radar echoes presented a north-south zonal distribution from the northern part of Yunnan province to the central part of Sichuan Province near 105°E, corresponding to the large value belt of VWSV1. About 15 convective storms developed at the same time, with the scale less than 50 km and the central intensity generally exceeding 50 dBZ (Figure 5A). About 2 hours later, the relatively dispersed convective cells gradually joined into one piece, presenting an obvious north-south zonal distribution feature (Figure 5B). During this period, the intensity and scale of the convective cells increased continuously. With the weakening of the strong VWS over the DWCPO and the retention of the large value center in the southern part of the SCB, the strong radar echoes mainly developed in the southern part of the SCB, and the area of the strong echoes gradually exceeds that in the central and northern part of the SCB (Figure 5C). It is worth mentioning that with the weakening of the zonal feature of VWSV1, the zonal feature of the strong radar echoes over the SCB also gradually disappeared, and the strong echoes diffused to the east of the SCB (Figure 5D). In conclusion, VWS was an important condition for the occurrence and development of convective storms over the SCB and had a good indication for the intensity and distribution of radar echoes.
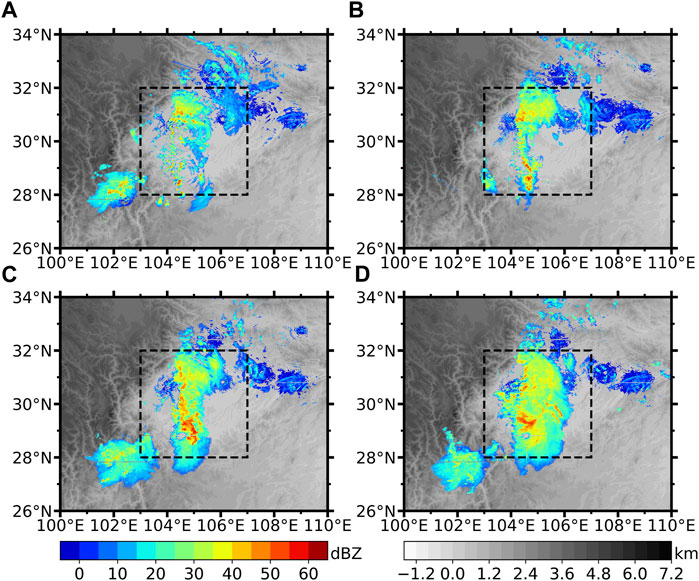
FIGURE 5. (A–D) RMCR (dBZ; color shading) from 1130 to 1730 UTC 29 June 2013 at 2-h intervals and topographic feature (km; gray shading). The inserted boxes (dotted boxes) indicate the DWCPO.
4 Characteristics of convective storms and precipitation over/in the SCB under the interaction of the two vortices
4.1 Spatial and temporal distribution of convection and precipitation
The change of position of the two vortices created good VWS conditions for the occurrence of convective storms over the SCB in stage II. During the following 6 h after 1200 UTC 29 June were the period of the strongest convective storms and precipitation over/in the SCB.
As shown in Figure 6, in stage II, the intensity of radar echoes over the SCB was weak, with the meridian average intensity generally lower than 25 dBZ, and the east-west scale of the echoes was small. With the passage of time, the radar echoes over the SCB gradually moved eastward, with a small change in intensity but a significant increase in zonal scale. Since the development of convective storms was closely related to the magnitude of VWS, although the circulations of the two vortices had affected the weather in the SCB, the development of convective storms over the SCB was generally weak because the intensity of VWSV1 had not reached its maximum.
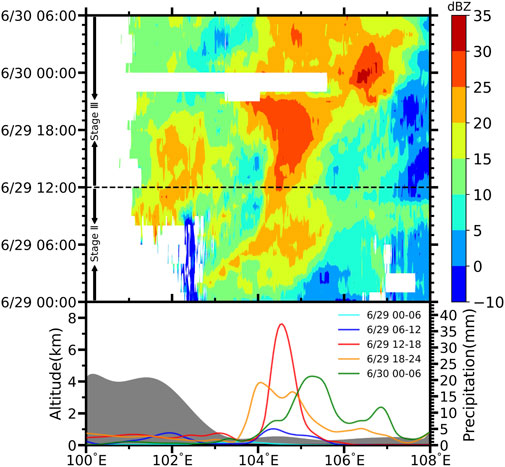
FIGURE 6. Temporal variation of the average RMCR (dBZ; color shading) from 0000 UTC 29 June to 0600 UTC 30 June 2013 at 1-h intervals and the average accumulated precipitation in 6-h (mm; color lines) observed by AWS in the SCB. The gray shading in the lower portion indicates the topography of the SCB and its surroundings along the 30°N.
The center of strong precipitation was mainly concentrated near 102°E and 104.5°E from 0600 to 1200 UTC 29 June 2013, and the meridional average 6-h accumulated precipitation was less than 5 mm. The accumulated precipitation value from 0000 to 0600 UTC 29 June was negligible. In stage Ⅲ, the changes of radar echoes and precipitation characteristics over/in the SCB could be divided into three phases. The early phase was from 1,200 to 1800 UTC 29 June. During this phase, due to the maximum VWS over the SCB, the convective storms developed rapidly, and the mean meridian RMCR reached about 35 dBZ between 104° and 105°E. The region of strong radar echoes increased rapidly, and the east-west position moved less. At the same time, the precipitation intensity reached its peak, and the meridian average accumulated precipitation between 104° and 105°E was about 40 mm over a 6-h period. The middle phase was from 1800 to 2400 UTC 29 June. In this phase, with the weakening of VWSV1 over the SCB and the gradual disappearance of zonal distribution characteristics, the concentrated strong north-south echoes’ region over the SCB began to develop eastward. As this strong echo region was not strictly along the south-to-north direction, no obvious double strong echoes’ structure could be seen in Figure 6, but an obvious bimodal structure can be seen in the precipitation curve during this phase (yellow curve in Figure 6). The maximum value of precipitation was obviously weaker than the previous period. The late phase was from 0000 to 0600 UTC 30 June. During this phase, the precipitation in the SCB was mainly controlled by the TPV as the SWV moved northward. Although the precipitation bimodal structure still existed, the precipitation intensity weakened significantly. In Section 4.3, the suppression effect of the TPV on convection will be discussed in detail. This suppression effect made radar echoes stratification appear in certain areas of the SCB and precipitation intensity decreased significantly.
4.2 Mechanism of double-band radar echoes formation and its relationship with precipitation in the SCB
Hydrostatic instability, water vapor in lower atmosphere, convective triggering conditions, and VWS are the four main factors for the occurrence of severe convective weather events. As can be seen from Figure 7, at 1200 UTC 29 June, the hydrostatic instability at the WJ site was the highest. Convection inhibition (CIN for short) played a dominant role from 900 hPa to 100 hPa and CAPE only 8.89 J/kg. K-index, SI-index, T850-500, and other convective indexes were not prominent, and the situation at the MS site with similar location was similar (figures omitted). The CAPE at the YB site located at the southern end of the convective zone reached 1,641.98 J/kg, while CIN was only about 40 J/kg because it was in the strong convective region. At the same time, K-index, SI-index, and T850-500 showed that the atmospheric stratification at the YB site were very conducive to the occurrence and development of convective storms. The CAPE at the CQ site was even higher than YB, reaching 1955.87 J/kg, which provided good environmental conditions for the development of radar echoes moving eastward over the SCB during the middle and late phases of stage Ⅲ. In conclusion, strong convection occurred and developed in the middle of the SCB due to both strong VWS and unstable atmospheric stratification.
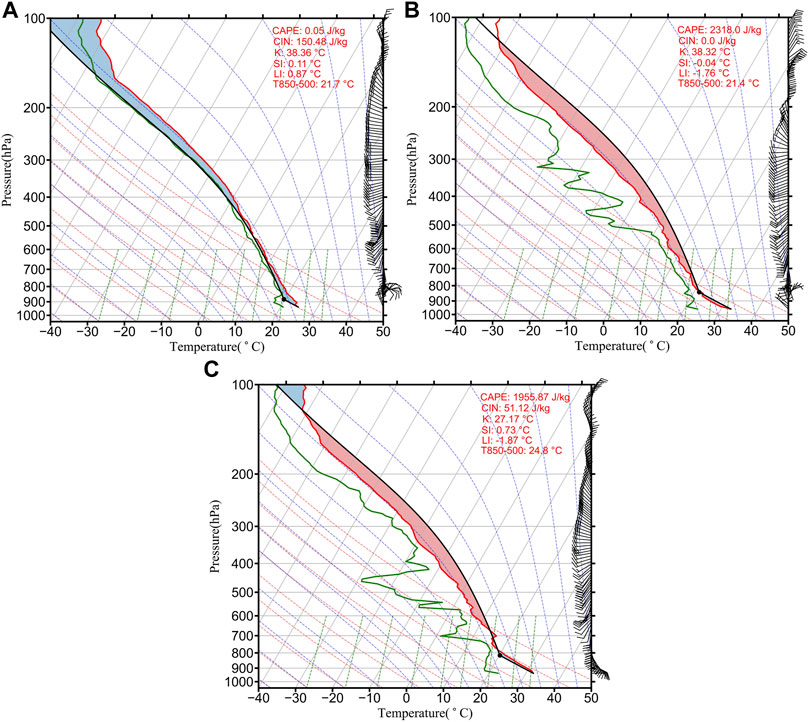
FIGURE 7. Skew T-logp diagrams over (A) the WJ site, (B) the YB site, and (C) the CQ site at 1200 UTC 29 June 2013.
Among the four factors that influenced the occurrence of strong convection, the water vapor at low levels and VWS were closely related to the development of the two vortices, while the trigger condition and atmospheric stratification were related to the spatial thermal environment of the SCB.
As the night fell on June 29, the temperature of the near surface layer of the SCB was lower in the west and higher in the east due to the different radiation cooling. According to the temperature anomaly field (Figure 8), at the same altitude, the maximum temperature difference in the east–west temperature anomaly centers of the SCB was 6 K. The boundary between positive and negative values of near-surface temperature anomalies was just near 105°E, which was consistent with the region where double-band echoes occurred (Figures 5A–C). At 1200 UTC 29 June, the center of SWV was located in the southwest of the SCB, while the center of TPV was still in the northeast of the plateau and did not move into the SCB. At this time, the airflow movement in the middle and lower layers of the SCB were mainly influenced by the circulation of the SWV, leading to the prevailing easterly airflows below 800 hPa in the eastern part of the SCB. The airflows showed obvious upward movement in the central part of the SCB, and the strong part of its ascending branch was located near 105°E (Figure 8A).
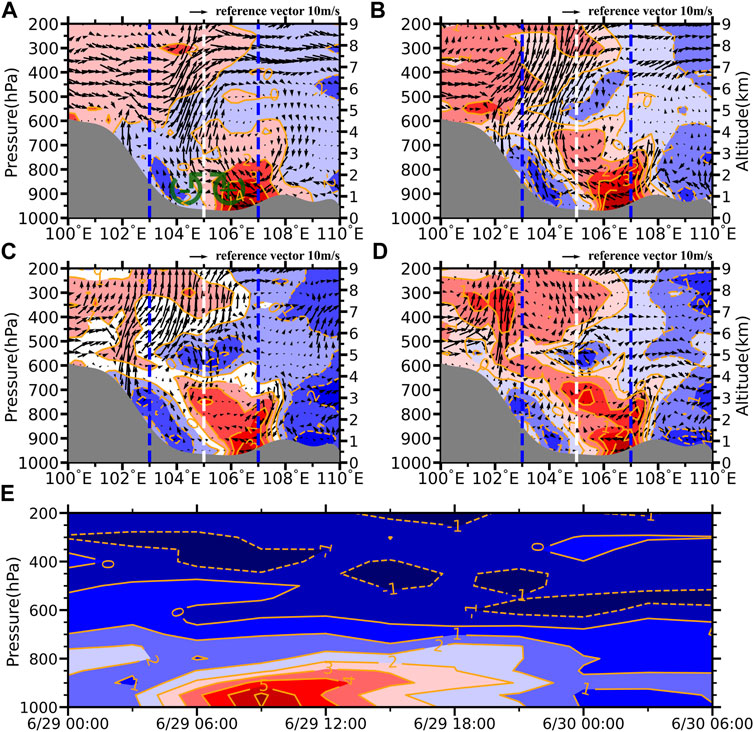
FIGURE 8. Vertical cross section of wind vectors (combined zonal wind and tenfold vertical velocity) and temperature space anomaly (K; color shading) along the 30°N. The gray shading indicates the topography along the 30°N. Heuristic diagrams (green curved vectors) indicating horizontal vorticity (+ and -) are also marked. The two blue dotted lines indicate the east and west boundary of the DWCPO. The white dotted line divided the DWCPO to the east and west regions. (A) 1200 UTC 29 June 2013, (B) 1500 UTC 29 June 2013, (C)1800 UTC 29 June 2013, and (D) 0000 UTC 30 June 2013. (E)Vertical cross section of the difference of temperature anomalies between the east and west regions of the DWCPO from 0000 UTC 29 June to 1500 UTC 29 June 2013 at 1-h intervals.
The convergence of warm and cold airflow near the surface layer and strong upward movement were good trigger conditions for the occurrence of convection. In combination with unstable atmospheric stratification, abundant water vapor in the lower layer, and deep VWS, all conditions for the occurrence of strong convection near 105°E over the SCB were available. In the following 6 h, with the enhancement of radiative cooling in the western mountains of the SCB, the confrontation between the cold and warm air near 105°E was maintained, and with the coupling effect of the two vortices moving into the SCB, the vertical movement of the atmosphere over the SCB developed particularly deep (Figures 8B,C). At 0000 UTC 30 June, the confrontation of near-surface temperature and the development of deep convection over the SCB disappeared gradually due to solar radiation and the weakening of the SWV. It is worth mentioning that by comparing the circulation over the SCB dominated by the SWV (Figure 8A) and that dominated by the TPV (Figure 8D), it can be found that the strong vertical movement over the SCB under the influence of the SWV is mainly below 600 hPa, while above 500 hPa under the influence of the TPV.
The westerly winds above 500 hPa on the south side of the TPV cooled and descended in the eastern part of the SCB, while the easterly winds below 700 hPa on the north side of the SWV heated and rose in the central part of the SCB, forming an obvious secondary circulation over the SCB in coordination with deep VWS. Before the two vortices coupled, the secondary circulation was particularly obvious, which shows an obvious horizontal vortex tube rotating clockwise over the SCB (Figure 8A). Klemp (1987) pointed out that the horizontal vortex tube tilted by the updraft rising and the vorticity couplet formed were an important dynamic mechanism for the generation and development of convective storms. It was also the main reason for the formation of many mesoscale convective cell cores in the north-south zonal convective systems over the SCB.
In order to reveal the role of the secondary circulation, we analyze the vertical and horizontal vorticity associated with the secondary circulation.
From the first to the last term on the right (Eq. 3) are the horizontal advection term (M), vertical advection term (N), horizontal divergence term (P), tilting term (R), and friction term (S), respectively.
After magnitude analysis, the horizontal vorticity of the P-coordinate system can be simplified into the following formula (Eq. 8, 9):
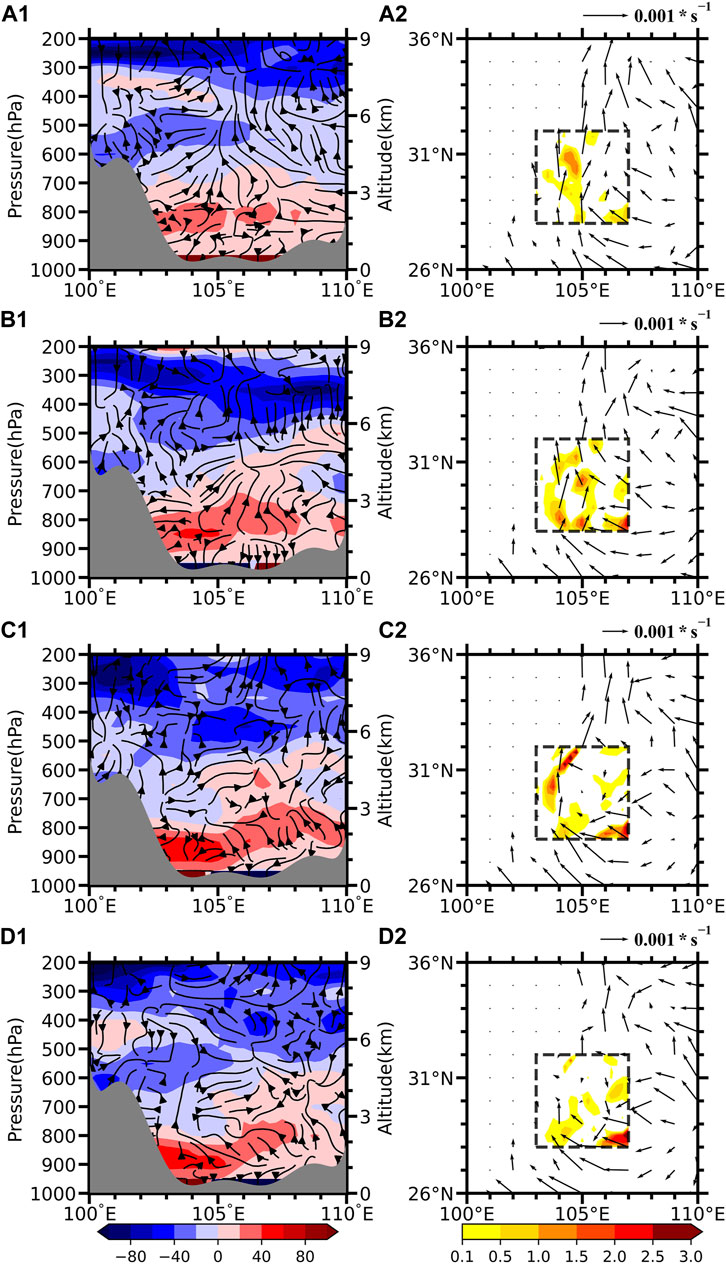
FIGURE 9. (A1–D1) Vertical cross section of vorticity vectors (combined
The north-south vortex tubes caused by the secondary circulation tilted under the action of updraft, resulting in the transformation of horizontal vorticity to vertical vorticity. It could be seen from Figures 9A2–D2 that the large value distribution of R was consistent with that of
It was worth noting that the
With the proximity of the two vortices, the intensity of
Due to the relatively fixed location of the large value region of VWS formed by the circulations of the two vortices, the occurrence and development region of strong convection over the SCB was relatively fixed too. In terms of precipitation, it was a long and narrow heavy precipitation belt from YB in the south to MY in the north. The north-south scale of the heavy precipitation belt was more than 300 km, but its east-west width was only about 50 km (Figures 10A1–D1).
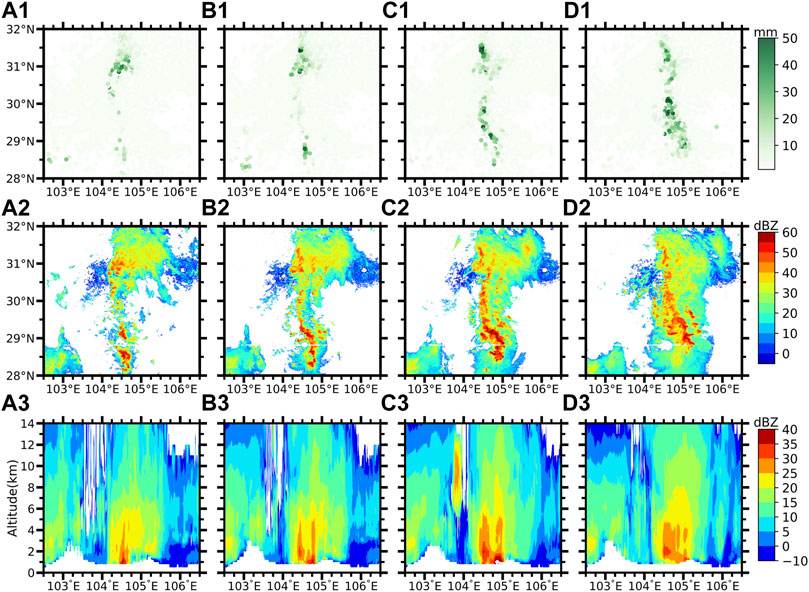
FIGURE 10. (A1–D1) Precipitation intensity in the DWCPO (mm/hour, color dots) from 1200 UTC 29 June to 1500 UTC 29 June 2013 at 1-h intervals. (A2–D2) As in (A1–D1) but for the RMCR (dBZ; color shading). (A3–D3) Vertical cross section of the mean meridional RMR (dBZ; color shading) from 1200 UTC 29 June to 1500 UTC 29 June 2013 at 1-h intervals.
After the generation of the first band echo formed by the rain area seen on radar, many convective cells with a scale less than 10 km were gradually formed not far from its east side, and these convective cells gradually connect north and south to form a new band echo (Figures 10A2–D2). Generally, after a convective storm developed to the mature phase, the colder air at mid-levels would pass through the updraft region and descended, which resulted in strengthening the strength of the near-surface cold pool at the back of the mature storm, then cutting off the warm and wet air in the middle and lower layers of the old convective storm, and triggering a new one at the front of the surface cold pool. This is the main mechanism for the alternation of old and new convective storms (Rotunno et al., 1988). In contrast, there was a double-band echoes in which old and new convective storms coexist over the SCB.
Therefore, we believe that the main reasons for the coexistence of double-band radar echoes are as follows:
1) The formation and coexistence of the double-band radar echoes mainly occurred in the early phase of stage Ⅲ, when the VWS over the SCB reached the maximum, and then the two vortices coupled over the SCB. The strong updraft near the centers of the two vortices ran through the 700–500 hPa layers, making the updraft over the SCB extend from the near surface to 200 hPa. The updraft was dominant, leading to the weakening of horizontal motion of parcels in the vicinity of the convective cell, which enabled almost all the CAPE of the environment east of the old cell to be converted to kinetic energy of vertical motion, enabling the rapid development of the new cell.
2) From the simplified equation of vorticity in the x–z plane obtained by ignoring geostrophic deflection force (Eq. (10), Houze (1993)), it can be seen that the change of vorticity is mainly generated only baroclinically and is redistributed by advection in the x–z plane. As can be seen from Figures 8A–C, the temperature difference between the east and west sides of the near-surface region where convection storms occurred over the SCB leaded to the enhancement of baroclinicity, which resulted in the enhancement of horizontal vorticity of the airflows (Figure 8A). This was balanced by the clockwise vertical shear caused by the secondary circulation near the surface so that the parcels at the front of the convective storm had no predisposition toward either negative or positive vorticity, thus forming a new convective storm in the front of the old one. Rotunno et al. (1988) called it the “optimal” mode of air parcels’ movement in convective regions.
where
3) As shown in Figures 8A–C, due to reasons such as the terrain of SCB, the eastern front of the colder airflows to the west of 105°E had been relatively fixed, coupled with a strong upward motion when the two vortices coupling made it hard for the colder airflows at mid-levels to pass through the updraft area and descend to strengthen the cold pool. The old convective storm continued to develop because the warm and moist airflows at the lower level would not be cut off by the cold pool. As shown in Figures 10A3–D3, the new convective storm was independently generated about 20 km to the east of the old one, and there was an obvious boundary between the two strong echoes formed by the old and new convective storms.
Different from the old band echo, the new band echo had a relatively short lifetime, weak intensity, and faster moving speed, resulting in small local accumulated precipitation. This explained why there was no obvious double-band distribution of accumulated precipitation in the same period of time (Figures 10A1–D1).
4.3 Formation conditions and characteristics of radar echoes stratification
At 1700 UTC 29 June, the east-west width of the strong echo over the SCB increased rapidly (Figure 5D), and the intensity gradually weakened. The main reason for this phenomenon was that the position of the SWV at 700 hPa was north and its intensity was weakened, which weakened the strong VWS over the SCB and the deep updraft caused by the coupling of the two vortices. However, the TPV was still strong at this time. From the perspective of specific humidity and temperature in the TPV circulation, the part of the circulation to the west of the center of the TPV was wetter and warmer than the part to the east of the center of the TPV because it was closer to the Tibetan plateau. According to Figures 11A,B, the humidity (temperature) of the part east of the center of the TPV was about 2 g/kg (2 k) lower than that of the part west of the center of the TPV. The southerly winds to the south of the TPV at 500 hPa brought the cold and dry airflows around the vortex circulation into the center of the TPV. The dry-cold advection formed an obvious dry-cold layer wedged into the TPV circulation between 600 hPa and 500 hPa (Figures 11C,D). Due to the existence of this cold and dry layer, there were obvious stratification of specific humidity and air temperature over the southern part of the SCB. The boundary between the warm and wet layer in the upper part and the warm and wet layer in the lower part was just between 600 hPa and 500 hPa.
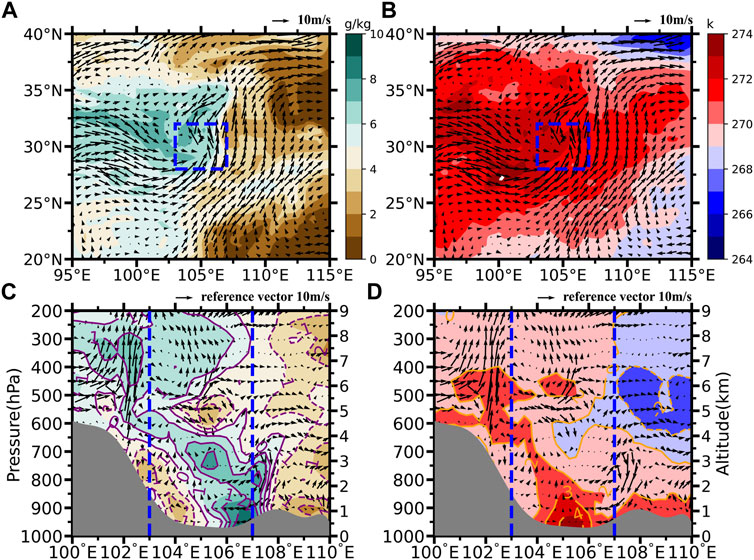
FIGURE 11. (A) Horizontal winds (m/s; vectors) and specific humidity (g/kg; color shading) obtained from ERA5 at 500 hPa at 1900 UTC 29 June 2013. The inserted boxes (blue dotted boxes) indicate the DWCPO. (B) As in (A) but for horizontal winds (m/s; vectors) and temperature (K; color shading). (C) Vertical cross section of wind vectors (combined zonal wind and tenfold vertical velocity) and space anomaly of specific humidity (g/kg; color shading) along the 29°N. The gray shading indicates the topography along the 29°N. The two blue dotted lines indicate the east and west boundary of the DWCPO. (D) As in (C) but for wind vectors (combined zonal wind and tenfold vertical velocity) and space anomaly of temperature (g/kg; color shading).
The stratification of temperature and specific humidity was the main reason for the stratification of radar echoes over the SCB in the vertical direction. During this period, the SWV was located to the north of the SCB and gradually weakened and disappeared. From the southern section of the SCB (29°N), the easterly winds and the vertical motion dominated by the SWV in the lower layer were very weak. The temperature and humidity field and circulation field dominated by the TPV over the SCB were mainly characterized by temperature and humidity stratification and strong vertical motion mainly concentrated at levels above 500 hPa (Figures 11C,D). The formation of these features requires the weakening and the northward movement of the SWV. If the SWV was strong, the deep and strong upward motion when the two vortices were coupled would rapidly transport the warm and wet airflows in the lower layer to the middle and high layers, and it was difficult to establish the stratification phenomenon of specific humidity and temperature. In addition, the strong VWS and easterly winds would limit the convective storms over the SCB to a relatively fixed area, and it was difficult to form the stratification phenomenon of radar echoes. Therefore, only when the TPV dominated the SCB, it was beneficial to establish the stratified structure of temperature and humidity over the SCB.
At 1600 UTC 29 June, the double-band echoes over the SCB gradually widened and moved eastward, especially for the strong echoes region in the south of the SCB (Figure 5C). The air temperature near 500 hPa over the SCB was significantly lower than the surrounding area, and the cooling air and downdraft would inhibit the development of convection below 500 hPa, which was consistent with the research conclusion of Qiu et al. (2015). As shown in Figure 12A, the top height of strong echoes between 104.4° and 105°E in the southern part of the SCB was about 5 km (500–600 hPa), which was consistent with the boundary of temperature and humidity stratification (Figure 11C). The updraft dominated by the TPV combined with the relatively warm and humid air resulted in condensation of water vapor above 500 hPa, which resulted in enhanced radar echoes. In combination with the strong radar echoes restricted by dry and cold air at the middle and low levels, radar echo stratification was formed (Figures 12A–D).
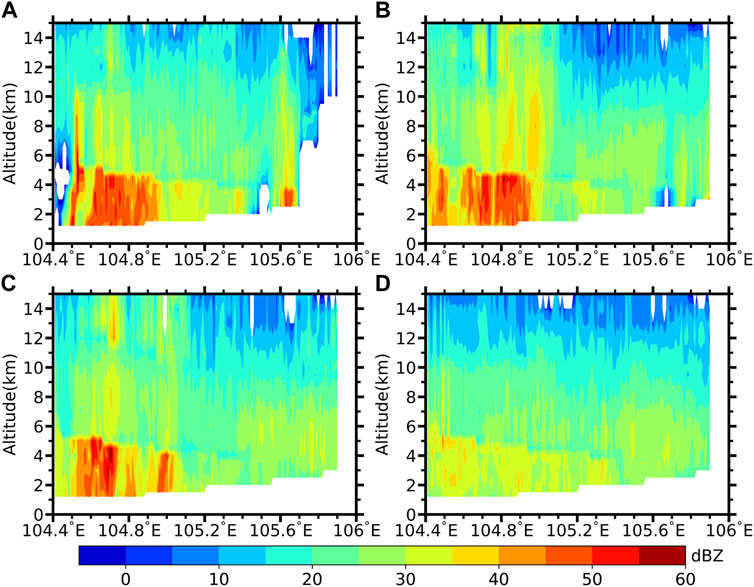
FIGURE 12. (A–D) Vertical cross section of RMR (dBZ; color shading) along 29°N from 1600 to 1900 UTC 29 June 2013 at 1-h intervals.
The temperature and humidity stratification caused by the TPV was mainly concentrated in the east region of its center, so the suppression effect of the TPV on the strong radar echoes at middle and low levels mainly occurred in this region. As shown in Figure 12A, near 104.5°E, strong echoes could develop from surface to altitude of up to 10 km, but the phenomenon of “cutting” of echoes by temperature and humidity stratification became particularly obvious in the area east of 104.5°E. In the middle and late phases of stage Ⅲ, the phenomenon of echo stratification would continue to exist (Figures 12B–D). The strong easterly echoes were continuously suppressed by the stratification of temperature and humidity, and the intensity gradually decreased (Figure 12D).
The existence of echo stratification indicated that the development height of convection might be limited. As a result, the precipitation intensity in the SCB was obviously lower than that in the early phase of stage Ⅲ. The echo over the SCB dominated by the TPV was larger in area, weaker in intensity, and faster in movement. Meanwhile, the stratification of temperature and humidity and the cold air descending east of the vortex center limited the height of echoes development in this region. Therefore, the intensity of precipitation in the SCB dominated by the TPV weakened significantly after the SWV weakened and disappeared.
5 Summary and discussion
Based on ERA5 re-analysis data, RMR/RMCR data, radiosonde data, and precipitation from AWS observations, we analyzed a special severe precipitation event in the SCB on 29 and 30 UTC June 2013 under the background that the TPV and the SWV coupling. The main conclusions are as follows:
1) The changes of the positions of the two vortices could cause strong VWS over the SCB. Strong VWS was a necessary condition for the development of convective storms over the SCB. The intensity and distribution characteristics of VWS dominated the development and distribution of convective storms and precipitation over/in the SCB to some extent.
2) The vorticity associated with the secondary circulation caused by the two vortices was positive. The negative vorticity caused by baroclinicity just neutralizes the positive vorticity at low level of the SCB so that as the parcel rose above the boundary layer, it had no predisposition toward either negative or positive vorticity, and it thus rose vertically. Combined with the relatively fixed boundary between cold and warm air masses, the old and new convective storms could exist and develop simultaneously, and finally formed the double-band echoes seen on radar.
3) The dry and cold advection on the east side of the vortex center made the temperature and humidity over the SCB form a stratified structure when the TPV dominated the circulation over the SCB. The colder air, downdraft, and the hydrothermal stratification structure in the east of the vortex center inhibit the convection in the middle and lower layers so that the radar echoes formed an obvious stratified structure in the corresponding regions.
4) The precipitation was strongest in the SCB mainly when the two vortices couple. During this period, water vapor was transported over the SCB by the SWV and converged to the vortex center, and the deep convection caused by the coupling of the two vortices was conducive to the development of strong precipitation. The TPV dominated the precipitation in the SCB after the two vortices decoupled, and would suppress the convective height in some regions, which made the rainfall area expand, but the precipitation intensity decreases significantly.
It is rare for the SWV and TPV to appear over the SCB and its surrounding areas at the same time, but the coupling of the two vortices is very easy to cause extreme heavy precipitation events. Different from the weather process related to the SWV or TPV alone, it is extremely difficult to forecast the precipitation area caused by the vortex under the interaction of the two vortices, because the heavy precipitation does not occur in the usual area (southeast to the vortex center). Cheng et al. (2016) explained the cause of the distribution of the precipitation area related to the two vortices from the perspective of frontogenesis. This paper further revealed the relationship between the two vortices and the convective systems to explain the formation mechanism of the precipitation area.
Because the two vortices usually need to cooperate with other weather systems to cause a strong precipitation process, it is necessary to study the role of the two vortices in a heavy precipitation process. In particular, how the developments of the two vortices affect the occurrence and development of mesoscale convective systems that can produce heavy rainfall deserves further study.
VWS plays an important role in the development of tropical cyclone (TC). Li (1990) earlier revealed that VWS in the lower troposphere had an inhibitory effect on the generation of tropical cyclones (TCs), and the magnitude of this inhibitory effect might be correlated with the strength of VWS (Zeng et al., 2006; Fu et al., 2019). Both the TPV and the SWV have a warm-core structure similar to TC. In particular, the TPV has been proved to have dynamic and thermal structures similar to tropical cyclone-like vortices (Li and Yang, 1998). Therefore, the effect of VWS on the two vortices may be similar to that of TCs. The difference is that both the southwest vortex and the plateau vortex are shallow systems (the vertical thickness is only 2–3 km). Therefore, the effect of VWS at different heights on shallow systems needs further study. At the same time, in the period of the two vortices coupling, the VWS is small because the circulation of the two vortices tends to be consistent. How the smaller VWS affects the development of low vortexes in the period of the two vortices coupling requires further research in the future.
As this study dealt with one event, the mechanism of the two vortices and the relationship between the vortices and the convective system revealed in this paper may not be necessarily applicable to other similar events. We need to analyze more similar weather processes in future work to reveal the general and special laws of heavy rainfall under the background of coupling of two vortices.
Data availability statement
The datasets presented in this study can be found in online repositories. The names of the repository/repositories and accession number(s) can be found below: 1) https://cds.climate.copernicus.eu/cdsapp#!/dataset/reanalysis-era5-single-levels?tab=overview. 2) http://10.194.89.55/cimissapiweb/apidataclassdefine_list.action.
Author contributions
YD and GL contributed to the conception and design of the research. XJ and YW organized the database and performed the statistical analysis. YD drew the figures and wrote the manuscript. All authors contributed to manuscript revision and read and approved the submitted version.
Funding
This work was jointly sponsored by the National Natural Science Foundation of China (Grant Nos. 91937301 and 42175002), the Science and Technology Development Foundation of Heavy Rain and Drought-Flood Disasters in Plateau and Basin Key Laboratory of Sichuan Province (Grant No. SCQXKJQN201712) and the Innovation Team Fund of Southwest Regional Meteorological Center, China Meteorological Administration (Grant No. XNQYCXTD-202202) provided part of the data collection fees and open access publication fees for the research.
Conflict of interest
The authors declare that the research was conducted in the absence of any commercial or financial relationships that could be construed as a potential conflict of interest.
Publisher’s note
All claims expressed in this article are solely those of the authors and do not necessarily represent those of their affiliated organizations, or those of the publisher, the editors, and the reviewers. Any product that may be evaluated in this article, or claim that may be made by its manufacturer, is not guaranteed or endorsed by the publisher.
References
Chen, T., Zhang, F.-H., and Duan, Y.-H. (2011). A study of relationship between a southwest vortex and the mesoscale convective systems during the severe “6.12” rainstorm event in Guangxi province. Acta Meteorol. Sin. 69 (3), 472–485. (in Chinese). doi:10.11676/qxxb2011.041
Chen, Z.-M., Min, W.-B., Miao, Q., and He, G.-B. (2004). A case study on coupling interaction between Plateau and southwest vortexes. Plateau Meteorol. 23 (1), 75–80. (in Chinese). doi:10.3321/j.issn:1000-0534.2004.01.011
Cheng, X. -L., Li, Y. -Q., and Xu, L. (2016). An analysis of an extreme rainstorm caused by the interaction of the Tibetan plateau vortex and the southwest China vortex from an intensive observation. Meteorol. Atmos. Phys. 128, 373–399. doi:10.1007/s00703-015-0420-2
Dong, Y.-C., and Li, G.-P. (2015). The structure and precipitation characteristics of typical Tibetan Plateau vortices as revealed by energy analysis. Chin. J. Atmos. Sci. 39 (6), 1136–1148. (in Chinese). doi:10.3878/j.issn.1006-9895.1502.14263
Du, Q., Qin, D.-Y., and Zhang, P. (2013). Observation and analysis of a southwest vortex rainstorm in southern China using FY-2 satellite data. Meteor Mon. 39 (7), 821–831. (in Chinese). doi:10.7519/j.issn.1000-0526.2013.07.003
Fu, H., Wang, Y.-Q., Riemer, M., and Li, Q. (2019). Effect of unidirectional vertical wind shear on tropical cyclone intensity change-lower-layer shear versus upper-layer shear. J. Geophys. Res. Atmos. 124 (12), 6265–6282. doi:10.1029/2019jd030586
Fu, S.-M., Li, W.-L., Sun, J.-H., Zhang, J., and Zhang, Y. (2015). Universal evolution mechanisms and energy conversion characteristics of long-lived mesoscale vortices over the Sichuan Basin. Atmos. Sci. Lett. 16 (2), 127–134. doi:10.1002/asl2.533
Gao, W.-L., and Yu, S.-H. (2017). Analyses on mean circulation field of the plateau low vortex moving out of Tibetan Plateau. Plateau Meteorol. 26 (1), 206–212. (in Chinese). doi:10.1002/jrs.1570
Hao, L.-P., Zhou, J., and Kang, L. (2016). Weather analyses and numerical study of Southwest China vortex and its induced heavy rainfall. Plateau Meteorol. 35 (5), 1182–1190. (in Chinese). doi:10.7522/j.issn.1000-0534.2015.00046
Hersbach, H., Bell, B., Berrisford, P., Hirahara, S., Horányi, A., Muñoz-Sabater, J., et al. (2020). The ERA5 global reanalysis. Q. J. R. Meteorol. Soc. 146 (730), 1999–2049. doi:10.1002/qj.3803
Hu, Z.-H., Li, G.-P., Guan, C.-G., and Wang, H.-L. (2014). Diagnostic analysis of mesoscale convective systems influence on sustained rainstorm caused by southwest vortex. Plateau Meteorol. 33 (1), 116–129. (in Chinese). doi:10.7522/j.issn.1000-0534.2013.00002
Huang, C.-H., Gu, Q.-Y., Li, G.-P., and Chen, G.-X. (2010). Mechanism analysis of Plateau vortex moving east trigger rainstorm in Sichuan Basin. Plateau Meteorol. 29 (4), 832–839. (in Chinese).
Huang, C.-H., Li, G.-P., Niu, J.-L., Luo, L., and Zhang, W. (2011). Moist helicity analysis of a heavy rainstorm in Sichuan Basin induced by plateau vortex moving eastward. Plateau Meteorol. 30 (6), 1427–1434. (in Chinese).
Jiang, L.-J., Li, G.-P., Mu, L., and Kong, L. (2014). Structural analysis of heavy precipitation caused by southwest vortex based on TRMM data. Plateau Meteorol. 33 (3), 607–614. (in Chinese). doi:10.7522/j.issn.1000-0534.2013.00094
Klemp, J. B. (1987). Dynamics of tornadic thunderstorms. Annu. Rev. Fluid Mech. 19, 369–402. doi:10.1146/annurev.fl.19.010187.002101
Li, C.-Y. (1990). Influences of sensible heating and vertical wind shear on subtropical CISK disturbance. Chin. J. Atmos. Sci. 14 (2), 173–180. (in Chinese). doi:10.3878/j.issn.1006-9895.1990.02.05
Li, C., Li, Y.-Q., and Jiang, X.-W. (2015). Statistical characteristics of the inter-monthly variation of the Sichuan Basin vortex and the distribution of daily precipitation. Chin. J. Atmos. Sci. 39 (6), 1191–1203. (in Chinese). doi:10.3878/j.issn.1006-9895.1502.14270
Li, G.-P., and Yang, X.-Y. (1998). Effects of the thermal forcing on nonlinear internal inertia gravitational waves in the atmosphere. Chin. J. Atmos. Sci. 22 (5), 791–797. (in Chinese). doi:10.3878/j.issn.1006-9895.1998.05.14
Li, G., and Deng, J. (2013). Atmospheric water monitoring by using ground-based GPS during heavy rains produced by TPV and SWV. Adv. Meteorology 2013 (4), 1–12. doi:10.1155/2013/793957
Liu, X.-R., and Li, G.-P. (2014). Numerical simulation and potential vorticity diagnosis of an eastward moving southwest vortex. Plateau Meteorol. 33 (5), 1204–1216. (in Chinese). doi:10.7522/j.issn.1000-0534.2013.00151
Luo, S.-W., He, M.-L., and Liu, X.-D. (1993). Study on summer vortex over qinghai-xizang (Tibetan) plateau. Sci. China (Series B) 23 (7), 778–784. (in Chinese). doi:10.1360/zb1993-23-7-778
Ni, C.-C., Li, G.-P., and Xiong, X.-Z. (2017). Analysis of a vortex precipitation event over Southwest China Using AIRS and in situ measurements. Adv. Atmos. Sci. 34 (4), 559–570. doi:10.1007/s00376-016-5262-4
Pan, Y., Li, J., and Yu, R.-C. (2011). Climatic characteristics of the spatial structure of the eastward-moving southwest vortex. Clim. Environ. Res. 16 (1), 60–70. (in Chinese). doi:10.3878/j.issn.1006-9585.2011.01.06
Qian, Z.-G., and Jiao, Y.-J. (1997). Advances and problems on Qinghai-Xizang Plateau meteorology research. Adv. Earth Sci. 12 (3), 207–216. (in Chinese). doi:10.11867/j.issn.1001-8166.1997.03.0207
Qiu, J.-Y., Li, G.-P., and Hao, L.-P. (2015). Diagnostic analysis of potential vorticity on a heavy rain in Sichuan Basin under interaction between Plateau Vortex and southwest vortex. Plateau Meteorol. 34 (6), 1556–1565. (in Chinese). doi:10.7522/j.issn.1000-0534.2014.00117
Rotunno, R., Klemp, J. B., and Weisman, M. L. (1988). A theory for strong, long-lived squall lines. J. Atmos. Sci. 45, 463–485. doi:10.1175/1520-0469(1988)045<0463:ATFSLL>2.0.CO;2
Song, W.-W., and Li, G.-P. (2016). Analysis and application of the two type vorticity vectors on a heavy rainfall in Sichuan Basin. Plateau Meteorol. 35 (6), 1464–1475. (in Chinese). doi:10.7522/j.issn.1000-0534.2015.00115
Xiao, D.-X., Yang, K.-Q., and Yu, X.-D. (2017). Characteristics analyses of extreme rainstorm events in Sichuan Basin. Meteorol. Mon. 43 (10), 1165–1175. (in Chinese). doi:10.7519/j.issn.1000-0526.2017.10.001
Xiao, Y.-J., and Liu, L.-P. (2006). Study of methods for interpolating data from weather radar network to 3-D grid and mosaics. Acta Meteorol. Sin. 64 (5), 647–657. (in Chinese). doi:10.11676/qxxb2006.063
Yang, K.-Q., Lu, P., and Zhang, L. (2017). Analyses of heavy rainstorm in warm sector under the influence of the low-pressure system of qinghai-xizang plateau. J. Trop. Meteorology 33 (03), 415–425. (in Chinese). doi:10.16032/j.issn.1004-4965.2017.03.012
Yeh, T., and Gao, Y.-X. (1979). Meteorology of the qinghai–xizang plateau. Beijing: Science Press, 278pp. (in Chinese)
Yue, J., and Li, G.-P. (2016). Study on the moisture source of rainstorms in Sichuan Basin by the Lagrangian method. J. Trop. Meteorology 32 (2), 256–264. (in Chinese). doi:10.16032/j.issn.1004-4965.2016.02.012
Zeng, Z.-H., Chen, L.-S., Wang, Y.-Q., and Gao, Z.-Q. (2006). A numerical simulation study of super Typhoon Saomei intensity and structure changes. Acta Meteorol. Sin. 67 (5), 750–763. (in Chinese). doi:10.11676/qxxb2009.075
Zhang, Y.-P., Yu, X.-D., Wu, Z., Liang, J.-P., and Lv, L.-Y. (2012). Analysis of the two tornado events during a process of regional torrential rain. Acta Meteorol. Sin. 70 (5), 961–973. (in Chinese). doi:10.11676/qxxb2012.081
Zhao, D.-J., Jiang, Y.-H., and Li, Y. (2011). Diagnostic analysis and numerical simulation of a torrential rainstorm process caused southwestern low vortex. Plateau Meteorol. 30 (5), 1158–1169. CNKI:SUN:GYQX.0.2011-05-002(in Chinese).
Zhao, Y.-C., and Wang, Y.-H. (2010). A case study on plateau vortex inducing southwest vortex and producing extremely heavy rain. Plateau Meteorol. 29 (4), 819–831. (in Chinese). doi:10.16082/j.cnki.issn.1001-4578.2016.01.017
Keywords: the Tibetan plateau vortex, the southwest vortex, coupling, vertical wind shear, radar echoes
Citation: Dong Y, Li G, Jiang X and Wang Y (2022) The characteristics and formation mechanism of double-band radar echoes formed by a severe rainfall occurred in the Sichuan Basin under the background of two vortices coupling. Front. Earth Sci. 10:915954. doi: 10.3389/feart.2022.915954
Received: 08 April 2022; Accepted: 27 June 2022;
Published: 25 July 2022.
Edited by:
Sanjeev Kumar Jha, Indian Institute of Science Education and Research, IndiaReviewed by:
Chenghai Wang, Lanzhou University, ChinaDevanil Choudhury, University of Bergen, Norway
Copyright © 2022 Dong, Li, Jiang and Wang. This is an open-access article distributed under the terms of the Creative Commons Attribution License (CC BY). The use, distribution or reproduction in other forums is permitted, provided the original author(s) and the copyright owner(s) are credited and that the original publication in this journal is cited, in accordance with accepted academic practice. No use, distribution or reproduction is permitted which does not comply with these terms.
*Correspondence: GuoPing Li, bGlndW9waW5nQGN1aXQuZWR1LmNu