 Kanthanathan Mahalinganathan
 Meloth Thamban
 Tariq Ejaz
 Rohit Srivastava
 B. L. Redkar
 C. M. Laluraj
- National Centre for Polar and Ocean Research, Ministry of Earth Sciences, Vasco da Gama, Goa, India
Stable isotopes of Antarcticice cores are used extensively in reconstructing the past climate. Variations in snow accumulation patterns and post-depositional processes such as changes in isotope ratios due to diffusion may complicate these records. We analyzed the spatio-temporal variations of snow accumulation, stable isotopic composition, and factors controlling their distribution along two transects in the Dronning Maud Land (DML) and Princess Elizabeth Land (PEL) regions of East Antarctica. The δ18O and δD variations are dominantly influenced by snow accumulation in the DML region and temperature in the PEL region. To evaluate the extent of diffusion in isotope records, the isotope record of an ice core (IND-33) drilled after 5 years close to the DML transect was compared with the snow isotope records. A quantitative comparison of the snow core δ18O records with that of the ice core revealed signal attenuation ranging between 55 and 70%. Using a firn diffusion model, we estimated a diffusion length of 6 cm in IND-33 over 5 years. Our study revealed that while isotope diffusion exists even in high accumulation sites of coastal Antarctica, it does not significantly impact the dating and paleoclimatic interpretation of isotope records, unlike in low accumulation areas.
Introduction
Snow and ice cores from polar ice caps provide a wealth of information on past climate with potentially higher temporal resolution than many other climate proxies. Stable water isotopes (δ18O and δD) have played an important role in ice core based paleoclimate studies ever since Dansgaard (1964) explained the relationship between the isotopic composition and the temperature of cloud at the condensation site. The δ18O records from polar snow incorporate the seasonal temperature variations at the time of snow deposition and show a strong association with the near-surface air temperature at any given site. In addition, the δD records also contain relative humidity signals over moisture regions (Jouzel et al., 1982). Consequently, the δ18O and δD records from polar ice cores have been effectively utilized to understand the changes in temperature, relative humidity, and snow accumulation ranging from decadal to the millennial time scale (EPICA community members, 2006; Masson-Delmotte et al., 2008; Pages 2k Consortium, 2013; Stenni et al., 2017; Rahaman et al., 2019).
A plethora of past climate information can be deduced using stable isotope records from polar ice cores. However, factors such as the preservation of seasonality signals and the extent of snow accumulation variations at a given location significantly impact the temporal resolution and the type of information available from ice cores, (e.g., Jouzel and Masson-Delmotte, 2010). For instance, the coastal regions in Antarctica experience significantly high snow accumulation rates, which allows for annually resolved paleoclimate reconstruction (Masson-Delmotte et al., 2003; Naik et al., 2010; Küttel et al., 2012; Ejaz et al., 2021). On the other hand, isotope records from low accumulation regions (and, therefore, lower temporal resolution) suggest the potential impact of post-depositional processes (Casado et al., 2018). It is well known that the ice sheet surface continually changes due to various mechanical factors such as wind redistribution and erosion, due to which the isotope signals get distorted (Petit et al., 1982; Whillans and Grootes, 1985; Johnsen et al., 2000). Additionally, laboratory experiments and field studies have shown that the isotope records from near-surface snow and firn undergo diffusion processes (Cuffey and Steig, 1998; Hörhold et al., 2011). The diffusion gives a unique characteristic to the isotope signals in ice (i.e., signal attenuation), having higher amplitudes in the top layers closer to the surface and reducing amplitudes with increasing depth and density (Schlosser and Oerter, 2002).
Stable isotope records undergo rapid diffusion in snow and firn, whereas isotope diffusion is significantly slower in solid ice (Johnsen, 1977). As a result, the seasonal amplitude of isotope records tends to homogenize in firn, resulting in a considerable reduction in the amplitude of seasonal isotope values at depths below the surface snow layers. Isotope diffusion and sublimation-condensation cycles were ascertained to be the dominant post-depositional processes in the inland regions of Antarctica (Ma et al., 2020). Isotope signals from ice cores drilled in the low accumulation regions show a relatively small signal-to-noise ratio and, as a result, do not allow the detailed analysis of short-term climate variations (Laepple et al., 2018). Results from isotopic models demonstrated that seasonal layering of isotope composition and high horizontal isotopic variability could be caused by local stratigraphic noise (Münch et al., 2016). Such phenomena create signals similar to seasonal isotope signals but are unrelated to past climatic conditions. Recent studies have also demonstrated that the ability to reconstruct past climatic conditions from ice cores depends on the noise created by sporadic precipitation, stratigraphic noise, and the strength of the input signal (Casado et al., 2020). Therefore, a systematic analysis of the various processes affecting the climatic signals in ice cores is critical for high-resolution climate reconstructions.
The temporal resolution of the isotope signals strongly depends on the heterogenous deposition of snow and the post-depositional processes (e.g., Casado et al., 2020). Therefore, temporal resolution in low accumulation ice core isotope records from inland Antarctica varies typically from multi-year to multi-decadal scales (e.g., Petit et al., 1982; Ekaykin et al., 2002). Compared to these, isotope records from high-accumulation coastal sites of Antarctica have been shown to achieve seasonal to annual resolution (e.g., Küttel et al., 2012; Goursaud et al., 2019; Ejaz et al., 2021; Dey et al., 2022). Further, the coastal areas of Antarctica are also shown to have different moisture sources than inland as cyclonic activity and the presence of sea ice play a crucial role. Although isotope diffusion in the firn column is critical for low accumulation sites (<0.1 m we yr−1), it is unclear whether it is relevant in high accumulation regions of coastal Antarctica. Since ice core records from higher accumulation areas of coastal Antarctica have received increased attention for climate studies, it is critical to quantify the potential diffusion of isotope signals in ice core records of coastal regions before making any quantitative estimate of paleoclimate parameters using stable isotopes.
In this study, we utilize a network of surficial snow cores (∼1-m length) along the coast to inland transects of Dronning Maud Land (DML) and Princess Elizabeth Land (PEL) in East Antarctica and establish the isotope seasonal signals and snow accumulation rates. We then compared the stacked isotopic profiles from a section in the DML region to the isotope record of an ice core drilled 5 years later to evaluate the isotope diffusion and attenuation of the amplitude in isotope signals. Our study aims to understand the fundamental processes relating to spatial variability in stable isotope records across two different geographic domains and to identify the extent of firn diffusion in isotope records of ice cores from high accumulation sites in coastal Antarctica.
Materials and methods
Snow sampling and processing
We collected 45 superficial snow cores along two coast-to-inland transects in the Princess Elizabeth Land (PEL) and the Dronning Maud Land (DML) during 2008–09 (Figure 1). The topography of the PEL transect revealed a steep escarpment zone between 20 and 50 km from the coast with a rapid increase in elevation (an average slope of 27 m km−1) beyond which the slopes were significantly smaller (8–9 m km−1) (Mahalinganathan et al., 2012). The topography of the DML transect, on the other hand, consisted of the major mountain range parallel to the coast, having an orographic influence on snow accumulation in this region (Mahalinganathan and Thamban, 2016). Accordingly, the transects were categorized into coastal, mountainous and inland regions based on the regional topography and the extent of sea-salt intrusion recorded in the snow cores, as detailed in our earlier publications (Mahalinganathan et al., 2012; Mahalinganathan and Thamban, 2016). The snow cores (14 cm in diameter) collected using a KOVACS Mark IV coring system were transferred directly into pre-cleaned high-density polyethylene bags and sealed immediately to avoid contamination. These were stored in expanded polypropylene (EPP) boxes and shipped at –20°C to the National Centre for Polar and Ocean Research (NCPOR), India. All EPP boxes were stored at the NCPOR ice core storage facility (at –20°C) until they were opened for processing and analysis. The average lengths of snow cores retrieved from the coastal, mountainous, and inland sections in DML were 89, 77, and 94 cm, respectively. In PEL, the core lengths averaged 86 and 76 cm in the coast and inland sections, respectively. Each snow core was further sub-sampled at 5 cm resolution by manually removing the outer layer using a clean ceramic knife. A total of 750 sub-samples were processed and transferred to 10 ml Teflon vials and sealed until stable isotope analyses.
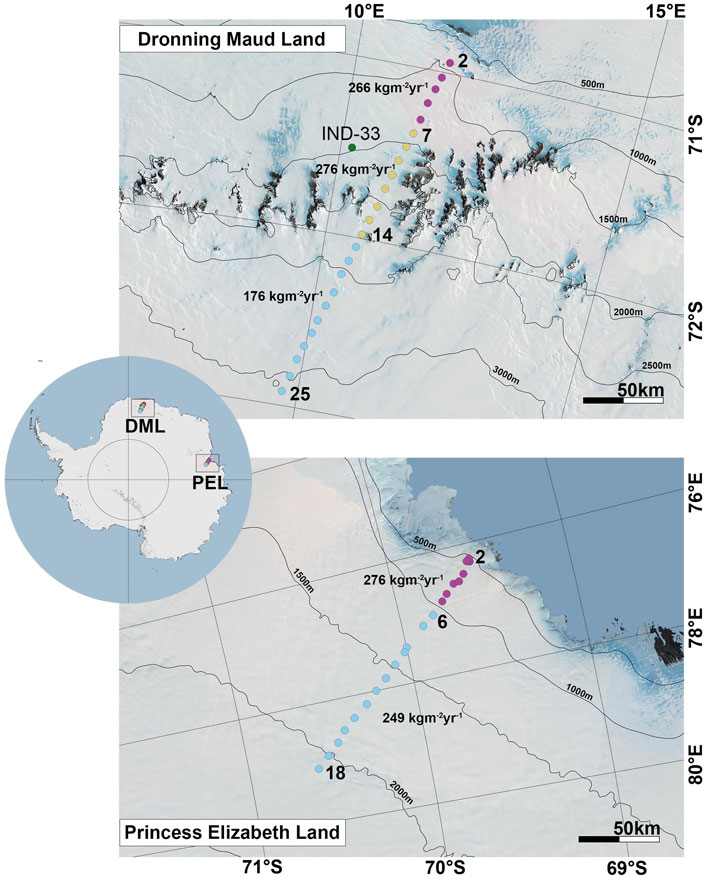
FIGURE 1. Study region showing sampling locations along the DML and PEL transects in East Antarctica. Color coded sampling locations indicate coastal (purple), mountainous (yellow) and inland (blue) regions of the transect. Mean snow accumulations in these respective regions are given in terms of kg m−2 yr−1. The ice core (IND-33) in the DML region was drilled during the 2013–14 field season. Background maps from the RADARSAT Antarctic Mapping Project version 2 (RAMP2) and LIMA Landsat high-resolution virtual mosaic (15 m) using the Quantarctica project.
Isotope analysis
All sub-samples in 10 ml Teflon vials were melted and analyzed (in 2010–11) for oxygen and hydrogen isotopes (δ18O and δD) using a dual inlet, Isoprime Isotope Ratio Mass Spectrometer (IRMS), following standard procedures detailed in Naik and others (2010). The external precision obtained using the laboratory standard (DML1), which was calibrated against the Vienna Standard Mean Ocean Water (VSMOW) standard, was ±0.05‰ and ±0.77‰ for δ18O and δD, respectively. Further, to examine the isotope diffusion in storage, we reanalyzed fresh snow samples melted from the archives during 2017–18, using a laser-based Off-Axis—Integrated Cavity Output Spectroscopy (OA–ICOS) Triple Isotope Water Analyzer (TIWA) by Los Gatos Research. This reanalysis was made considering the long storage period of snow cores at –20°C between the first (2010–11) and the second analysis (2017–18) and to check the consistency of data generated by two entirely different isotope measurement techniques. The melted samples were introduced directly into the TIWA using a Hamilton 1.2 µL zero dead volume syringe via an auto-injector equipped with a heated (∼85°C) injector block. Four blank injections (injections that are not measured) followed by five measurement injections were run for each sample to eliminate the inter-sample memory effect. The last five injections were averaged to produce a single, high-throughput sample measurement. The analytical precision obtained in TIWA was ±0.1‰ and ±0.5‰ for δ18O and δD, respectively.
Considering the availability of two separate datasets for the same samples, we used this opportunity to validate the quality of the measurements by comparing the IRMS and TIWA datasets. Excellent statistical agreement between the data generated by different techniques separated by nearly 7 years further validated the quality of the dataset (Figure 2). Following the method of Bland and Altman (1999), these two datasets were examined by constructing limits of agreement derived from the mean and the standard deviation of the differences between measurements. The majority of data points lie within the ±2σ of the mean difference (Figure 2A), indicating a good agreement between the IRMS and TIWA measurements. However, data from DML 21–25 cores did not show good agreement, probably due to a substantial delay between δ18O and δD analysis for these samples using IRMS (Figure 2B). Unlike IRMS measurements, correlation between δ18O and δD by TIWA revealed an excellent linear relationship since both δ18O and δD are simultaneously measured. Therefore, in this study, only the TIWA isotope data were considered for detailed spatio-temporal analysis.
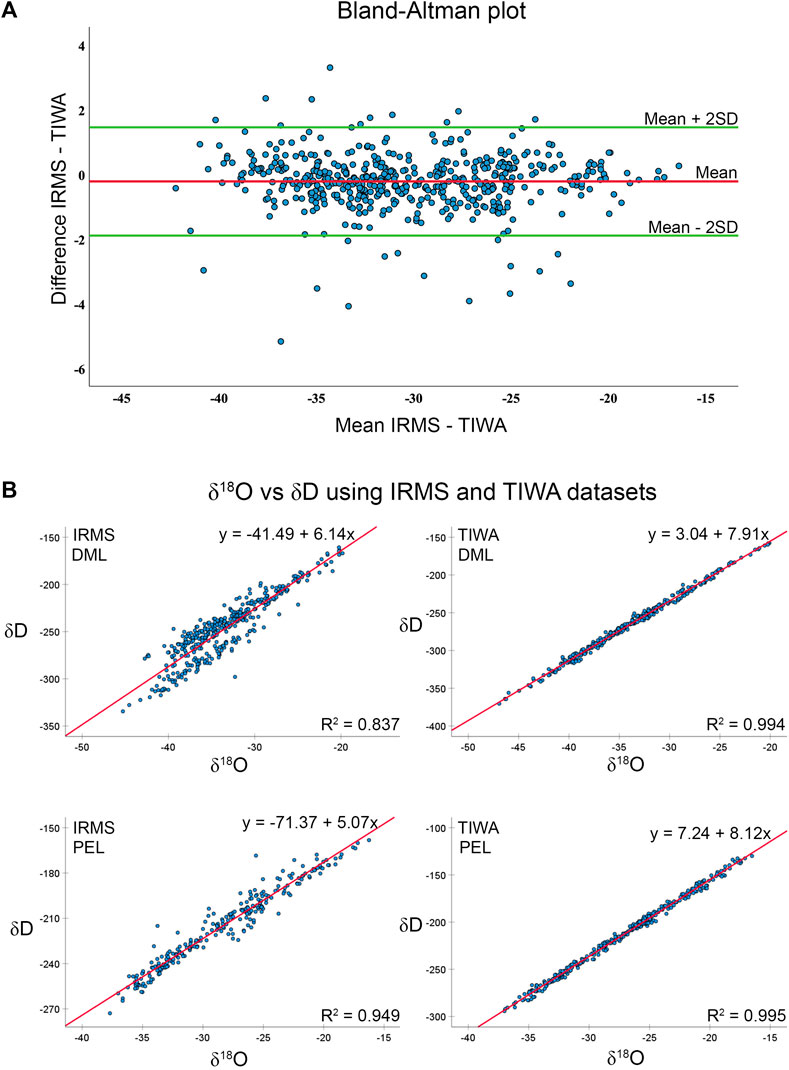
FIGURE 2. (A) Plot showing agreement between majority of the IRMS and TIWA measurements. The mean and SD are 0.19 and 1.511, respectively. The upper and lower limits of agreements are 3.156 and –2.769, respectively. (B) Correlation between δD and δ18O in DML and PEL was significant (p < 0.01) using IRMS and TIWA measurements. The TIWA measurements showed a better linear relationship between δD and δ18O.
Seasonality and snow accumulation
The seasonality in snow cores was initially determined by establishing the summer and winter peaks in isotope records (Figure 3A). When the seasonality signals in δ18O records were unclear, we used sea-salt impurity (mainly Na) signals to identify annual layers, as detailed in the previous studies (Mahalinganathan et al., 2012; Mahalinganathan and Thamban, 2016). A minimum amplitude of 4‰ in δ18O values could be observed in all isotope profiles. As suggested by Stenberg et al. (1998), this cut-off value was initially considered to demarcate the summer and winter signals.
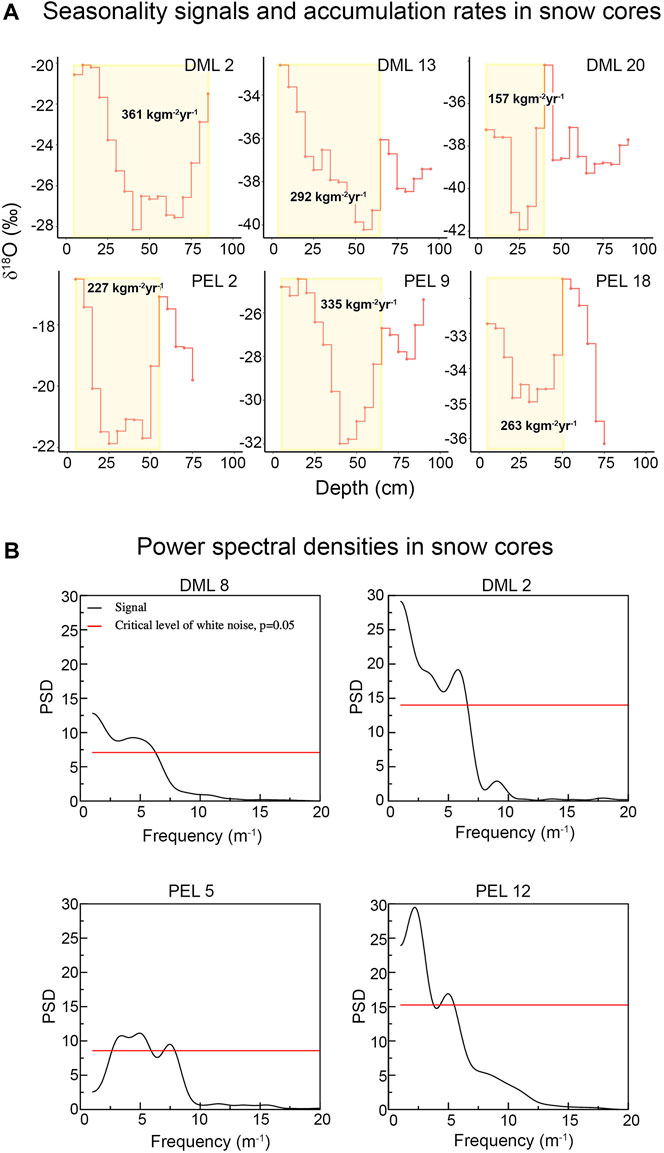
FIGURE 3. A combination of seasonal amplitude plots (A) and power spectral density (PSD) plots (B) were utilized to identify and eliminate spurious peaks in snow cores. While the seasonal amplitude plots revealed clear summer/winter patterns, the PSDs were used to avoid non-seasonal peaks. The shaded area indicates the estimated annual layer. Annual accumulation rates were calculated based on the annual layer depth and density measurements.
Additionally, all cores were also diffused with white noise and compared with the original record to eliminate those peaks that do not imply any season. Spectral analysis was carried out to eliminate non-seasonal peaks following the procedures detailed in Laepple et al. (2018). The snow core isotope profiles were linearly detrended, and spectra were estimated using Thomson’s multitaper method with three windows. Considering that all cores were sub-sampled at uniform resolution, no aliasing effects were expected during the analysis. The power spectral densities were tested for significance against a null hypothesis of noise induced by possible diffusion of actual seasonal signals in firn. A Monte Carlo procedure was used to simulate the diffusion of white noise profiles across the transect. Peaks in the power spectral density plots were above the critical level of white noise at 95% significance level (Figure 3B). The frequency corresponding to 20 cm depth was 5 m−1. With the above constraints, we determined the summer and winter seasonal peaks in all snow cores. The annual snow accumulation rates were determined using the seasonality in proxy parameters and the measured snow density data (Tables 1, 2). Additionally, modelled snow accumulation rates for 2008 were retrieved from the ERA-5 Reanalysis dataset with a resolution of 0.1 x 0.1°.
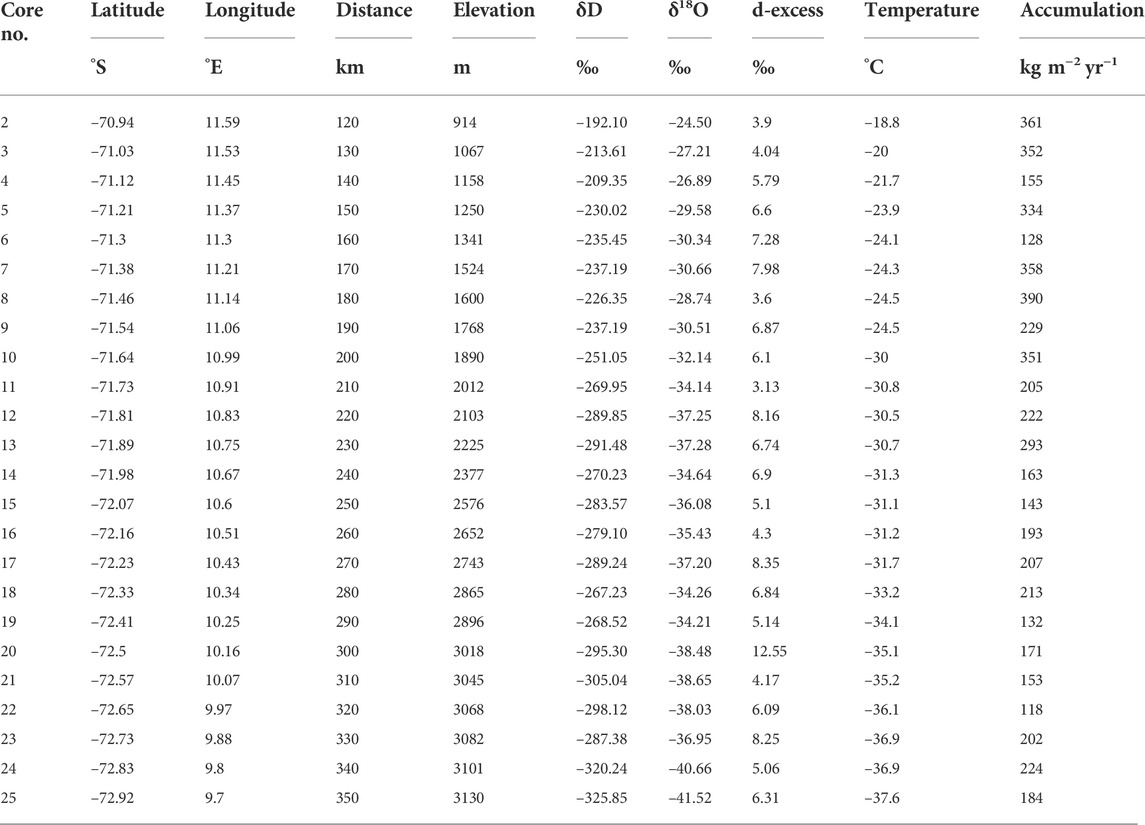
TABLE 1. Geographical distribution and annual-averaged stable isotope values and accumulation rates (w.e) of the snow cores from DML region. Annually averaged temperature estimates for the year 2008 was taken from ERA-5. The distance column shows the distance measured from the coast.
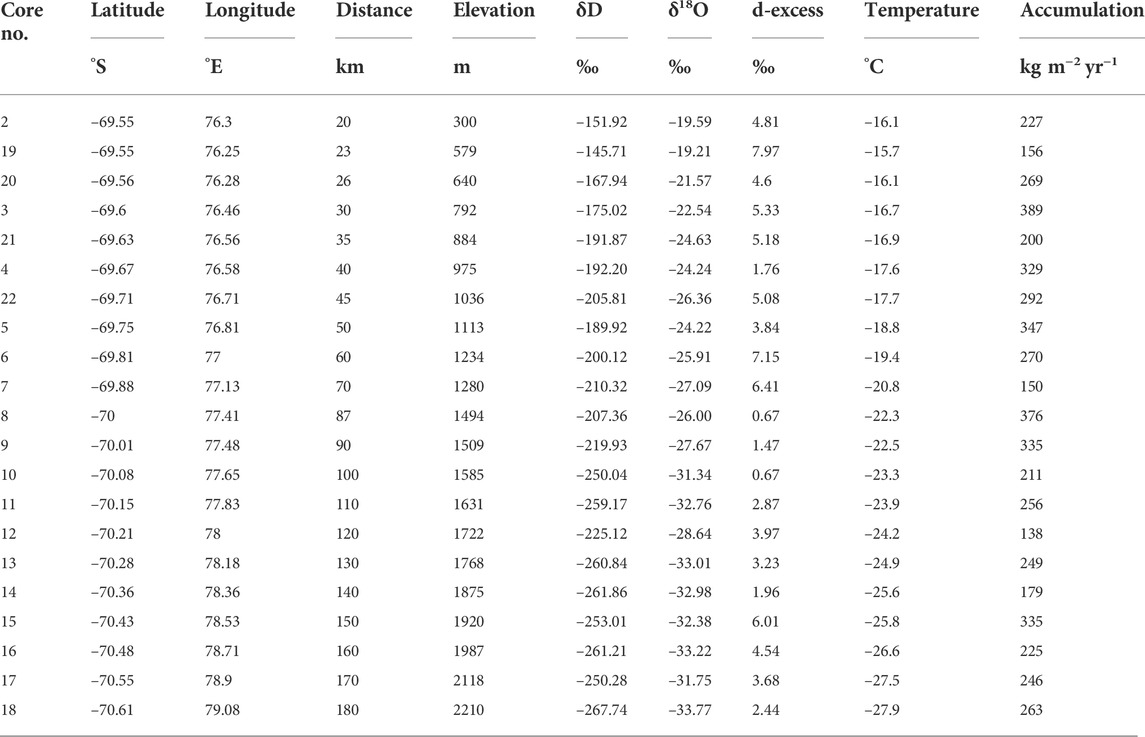
TABLE 2. Geographical distribution and annual-averaged stable isotope values and accumulation rates (w.e) of the snow cores from PEL region. Annually averaged temperature estimates for the year 2008 was taken from ERA-5. The distance column shows the distance measured from the coast.
Isotope diffusion model
To verify the extent of post-depositional isotope diffusion in the study region, we compared the δ18O records of the snow cores from DML with an ice core (IND‐33) drilled from this region. The IND‐33 ice core was drilled 5 years after retrieving snow cores and is located close to the snow core transect (Figure 1). The chronology of this core was constrained using multiple and independent techniques (Ejaz et al., 2021).
Oxygen isotope signals from the IND-33 ice core drilled close (∼20 km) to the snow cores from the DML transect were used to estimate the extent of firn diffusion. The firn diffusion model originally described by Johnsen et al. (2000) was employed to estimate the diffusion length using the equations provided in Gkinis et al. (2014), Dee et al. (2015), and Münch and Laepple (2018). This equation is given as:
where σ is the diffusion length, ρ is the firn density at a given depth, ρ0 is the surface density, and D is the isotopic diffusivity in firn, which is calculated using the equation in Johnsen et al. (2000).
where ρ is the saturation vapor pressure over ice, τ is the tortuosity factor in ice, Ωai is the diffusivity of water vapour in air, m is the molar weight of water, and R is the gas constant. The IND‐33 ice core site-specific parameters such as surface pressure, temperature, and accumulation rate were used to model the diffusion length in the core. The density and local accumulation rates were directly measured from the snow cores and ice core data, while the temperature and local mean surface pressure values for the year 2008 were derived from the ERA-5 Reanalysis dataset with a resolution of 0.1 x 0.1°. The diffusion model was run using the R package firnR (Münch and Laepple, 2018). The change in amplitude of annual δ18O cycles was calculated using the following equation:
Here Af is the final amplitude in the ice core, and Ai is the initial amplitude in the surface snow cores. L is the diffusion length in the ice core, and α is the average annual accumulation in the ice core site.
Results and discussion
Spatial variability in snow accumulation rates
Snow accumulation in Antarctica is an important parameter influenced by climatic factors and is critical to interpreting past environmental conditions. Snow accumulation varies spatially depending upon synchronized undulations in topographical features and surface slope (Frezzotti et al., 2002). The snow accumulation rates in DML and PEL transects decreased from coastal to inland locations (Tables 1, 2). Annual accumulation rates in the coastal section of DML ranged between 128 and 361 kg m−2 yr−1 (mean 266 kg m−2 yr−1), while in the inland section, it ranged between 118 and 224 kg m−2 yr−1 (mean 176 kg m−2 yr−1) with the mountainous section ranging between 176 and 390 kg m−2 yr−1 (mean 276 kg m−2 yr−1). In PEL, the snow accumulation ranged between 156 and 390 kg m−2 yr−1 (mean 276 kg m−2 yr−1) in the coastal section, while in the inland section, it ranged between 138 and 376 kg m−2 yr−1 (mean 249 kg m−2 yr−1). Snow cores in the coastal areas recorded up to two summers and a winter (representing just over 1 year), while the inland sections showed a maximum of three annual layers, thereby representing up to 3 years of accumulation. Since the cores were drilled during the 2008–09 summer, the top layer of the cores represented the summer of 2008–09 and earlier periods. Very few cores exhibited winter top layers, and we considered one complete seasonal cycle as an annual layer. Similarly, the inland cores in DML (21–25) represented 2007 and older accumulation. We considered only samples representing a complete annual layer from the top representing 2008 to maintain uniformity in accumulation analysis.
The topmost layer of the snowpack usually shows high amplitude in δ18O records (Küttel et al., 2012). The coastal section of DML showed the largest variation between summer and winter δ18O values, with differences ranging between 8‰ and 15.7‰ (Figure 3A). Stacked isotope profiles revealed that almost all snow cores (except DML 6 and DML 19) were well-preserved in the top layer, recording ongoing summer (Figure 6B, snow profiles). However, in PEL transect, almost all cores in the steep coastal section showed the winter layer on top, indicating the snow redistribution aided by the topography and possibly driven by the strong katabatic winds along this zone (Allison, 1998). Establishing such annual layers is a critical requirement as it directly impacts the estimation of snow accumulation rates in high-resolution ice core studies.
The presence of physical barriers further complicates the snow accumulation pattern over the ice sheet owing to the complex interaction between the katabatic winds (Goodwin, 2004) and the surface features, leading to post-depositional snow redistribution (Melvold et al., 1998; Vaughan et al., 1999). Such a scenario has been observed in the steep escarpment zone of coastal PEL, especially at core sites 3, 5, 6, 19, 20, and 22. Further, a surface topography-influenced increase in the snow accumulation on the windward side and less accumulation on the leeward side was reported by Frezzotti et al. (2002). The accumulation rates in the DML region support such a scenario, where the windward near-coastal and the mountainous sections had a substantially high average accumulation of 266 and 276 kg m−2 yr−1, respectively (Table 1). Compared to this, the interior section of the transect, which falls on the leeward side, had a considerably lower accumulation rate than the coast (average of 176 kg m−2 yr−1). Such large spatial variability in the DML region is attributed to the mountain chain parallel to the coast. These mountains act as an orographic barrier to the air masses arriving from the Southern Ocean, impacting snow accumulation. Highly periodic dunes in the near-coastal area of DML were reported earlier (Anschütz et al., 2006). Such dunes are known to influence the spatial snow accumulation patterns (Frezzotti et al., 2002). The physiography and topography of the DML region influenced the snow accumulation rates, showing a strong correlation with distance and elevation (Table 3). On the contrary, the PEL transect does not have any mountainous features and therefore showed no large variations in accumulation patterns with little variation between the coastal (276 kg m−2 yr−1) and the inland (260 kg m−2 yr−1) sections (Table 1). This could also be because the entire sampling transect falls within 180 km of the coast, similar to the coastal section of the DML transect. Although there is a substantial slope (>8 m km−1) along the PEL transect (Mahalinganathan et al., 2012), it did not affect the overall accumulation rates in the region. Such a uniform accumulation pattern in the PEL transect could be explained by snowdrift and redistribution induced by strong katabatic winds in this region (Ding et al., 2020). With no orographic barriers to influence the flow of katabatic winds, the accumulation pattern in PEL is smoothed by wind scouring and snow redistribution. Snow accumulation rates showed a significant relationship with the distance and elevation (R = 0.574 and 0.600, p < 0.003), stable isotopes (R = 0.439 and 0.418, p < 0.042) and temperature (R = 0.572, p = 0.003) in the DML transect, indicating a synchronized relationship between the topography and accumulation patterns that was aided by the position of mountains. In the PEL transect, there was no significant relationship between accumulation and the rest of the parameters.
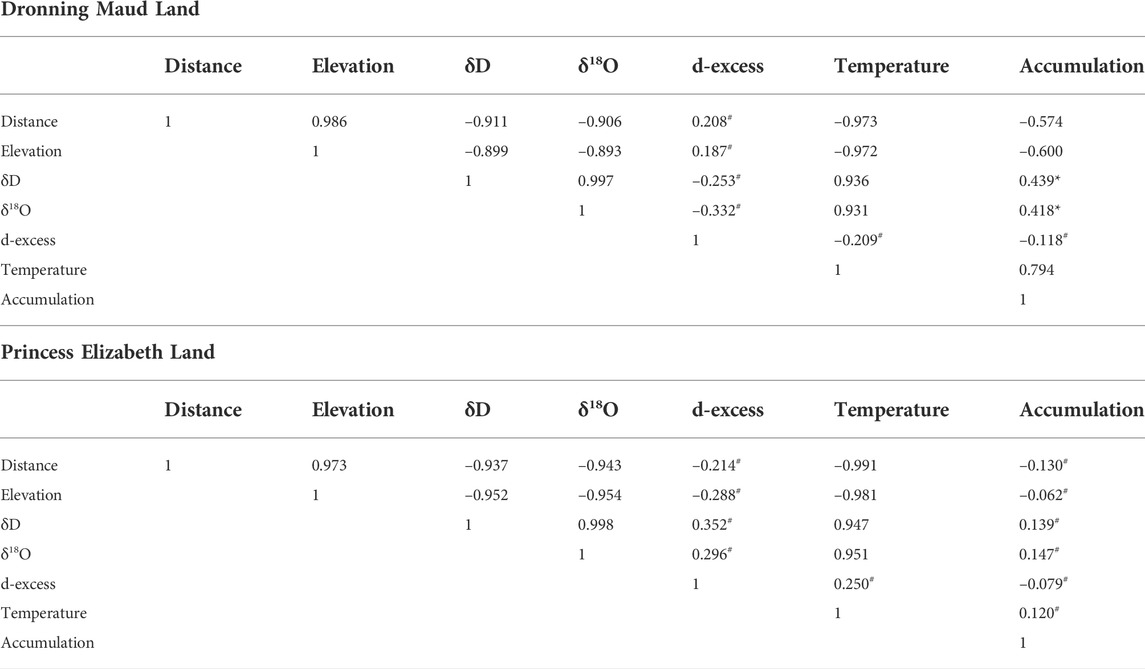
TABLE 3. Correlation between stable isotopes and physical parameters in DML and PEL regions. All unmarked correlations are significant at 0.01 level;# indicates insignificant correlations and * indicates 0.05 level significance.
Further, we analyzed the percentage difference in accumulation rates between the in situ values and ERA-5 reanalysis snowfall data. In the DML region, ERA-5 reanalysis snow accumulation data over-estimated the in situ values in the coastal section by 16%, while they were underestimated by 42 and 35% in the mountainous and inland sections. In PEL, the ERA-5 data over-estimated the coastal section snowfall by 33%, while in the inland section the snowfall data were 13% overestimated.
Relationship between stable isotope records and physical parameters
The relationship between δ18O and δD from all snow core sub-samples (n = 750) was assessed using linear regression analysis (Figure 4). The analysis showed a strong correlation between δ18O and δD in both the DML (blue circles, r2 = 0.994) and PEL (red circles, r2 = 0.995) transects from coastal to inland regions. Within the analytical uncertainties, the slopes of the PEL transect (8.12) and DML transect (7.91) were close to that of the global meteoric water line [δD = 8.13 x δ18O + 10.8 (Craig, 1961)].
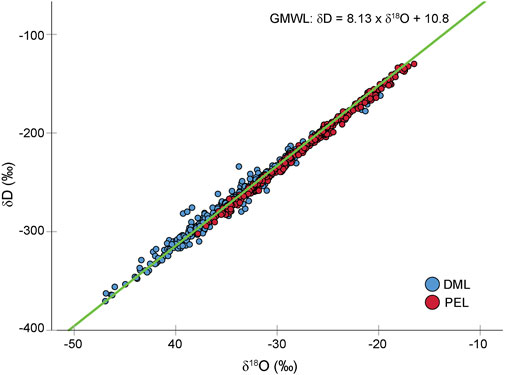
FIGURE 4. Relationship between δD and δ18O in DML and PEL transects. The green line is the Global Meteoric Water Line.
The annual mean values of δ18O and δD at each snow core decreased from coastal to inland sites in both the DML and PEL regions, suggesting the typical continental effect, i.e., depletion of δ18O and δD with increasing distance and elevation from the moisture source (Tables 1, 2). This effect can also be observed from the correlation in Table 3, wherein the distance and elevation from both the DML and PEL regions showed a strong correlation (R > 0.9, p < 0.001). A significant positive relationship was observed between the mean δ18O and mean temperature (ERA5 reanalysis data) in both the DML and PEL regions (R = 0.931 in DML and R = 0.951 in PEL, p < 0.001) (Table 3). An in-depth correlation analysis between the δ18O values and the monthly average temperatures for 2008 showed significant correlations at 3 or 4 phase lag in the DML and PEL regions for some cores. However, many cores did not show significant correlations, which could be due to the type and resolution of the ERA-5 reanalysis temperature data. However, a linear relationship between the ERA-5 annual mean temperature and δ18O in the snow cores was evident (Figure 5).
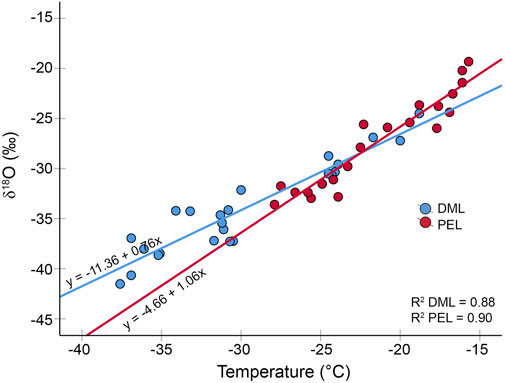
FIGURE 5. Relationship between δ18O and annual mean temperature (ERA-5) in DML and PEL transects.
To further evaluate the role of physical parameters on the variability of δ18O records, hierarchical multiple linear regression was carried out between the δ18O values and geographical/climatic parameters (Table 4). Based on these regressions in the DML region, the snow accumulation changes were the primary driver (61%) for spatial variations in δ18O values. Surface temperature also had a noticeable effect on isotopic values in this region (23%). However, in the PEL region, snow accumulation did not play a significant role in the spatial variations of δ18O while temperature played a dominant role, accounting for 89.4% of the variability in δ18O. The distance from the coast and elevation is known to impact the isotopic variation in Antarctic snow (Masson-Delmotte et al., 2008; Huybrechts et al., 2017). However, due to large topographical changes within short distances, the relationships between the physical parameters and isotopic values are more complex in coastal regions of Antarctica. Since accumulation and temperature parameters are directly impacted by the distance from the coast and elevation, these features influence the isotopic changes indirectly.
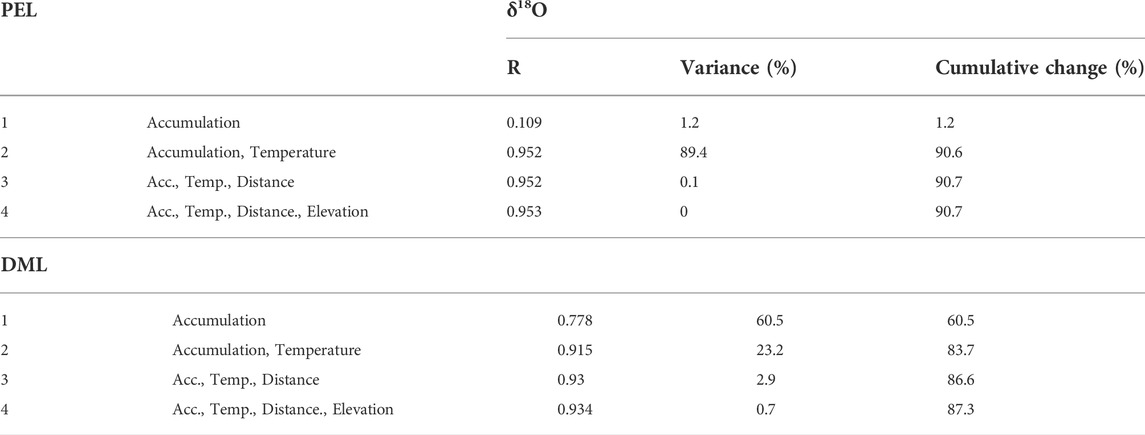
TABLE 4. Hierarchical multiple regression analysis explaining the percentage of stable isotope variability attributed to accumulation, temperature, and other physical parameters. Temperature effect is clear in PEL while precipitation effect is dominant in DML region.
The δ18O–temperature (δ18O–T) relationship varies depending on the location of the sampling sites. A continent-wide study by Masson-Delmotte and others (2008) obtained a spatial δ18O–T slope of 0.80‰ per degree Celsius, where the spatial slopes were calculated considering a radius of 400 km, thereby smoothing out the regional topography and moisture source areas. The annual δ18O–T relationship is generally weak in the coastal regions of Antarctica (Bertler et al., 2011; Thomas et al., 2013; Goursaud et al., 2019). Isaksson and Karlén (1994) observed a poor correlation between δ18O and temperature below 1,000 m a.s.l and a significant correlation above 1,000 m a.s.l. The present study, covering a transect from coast to inland, includes various topographic features. Our study area showed that with an increase of every 1°C temperature, there was an increase in the δ18O value by 2‰ in DML and 1‰ in PEL (Figure 5), suggesting the complications involved in using generalized spatial δ18O–T relationships in coastal regions.
Unlike the δ18O and δD records, the deuterium excess (d) values showed no significant correlation with distance and elevation in DML and PEL transects (Table 3). Studies have shown that even though both elevation and distance generally control the d values, data from locations below 2,000 m elevation across Antarctica did not reveal any significant correlation (Masson-Delmotte et al., 2008). While the PEL transect in this study had only two sampling sites above 2,000 m elevation, the snow cores collected above 2,000 m altitude in the DML transect also did not show any meaningful correlation between the d and distance/elevation. This could be attributed to the differences in moisture sources as reported in other parts of Antarctica (Simmonds et al., 2003).
Isotope diffusion and its impact on ice core records in coastal Antarctica
One of the critical post-depositional processes occurring over the topmost layer of the ice sheet is firn diffusion—where the water molecules in the vapour phase diffuse through the firn column (Johnsen, 1977; Whillans and Grootes, 1985). The degree of smoothing of the stable isotope record depends on the isotopic diffusion length, which is shown to increase in the topmost firn layer (Johnsen et al., 2000). In this section, we estimated the extent of diffusion in the IND‐33 ice core located within the proximity of the coastal DML transect (<20 km) by calculating the diffusion length in the ice core. The diffusion length was estimated using a firn diffusion model (Johnsen and others, 2000), using the site-specific average temperature (–22°C), surface firn density (340 kg m−3), local mean surface pressure (810 mbar) and the local accumulation rate (176 kg m−2 yr−1). The decadal (2013–2003) means obtained from ERA-5 data were used for the surface pressure and the accumulation rates.
The firn diffusion model output revealed a rapid increase in diffusion length from the surface to 2.5 m (6 cm), attaining a maximum of 10 cm at 30 m in the IND-33 ice core (Figure 6A). Further, we estimated the extent of signal attenuation in this ice core by comparing the initial isotope signals of the snow and the final isotope signal of the same year represented in IND-33. Towards this, we used multiple snow core isotope records from DML that were collected in 2008 and compared them with the isotope records of IND-33 recovered in 2013 (Figure 6B). Since many snow cores were collected along the DML transect with an annual surface average temperature varying between –13.4 and –37.4°C (Table 1), we stacked a suite of cores from the DML transect (cores 7–12) in the proximity of the IND‐33 core to avoid the possible temperature-related differences in diffusion. The amplitude of δ18O signals in the snow cores was much higher than in the IND‐33 ice core (Figure 6B). Differences between summer maximum and winter minimum in the selected snow cores ranged from 2.6 to 12.05‰ (mean difference = 6.96‰ and σ = 2.5‰). We have used the average snow accumulation rates along with the ice core accumulation average at 2.5 m to avoid the under-estimation of the signal attenuation.
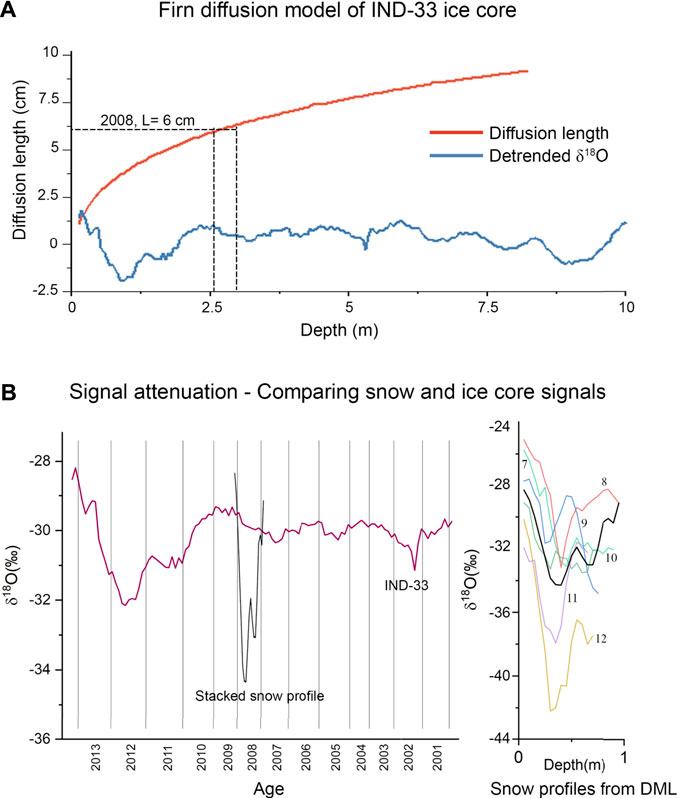
FIGURE 6. (A) The firn diffusion model output shows the diffusion length rapidly increasing from the surface layer before attaining its maximum at deeper layers. The diffusion length for the year 2008 was 6 cm (B) Differences in seasonal amplitudes of δ18O records of IND‐33 and the average snow core profile from the DML transect. Stacked profiles from which the average snow core profile is on the right. The signal attenuation in the ice core layer ranged between 55 and 70%.
A direct quantitative comparison of δ18O values of the IND-33 ice core to snow cores from the DML transect showed considerable diffusion in the seasonal amplitude of δ18O (Figure 6B). Considering an average snow accumulation rate (α) of 230 kg m−2 yr−1 from snow cores and a diffusion length (L) of 6 cm representing the year of snow deposition (2008), we have estimated the signal attenuation between 55 and 70%. The snow accumulation rates are the major factors controlling isotope signal attenuation in the study region. Accordingly, only ∼2–3‰ δ18O amplitude was preserved, similar to the ice core isotope data (Figure 6B). While many factors like sublimation, condensation, katabatic winds, wind redistribution and scouring could impact snow record smoothing, isotope diffusion is still relevant in coastal Antarctica. Considering that most available studies in Antarctica focus on the broadscale relationships across the continent (e.g., Masson-Delmotte et al., 2008), such studies are not ideal for the interpretation of coastal ice core records. This study not only provides an improved spatial distribution of snow isotopic records in the coastal DML and PEL regions but also provides quantitative information on isotope diffusion in high accumulation areas of coastal Antarctica.
Since our study is limited to coastal areas and local conditions may affect the snow accumulation and diffusion, this cannot be generalized across Antarctica. However, our study indicates that while the effect of diffusion exists, it does not obscure the seasonal signals when the accumulation rates are higher, thereby preserving overall paleoclimatic information in the ice core records in coastal Antarctica. This finding would be helpful in identifying annual layers from the ice cores in coastal Antarctica and, subsequently, in the interpretation of ice core stable isotope records by considering the effects of diffusion on its inter-annual variability.
Conclusion
Our study explored the spatial variability and diffusion in stable isotope records and snow accumulation variations from different regions in Antarctica. The stable isotope records (δ18O and δD) of snow cores collected in 2008–09 along two coast-to-inland transects in East Antarctica aided in investigating the spatial variations and the influences of meteorological and topographical controls. The present study revealed that while air temperature played a dominant role in spatial variations of δ18O values in the PEL region, snow accumulation changes were the primary driver in the DML region. Our findings indicate the complications of using generalized spatial δ18O—T relationships in coastal Antarctica, which has large topographical gradients. Comparing a stacked isotope record of snow cores from the DML transect representing snow accumulated during 2008 with that of the IND-33 ice core collected after 5 years, we estimated that the isotope signal attenuation ranged between 55 and 70%. Further, using a firn diffusion model, we calculated a diffusion length of 6 cm in the ice core over a period of 5 years. Our study reveals that although isotope diffusion and resultant δ18O signal attenuation exist in the high accumulation areas of coastal Antarctica, it does not significantly affect the paleoclimatic interpretation of isotope records.
Data availability statement
The original contributions presented in the study are included in the article/supplementary material; further inquiries can be directed to the corresponding author.
Author contributions
KM collected snow cores and the ice core, analyzed the data, and wrote the paper. MT collected the ice core, analyzed the data, and wrote the paper. TE analyzed and interpreted the IND‐33 ice core samples. RS analyzed the data. CML and BLR collected snow/ice core and analyzed samples. All authors reviewed the manuscript.
Acknowledgments
We thank the Ministry of Earth Sciences for financial support through the “PACER—Cryosphere and Climate” project. We are grateful for the support from the members and logistic crew of the 28th and 33rd Indian Scientific Expeditions to Antarctica. We also thank the Norwegian Polar Institute for the Quantarctica QGIS package. This is NCPOR contribution number J-33/2022-23.
Conflict of interest
The authors declare that the research was conducted in the absence of any commercial or financial relationships that could be construed as a potential conflict of interest.
Publisher’s note
All claims expressed in this article are solely those of the authors and do not necessarily represent those of their affiliated organizations, or those of the publisher, the editors, and the reviewers. Any product that may be evaluated in this article, or claim that may be made by its manufacturer, is not guaranteed or endorsed by the publisher.
References
Pages 2k Consortium (2013). Continental-scale temperature variability during the past two millennia. Nat. Geosci. 6, 339–346. doi:10.1038/ngeo1797
Allison, I. (1998). Surface climate of the interior of the Lambert Glacier basin, Antarctica, from automatic weather station data. Ann. Glaciol. 27, 515–520. doi:10.3189/1998aog27-1-515-520
Anschütz, H., Eisen, O., Rack, W., and Scheinert, M. (2006). Periodic surface features in coastal East Antarctica. Geophys. Res. Lett. 33, L22501. doi:10.1029/2006gl027871
EPICA community members (2006). One-to-one coupling of glacial climate variability in Greenland and Antarctica. Nature 444, 195–198. doi:10.1038/nature05301
Bertler, N. a. N., Mayewski, P. A., and Carter, L. (2011). Cold conditions in Antarctica during the Little Ice Age — implications for abrupt climate change mechanisms. Earth Planet. Sci. Lett. 308, 41–51. doi:10.1016/j.epsl.2011.05.021
Bland, J. M., and Altman, D. G. (1999). Measuring agreement in method comparison studies. stat. methods med. res. 8, 135–160. doi:10.1191/096228099673819272
Casado, M., Landais, A., Picard, G., Münch, T., Laepple, T., Stenni, B., et al. (2018). Archival processes of the water stable isotope signal in East Antarctic ice cores. Cryosphere 12, 1745–1766. doi:10.5194/tc-12-1745-2018
Casado, M., Munch, T., and Laepple, T. (2020). Climatic information archived in ice cores: Impact of intermittency and diffusion on the recorded isotopic signal in Antarctica. Clim. Past. 16, 1581–1598. doi:10.5194/cp-16-1581-2020
Craig, H. (1961). Isotopic variations in meteoric waters. Science 133, 1702–1703. doi:10.1126/science.133.3465.1702
Cuffey, K. M., and Steig, E. J. (1998). Isotopic diffusion in polar firn: Implications for interpretation of seasonal climate parameters in ice-core records, with emphasis on central Greenland. J. Glaciol. 44, 273–284. doi:10.3189/s0022143000002616
Dansgaard, W. (1964). Stable isotopes in precipitation. Tellus 16, 436–468. doi:10.1111/j.2153-3490.1964.tb00181.x
Dee, S., Emile-Geay, J., Evans, M. N., Allam, A., Steig, E. J., and Thompson, D. M. (2015). Prysm: An open-source framework for PRoxY System Modeling, with applications to oxygen-isotope systems. J. Adv. Model. Earth Syst. 7, 1220–1247. doi:10.1002/2015ms000447
Dey, R., Thamban, M., Laluraj, C. M., Mahalinganathan, K., Redkar, B. L., Kumar, S., et al. (2022). Application of visual stratigraphy from line-scan images to constrain chronology and melt features of a firn core from coastal Antarctica. J. Glaciol., 1–12. doi:10.1017/jog.2022.59
Ding, M., Yang, D., Van Den Broeke, M. R., Allison, I., Xiao, C., Qin, D., et al. (2020). The surface energy balance at panda 1 station, princess Elizabeth Land: A typical katabatic wind region in East Antarctica. J. Geophys. Res. Atmos. 125, e2019JD030378. doi:10.1029/2019jd030378
Ejaz, T., Rahaman, W., Laluraj, C. M., Mahalinganathan, K., and Thamban, M. (2021). sea ice variability and trends in the western Indian ocean sector of Antarctica during the past two centuries and its response to climatic modes. JGR. Atmos. 126, e2020JD033943. doi:10.1029/2020jd033943
Ekaykin, A., Lipenkov, V., Barkov, N., Petit, J., and Masson-Delmotte, V. (2002). Spatial and temporal variability in isotope composition of recent snow in the vicinity of Vostok station, Antarctica: Implications for ice-core record interpretation. Ann. Glaciol. 35, 181–186. doi:10.3189/172756402781816726
Frezzotti, M., Gandolfi, S., and Urbini, S. (2002). Snow megadunes in Antarctica: Sedimentary structure and genesis. J. Geophys. Res. 107, 4344. ACL 1-1-ACL 1-12. doi:10.1029/2001jd000673
Gkinis, V., Simonsen, S. B., Buchardt, S. L., White, J. W. C., and Vinther, B. M. (2014). Water isotope diffusion rates from the NorthGRIP ice core for the last 16, 000 years – glaciological and paleoclimatic implications. Earth Planet. Sci. Lett. 405, 132–141. doi:10.1016/j.epsl.2014.08.022
Goodwin, I. D. (2004). Snow accumulation and surface topography in the katabatic zone of Eastern Wilkes Land, Antarctica. Antarct. Sci. 2, 235–242. doi:10.1017/s0954102090000323
Goursaud, S., Masson-Delmotte, V., Favier, V., Preunkert, S., Legrand, M., Minster, B., et al. (2019). Challenges associated with the climatic interpretation of water stable isotope records from a highly resolved firn core from Adélie Land, coastal Antarctica. Cryosphere 13, 1297–1324. doi:10.5194/tc-13-1297-2019
Hörhold, M. W., Kipfstuhl, S., Wilhelms, F., Freitag, J., and Frenzel, A. (2011). The densification of layered polar firn. J. Geophys. Res. 116 (F1). doi:10.1029/2009jf001630
Huybrechts, P., Steinhage, D., Wilhelms, F., and Bamber, J. (2017). Balance velocities and measured properties of the Antarctic ice sheet from a new compilation of gridded data for modelling. Ann. Glaciol. 30, 52–60. doi:10.3189/172756400781820778
Isaksson, E., and Karlén, W. (1994). Spatial and temporal patterns in snow accumulation, western Dronning Maud Land, Antarctica. J. Glaciol. 40, 399–409. doi:10.3189/s0022143000007486
Johnsen, S. J., Clausen, H. B., Cuffey, K. M., Hoffmann, G., Schwander, J., and Creyts, T. (2000). “Diffusion of stable isotopes in polar firn and ice : The isotope effect in firn diffusion,” in Physics of ice core records (Sapporo: Hokkaido University Press).
Johnsen, S. J. (1977). “Stable isotope homogenization of polar firn and ice,” in International symposium on isotopes and impurities in snow and ice (Grenoble: IAHS-AISH), 210–2019.
Jouzel, J., and Masson-Delmotte, V. (2010). Paleoclimates: what do we learn from deep ice cores? WIREs Clim. Change 1, 654–669. doi:10.1002/wcc.72
Jouzel, J., Merlivat, L., and Lorius, C. (1982). Deuterium excess in an East Antarctic ice core suggests higher relative humidity at the oceanic surface during the last glacial maximum. Nature 299, 688–691. doi:10.1038/299688a0
Küttel, M., Steig, E. J., Ding, Q., Monaghan, A. J., and Battisti, D. S. (2012). Seasonal climate information preserved in west antarctic ice core water isotopes: relationships to temperature, large-scale circulation, and sea ice. Clim. Dyn. 39, 1841–1857. doi:10.1007/s00382-012-1460-7
Laepple, T., Münch, T., Casado, M., Hoerhold, M., Landais, A., and Kipfstuhl, S. (2018). On the similarity and apparent cycles of isotopic variations in East Antarctic snow pits. Cryosphere 12, 169–187. doi:10.5194/tc-12-169-2018
Ma, T., Li, L., Shi, G., and Li, Y. (2020). Acquisition of post-depositional effects on stable isotopes (δ18O and δD) of snow and firn at dome A, East Antarctica. Water 12, 1707. doi:10.3390/w12061707
Mahalinganathan, K., Thamban, M., Laluraj, C. M., and Redkar, B. L. (2012). Relation between surface topography and sea-salt snow chemistry from Princess Elizabeth Land, East Antarctica. Cryosphere 6, 505–515. doi:10.5194/tc-6-505-2012
Mahalinganathan, K., and Thamban, M. (2016). Potential genesis and implications of calcium nitrate in Antarctic snow. Cryosphere 10, 825–836. doi:10.5194/tc-10-825-2016
Masson-Delmotte, V., Delmotte, M., Morgan, V. I., Etheridge, D. M., Ommen, T. D. V., Tartarin, S., et al. (2003). Recent southern Indian ocean climate variability inferred from a law dome ice core: new insights for the interpretation of coastal antarctic isotopic records. Clim. Dyn. 21, 153–166. doi:10.1007/s00382-003-0321-9
Masson-Delmotte, V., Hou, S., Ekaykin, A., Jouzel, J., Aristarain, A., Bernardo, R. T., et al. (2008). A review of antarctic surface snow isotopic composition: Observations, atmospheric circulation, and isotopic modeling. J. Clim. 21, 3359–3387. doi:10.1175/2007jcli2139.1
Melvold, K., Hagen, J. O., Pinglot, J. F., and Gunuestrup, N. (1998). Large spatial variation in accumulation rate in Jutulstraumen ice stream, Dronning Maud Land, Antarctica. Ann. Glaciol. 27, 231–238. doi:10.3189/1998aog27-1-231-238
Münch, T., Kipfstuhl, S., Freitag, J., Meyer, H., and Laepple, T. (2016). Regional climate signal vs. local noise: a two-dimensional view of water isotopes in antarctic firn at kohnen station, dronning Maud Land. Clim. Past. 12, 1565–1581. doi:10.5194/cp-12-1565-2016
Münch, T., and Laepple, T. (2018). What climate signal is contained in decadal- to centennial-scale isotope variations from Antarctic ice cores? Clim. Past. 14, 2053–2070. doi:10.5194/cp-14-2053-2018
Naik, S. S., Thamban, M., Laluraj, C. M., Redkar, B. L., and Chaturvedi, A. (2010). A century of climate variability in central dronning Maud Land, East Antarctica, and its relation to southern annular mode and el niño-southern oscillation. J. Geophys. Res. 115, D16102. doi:10.1029/2009jd013268
Petit, J. R., Jouzel, J., Pourchet, M., and Merlivat, L. (1982). A detailed study of snow accumulation and stable isotope content in Dome C (Antarctica). J. Geophys. Res. 87, 4301–4308. doi:10.1029/jc087ic06p04301
Rahaman, W., Chatterjee, S., Ejaz, T., and Thamban, M. (2019). Increased influence of ENSO on antarctic temperature since the industrial era. Sci. Rep. 9, 6006. doi:10.1038/s41598-019-42499-x
Schlosser, E., and Oerter, H. (2002). Seasonal variations of accumulation and the isotope record in ice cores: a study with surface snow samples and firn cores from neumayer station, Antarctica. Ann. Glaciol. 35, 97–101. doi:10.3189/172756402781817374
Simmonds, I., Keay, K., and Lim, E.-P. (2003). Synoptic activity in the seas around Antarctica. Mon. Weather Rev. 131, 272–288. doi:10.1175/1520-0493(2003)131<0272:saitsa>2.0.co;2
Stenberg, M., Isaksson, E., Hansson, M., Karlen, W., Mayewski, P. A., Twickler, M. S., et al. (1998). Spatial variability of snow chemistry in western Dronning Maud Land, Antarctica. Ann. Glaciol. 27, 378–984.
Stenni, B., Curran, M. a. J., Abram, N. J., Orsi, A., Goursaud, S., Masson-Delmotte, V., et al. (2017). Antarctic climate variability on regional and continental scales over the last 2000 years. Clim. Past. 13, 1609–1634. doi:10.5194/cp-13-1609-2017
Thomas, E. R., Bracegirdle, T. J., Turner, J., and Wolff, E. W. (2013). A 308 year record of climate variability in West Antarctica. Geophys. Res. Lett. 40, 5492–5496. doi:10.1002/2013gl057782
Vaughan, D. G., Bamber, J. L., Giovinetto, M., Russell, J., and Cooper, A. P. R. (1999). Reassessment of net surface Mass balance in Antarctica. J. Clim. 12, 933–946. doi:10.1175/1520-0442(1999)012<0933:ronsmb>2.0.co;2
Keywords: stable water isotopes, spatial variability, isotope signal diffusion, snow cores, Antarctica
Citation: Mahalinganathan K, Thamban M, Ejaz T, Srivastava R, Redkar BL and Laluraj CM (2022) Spatial variability and post-depositional diffusion of stable isotopes in high accumulation regions of East Antarctica. Front. Earth Sci. 10:925447. doi: 10.3389/feart.2022.925447
Received: 21 April 2022; Accepted: 21 July 2022;
Published: 30 August 2022.
Edited by:
Daniel Nývlt, Masaryk University, CzechiaReviewed by:
Amzad Hussain Laskar, Physical Research Laboratory, IndiaKanon Kino, The University of Tokyo, Japan
Copyright © 2022 Mahalinganathan, Thamban, Ejaz, Srivastava, Redkar and Laluraj. This is an open-access article distributed under the terms of the Creative Commons Attribution License (CC BY). The use, distribution or reproduction in other forums is permitted, provided the original author(s) and the copyright owner(s) are credited and that the original publication in this journal is cited, in accordance with accepted academic practice. No use, distribution or reproduction is permitted which does not comply with these terms.
*Correspondence: Meloth Thamban, bWVsb3RoQG5jcG9yLnJlcy5pbg==