 Bin Yang
 Liqiang Zhang
 Zhifeng Sun
 Yiming Yan
- 1School of Earth Science and Technology, China University of Petroleum (East China), Qingdao, China
- 2Key Laboratory of Deep Oil and Gas, China University of Petroleum, Qingdao, China
- 3Marine Oil Production Company, Shengli Oilfield Co. Ltd., Sinopec, Dongying, China
- 4Shandong Institute of Petroleum and Chemical Technology, Dongying, China
Reservoir architecture is an important basis for studying the sedimentary evolution of underground reservoirs and the distribution of remaining oil. Taking meander-river reservoir of Guantao Formation in Chengdao Oilfield as an example, characteristics of the evolution of subsurface meander-belt deposits were studied by seismic sedimentology. Seismic lithology is performed using -90° phase wavelet and frequency fusions; seismic geomorphology is conducted on seismic stratal slices. Six meandering belts were defined in the target layer, and the sediment at the bottom is characterized by the transformation from “braided” river to “meandering” river. The width of meander-river belt has no correlation with the maximum thickness of meander-river belt. But it has obvious negative correlation differences in the minimum thickness of meander–river belt. With the increase of width of the meander-river belt, the minimum thickness of the drilled meander-river belt decreases as a whole. The forward model based on the shape of point bar reveals the seismic architecture characteristics formed by the superposition of sand bodies at different positions of point bars. According to these characteristics, the point bars in the meandering zone can be explained. In the Ng33, Ng42, and Ng45 sub-layers of the study area, the corresponding meander-belt widths where the point bar (or point bar connecting body) cannot be effectively identified by well logging and seismic data, are, respectively, 800, 800, and 500 m. At the same time, when the width of the meander belt is greater than 1000 m, three or more than three point bars (or point bar connecting body) can be basically identified in the meander belt. The width of the point bar segments in the meander belt of the three main sub-layers is mostly 300–400 m, and the maximum width of the point bar segments is about 550 m, while the scale of point bars in Ng45 sub-layer meander belt is relatively small. The quantitative characteristics of point bar debris and the determined location of SBM and SIA sand bodies provide limited and valuable data support for the formation and simulation of underground meandering rivers, which are also useful for the model of the target reservoir.
Introduction
The subsurface deposits of meandering rivers provide important reservoir space for hydrocarbons, which has always been the focus of scholars’ research (Ghinassi, 2011; Colombera et al., 2017; Sun et al., 2018). The study of the architecture of meandering river began with the sedimentary outcrop and systematically studied its internal hierarchical architecture, lithology, geometric characteristics, and connectivity (Blacknell, 1982; Miall, 1988; Bridge, 2003; Willis, 2006; Donselaar and Overeem, 2008; Willis and Tang, 2010; Ghinassi et al., 2014; Colombera et al., 2017; Sun et al., 2018). These research results revealed the complex architectural characteristics of the reservoir, provided good conceptual model guidance for the interpretation of subsurface meandering river reservoirs, and pointed out the geological factors of the complex occurrence state of the remaining oil (Sun et al., 2020a).
On the other hand, the migration and deposition processes of meandering rivers are simulated by studying modern sedimentary processes (Stølum and Friend, 1997; Meakin et al., 1996; Ghinassi et al., 2021). For the subsurface meandering-river reservoir, it is difficult to conduct numerical simulations of ancient cases and to develop realistic models due to the restricted research means and the arrangements and proportions which are at the best and only poorly constrained by sparse wells that provide wireline or core data (Miall, 1996; Kostic and Aigner, 2007; Musial et al., 2012). In subsurface successions, seismic and well-logging data are a primary tool used to document the architecture of meander-river reservoirs (Maynard and Murray, 2003; Reijenstein et al., 2011). The distribution and evolution of meander belts in vertical sequence are widely studied by three-dimensional seismic data (David, 1992; Zeng et al., 2001).
With the application and development of seismic frequency, the boundaries and thicknesses of meander-river reservoirs were well detected in many cases (Bitrus et al., 2016; McArdle et al., 2014; Wang et al., 2017; Zeng, 2017; Xu et al., 2019; Li et al., 2019). Sun et al. (2020b) dissected the internal unites of subsurface meander-river reservoirs through the corresponding relationship between the geometric characteristics of sand bodies in the superposition zone of point bars and seismic architecture. The research focuses on the interpretation of the architectural units of the meander belt by using the transverse information of frequency division seismic data. Although the explained architectural units may be the remnant point bar fragments or the combined connection unit of point bars, it is important to understand the evolutionary history of meander belt. The current research on subsurface meander belts has mainly focused on the geometry and distribution of subsurface meander-belt deposits in the plain. Nevertheless, there still remains a lack of understanding about the inner architectural units of subsurface meander-belt deposits.
Herein, taking the typical meander-river deposits in the Upper Guantao Formation of Chengdao Oilfield as an example, this article discusses the method of studying the inner architectural units of the meandering river by using the morphological characteristics of point bar sand body and its corresponding seismic architectural characteristics. This study is of great significance to the prediction of the remaining oil in the reservoir and the numerical simulation of meandering rivers.
Data and Methods
A total of 565 wells and a 3D seismic volume were used to test the proposed method. Most of the wells have spontaneous potential (SP), gamma rays (GR), sonic (DT), density (DEN), deep laterolog (LLD), and shallow laterolog (LLS). At the same time, there are seven horizontal wells in the study area, three of which are in the target layer. These horizontal wells adopt Schlumberger steering drilling technology (LWD). LWD instrument is used to measure natural gamma and resistivity curves while drilling, adjust borehole trajectory, and track the oil layer before the inclined depth of 300 m from the target layer. Relevant technologies of Schlumberger company can image and display the lithologic characteristics of 2–4 m up and down the horizontal well section while drilling. This can facilitate the study of the internal structural characteristics of a meandering river reservoir. The utilized seismic volume is poststack seismic data with a 2 ms vertical sample interval. The phase of seismic data was approximately 0, the dominant frequency of seismic data was 38 Hz, and the effective bandwidth was approximately 18–60 Hz. The spacings of the inline are 25 m. Seismic data have a lower vertical resolution compared with that of well logs, and they have a relatively higher lateral resolution than that of the spatial interpolation with 1D well data.
The corresponding values of the acoustic time difference of sandstone and mudstone were 371 μs/m −380 μs/m and 450–470 μs/m, respectively. The acoustic velocity of sandstone and mudstone was assigned 2650 m/s and 2160 m/s. −90° Rayleigh wavelet was used for forward modeling to discuss the architectural characteristics in the reservoir through the change information of the in-phase axis corresponding to the sand body. The seismic data were converted to −90 phase (Zeng and Backus, 2005) to make the negative in-phase axis corresponding to the point bar sand body before interpretation. The frequency-decomposed seismic data were used to describe the distribution and architectural elements of meander belts. The frequency-decomposed seismic data were produced by the wavelet-decomposition method. Stratal slices are used to describe the distribution of meander-belt sandstones. A series of stratal slices with the interval of 1 ms was generated from the base to the top of the Upper Guantao Formation.
Geological and Stratigraphic Setting
The Bohai Bay Basin covers an area of approximately 18*104 km2 (Figure 1A) in eastern China. It consists of seven sub-basins formed during the Cenozoic (Dong et al., 2014; Zhu et al., 2014), which are, respectively, the Bozhong, Jizhong, Linqing, Jiyang, Liaohe, Liaodong Bay, and Huanghua sub-basins (Zhu et al., 2014; Liu et al., 2016) (Figure 1B). The Bozhong sub-basin is located in the east of the Bohai Bay Basin. Chengning Uplift is located in the south of the Bozhong sub-basin, which separates the Bozhong sub-basin and the Jiyang sub-basin. The Chengbei Sag is located on the northeastern edge of the Chengning Uplift (Figure 1A), and the Chengdao Oilfield lies in the southeastern Chengbei Sag. Chengdao Oilfield is surrounded by the oil-rich Chengbei Depression, Shanan Depression, and Bozhong Depression (Figure 1B).
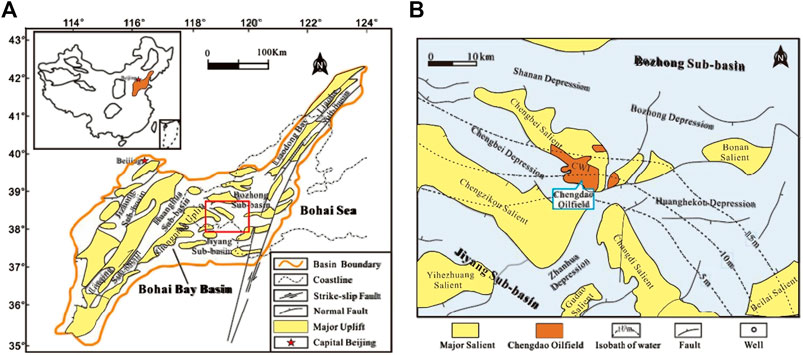
FIGURE 1. Location of the study area. (A) Location and tectonic divisions of the Bohai Bay Basin. The red box highlights the location of our study area. (B) Structural features of the central Bohai Bay Basin and the location of the Chengdao Oilfield (modified from Li et al., 2019).
The study area is the major production area with an area of approximately 100 km2. The main production layer in the study area is the Guantao Formation of Neogene strata. The lower part of the Guantao Formation mainly contains braided river deposits (Gao et al., 1997). The depositional environment gradually transitioned from braided river to meandering river during the deposition of the upper part of the Guantao Formation (abbreviated as the Upper Guantao Formation) due to the reduced elevation of the terrain (Shuai and Wang, 1993). The studied layer is the Upper Guantao Formations (Zhu et al., 2014), which is buried 1100 m–1600 m underground. The Upper Guantao Formation of Chengbei Sag is a fluvial system (Dong et al., 2014; Liu et al., 2016), and it is mainly meander-river deposits in the study area (Li et al., 2019) (Figure 2A). The sediments in the Upper Guantao Formation are mainly mudstone, siltstone, and fine-grained sandstone, and the proportion of mudstone in the formation increases gradually to the upper part (Li et al., 2019). The Upper Guantao Formation is composed of five sand groups with an average thickness of 250 m. It can be divided into three mid-term cycles and 12 short-term cycles (SSC) (Li et al., 2019). The seismic profile that was converted by −90° phase shows that the sandstones of Ng33, Ng42, and Ng55 sub-layers are located in the wave trough, and the sand body is stable over a small range (Figure 2B).
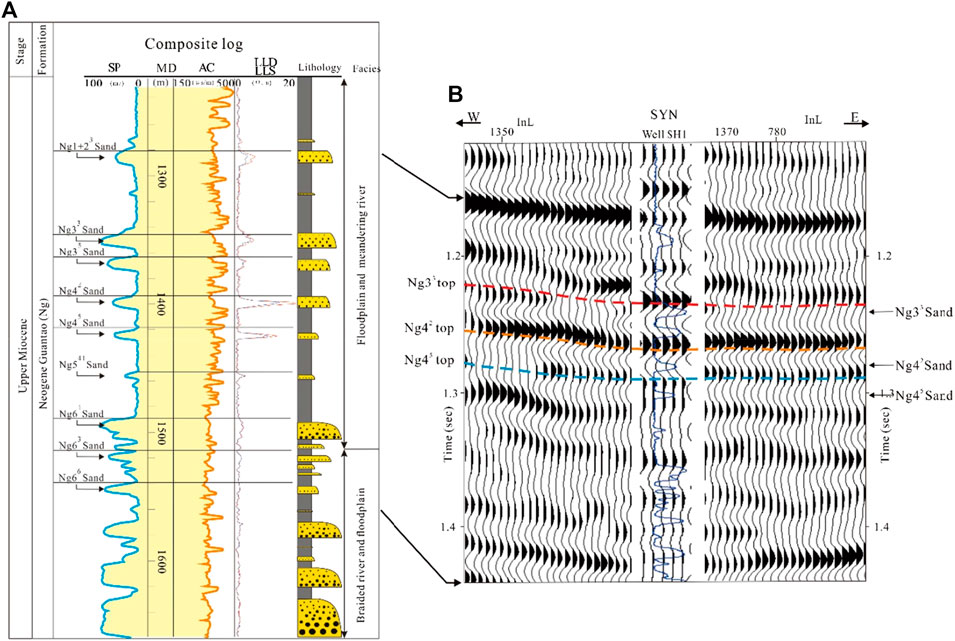
FIGURE 2. Wireline-log and seismic characteristics of the target layer of the Upper Guantao Formation. (A) Wireline-log shows that the sand content of the lower Guantao Formation is high and dominated by braided facies (Gao et al., 1997), while the sand content of the upper Guantao Formation is low. (B) Seismic profile that was converted by the −90° phase shows that the sandstones of Ng33, Ng42, and Ng55 sub-layers are located in the wave trough, and that the sand body is stable over a small range.
In January 2021, the average water cut in the study area was more than 82%. Because the study area is located at sea, it was impossible to establish a production well pattern as dense as that of onshore oil fields. The Chengdao oilfield is facing great pressure of stable production. Potential blocks between oil and water wells are particularly important for later well-pattern adjustment and improving residual oil recovery. The inner architectural characteristics of the reservoir remained poorly understood. Therefore, predicting the architectural characteristics and the distribution of potential blocks of the reservoir is critical to successfully enhancing oil recovery.
Quantitative Evaluation of Meander-Belt Architectural Units
Hierarchical schemes of the meandering river established by Miall (1996) and Payenberg et al. (2011) are used in this article. In the study area, the vertical superposition of meandering river sand bodies is less (Figure 2). Therefore, the sand bodies deposited in the same or similar period can be regarded as a component of the fifth-order (meander belt) architectural units. The meander belt (fifth-order unit) and point bar (fourth-order unit) are mainly discussed in this article.
Distribution of Meander-Belt
The paleocurrent direction of the Upper Guantao Formation in the study area is roughly from south to north (Shuai and Wang, 1993). In the near East–West dense well pattern profile, the fluvial facies sand bodies of sub-layers Ng33, Ng 42, and Ng 45 of the Upper Guantao formation are highly developed (Figure 3) and have good connectivity. Sand bodies of other sub-layers are sporadically developed (Figure 3). Combined with the regional sedimentary characteristics (Li et al., 2019), the three main layers are typical meandering belt deposits.
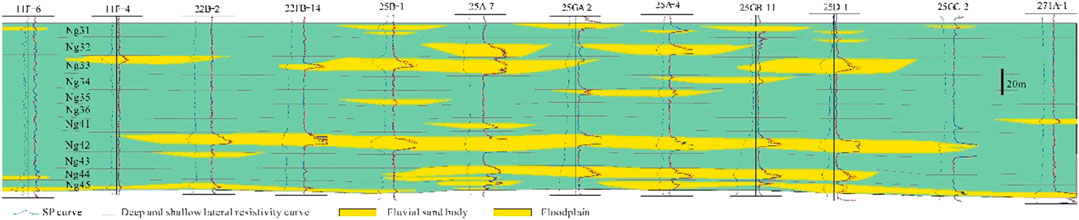
FIGURE 3. Drilling–well logging profiles vertical the source direction of channel in the anatomical area.
During the deposition time of Ng33, two meandering belts were developed on the east and west sides of the study area, both of which were near NW-SE trending (Figure 4). The curvature of the west meander belt is high, and the change in the width of the meander belt is relatively small. The curvature of the eastern meander belt is relatively small, and the meander-river has obvious migration and diversion characteristics. There are many small-scale flood channels around. Most of them are small-scale channel deposits formed by floods, which mostly originate from places with large curvatures of the meandering belt.
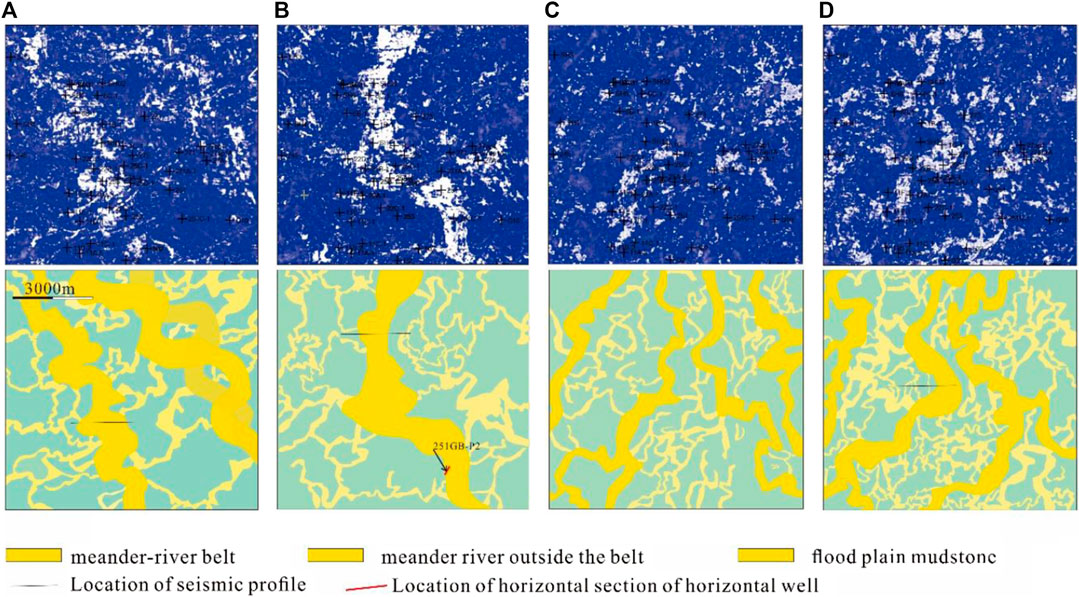
FIGURE 4. Plane distribution characteristics of fluvial facies deposits in the main layer of the study area. (A) Plane distribution characteristics of meander-river belt and secondary channel in Ng33 sub-layer. (B) Plane distribution characteristics of meander-river belt and secondary channel in Ng42 sub-layer. (C) Plane distribution characteristics of meander-river belt and secondary channel in the early stage of Ng45 sub-layer. (D) Plane distribution characteristics of meander-river belt and secondary channel in the main stage of Ng45 sub-layer.
During the sedimentary period of Ng42, the scale of the meander belt in the study area was large. The meander-river belt entered the main area of Chengdao from the southwest and then extended in a nearly north–south direction (Figure 4). The curvature of the meander belt is relatively small, and the width is relatively large.
During the sedimentary period of Ng45, fluvial sand bodies were widely distributed. The bifurcation and convergence of channel sand bodies are obvious, and it is similar to the characteristics of “braided stream” in the plane (Figure 4). In this sedimentary period, three main meander–river belts can be roughly identified. Among them, the west meander-river is roughly in the direction of Southwest northeast, and the east meander-river is in the direction of nearly north-south. Narrow and thin channel deposits are developed between the deposits of the main meander-river, mostly forming in the flood period. During this period, there are many accumulated sedimentary sand bodies in the secondary channel, forming characteristics similar to “braided stream” on the plane (Figure 4). The “braided stream” formed by the secondary channel has a small thickness and poor lateral connectivity. In the three main meandering river belts, the sand body thickness is large, and the connectivity is good.
Based on the description of the meander-river belts, their width and thickness are counted at the position of each typical section line (with a dense well pattern) (Table 1). The relationship between the width and the maximum thickness of the meander–river belt is not obvious (Figure 5). There is no significant change in the maximum thickness at different locations of the meander-river belt (Figure 5). However, there are obvious differences in the minimum thickness in different positions of the meander-river belt. With the increase of the width meander-river belt, the minimum thickness drilled by the well in the meander-river belt decreases as a whole (Figure 5). At the same time, the frequency of data close to the minimum thickness also increases. This phenomenon may indicate that with the increase of the width of meander-river belt, the limiting effect of the valley on the migration and swing of the rivers is weakened. So, the weak superposition phenomenon between point bar sand bodies appears more frequently. This weak superposition zone between point bars is of great significance to the formation of residual oil in the later stage of development.
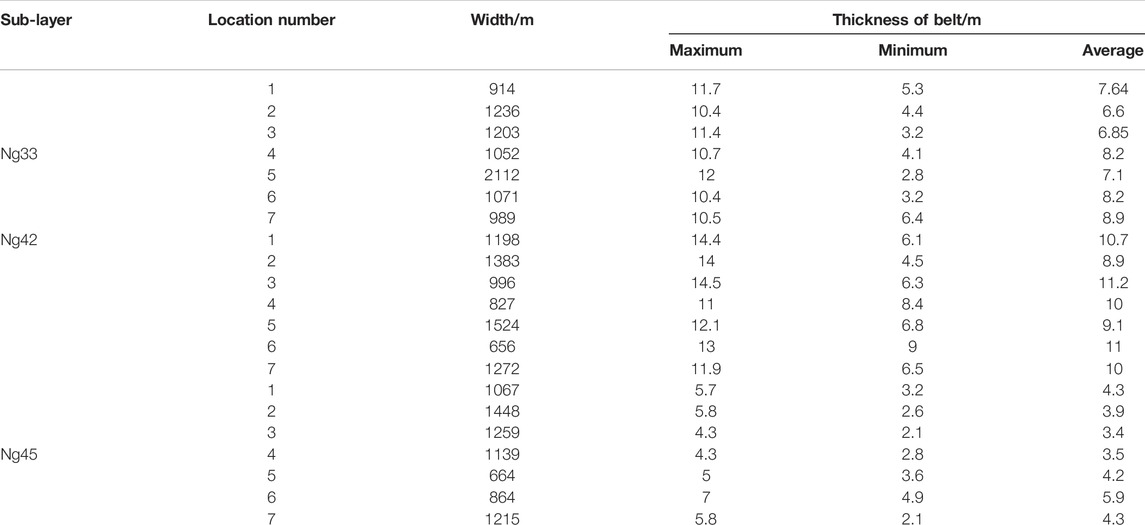
TABLE 1. Statistical table of width and thickness parameters of meander-river belt in different sub-layers.
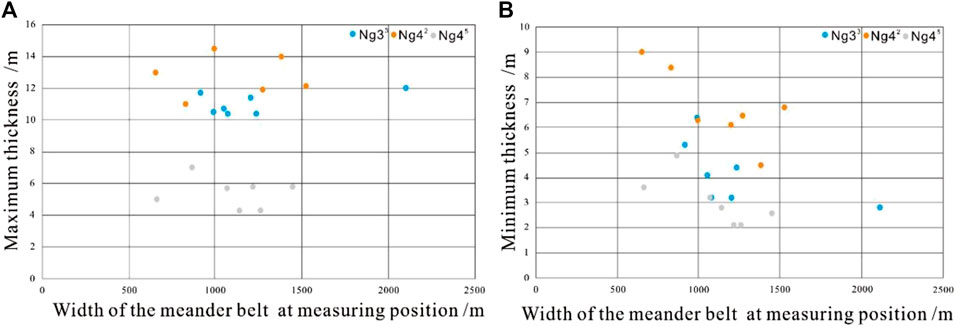
FIGURE 5. Width and thickness parameters of meander-river belt in different sub-layers. (A) Scatter plot shows that there is no correlation between the maximum thickness and width of the meander belt, and the maximum thickness of the meander zone is relatively stable. (B) Scatter plot shows that the minimum thickness of the meander belt decreases as the width of the meander belt increases.
Characteristic of Point Bar in Meander-River Belt
The key to the identification of point bars in the meander-river belt is to establish an identifiable point bar architectural model with obvious characteristics. Through the LWD presentation technology of Schlumberger company, it is found that the sand body at the boundary of layer 42 meander-river belt in the Upper Guantao Formation presents a wedge shape with a flat top and upturned bottom (Figure 6). There are obvious differences in sand body thickness and shape between this location and the main body of the point bar. This obvious difference is helpful to produce recognizable corresponding features in the seismic data, which is convenient to distinguish the point bar sand bodies. This feature is consistent with the outcrop feature of point bar sand bodies in meandering rivers (Donselaar and Overeem, 2008; Hartley et al., 2015). According to the morphological difference and recognizable characteristics of a point bar, Sun et al. (2020a) divided a single point bar sand body into three parts: base-of-channel sandstone that infills abandonments (SIA), the earliest sandstone at the beginning of the migration of the point bars (SBM), and the main part of point bar sandstone. This article uses its division scheme (Sun et al., 2020b) of point bars to establish the forward model of weak superposition between point bars consistent with the actual geological conditions and then discusses the identifiability of point bars in the meander-river belt.
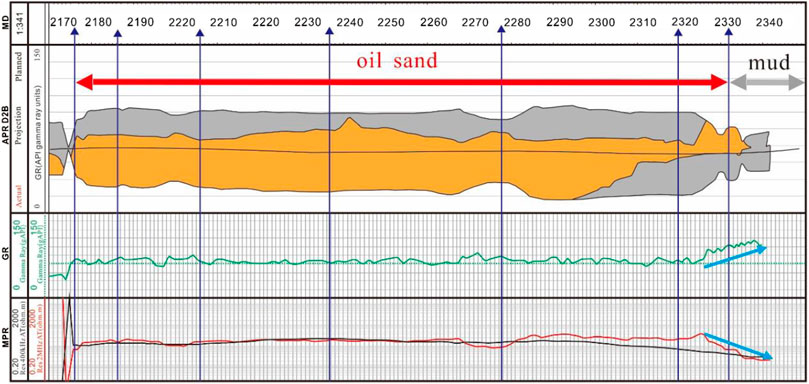
FIGURE 6. LWD presentation of well 251 GB-P2 (Schlumberger company) shows that the sand body at the boundary of layer 42 meander-river belt in the Upper Guantao Formation presents a wedge shape with a flat top and upturned bottom.
The buried depth of the target layer in the study area is 1250–1450 m. Through the statistics of the acoustic time difference of pure mudstone in the target layer of the study area, it is found that the acoustic velocity corresponding to 1250 m is 2160 m/s, and with the increase of depth, the variation gradient of acoustic velocity is about 0.3(m/s)/m. The average acoustic time difference of sandstones in Ng33, Ng42, and Ng45 layers is, respectively, 371 μs/m, 376 μs/m, and 380 μs/m, the average velocity of sandstone is designed to be 2650 m/s. The thickness of the main body of the point bar of the first layer, the second layer, and the third layer is designed to be 14, 12, and 7 m, respectively. The forward simulation results are shown in Figure 7. For a single-layer of sand body, the thickness of sand body has little effect on the seismic characteristics at the superposition zone between point bars. When the stacking thickness of SBM sand bodies between two bars reaches 1/3 of the maximum main thickness, it is impossible to distinguish two bars by seismic waveform and amplitude. When the stacking thickness is less than 1/3 of the maximum thickness, the amplitude energy at the stacking zone decreases and the wavelength decreases. At this time, sand bodies of two bars can be distinguished. When the SBM sand body is superimposed on the SIA sand body, if the abandoned channel mudstone is not completely eroded and the two point bar sand bodies are not connected, the amplitude energy at the superimposed zone is low, and the wavelength is short, and its characteristics are similar to those described by Sun et al. (2020a). If the abandoned channel mudstone is eroded, resulting in the connection of two point bar sand bodies, the seismic amplitude and waveform change at the superposition zone are not obvious, and the boundary of different point bar sand bodies cannot be effectively distinguished. When the SIA sand body is superimposed on the SIA or SBM sand body, even if the two point bar sand bodies are connected, the point bar boundary can be distinguished under the influence of the obvious reflection characteristics of the abandoned river mudstone on the upper part of the SIA sand body. At this time, it is difficult to distinguish whether the SIA sand body is superimposed on SIA or SBM sand body.
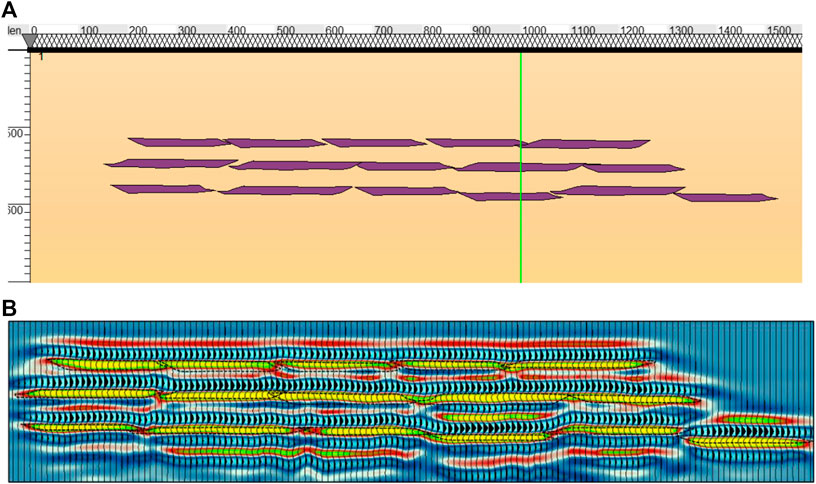
FIGURE 7. Forward modeling of superposition architecture between point bars in the meander belt. (A) Prototype model of superposition architecture between point bars in the meander belt. (B) Result of forward modeling of superposition architecture between point bars in the meander belt.
Interpretation of Point Bars in Meander-River Belt of Ng33 Sub-Layer
The upper and lower parts of the three main meandering belts in the study area basically develop relatively stable mudstone with a thickness of more than 15 m. Therefore, the information on the seismic event axis of the target layer can basically reflect the information about the architecture of the meander-river belt. The frequency division seismic data after the 90° phase transition can not only give geological significance to the seismic event axis but also be used to identify and characterize the architectural characteristics of point bar superposition zone.
In the seismic section after −90° phase transformation, only the boundary of the meander-river belt can be roughly identified (Figure 8). The response to the internal architectural characteristics of the meander belt is not obvious.
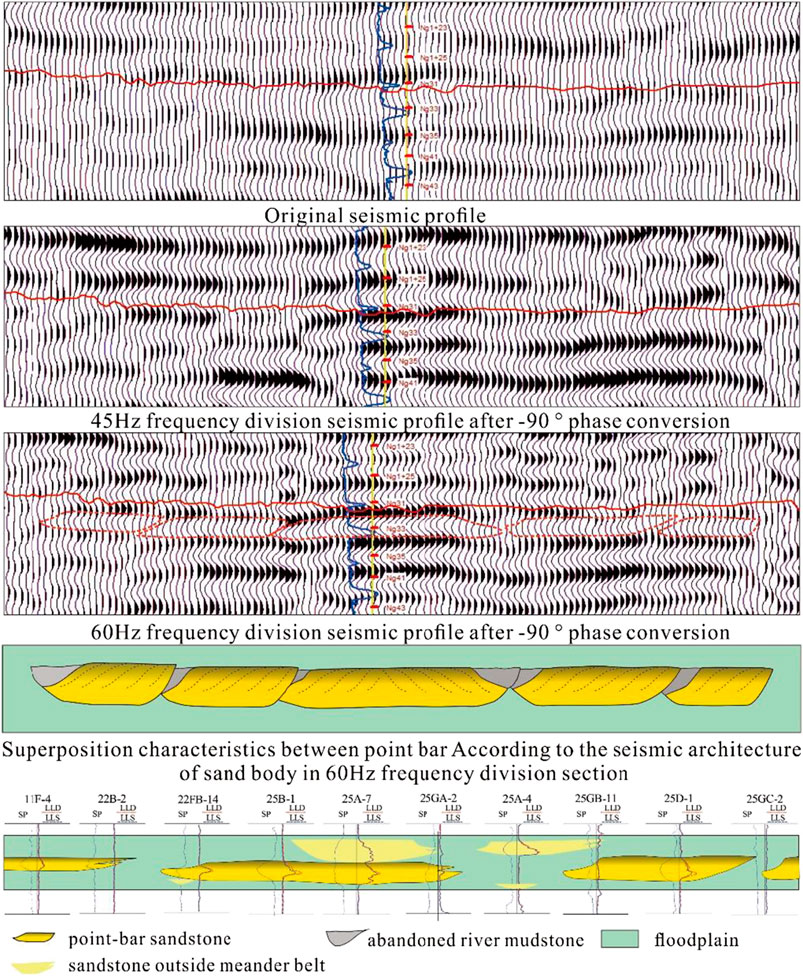
FIGURE 8. Architectural characteristics of typical point bar in Ng33 sub-layer, seismic and logging interpretation profile, and results. Interpretation of point bars in meander-river belt of Ng42 sub-layer.
On the 45 Hz frequency division seismic profile after −90° phase conversion, the boundary between the point bar where well 25B-1 is located and the point bar on the left can be clearly identified (Figure 8). At the superposition zone, the left point bar presents the morphological characteristics of the SBM sand body, and the right point bar presents the morphological characteristics of the SIA sand body. Also, these point bars present the characteristics of weak connection or disconnection. On the 60 Hz frequency division seismic profile after −90° phase conversion, the point bar where well 22B-1 is located and the point bar on the right show obvious disconnected characteristics: the in-phase axis has obvious characteristics of the composite wave at the stacking position, and the wavelength is reduced to zero (Figure 8). At the superposition position of the two point bar sand bodies, the top of the left sand body presents the characteristics of obviously concave with the characteristics of the SIA sand body, while the right point bar presents the characteristics of the SBM sand body. On the 45 Hz frequency division seismic profile after −90° phase conversion, the point bar where well 25B-1 is located is disconnected from the left point bar. On the 60 Hz frequency division seismic profile after −90° phase conversion, the point bar where well 25B-1 is located is disconnected or weakly connected with the left point bar. On the whole, the connection between the point bar well 25B-1 located and the left point bar is very poor (Figure 8).
The logging profile shows that Ng33 sub-layers of well 25A-4 do not develop sand bodies, which is consistent with the disconnection between two point bar sand bodies near the well explained by seismic architecture. The logging profile shows that the sand body at well 22FB-14 is located at the edge of the point bar, and its position is lower, showing the morphological characteristics of the SIA sand body, which is consistent with the interpretation results of seismic architecture. At the same time, the sand body encountered at well 22B-2 is thin, and on the logging profile, the sand body at well 22B-2 is located at the upper part of the point bar sand body, showing the morphological characteristics of the SBM sand body. Finally, the shape and architectural characteristics of the point bars can be explained in the section of the flow direction of the near vertical meander belt, and the tendency of the lateral accumulation layer inside the point bar can be inferred (Figure 8).
Interpretation of Point Bars in Meander-River Belt of Ng42 Sub-Layer
On the 60 Hz frequency division seismic profile after −90 ° phase conversion, the boundary of the meander belt can be identified. The point bar where well 6C-1 is located can be clearly identified from the point bar on the left. The boundaries on both sides of the meander belt show the morphological characteristics of the SBM sand body (Figure 9). The logging profile shows that the sand body of well 6FA-8 in this sub-layer is located at the top of point bar sand body, with typical morphological characteristics of the SBM sand body (Figure 9). At the superposition position, the left point bar presents the morphological characteristics of the SBM sand body, and the right point bar presents the morphological characteristics of the SIA sand body. The two point bar presents the characteristics of disconnection, whose features are the same as that at position in Figure 4. The point bar where well 6FA-11 is located and the point bar where well 6C-2 is located on the right show obvious disconnection characteristics: the in-phase axis has obvious wavelength reduction and polarity reversal at the superposition position. At the superposition position, the bottom of the two point bar sand bodies presents the characteristics of obviously upturned, showing the characteristics of the SBM sand body. Based on the seismic architectural analysis, the shape and distribution of point bars in this section can be determined, and the lateral accumulation tendency can be predicted (Figure 9).
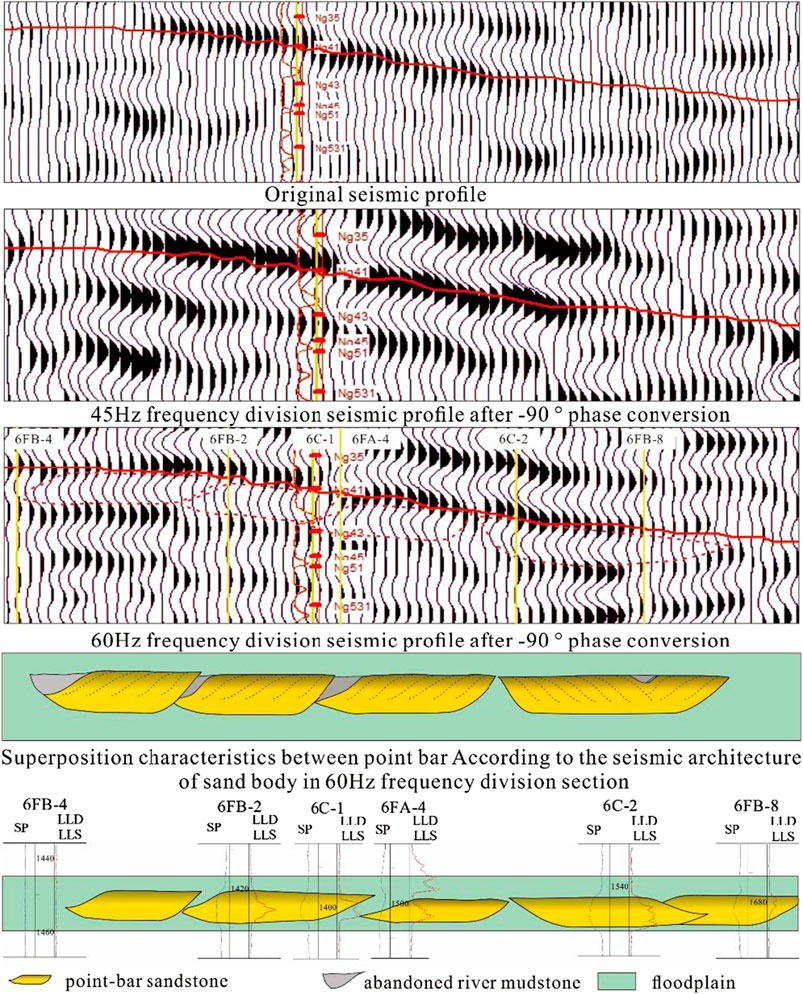
FIGURE 9. Architectural characteristics of typical point bar in Ng42 sub-layer, seismic and logging interpretation profile, and results. Interpretation of point bars in meander-river belt of Ng45 sub-layer.
Interpretation of Point Bars in Meander-River Belt of Ng45 Sub-Layer
In Ng45 sub-layer, the original seismic data can only roughly identify the boundary of the main meander-river belt (taking the west meander-river belt as an example) but less reflect the boundary of small rivers and the superposition architecture between them (Figure 10). The 45 Hz frequency division seismic data after −90° phase conversion has shown the architectural characteristics of the meander-river belt, but the architectural characteristics of the superimposed zone between point bars are not clearly reflected, and the information response to the boundary of a small river and superimposed structure is still not obvious. The 60 Hz frequency division seismic data after −90° phase conversion can better reflect the architectural characteristics of the main meander belt. As shown in Figure 10, ① and ② sandstones are located in the main meander-river belt. The bottom seismic wave at the superposition zone between sand bodies forms an upward convex feature. And the abandoned river mudstone of point bar ② is superimposed on the sand body of point bar ①. It is speculated that it is the superposition of SIA sand bodies and SBM sand bodies with connection or weak connection between sand bodies. At the same time, the left side of the sand body ② has the characteristics of the SBM sand body. Sand bodies from ③ to ⑨ are small channel deposits outside the main body of the meander–river belt. There is an obvious disconnection between ③ sand body and the meander–river belt. In addition, ③ ④ ⑤ sand bodies are discontinuous with each other. The seismic waveform at the superposition zone between ⑤ and ⑥ sand bodies is close to zero and has a weak dislocation, and its characteristics are similar to the weak connection or disconnection characteristics in the forward model (Figure 7B). The seismic waveform at the superposition zone between ⑤ and ⑥ sand bodies is close to zero and has a weak dislocation, and its characteristics are similar to the weak connection or disconnection characteristics. The SBM sand body of point bar ⑨ superposes on the SIA sand body of point bar ⑧. The seismic amplitude at the superposition zone between ⑥ and ⑦ sand bodies is strong, and the wavelength is long. It is speculated that the two sand bodies are connected with each other. From the logging profile, well 1A-6 encountered ⑦ sand body at the superposition zone between ⑥ and ⑦ sand bodies, which showed that ⑦ sand body was almost pinched out at the well location, and ⑥ sand body was not found at the same time. It is speculated that ⑥ and ⑦ sand bodies are not connected laterally. It is noted that the sand body where well 1C-1 is located has good connectivity and a long extension distance. It is speculated that it is a superimposed connecting body formed by different point bars. The seismic architecture of ④ to ⑧ sand bodies shows that most of them have the morphology of SBM and SIA at both ends of the sand body. Therefore, it is judged that these secondary channel sand bodies are formed by small meandering rivers.
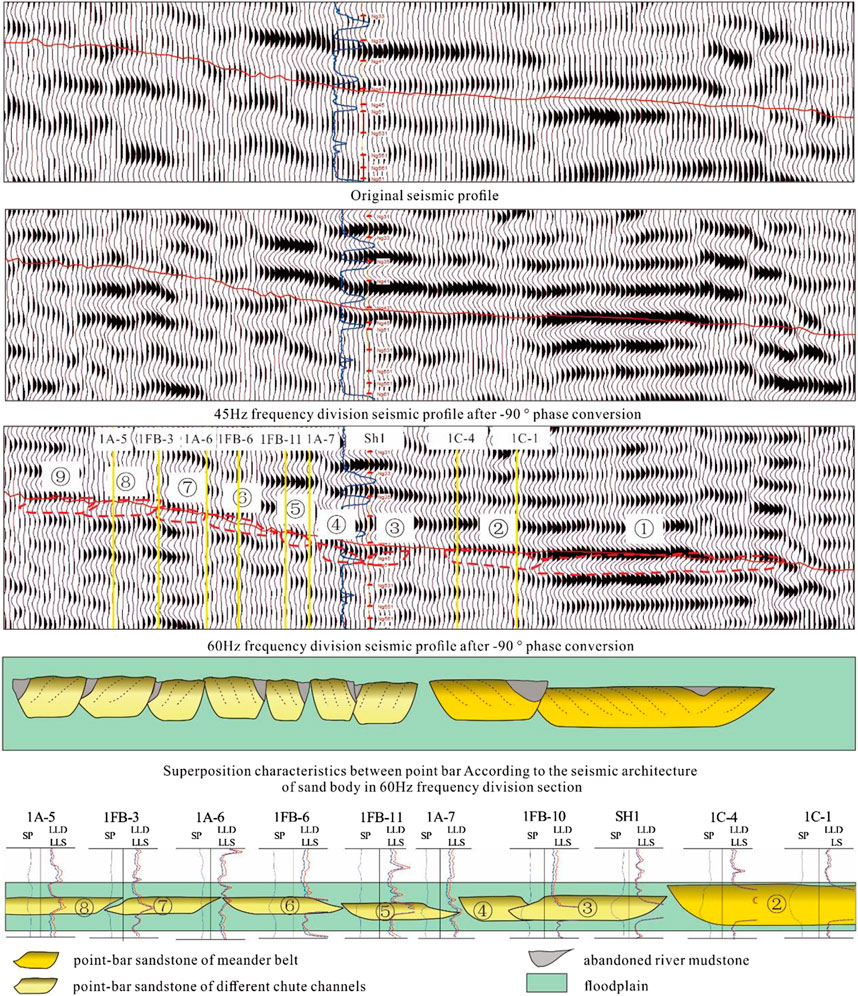
FIGURE 10. Architectural characteristics of typical point bar in Ng45 sub-layer, seismic and logging interpretation profile, and results.
Quantitative Evaluation of Point Bars
The rivers in the meandering belt move and swing continuously, forming many point bars cut and superimposed with each other. Through the analysis of seismic architecture, the point bars in the meander-river belt can be identified. Through the aforementioned research work, a large number of residual point bars are identified on the section in the strike direction vertical meander belt. The characteristics of point bars in the main layer of the study area can be evaluated. In the Ng33 and Ng42 sub-layers of the study area, the point bar (or point bar connecting body) cannot be effectively identified by well logging and seismic data in the area where the width of the meander belt is less than 800 m (Figures 11A,B). At the same time, when the width of the meander belt is greater than 1000 m, three or more than three point bars (or point bar connecting body) can be basically identified in the meander belt in the Ng33 and Ng42 sub-layers (Figures 11A,B). In the Ng45 sub-layers of the study area, the point bar (or point bar connecting body) cannot be effectively identified by well logging and seismic data in the area where the width of the meander belt is less than 500 m (Figure 11C). When the width of the meander belt is bigger than 800 m, three or more than three point bars (or point bar connecting body) can be identified in the Ng45 sub-layers (Figure 11C).
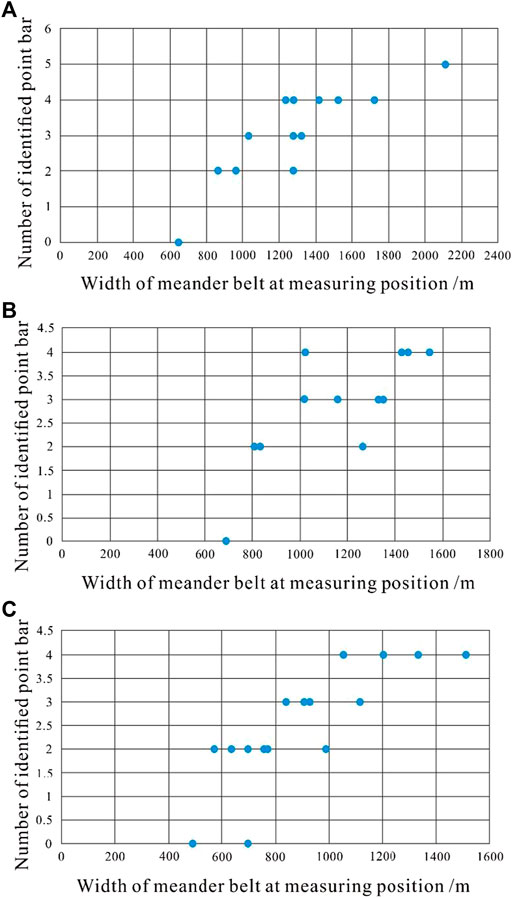
FIGURE 11. (A) Relationship between the width of the meander belt and the number of identifiable point bars in Ng33 sub-layer. (B) Relationship between the width of the meander belt and the number of identifiable point bars in Ng42 sub-layer. (C) Relationship between the width of the meander belt and the number of identifiable point bars in Ng45 sub-layer.
From the width of the point bar segments measured on the section perpendicular to the extension direction of the meander belt, the width of the point bar segments in the meander belt of the three main sub-layers is mostly 300–400m, and the maximum width of the point bar segments is about 550 m (Figure 12A). The proportion of the width of the point bar segments greater than 350 m in the meander belt of Ng45 sub-layer is only 30.6%, and the proportion of Ng33 and Ng42 sub-layers is about 40% (Figure 12B). According to the arrangement, the scale of point bars in Ng45 sub-layer meander belt is relatively small.
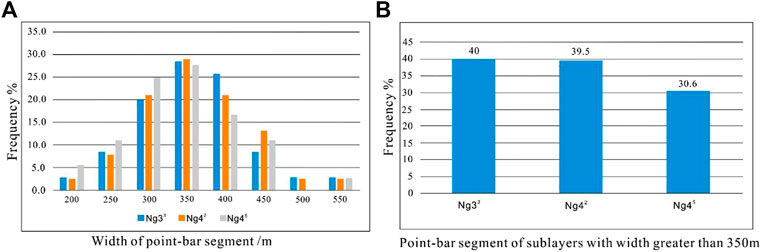
FIGURE 12. (A) Histogram of the width of the identifiable point bar segments and frequency. (B) Proportion of the width of the point bar segments greater than 350 m in different sub-layers.
Conclusion and Discussion
Large-scale meander-river belts are developed in sub-layers of Ng33, Ng42, and Ng 45 of sand groups 3 and 4 in the upper part of the Guantao Formation, and chute channels are mostly developed in areas with high curvature of meander-river belt. Two main meander-river belts are developed in layer 33, and the curvature is high. A large-scale meander-river belt is developed in Ng42 sub-layer, and the curvature of the meander belt is small. As a whole, in the main area of Ng45 sub-layer, two meander-river belts are developed in the East and West, surrounded by many small-scale fluvial deposits, which are characterized by “braided” channels on the plane. The small-scale fluvial deposits in Ng45 sub-layer have obvious morphological characteristics of point bar on the cross-section.
According to the statistics of the width of the meander-river belt and the thickness of sand body encountered by internal single drilling well in the three sub-layers, it is found that the maximum thickness of point bars in each meander-river belt changes little. However, the minimum sand-body thickness is obviously related to the width of the corresponding meander–river belt. In the same meander-river belt, the minimum thickness of the sand body in the area with large width is small, while in the area with small width, the minimum thickness of the sand body is larger. This may be related to the valley topography deposited in the meander belt. When the meandering river moves and swings in a wide valley, it is less limited by the terrain. The deposition of the new point baes has weak lateral erosion to the early point bars so that the mudstones between the point bars are partially or completely retained.
Through forward simulation, the seismic architectural model formed by different superposition degrees between point bar sand bodies reflecting the morphological characteristics of point bar can be established. The characteristics and distribution of point bars in the meander belt can be explained and predicted by using the targeted seismic architectural model. When using seismic information to identify point bars in the meander belt, the larger the width of the meander belt is, the easier it is to identify the architectural characteristics of point bars, and more point bars can be identified. Measured on the cross-section of the meander belt, the minimum width of the point bar of the three sub-layers is less than 200 m, and the width of the point bars is mostly between 300 and 400 m, of which the scale of point bars in the Ng45 sub-layer is relatively small as a whole.
Although the resolution of drilling data is high, the architectural characteristics of the sand body between wells still need to be interpreted with the help of seismic data. When the point bar sand bodies are superimposed and connected with each other, it is almost impossible to separate them from the seismic data (as shown in the forward diagram). At this time, the superimposed point bar connecting body is interpreted, rather than the single point bar sand body. For oil and gas production, the reservoir fluid migration is less affected by the interior of point bar or point bar connecting body. However, the relatively continuous structural belt of weak seepage and not seepage, which can separate different point bars or point bar connections, is of great significance to the development of oil and gas reservoirs.
Through the interpretation of the internal architecture of the meander belt on the continuous section, the distribution of point bar sand bodies in the area can be predicted. At the same time, due to the continuous migration of the meandering river, the point bar formed in the early stage has been eroded and transformed. Therefore, the explained point bars are mostly fragmented point bars, and their forms are mostly incomplete. However, these point bar fragments can still reflect the sedimentary characteristics during the formation of some meandering belts. The quantitative characteristics of point bar debris and the determined location of SBM and SIA sand bodies provide limited and valuable data support for the formation and simulation of underground meandering rivers.
Data Availability Statement
The original contributions presented in the study are included in the article/supplementary material; further inquiries can be directed to the corresponding author.
Author Contributions
BY: conceptualization, methodology, validation, formal analysis, investigation, data curation, writing—original draft, writing—review and editing, and visualization. LZ: methodology, resources, software, supervision, and funding acquisition. ZS: formal analysis, investigation, and data curation. YY: project administration and validation.
Conflict of Interest
Author BY was employed by Marine Oil Production Company, Shengli Oilfield Co. Ltd., Sinopec.
The remaining authors declare that the research was conducted in the absence of any commercial or financial relationships that could be construed as a potential conflict of interest.
Publisher’s Note
All claims expressed in this article are solely those of the authors and do not necessarily represent those of their affiliated organizations, or those of the publisher, the editors, and the reviewers. Any product that may be evaluated in this article, or claim that may be made by its manufacturer, is not guaranteed or endorsed by the publisher.
Acknowledgments
Sinopec Shengli Oilfield Company subsidized this study and granted the permission to publish this research. This study was supported by the National Science and Technology Major Project of China (No. 2017ZX05008-004) and National Natural Science Foundation of China (42002145).
References
Andrew D. Miall, A. D. (1988). Reservoir Heterogeneities in Fluvial Sandstones: Lessons from Outcrop Studies. Bulletin 72, 682–697. doi:10.1306/703C8F01-1707-11D7-8645000102C1865D
Bitrus, P. R., Iacopini, D., and Bond, C. E. (2016). Defining the 3D Geometry of Thin Shale Units in the Sleipner Reservoir Using Seismic Attributes. Mar. Petroleum Geol. 78, 405–425. doi:10.1016/j.marpetgeo.2016.09.020
Blacknell, C. (1982). Morphology and Surface Sedimentary Features of Point Bars in Welsh Gravel-Bed Rivers. Geol. Mag. 119, 181–192. doi:10.1017/S0016756800025863
Bridge, J. S. (2003). Rivers and Floodplains: Forms, Processes, and Sedimentary Record. Malden: Blackwell Publishing, 491.
Colombera, L., Mountney, N. P., Russell, C. E., Shiers, M. N., and McCaffrey, W. D. (2017). Geometry and Compartmentalization of Fluvial Meander-Belt Reservoirs at the Bar-form Scale: Quantitative Insight from Outcrop, Modern and Subsurface Analogues. Mar. Petroleum Geol. 82, 35–55. doi:10.1016/j.marpetgeo.2017.01.024
David, S. R. (1992). Petrophysical Evaluation of a Slope Fan/Basin-Floor Fan Complex: Cherry Canyon Formation, Ward County, Texas. AAPG Bulletin 76 (6), 805–827. doi:10.1306/BDFF88E4-1718-11D7-8645000102C1865D
Dong, Y., Zhu, X., Xian, B., Cheng, K., and Wang, P. (2014). Mapping Sediment-Dispersal Characteristics Using Seismic Geomorphology: Late Paleogene to Neogene, Qinan Sag, Huanghua Depression, China. Mar. Petroleum Geol. 54, 180–197. doi:10.1016/j.marpetgeo.2014.03.008
Donselaar, M. E., and Overeem, I. (2008). Connectivity of Fluvial Point-Bar Deposits: An Example from the Miocene Huesca Fluvial Fan, Ebro Basin, Spain. Bulletin 92 (9), 1109–1129. doi:10.1306/04180807079
Gao, Q. J., Chen, J. W., Jiao, S. Q., Hao, J. M., and Zhang, X. F. (1997). Sedimentary Model of Braided River of Guantao Formation in Gaoshangbao Oilfield. Erath Sci. 22 (5), 552–556.
Ghinassi, M. (2011). Chute Channels in the Holocene High-Sinuosity River Deposits of the Firenze Plain, Tuscany, Italy. Tuscany, Italy Sedimentol. 58 (3), 618–642. doi:10.1111/j.1365-3091.2010.01176.x
Ghinassi, M., Ielpi, A., Ventra, D., Martini, I., Finotello, A., and Bellizia, E. (2021). Distinguishing Mid‐channel and Bank‐attached Fluvial Bars by Flow Divergence: Implications for the Interpretation of Stratigraphic Records. Sedimentology 68 (6), 2783–2797. doi:10.1111/sed.12873
Ghinassi, M., Nemec, W., Aldinucci, M., Nehyba, S., Özaksoy, V., and Fidolini, F. (2014). Plan-form Evolution of Ancient Meandering Rivers Reconstructed from Longitudinal Outcrop Sections. Sedimentology 61 (4), 952–977. doi:10.1111/sed.12081
Hartley, A. J., Owen, A., Swan, A., Weissmann, G. S., Holzweber, B. I., Howell, J., et al. (2015). Recognition and Importance of Amalgamated Sandy Meander Belts in the Continental Rock Record. Geology 43 (8), 679–682. doi:10.1130/G36743.1
Kostic, B., and Aigner, T. (2007). Sedimentary Architecture and 3D Ground-Penetrating Radar Analysis of Gravelly Meandering River Deposits (Neckar Valley, SW Germany). Sedimentology 54 (4), 789–808. doi:10.1111/j.1365-3091.2007.00860.x
Li, W., Yue, D., Wang, W., Wang, W., Wu, S., Li, J., et al. (2019). Fusing Multiple Frequency-Decomposed Seismic Attributes with Machine Learning for Thickness Prediction and Sedimentary Facies Interpretation in Fluvial Reservoirs. J. Petroleum Sci. Eng. 177, 1087–1102. doi:10.1016/j.petrol.2019.03.017
Liu, H., Zhao, D., Jiang, Y., Zhuang, M., and Liu, Y. (2016). Hydrocarbon Accumulation Model for Neogene Traps in the Chengdao Area, Bohai Bay Basin, China. Mar. Petroleum Geol. 77, 731–745. doi:10.1016/j.marpetgeo.2016.06.017
Maynard, K., and Murray, I. (2003). One Million Years from the Upper Arang Formation, West Natuna Basin, Implications for Reservoir Distribution and Facies Variation in Fluvial Deltaic Deposits. Proc. Indon Pet. Assoc. 29th Ann. Conv. Twenty-Ninth Annual Convention and Exhibition. doi:10.29118/ipa.415.03.g.129
McArdle, N. J., Iacopini, D., KunleDare, M. A., and Paton, G. S. (2014). The Use of Geologic Expression Workflows for Basin Scale Reconnaissance: A Case Study from the Exmouth Subbasin, North Carnarvon Basin, Northwestern Australia. Interpretation 2, SA163–SA177. doi:10.1190/INT-2013-0112.1
Meakin, P., Sun, T., Jøssang, T., and Schwarz, K. (1996). A Simulation Model for Meandering Rivers and Their Associated Sedimentary Environments. Phys. A Stat. Mech. Its Appl. 233 (3-4), 606–618. doi:10.1016/s0378-4371(96)00197-5
Miall, A. D. (1985). Architectural-Element Analysis: A new Method ofFacies Analysis Applied to Fluvial Feposits. Earth Sci. Rev. 22, 261–308.
Musial, G., Reynaud, J.-Y., Gingras, M. K., Féniès, H., Labourdette, R., and Parize, O. (2012). Subsurface and Outcrop Characterization of Large Tidally Influenced Point Bars of the Cretaceous McMurray Formation (Alberta, Canada). Sediment. Geol. 279, 156–172. doi:10.1016/j.sedgeo.2011.04.020
Payenberg, T., Willis, B. J., Bracken, B., Posamentier, H. W., Pyrcz, M. J., Pusca, V., et al. (2011). Revisiting the subsurface classification offluvial sandbodies. Houston, Texas: American Association of Petroleum Geologists, Annual Convention and Exhibition.
Reijenstein, H. M., Posamentier, H. W., and Bhattacharya, J. P. (2011). Seismic Geomorphology and High-Resolution Seismic Stratigraphy of Inner-Shelf Fluvial, Estuarine, Deltaic, and Marine Sequences, Gulf of Thailand. Bulletin 95 (11), 1959–1990. doi:10.1306/03151110134
Shuai, D., and Wang, B. (1993). China Petroleum Geology. Beijing: V.6. Petroleum Industry Press, 524.
Stølum, H. H., and Friend, P. F. (1997). Percolation Theory Applied to Simulated Meander Belt Sandbodies. Earth Planet. Sci. Lett. 153, 265–277. doi:10.1016/S0012-821X(97)00173-8
Sun, Z., Lin, C., Du, D., Bi, H., and Ren, H. (2020b). Application of seismic architecture interpretation in enhancing oil recovery in late development Stage——Taking meandering river reservoir in Dongying depression as an example. J. Petroleum Sci. Eng. 187, 106769. doi:10.1016/j.petrol.2019.106769
Sun, Z., Lin, C., Zhang, X., Du, D., Yang, Y., and Guo, J. (2020a). Architectural analysis of subsurface meander-belt sandstones: a case study of a densely drilled oil field, zhanhua sag, east of bohai bay basin. Bulletin 104 (8), 1649–1677. doi:10.1306/04272017239
Sun, Z., Lin, C., Zhu, P., and Chen, J. (2018). Analysis and modeling of fluvial-reservoir petrophysical heterogeneity based on sealed coring wells and their test data, Guantao Formation, Shengli oilfield. J. Petroleum Sci. Eng. 162, 785–800. doi:10.1016/j.petrol.2017.11.006
Wang, X., Zhang, B., Zhao, T., Hang, J., Wu, H., and Yong, Z. (2017). Facies analysis by integrating 3D seismic attributes and well logs for prospect identification and evaluation - A case study from Northwest China. Interpretation 5, SE61–SE74. doi:10.1190/INT-2016-0149.1
Willis, B. J. (1989). Palaeochannel reconstructions from point bar deposits: a three-dimensional perspective. Sedimentology 36 (5), 757–766. doi:10.1111/j.1365-3091.1989.tb01744.x
Willis, B. J., and Tang, H. (2010). Three-dimensional connectivity of point-bar deposits. J. Sediment. Res. 80 (5), 440–454. doi:10.2110/jsr.2010.046
Xu, S., Hao, F., Xu, C., Zou, H., and Gao, B. (2019). Seismic geomorphology and sedimentology of a fluvial-dominated delta: Implications for the Neogene reservoirs, offshore Bohai Bay Basin, China. Bulletin 103, 2399–2420. doi:10.1306/0130191522517122
Zeng, H., Hentz, T. F., and Wood, L. J. (2001). Stratal slicing of Miocene-Pliocene sediments in Vermilion Block 50-Tiger Shoal Area, offshore Louisiana. Lead. Edge 20 (4), 408–418. doi:10.1190/1.1438962
Zeng, H. (2017). Thickness imaging for high-resolution stratigraphic interpretation by linear combination and color blending of multiple-frequency panels. Interpretation 5, T411–T422. doi:10.1190/INT-2017-0034.1
Zeng, H., and Backus, M. M. (2005). Interpretive advantages of 90°-phasewavelets: Part 2—Seismic applications. Geophysics. 70 (3), 17–24.
Zhu, H., Yang, X., Zhou, X., and Liu, K. (2014). Three-dimensional facies architecture analysis using sequence stratigraphy and seismic sedimentology: example from the Paleogene dongying Formation in the BZ3-1 block of the Bozhong sag, Bohai Bay Basin, China. Mar. Petroleum Geol. 51, 20–33. doi:10.1016/j.marpetgeo.2013.11.014
Keywords: meander-river belt, point bar, seismic architecture, quantitative evaluation, seismic sedimentation
Citation: Yang B, Zhang L, Sun Z and Yan Y (2022) Identification and Quantitative Characterization of Point Bars in Subsurface Meander-River Belt, Taking Chengdao Oilfield in Bohai Bay Basin as an Example. Front. Earth Sci. 10:932953. doi: 10.3389/feart.2022.932953
Received: 30 April 2022; Accepted: 22 June 2022;
Published: 19 August 2022.
Edited by:
Ivan Martini, University of Siena, ItalyReviewed by:
Tao Hu, China University of Petroleum, Beijing, ChinaPeng Zhu, Chengdu University of Technology, China
Copyright © 2022 Yang, Zhang, Sun and Yan. This is an open-access article distributed under the terms of the Creative Commons Attribution License (CC BY). The use, distribution or reproduction in other forums is permitted, provided the original author(s) and the copyright owner(s) are credited and that the original publication in this journal is cited, in accordance with accepted academic practice. No use, distribution or reproduction is permitted which does not comply with these terms.
*Correspondence: Bin Yang, eWFuZ2JpbjM2NXlAMTYzLmNvbQ==
†ORCID ID: Zhifeng Sun, orcid.org/0000-0001-6315-2894