 Yao Tang
 Xing Zhu
 Chunlei He
 Jiewei Hu
 Jie Fan
- 1State Key Laboratory of Geohazard Prevention and Geological Environmental Protection, Chengdu University of Technology, Chengdu, China
- 2School of Environment and Civil Engineering, Chengdu University of Technology, Chengdu, China
- 3College of Computer Science and Technology (Oxford Brookes Institute), Chengdu University of Technology, Chengdu, China
The critical point of rock mass transition from stable to unstable states is significant for the prevention and control of rock engineering hazards. This study explored the precursor characteristics of instability in sandstone containing prefabricated fractures and intact sandstone based on the critical slowing down (CSD) theory. The results demonstrated that as the input energy drove the dissipation energy dynamic system toward the critical point of two states, the CSD phenomenon appeared, which was manifested by the sudden increase in CSD time series metrics (skewness, kurtosis, and coefficient of variation) and autoregressive model metrics (variance and autocorrelation coefficient). The CSD characteristics of different dissipation energy dynamical systems were different, resulting in different times of CSD phenomena for distinct systems. In addition, the angle of the sandstone fracture affected the characteristics of the dissipation energy dynamical system and hence the appearance time of the precursor information. The precursor time of the sandstone containing 45° parallel fractures appeared earliest among all rock samples, and the ratio of the appearance time of the precursor point to the failure time of all rock samples reached more than 80%, which had good timeliness. The stress at the precursor point reached more than 80% of the peak stress, which corresponded to the plastic stage in the loading process, indicating that the CSD indicators constitute an effective monitoring index, which can provide an important reference for the stability monitoring and early warning of the field rock project.
Introduction
In general, the destruction of rock bridges causes the rock to change from a stable to an unstable state, which may bring catastrophic consequences and pose a huge threat to the safety of people’s lives (Du et al., 2021). Therefore, the crucial point of phase change during rock destruction can be exploited for monitoring and early warning in geotechnical engineering.
For complex dynamical systems in nature, the transition of a system from one state to another is a common phenomenon, which can be produced by external large-scale shocks or by minor perturbations (van de Leemput et al., 2014). The critical slowing down (CSD) theory is a concept in statistical physics that demonstrates that CSD phenomena occur near critical points when systems undergo phase transitions, which is manifested by the slowing down of the recovery of the dynamical system to its original state after a forced perturbation, which is typically observed in terms of variance and autocorrelation coefficients (Wu et al., 2021). The CSD theory has been shown to be a good predictor of the precursor information for the collapse of dynamical systems through several studies. For example, CSD occurs before the collapse of community dynamical systems (Dakos and Bascompte, 2014); before epilepsy, depression, and heart attack (Wichers et al., 2016; Maturana et al., 2020; Nannes et al., 2020); before financial and cryptocurrency crises (Diks et al., 2019; Tu et al., 2020); and before a flood disaster (Syed Musa et al., 2021). The main challenge for the analysis of early warning signals in time series data is to accurately “detrend” them to maintain the statistical properties of the fluctuations (Gama Dessavre et al., 2019). CSD precursor indicators can generally be classified into two categories: 1) time series-based indicators, which usually use different metrics to quantify changes in the statistical characteristics of the time series, and 2) model-based indicators, which fit data to a model to quantify the characteristics of the changes in the time series. The ultimate goal of both types of indicators is to capture the characteristics of the changes in the time series to find the change in the state of the dynamical system (Dakos et al., 2012).
A few scholars have conducted precursor studies on rock damage based on the CSD theory and have found that the acoustic emission count variance and autocorrelation coefficient increase when a rock sample enters the damage critical state, with more fluctuations and spurious signals in the autocorrelation coefficient than in the variance (Wei et al., 2018). High-water-content rock samples have earlier and more visible antecedent data (Li et al., 2021). The earlier onset of electric potential precursors compared to acoustic emission counts (Zhang et al., 2019). The acoustic emission energy precursor information appears later and closer to the damage point compared with acoustic emission counting, RA, and the critical points appear from long to short under several loading methods: compression test, Brazil test, and direct tension test (Zhang et al., 2021).
In summary, although all of the above studies yielded good results when approaching the critical point, skewness changes because of the slower recovery of the system near the critical point, and when the system state is close to the critical point, strong perturbations can drive the system across the boundary between the two states, a phenomenon known as flickering, which tends to increase kurtosis. Reduced robustness and flashing increase the coefficient of variance (Dakos and Bascompte, 2014; Nazarimehr et al., 2020). Current research on CSD of acoustic emission parameters during rock collapse uses variance and autocorrelation as precursors. In addition, owing to the high fluctuation of autocorrelation coefficients and the presence of spurious signals, the main CSD indicator is only one variance, which poses a challenge to the accuracy of early warning, and there is no explanation for the formation mechanism of the CSD phenomenon of rock damage during loading, as well as the effect of fractures on the appearance of the critical point. Therefore, in this study, tests were conducted on intact sandstone and sandstone containing parallel prefabricated fractures under uniaxial conditions. The purpose of this study is to examine the potential of multi-CSD indicators of acoustic emission parameters as early warning indicators during sandstone damage. In addition, the effect of the fracture dip on the critical slowing phenomena and the mechanism of emergence of the CSD phenomena during sandstone damage will be studied.
Test program
According to the findings of research that studied 70 large landslides in China, rocky landslide ratios made up 53% of the total and earthy landslide ratios made up 47%. Among those lithologies, sandstone and mudstone are the types of rock that are most prone to rocky landslides (Wen et al., 2004). In addition, joints in rock masses are characterized collectively as opposed to individually. The composition contains an element of random chance in it (Yang et al., 2017). As a result, during this pilot test, the sandstone with this particular combination of parallel fractures was investigated. A standard specimen of 100 mm in height and 50 mm in diameter was created, and prefabricated fractures were cut using a hydrodynamic cutting system. The upper and lower fractures of the prefabricated fractures each measured 1.5 mm in width and 20 mm in length, and the vertical distance between the two parallel fractures measured 20 mm. The two ends of the rock sample are finely polished using machinery. In this study, the breadth, length, and perpendicular distance of the cracks were taken as constant values. The rock samples were numbered as shown in Figure 1, and the intact rock samples were numbered w1 to w3. Rock samples having 30° parallel cracks were assigned numbers such as 30-1 to 30-3, 45° parallel cracks were assigned numbers such as 45-1 to 45-3, 60° parallel cracks were assigned numbers such as as 60-1 to 60-3, and 75° parallel cracks were assigned numbers such as 75-1 to 75-3. Each group contained three rock samples, for a total of 15 rocks.

FIGURE 1. Test rock samples. (A) specimen number and (B) rock fracture pattern.
As shown in Figure 2, the testing apparatus consists of a loading system and an acoustic emission acquisition system. The loading system adopts an MTS815.03 rigid press manufactured by MTS USA with the following main technical specifications: frame stiffness of 10.5 × 10⁹ N/m, maximum axial pressure of 4,600 kN, and compatibility with rock sample sizes of 50 mm × 100 mm and 100 mm × 200 mm. During this test, the loading rate of all rock samples was set to 0.2 mm/min.
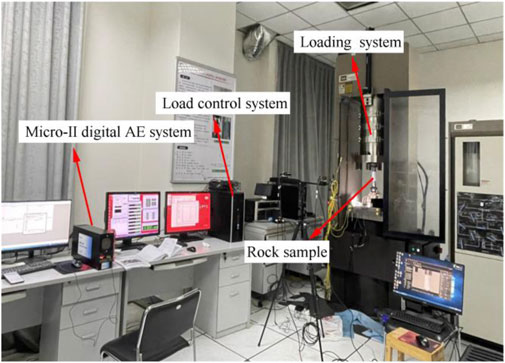
FIGURE 2. Test equipment.
Acoustic emission uses a Micro-II Digital AE System produced by American Physical Acoustics. The acoustic emission signal acquisition threshold is set to 45 dB, the sampling interval is set to 1 μs, the number of probes is 2, and petroleum jelly is applied to the contact surface of the rock sample and the acoustic emission probe. Before the test, the performance of all equipment was evaluated to ensure that the test was conducted without errors.
Theory and indicators of critical slowing down
In natural dynamic systems, when a system is subjected to external perturbations and shocks that result in a change in the phase state (the system changes from an old phase state to a new phase state), the recovery rate becomes slower after the perturbation when the system state is close to the critical point. Near the critical point, the action of small or large perturbations may drive the system to breach the boundary between two distinct states, a phenomenon known as flicker. Both slow recovery and flicker are characteristics of CSD phenomena (Scheffer et al., 2009). In general, the CSD indicator is used to describe the CSD phenomenon that occurs in a system, where the CSD indicators increase abruptly as the system approaches a critical point. CSD indicators are generally classified into two categories: metric-based indicators and model-based indicators, both of which reflect the changes in the characteristics of the system time series (Dakos et al., 2012), with the difference that the CSD indicators in the autoregressive model have the effect of window length and lag step whereas the metric indicators have the effect of window length only.
Metric-based critical slowing down indicators
System dynamics suggest that the slowing down of flicker and recovery near a critical point can lead to divergence in the variability of system fluctuations. As a result, the coefficient of variation might serve as an indicator of CSD throughout system phase transition (Chen et al., 2014). The variation coefficient can be expressed as Eq. 1.
where CV denotes the coefficient of variation, xi denotes the
As a system approaches a critical point due to an increase in the magnitude of the perturbation, the distribution of the values in the time series becomes uneven and leads to an increase in skewness. Of note, skewness may increase or decrease depending on whether the new state to be formed is in a direction greater or less than the current state (Guttal and Jayaprakash, 2008; Rozek et al., 2017). Skewness is a normalized third-order moment distributed around the mean, as shown in Eq. 2.
where SK denotes the skewness.
Small perturbations or strong perturbations may also cause the state of the system to reach extremes closer to the transition or to cross a critical point, and this effect may lead to an increase in the kurtosis of the time series (Biggs et al., 2009; Mehrabbeik et al., 2021). Kurtosis is a normalized fourth-order moment distributed around the mean, as shown in Eq. 3.
where KU denotes the kurtosis.
Based on autoregressive model critical slowing down indicators
As a system approaches the critical point, recovery slows down because of perturbations, which would imply that there is a long-term correlation between the present perturbations and the past, leading to an increase in the autocorrelation coefficient. Near the critical point, the variance increases because the system takes longer to recover from stochastic shock (Tan and Cheong, 2014). In the autoregression model, the CSD phenomenon can be observed through the variance and autocorrelation coefficient (Ma G et al., 2018; Zhang et al., 2021).
Variance is a characteristic quantity that describes the degree to which the sample data deviate from the mean in the sample and can be expressed as Eq. 4.
where
The autocorrelation coefficient is a statistic that describes the correlation between distinct moments of the same variable, and its expression with a lag length of j can be found in Eq. 5.
where S denotes the standard deviation, Suppose the state variable has a forced disturbance with a period of Δt and is approximately exponential during the perturbation process with a recovery rate of λ. In the autoregressive model, it can be expressed as Eq. 6.
where
where
where E is the mathematical expectation (Li et al., 2021).
Mechanical characteristics
During the deformation and failure of the rock, assuming that there is no heat exchange with the outside world during this physical process, the energy generated by the work done by the external force can be expressed according to the conservation of energy and the laws of thermodynamics (Peng et al., 2020) as Eq. 9.
where
where
where
After calculating the statistics for the data in Figures 3A–D, as shown in Figures 3E, F, during the loading process, the peak stress, total energy, dissipation energy, and elastic energy of intact rock samples are the largest and 45° is the smallest, 45° parallel fracture is the turning point of the mechanics and energy of rock samples, and the energy and mechanical properties show a decreasing trend from intact rock samples to rock samples containing 45° parallel fracture and an increasing trend from 45° to 75°, consistent with the findings of several scholars (Yang and Jing, 2011; Zhou et al., 2019; Lin et al., 2021), and the reason for the above phenomenon is that 45° dip joints are the most fracture-prone angle (Su et al., 2015). Moreover, the study shows that the elastic modulus reaches the minimum value when the dip angle of bedding is 45° (Zhang et al., 2022).
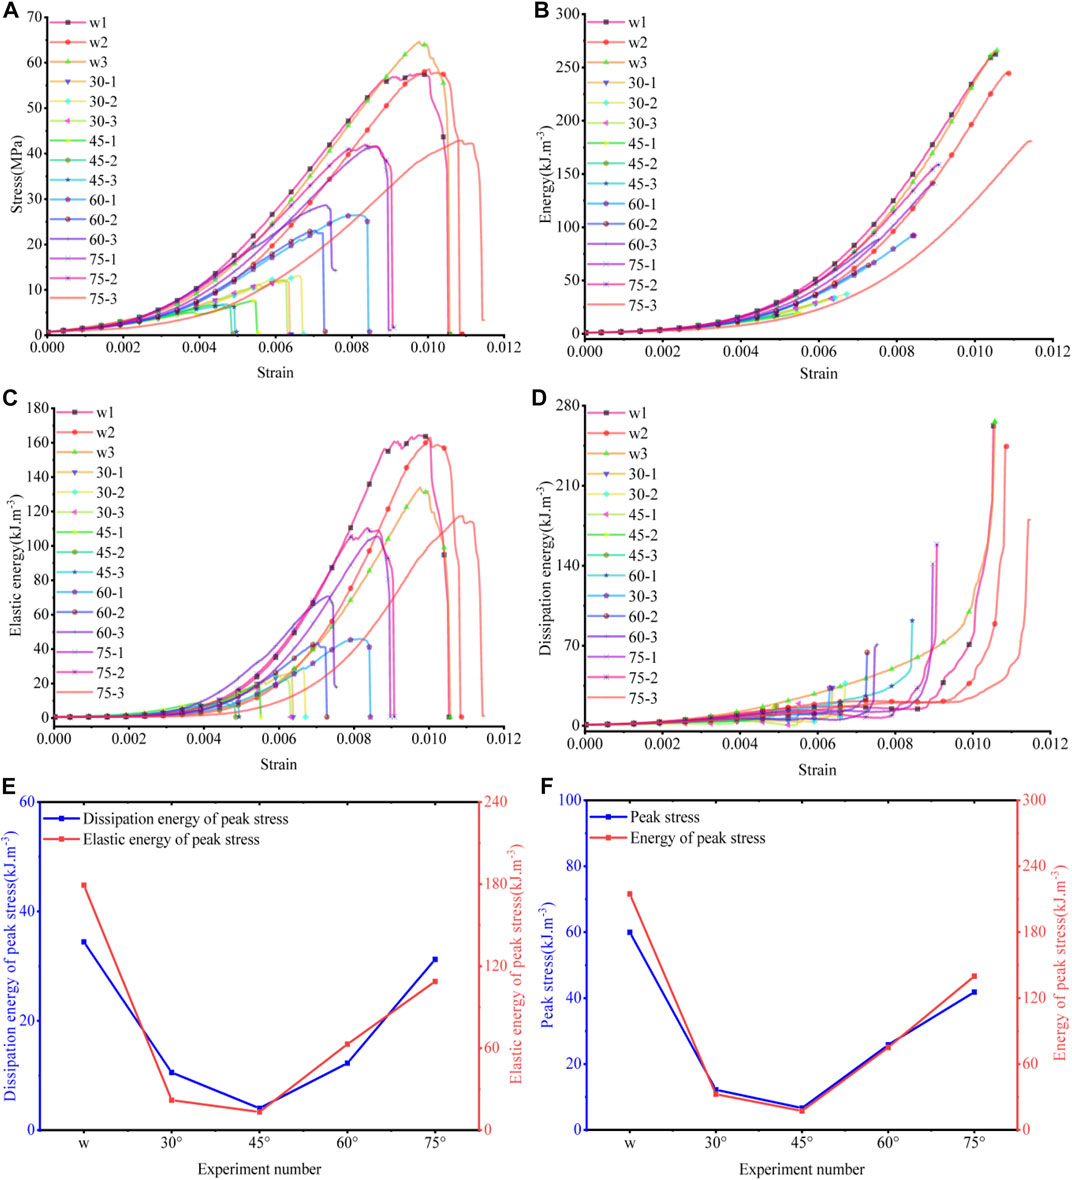
FIGURE 3. Mechanical characteristics. (A) stress–strain characteristics, (B) total energy characteristics, (C) elastic energy characteristics, (D) dissipation energy characteristics, and (E,F) average mechanical and energy values for each group of rock samples.
Effect of window length on the critical slowing down indicators
Acoustic emission rise time (Figure 4A) is time interval experienced when the potential signal triggering threshold voltage reaches the maximum amplitude value (Ali et al., 2019), RA (Figure 4A) is the acoustic emission rise time divided by the amplitude of the acoustic emission signal (Ohno and Ohtsu, 2010), and the aforementioned parameters are closely associated with rock damage rupture. In this article, using the acoustic emission rise time of the w1 rock sample as an illustration, the influence of window length on the CSD index of the time series is explored. As shown in Figure 4B, the coefficient of variation fluctuates more after the precursor point when the window length is 500, the second after the precursor point when the window length is 1,000, and the smallest when the window length is 2,000. However, the precursor point is consistent, and the fluctuation of the coefficient of variation before the precursor point is nearly identical, so the window length will produce only the impression of the coefficient of variation after the precursor point. The effect of window length on the coefficient of variation can be disregarded during the precursor investigation. In Figures 4C, D, the longer the window length is, the smaller are the fluctuations of skewness and kurtosis, which tend to be smooth, and the volatility of kurtosis is smaller than that of skewness. At the precursors, the size of the window length has no effect on the time of precursor appearance, but the larger the window length is, the greater are the values of skewness and kurtosis. In summary, the window size influences the volatility of the CSD index of the time series and has a negligible effect on the appearance of the precursor point. The coefficient of variation and kurtosis are superior observables compared with skewness.
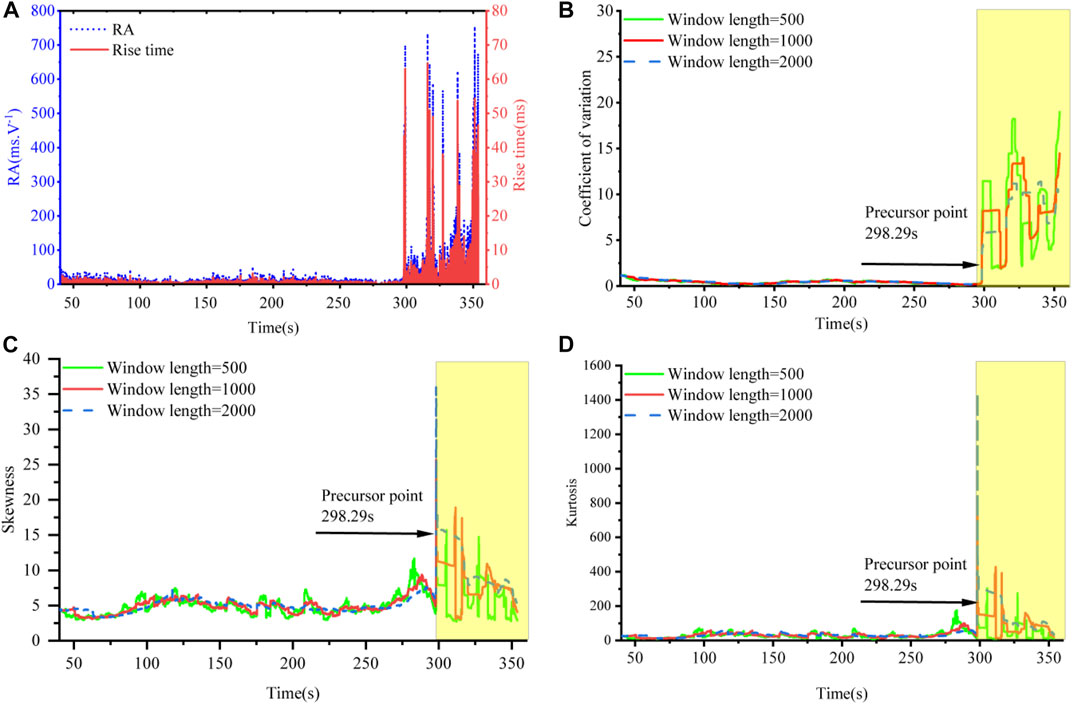
FIGURE 4. Acoustic emission parameters and the effect of window length on the metrics of the critical slowing down (CSD) phenomenon in w1. (A) rise time and RA of acoustic emission, (B) effect of window length on the coefficient of variation, (C) effect of window length on skewness, and (D) effect of window length on kurtosis.
Effect of window length and lag step length on the critical slowing down indicators of the autoregressive model
This subsection focuses on the effects of the lag step length and window length on the CSD indicators of the autoregressive model. First, we explore the impact of a window length of 500 and lag steps of 500, 1,000, and 2,000 on acoustic emission variance and autocorrelation. Second, we discuss the effects of a lag step of 500 and window lengths of 500, 1,000, and 2,000 on the variance of the rise time of the acoustic emission and the autocorrelation coefficient. Figure 5A demonstrates that the variance almost overlaps with different lag steps, indicating that the lag step has almost no effect on the variance. As shown in Figure 5B, the autocorrelation coefficient shows a chaotic behavior, since time series with different lag steps have different correlations with the original time series (Zhang et al., 2019). Figure 5C reveals that under the condition of a constant lag step, the larger the window length is, the greater is the tendency of the variance indicator to be stable, and the same phenomenon is observed for the autocorrelation coefficient (Figure 5D). The autocorrelation indicator is less resilient to short time or low-resolution time series. Therefore, it varies more and creates more spurious signals compared with variance, but the autocorrelation coefficient indicator is more robust to signals containing noise (Mehrabbeik et al., 2021). Although autocorrelation has the disadvantage of being affected by the lag step, the rise in the variance of the autocorrelation coefficient at the critical point is observed in all cases. Hence, the effect of window size and lag step on the critical slowing characteristics can be ignored.
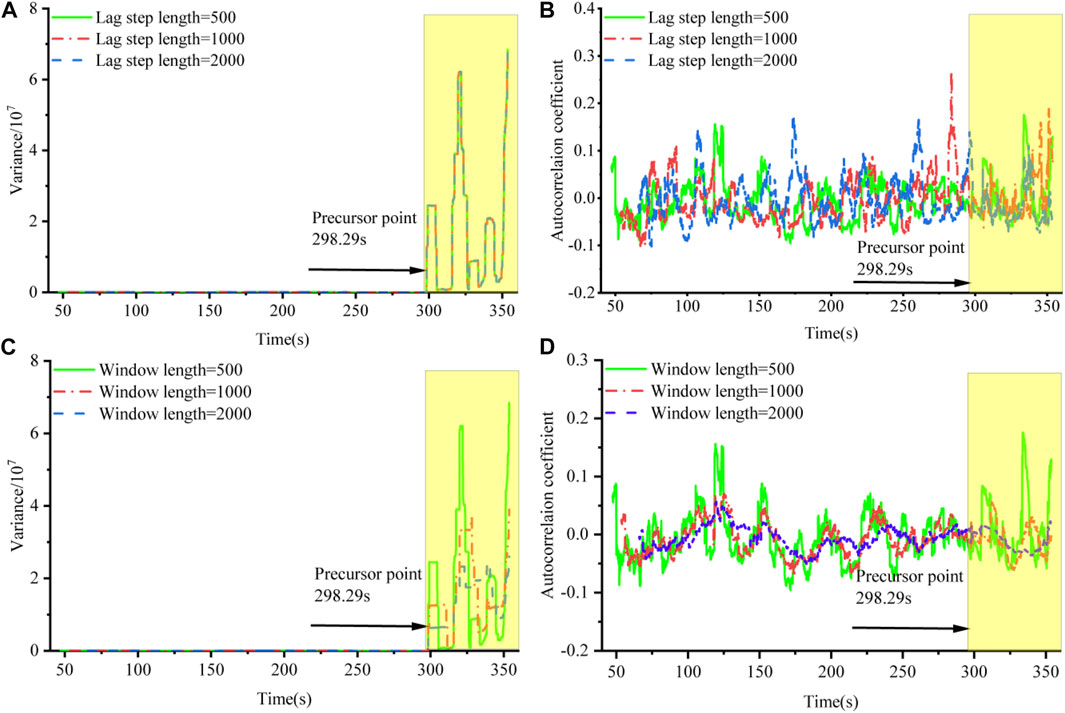
FIGURE 5. Effect of lag step and window length on the CSD indicators of the autoregression model. (A) effect of lag step length on variance for a fixed window length, (B) effect of lag step length on the autocorrelation coefficient for a fixed window length, (C) effect of window length on variance for a fixed lag step length, and (D) effect of window length on the autocorrelation coefficient for a fixed lag step length.
Critical slowing down phenomenon of sandstone acoustic emission parameters
The characteristics of the CSD metric indicators for the rising time and RA parameters of the w1 rock sample are depicted in Figure 6. During the loading process, the CSD metric indicators for the same time series of rising time and RA values almost overlap in the curve before the precursor point, indicating a high degree of similarity in fluctuation. In addition, the coefficient of variation, skewness, and kurtosis of the rise time and RA value at 298.29 s have a significant increase in turning point, which is easily identifiable, making it possible to use the metric indicators as the CSD indicators for the acoustic emission parameters in the sandstone damage process.
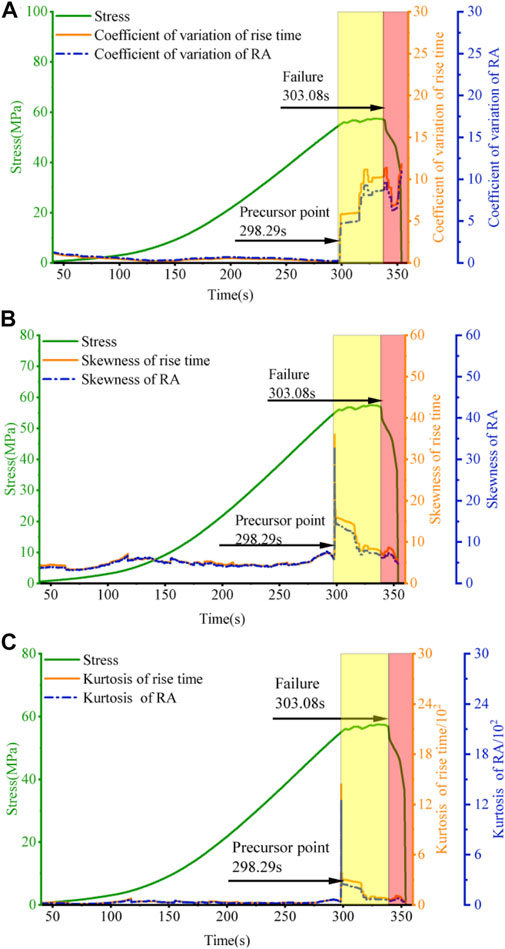
FIGURE 6. The CSD indicator of acoustic emission of rock sample w1. (A) variation coefficient characteristics of RA and rise time, (B) skewness characteristics of RA and rise time, and (C) kurtosis characteristics of RA and rise time.
As shown in Figures 7A, B, the CSD autoregression model indicators for the acoustic emission rising time and RA parameters exhibit remarkably comparable fluctuations, with the variance almost overlapping before the precursor point. After the precursor point, the variance of the acoustic emission rise time fluctuates much more. Throughout the whole loading process, the autocorrelation coefficients show multiple increases and drops, indicating that there were more false precursor signals and that the increasing trend at the precursor point was not as evident as the variance. Because the variance is readily identifiable as a critical point indicator, it can be employed as the primary reference indicator of the critical point in the autoregressive model for short time periods and time series with low time resolution.
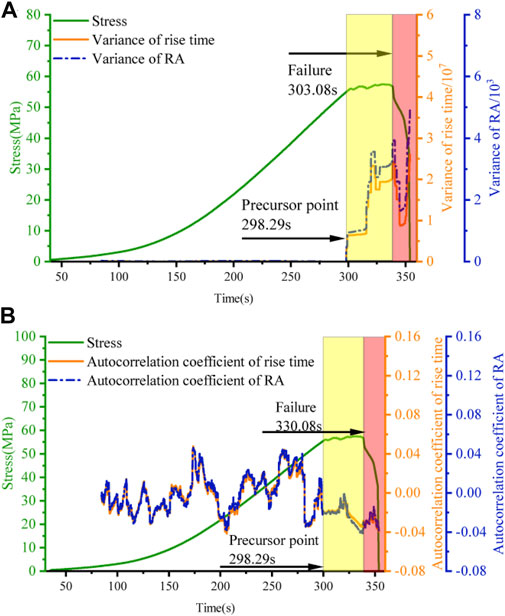
FIGURE 7. Characteristics of the CSD indicators of the autoregression model of the w-1 rock sample. (A) variance characteristics of RA and rise time and (B) autocorrelation coefficient characteristics of RA and rise time.
Statistics of precursors and mechanical characteristics
The window length and lag step can be selected according to the fluctuation of the data, with greater values being selected for the more fluctuating data and smaller values being selected for the less fluctuating data. The analysis of the window length and lag step in the above section reveals that the calculation results fluctuate less when the window length and lag step are 2,000. Therefore, in this study, both the lag step and the window length are set to 2,000. In practical applications, the window length and the lag step should be selected according to the fluctuation of the data. As depicted in Figure 8, under the condition of a constant loading rate, the damage times of all rock samples from longest to shortest are as follows: intact rock sample, 75° rock sample, 60° rock sample, 30° rock sample, and 45° rock sample, and the appearance time of the precursor point follows the same trend. However, there is no certain pattern regarding the duration of early warning time (the early warning time is the time difference between the damage time and the precursor time). As illustrated in Figure 9, the peak stress and the stress at the precursor point are as follows (from the greatest to the smallest): intact rock samples, 75° rock samples, 60° rock samples, 30° rock samples, and 45° rock samples. This is because 45° dip angle joints are the most fracture-prone angle. In other words, rock samples close to this angle have low strength and are susceptible to damage. In all tests, the ratio of the stress at the precursor point to the peak stress exceeded 80% in most cases, which roughly corresponds to the plastic deformation stage of new fracture formation, indicating that the precursor has a clear physical meaning. In addition, the ratio of precursor point time to failure time exceeded 80%, demonstrating that the precursors have good timeliness. In a set of rock samples, differences in mechanical and CSD properties are linked to the arrangement of crystals inside the rock mass as well as the distribution of microscopic holes and fissures. That is, there is anisotropy in the rock material, which leads to variances in the mechanical characteristics and CSD characteristics of the same group of tests (Zhang et al., 2021), which may also be caused by the difference in the degree of damage caused to the rock mass during fracture formation.
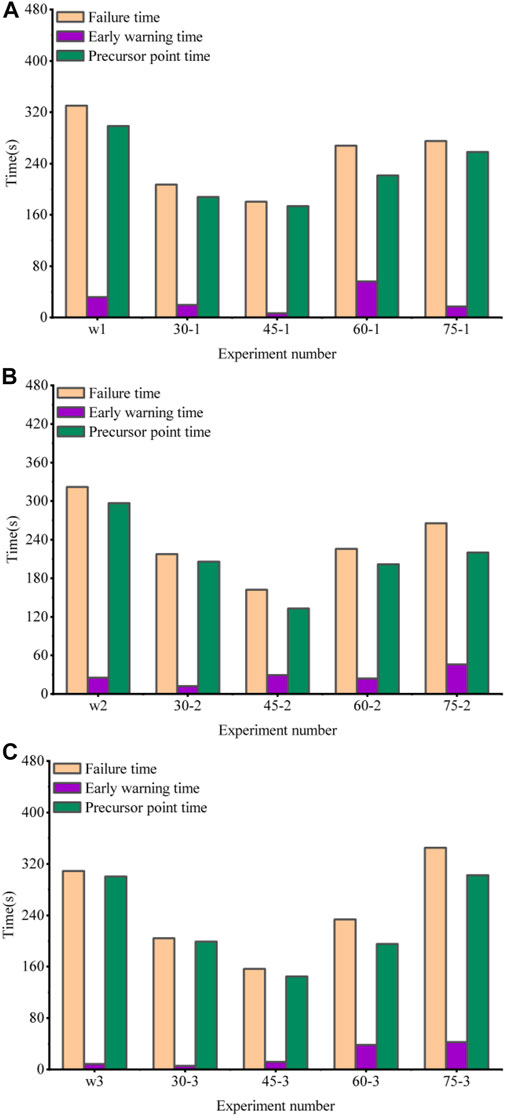
FIGURE 8. Statistics of time characteristics (failure time, early warning time, and precursor point time). (A) w1∼75-1, (B) w2∼75-2, and (C) w3∼75-3.
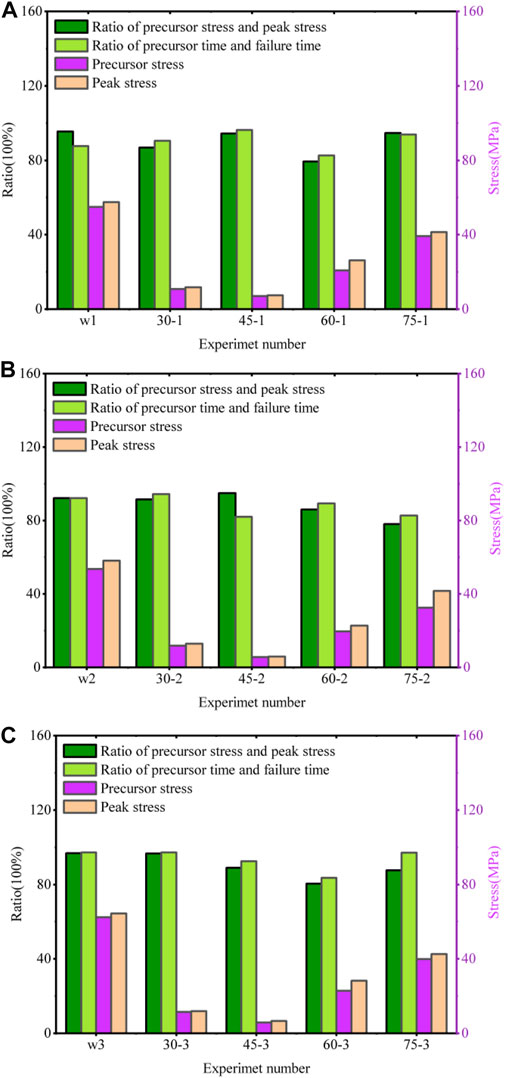
FIGURE 9. A statistical analysis of the time ratio, the stress ratio, and the features of stress. (A) w1∼75-1, (B) w2∼75-2, and (C) w3∼75-3.
In this study, after the mean statistics of mechanical and precursor characteristics of all rock samples, the damage time, time of precursor point appearance, peak stress, and precursor point stress showed a decreasing trend from intact rock samples to 45° rock samples and an increasing trend from 45° rock samples to 75° rock samples, and the trend of early warning time showed an inverse relationship to the ratio of precursor time and damage time (Figure 10).
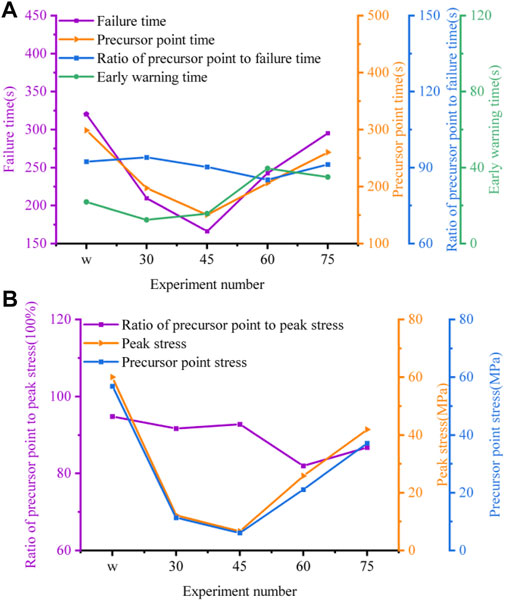
FIGURE 10. Statistics of the mean characteristics of precursors and mechanics. (A) temporal characteristics of each group of rock samples and (B) mechanical characteristics of each group of rock samples.
Critical slowing down phenomenon of the sandstone damage process
Driven slowly by environmental factors, systems are pushed to evolve at a critical point where regime shifts occur and such shifts will be permanent (Dakos et al., 2015). The blue balls in Figure 11 represent the current state of the system, which varies from system to system. The red balls represent thresholds, and the slope of the basin represents resilience. Driven by external factors, the system is pushed toward the threshold (critical point), which will cause the resilience system to slow down (less slope near the threshold point), creating a CSD phenomenon and making the CSD indicators increase. In addition, small perturbations can drive the system across the boundary between two basins of attraction, leading to a large shift in the system state into another state (van de Leemput et al., 2014).
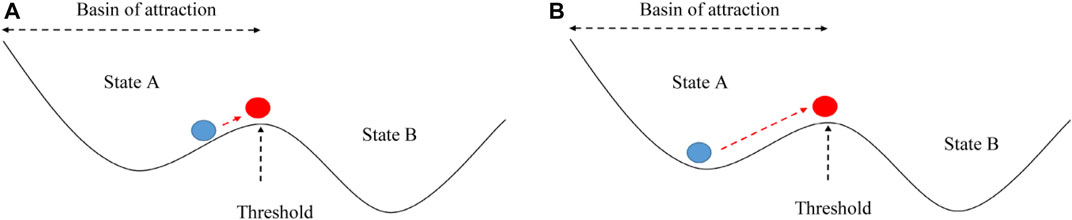
FIGURE 11. Schematic diagram of the CSD phenomenon (Dakos et al., 2015). (A) close to the threshold and (B) far from the threshold.
During rock damage, dissipation energy is dissipated mostly by friction between structural surfaces and by breaking the original structural surface inside the rock to form a new surface. Therefore, the dissipation energy can indicate the damage to the rock (Jin et al., 2017), and acoustic emission is a transient elastic wave formed by the quick release of local strain energy within or on the surface of the material (Vahaviolos, 1999). Thus, in this study, the dynamic evolution of dissipation energy during loading is seen as a systematic change process, and its change characteristics are employed to attempt to explain why the CSD phenomenon exists during loading.
Figure 12 the mechanism of the formation of two typical CSD phenomena in this experiment. Figure 12A depicts a relatively simple kinetic system of the sandstone, in which the system undergoes only two states during the entire process: state A and state B. Throughout the loading process, the mechanical equipment continuously injects energy into the sandstone, which acts as a driving force to alter the dissipation energy system, thereby altering the state of the sandstone. When the dissipation energy system is driven to move from state A to near the threshold, the critical slowdown phenomenon appears and the CSD indicators rise because of a diminished ability to recover to the original state (Figure 12C). Figure 12B is a more complex dynamic system, as shown in Figure 12D, in which the system is driven to cross the boundary between two basins of attraction by an external (mechanical input of energy to the sandstone) perturbation, the system state is changed into state B, and the first CSD phenomenon (flickering) appears near the threshold, which is manifested by an increase in the CSD indicators. With the continuous increase in energy during loading, the dissipation energy system crosses the boundary of state B and state C again, the CSD phenomenon reappears close to the second threshold, and the variance appears to steadily increase. The reason for the smaller increase in variance near the second threshold rather than the first threshold is closely related to the characteristics of the CSD phenomenon, as can be seen from Figure 12D, where the slope of the first threshold point is less than the slope of the second threshold point, i.e., the dissipation energy system recovers much more slowly near the first threshold point than the second threshold point. In the time domain, the dissipation energy system takes much more time to go from the starting point of state A (unloaded state) to the endpoint of state A than from the starting point of state B to the endpoint of state B. In a similar way, the time required from the beginning of state B to its end is longer than the time required from the beginning of state C to its end. As shown in Figure 3B, the input energy is a gradually growing process, and therefore, it will be irrecoverable after causing a change in the system state.
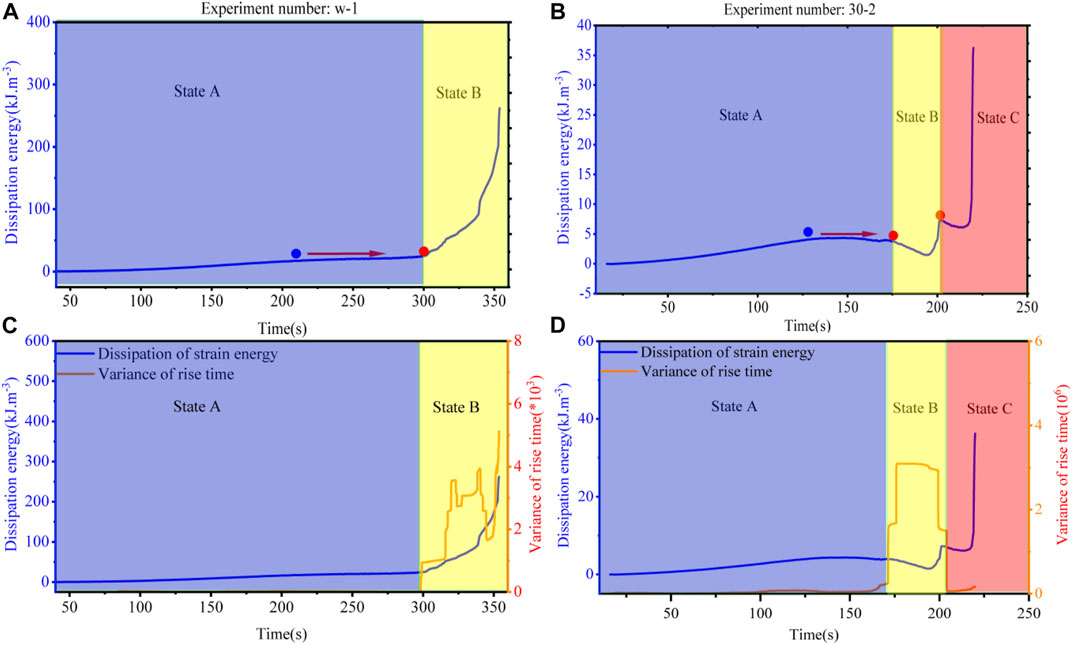
FIGURE 12. Mechanism of the CSD phenomenon in sandstone. (A,C) first typical kinetic system of sandstone and (B,D) second typical kinetic system of sandstone.
Discussion
Previous methods for studying the rock fracture acoustic emission precursors include singular spectrum analysis, fast Fourier transform, frequency center of mass, fractal characteristics, and wave velocity (Gong et al., 2017; Li et al., 2019; Mei et al., 2019; Zhao et al., 2020; Dong et al., 2021). However, the precursors are difficult to identify. In this study, we proposed the CSD theory and added time series indicators to the autoregressive model indicators. Through the combination of multiple CSD indicators, the probability of false alarms and missed alarms in the warning process is reduced. In addition, the formation mechanism of the CSD phenomenon of rock sample destruction is explained by energy. In actuality, the CSD phenomenon does not occur in all systems changing states; rather, it typically occurs in the following situations (Dakos et al., 2015): 1) a slow environmental change toward a tipping point, 2) slow–fast cyclic transitions, 3) a combination of random perturbations and periodic changes in the environment, and 4) strong perturbations that cause the system to cross into a new state. External drivers in practical engineering are more complex. For instance, driven by rainfall, earthquakes, and human activities, changes in temperature fields may trigger geological hazards (Roje-Bonacci et al., 2009; Ma J et al., 2018; Oswald et al., 2021; Li et al., 2022). Several studies have indicated that geological hazards such as earthquakes exhibit critical slowing phenomena (Qiao et al., 2022). However, since landslides and collapses may be caused by a combinations of multiple driving factors, this makes it challenging for detecting CSD phenomena in practical engineering. As a result, this will be our next major research emphasis.
Conclusion
In this study, uniaxial loading tests were conducted on parallel-fractured sandstone with different angles and intact sandstone, and acoustic emission was used to monitor the entire sandstone loading process in real time. On the basis of the study of the characteristics of CSD indicators of acoustic emission parameters during sandstone damage, the effect of prefabricated fracture angles on CSD phenomena, and the mechanism of CSD formation in sandstone, the following conclusion was drawn.
(1) For the autoregressive model CSD indicators, the lag step and window length have essentially no effect on the appearance time of precursor points, and the longer the window length is, the less is the fluctuation of the autoregressive model CSD indicators. Compared to the variance, the autocorrelation coefficient is more influenced by the lag step length. In addition, the autocorrelation coefficient fluctuates greatly throughout the process, making it difficult to identify the precursor points as the variance. The size of the window affects the degree of fluctuation of the CSD metric; the longer the window is, the smoother is the metric.
(2) Under the conditions of constant fracture length, width, and fracture spacing, the time of the precursor point, stress at the precursor point, peak stress, and damage time decreased from intact rock samples to 45° rock samples and had an increasing trend from 45° to 75° rock samples.
(3) In the process of sandstone failure, the total energy input to the sandstone from the loading equipment is a slowly increasing process, which, as a driving force, will drive the dissipation energy system to transfer from one state to another, and the CSD phenomenon will appear near the critical point of the two states, thus leading to the development of the state of the sandstone from a stable state to an unstable state, which is manifested by the increase in the CSD indicators. In addition, near the critical point, a small perturbation of the total energy to the dissipation energy system causes the dissipation energy to flicker across the boundary between the two states. For such a slowly developing and abruptly changing system, the change of state is permanent, which means that the rupture of the rock mass is irreparable.
Data availability statement
The raw data supporting the conclusion of this article will be made available by the authors, without undue reservation.
Author contributions
YT: conceptualization, methodology, formal analysis, investigation, data curation, and writing—original draft. XZ: conceptualization, methodology, validation, resources, writing—review and editing, and funding acquisition. CH: methodology, investigation, and data curation. JH: validation and writing. JF: conceptualization, validation, and writing.
Funding
This work was supported by the National Natural Science Foundation of China (41877254 and 41941019), the National Key Research and Development Program (2019YFC1509602), and the Second Qinghai-Tibet Plateau Integrated Scientific Research Grant (2019QZKK0201).
Conflict of interest
The authors all declare that they have no conflict of interest.
Publisher’s note
All claims expressed in this article are solely those of the authors and do not necessarily represent those of their affiliated organizations, or those of the publisher, the editors, and the reviewers. Any product that may be evaluated in this article, or claim that may be made by its manufacturer, is not guaranteed or endorsed by the publisher.
References
Ali, S. M., Hui, K. H., Hee, L. M., Leong, M. S., Abdelrhman, A. M., Al-Obaidi, M. A., et al. (2019). Observations of changes in acoustic emission parameters for varying corrosion defect in reciprocating compressor valves. Ain Shams Eng. J. 10, 253–265. doi:10.1016/j.asej.2019.01.003
Biggs, R., Carpenter, S. R., and Brock, W. A. (2009). Turning back from the brink: Detecting an impending regime shift in time to avert it. Proc. Natl. Acad. Sci. U. S. A. 106, 826–831. doi:10.1073/pnas.0811729106
Chen, A., Sanchez, A., Dai, L., and Gore, J. (2014). Dynamics of a producer-freeloader ecosystem on the brink of collapse. Nat. Commun. 5, 3713. doi:10.1038/ncomms4713
Dakos, V., and Bascompte, J. (2014). Critical slowing down as early warning for the onset of collapse in mutualistic communities. Proc. Natl. Acad. Sci. U. S. A. 111, 17546–17551. doi:10.1073/pnas.1406326111
Dakos, V., Carpenter, S. R., Brock, W. A., Ellison, A. M., Guttal, V., Ives, A. R., et al. (2012). Methods for detecting early warnings of critical transitions in time series illustrated using simulated ecological data. PLoS ONE 7, e41010. doi:10.1371/journal.pone.0041010
Dakos, V., Carpenter, S. R., van Nes, E. H., and Scheffer, M. (2015). Resilience indicators: Prospects and limitations for early warnings of regime shifts. Phil. Trans. R. Soc. B 370, 20130263. doi:10.1098/rstb.2013.0263
Diks, C., Hommes, C., and Wang, J. (2019). Critical slowing down as an early warning signal for financial crises? Empir. Econ. 57, 1201–1228. doi:10.1007/s00181-018-1527-3
Dong, L., Chen, Y., Sun, D., and Zhang, Y. (2021). Implications for rock instability precursors and principal stress direction from rock acoustic experiments. Int. J. Min. Sci. Technol. 31, 789–798. doi:10.1016/j.ijmst.2021.06.006
Du, Y., Xie, M., Jiang, Y., Chen, C., Jia, B., and Huo, L. (2021). Review on the formation mechanismand early warning of rock collapse. Metal Mine 535 (01), 106–119. doi:10.19614/j.cnki.jsks.202101008
Gama Dessavre, A., Southall, E., Tildesley, M. J., and Dyson, L. (2019). The problem of detrending when analysing potential indicators of disease elimination. J. Theor. Biol. 481, 183–193. doi:10.1016/j.jtbi.2019.04.011
Gong, Y., Song, Z., He, M., Gong, W., and Ren, F. (2017). Precursory waves and eigenfrequencies identified from acoustic emission data based on Singular Spectrum Analysis and laboratory rock-burst experiments. Int. J. Rock Mech. Min. Sci. 91, 155–169. doi:10.1016/j.ijrmms.2016.11.020
Guttal, V., and Jayaprakash, C. (2008). Changing skewness: an early warning signal of regime shifts in ecosystems. Ecol. Lett. 11, 450–460. doi:10.1111/j.1461-0248.2008.01160.x
Jin, J., Cao, P., Chen, Y., Pu, C., Mao, D., Fan, X., et al. (2017). Influence of single flaw on the failure process and energy mechanics of rock-like material. Comput. Geotech. 86, 150–162. doi:10.1016/j.compgeo.2017.01.011
Li, B., Zhang, G., Wang, G., and Qiao, J. (2022). Damage evolution of frozen-thawed granite based on high-resolution computed tomographic scanning. Front. Earth Sci. 10, 912356. doi:10.3389/feart.2022.912356
Li, D., Wang, E., Kong, X., Jia, H., Wang, D., Ali, M., et al. (2019). Damage precursor of construction rocks under uniaxial cyclic loading tests analyzed by acoustic emission. Constr. Build. Mat. 206, 169–178. doi:10.1016/j.conbuildmat.2019.02.074
Li, H., Shen, R., Qiao, Y., and He, M. (2021). Acoustic emission signal characteristics and its critical slowing down phenomenon during the loading process of water-bearing sandstone. J. Appl. Geophy. 194, 104458. doi:10.1016/j.jappgeo.2021.104458
Lin, Q., Cao, P., Wen, G., Meng, J., Cao, R., Zhao, Z., et al. (2021). Crack coalescence in rock-like specimens with two dissimilar layers and pre-existing double parallel joints under uniaxial compression. Int. J. Rock Mech. Min. Sci. 139, 104621. doi:10.1016/j.ijrmms.2021.104621
Ma, G., Hu, X., Yin, Y., Luo, G., and Pan, Y. (2018). Failure mechanisms and development of catastrophic rockslides triggered by precipitation and open-pit mining in Emei, Sichuan, China. Landslides 15, 1401–1414. doi:10.1007/s10346-018-0981-5
Ma, J., Tang, J., Yan, Z., Jiang, F., Zeng, H., and Fang, C. (2018). “Data-driven power system collapse predicting using critical slowing down indicators,” in Proceeding International Conference on Power System Technology (POWERCON), Guangzhou, 06-08 November 2018 (IEEE), 1879–1884. doi:10.1109/POWERCON.2018.8602265
Maturana, M. I., Meisel, C., Dell, K., Karoly, P. J., D’Souza, W., Grayden, D. B., et al. (2020). Critical slowing down as a biomarker for seizure susceptibility. Nat. Commun. 11, 2172. doi:10.1038/s41467-020-15908-3
Mehrabbeik, M., Ramamoorthy, R., Rajagopal, K., Nazarimehr, F., Jafari, S., Hussain, I., et al. (2021). Critical slowing down indicators in synchronous period-doubling for salamander flicker vision. Eur. Phys. J. Spec. Top. 230, 3291–3298. doi:10.1140/epjs/s11734-021-00113-0
Mei, F., Hu, C., Li, P., and Zhang, J. (2019). Study on main frequency precursor characteristics of acoustic emission from deep buried dali rock explosion. Arab. J. Geosci. 12, 645. doi:10.1007/s12517-019-4706-4
Nannes, B., Quax, R., Ashikaga, H., Hocini, M., Dubois, R., Bernus, O., et al. (2020). “Early signs of critical slowing down in heart surface electrograms of ventricular fibrillation victims,” in Computational science – ICCS 2020 lecture notes in computer science. Editors V. V. Krzhizhanovskaya, G. Závodszky, M. H. Lees, J. J. Dongarra, P. M. A. Sloot, S. Brissoset al. (Cham: Springer International Publishing), 334–347. doi:10.1007/978-3-030-50423-6_25
Nazarimehr, F., Jafari, S., Perc, M., and Sprott, J. C. (2020). Critical slowing down indicators. Europhys. Lett. 132, 18001. doi:10.1209/0295-5075/132/18001
Ohno, K., and Ohtsu, M. (2010). Crack classification in concrete based on acoustic emission. Constr. Build. Mat. 24, 2339–2346. doi:10.1016/j.conbuildmat.2010.05.004
Oswald, P., Strasser, M., Hammerl, C., and Moernaut, J. (2021). Seismic control of large prehistoric rockslides in the Eastern Alps. Nat. Commun. 12, 1059. doi:10.1038/s41467-021-21327-9
Peng, K., Liu, Z., Zou, Q., Wu, Q., and Zhou, J. (2020). Mechanical property of granite from different buried depths under uniaxial compression and dynamic impact: An energy-based investigation. Powder Technol. 362, 729–744. doi:10.1016/j.powtec.2019.11.101
Qiao, Z., Wang, G., Fu, H., and Hu, X. (2022). Identification of groundwater radon precursory anomalies by critical slowing down theory: A case study in yunnan region, southwest China. Water 14, 541. doi:10.3390/w14040541
Roje-Bonacci, T., Miščević, P., and Števanić, D. (2009). Rock-slides on road cuttings in the dinaric karst of Croatia: Processes and factors. Environ. Geol. 58, 359–369. doi:10.1007/s00254-008-1602-8
Rozek, J. C., Camp, R. J., and Reed, J. M. (2017). No evidence of critical slowing down in two endangered Hawaiian honeycreepers. PLOS ONE 12, e0187518. doi:10.1371/journal.pone.0187518
Scheffer, M., Bascompte, J., Brock, W. A., Brovkin, V., Carpenter, S. R., Dakos, V., et al. (2009). Early-warning signals for critical transitions. Nature 461, 53–59. doi:10.1038/nature08227
Su, H. J., Jing, H. W., Zhao, H. H., Zhang, M. L., and ang Yin, Q. (2015207). Strength and fracture characteristic of rock mass containing parallel fissures. Eng. Mech. 32, 192–197. doi:10.6052/j.issn.1000-4750.2014.05.0419
Syed Musa, S. M. S., Md Noorani, M. S., Abdul Razak, F., Ismail, M., Alias, M. A., Hussain, S. I., et al. (2021). Using persistent homology as preprocessing of early warning signals for critical transition in flood. Sci. Rep. 11, 7234. doi:10.1038/s41598-021-86739-5
Tan, J. P. L., and Cheong, S. S. A. (2014). Critical slowing down associated with regime shifts in the US housing market. Eur. Phys. J. B 87, 38. doi:10.1140/epjb/e2014-41038-1
Tu, C., D’Odorico, P., and Suweis, S. (2020). Critical slowing down associated with critical transition and risk of collapse in crypto-currency. R. Soc. Open Sci. 7, 191450. doi:10.1098/rsos.191450
S. J. Vahaviolos (Editor) (1999). Acoustic emission: standards and technology update. (West Conshohocken, PA: ASTM).
van de Leemput, I. A., Wichers, M., Cramer, A. O. J., Borsboom, D., Tuerlinckx, F., Kuppens, P., et al. (2014). Critical slowing down as early warning for the onset and termination of depression. Proc. Natl. Acad. Sci. U. S. A. 111, 87–92. doi:10.1073/pnas.1312114110
Wei, Y., Li, Z., Kong, X., Zhang, Z., Cheng, F., Zheng, X., et al. (2018). The precursory information of acoustic emission during sandstone loading based on critical slowing down theory. J. Geophys. Eng. 15, 2150–2158. doi:10.1088/1742-2140/aac009
Wen, B., Wang, S., Wang, E., and Zhang, J. (2004). Characteristics of rapid giant landslides in China. Landslides 1, 247–261. doi:10.1007/s10346-004-0022-4
Wichers, M., and Groot, P. C.PsychosystemsESM GroupEWS Group (2016). Critical slowing down as a personalized early warning signal for depression. Psychother. Psychosom. 85, 114–116. doi:10.1159/000441458
Wu, H., Hou, W., Zuo, D., Yan, P., and Zeng, Y. (2021). Early-warning signals of drought-flood state transition over the dongting lake basin based on the critical slowing down theory. Atmosphere 12, 1082. doi:10.3390/atmos12081082
Yang, S.-Q., and Jing, H.-W. (2011). Strength failure and crack coalescence behavior of brittle sandstone samples containing a single fissure under uniaxial compression. Int. J. Fract. 168, 227–250. doi:10.1007/s10704-010-9576-4
Yang, X.-X., Jing, H.-W., Tang, C.-A., and Yang, S.-Q. (2017). Effect of parallel joint interaction on mechanical behavior of jointed rock mass models. Int. J. Rock Mech. Min. Sci. 92, 40–53. doi:10.1016/j.ijrmms.2016.12.010
Zhang, L., Niu, F., Liu, M., Ju, X., Wang, Z., Wang, J., et al. (2022). Fracture characteristics and anisotropic strength criterion of bedded sandstone. Front. Earth Sci. 10, 879332. doi:10.3389/feart.2022.879332
Zhang, X., Li, Z., Niu, Y., Cheng, F., Ali, M., Bacha, S., et al. (2019). An experimental study on the precursory characteristics of EP before sandstone failure based on critical slowing down. J. Appl. Geophy. 170, 103818. doi:10.1016/j.jappgeo.2019.103818
Zhang, Z., Li, Y., Hu, L., Tang, C., and Zheng, H. (2021). Predicting rock failure with the critical slowing down theory. Eng. Geol. 280, 105960. doi:10.1016/j.enggeo.2020.105960
Zhao, K., Yang, D., Gong, C., Zhuo, Y., Wang, X., Zhong, W., et al. (2020). Evaluation of internal microcrack evolution in red sandstone based on time–frequency domain characteristics of acoustic emission signals. Constr. Build. Mat. 260, 120435. doi:10.1016/j.conbuildmat.2020.120435
Keywords: energy release, parallel prefabricated fractured sandstone, rock failure precursor, critical slowing down indicators, early warning signals
Citation: Tang Y, Zhu X, He C, Hu J and Fan J (2022) Critical slowing down theory provides early warning signals for sandstone failure. Front. Earth Sci. 10:934498. doi: 10.3389/feart.2022.934498
Received: 02 May 2022; Accepted: 29 June 2022;
Published: 05 August 2022.
Edited by:
Yan Du, University of Science and Technology Beijing, ChinaReviewed by:
Linwei Li, Guizhou University, ChinaJia Yanchang, North China University of water resources and hydropower, China
Copyright © 2022 Tang, Zhu, He, Hu and Fan. This is an open-access article distributed under the terms of the Creative Commons Attribution License (CC BY). The use, distribution or reproduction in other forums is permitted, provided the original author(s) and the copyright owner(s) are credited and that the original publication in this journal is cited, in accordance with accepted academic practice. No use, distribution or reproduction is permitted which does not comply with these terms.
*Correspondence: Xing Zhu, emh1eGluZzMzMEAxNjMuY29t