 Chiara Sbarbati
 Alessandro Lacchini
 Marco Petitta
- 1Department of Ecological and Biological Sciences, Tuscia University, Viterbo, Italy
- 2Department of Earth Sciences, Sapienza University of Rome, Rome, Italy
Critical Zone (CZ) science has developed in recent years, involving different disciplines that vary depending on the specific research focus. This multidisciplinary approach highlights the relevance of the Underground component of the Critical Zone (UCZ) in regulating the water cycle, which can influence the complex equilibrium of the whole CZ. In this study, we analyze evolution during the time of different parameters, characterizing the saturated and unsaturated parts of the UCZ of the Castelporziano Estate, a natural reserve located in a coastal area close to Rome. The purposes of these activities are to monitor the potential depletion of groundwater resources and understand the recharge mechanism processes characterizing the aquifer in the framework of occurring climate changes, net of anthropogenic pressure. The long-term analyses of water table variations carried out over the last 25 years, allowed us to preliminarily identify four different ranges of the slope coefficient of the water table, characterizing different areas of the Estate. Specifically, the Northern, Central, and Coastal areas have shown a general depletion trend in piezometric levels, while in the Eastern area, a positive trend has been recognized. Additional long-term analysis of piezometric level variations allowed us to confirm the presence of the four recharge areas and compare annual recharge and water table levels to assess the relationship between the saturated UCZ and meteoric recharge in the identified areas. To evaluate the role of the unsaturated UCZ in recharge mechanisms, the water content in the first meter of soil has also been analyzed, showing different responses of outcropping sediments in capturing rainfall during different periods of the year and under different rainfall input conditions, highlighting the pivotal role of rainfall for the Castelporziano UCZ, both for deep recharge of the water table and for feeding the forest roots. Stable isotopes confirm that Castelporziano UCZ feeding is strongly dependent on local meteoric recharge, also highlighting that evaporation processes are active in a limited way. The obtained results assess that the monitoring of UCZ has a crucial role in the correct preservation of more complex environmental systems, which include groundwater resources and the coastal Mediterranean forest.
Introduction
The study of Critical Zone requires a multidisciplinary approach involving ecology, soil science, geology, hydrogeology, and many other disciplines since Critical Zone represent the portion of Earth systems extending from the bottom of groundwater to the top of the canopy (National Research Council, 2001).
Looking at the underground component of Critical Zones (UCZs) and ruling out biological and chemical processes, the focus mainly shifts to soils and aquifer properties and their role in the water cycle. Indeed, soil has a fundamental function in filtering, storing, and buffering water resources (Banwart et al., 2013; Field et al., 2015). Soil moisture changes according to infiltration processes (from rain and snow melting) and the surplus rate with respect to field capacity move downward, reaching the water table and groundwater flow (Graham et al., 2010). In this view, in UCZ studies, the concept of soil has been enlarged from the traditional pedological view (Montanarella and Panagos, 2015) to the more complex view of hydropedology (Lin, 2010; Bouma, 2012).
The role of groundwater in UCZ science is difficult to assess. An earlier study on this topic defined the bottom part of the Critical Zone as the “base of active groundwater” (Anderson et al., 2008). Assuming that groundwater represents the saturated part of the UCZ system, the determination of its thickness is open to interpretation and, most of the time depends on the analyzed processes (Condon et al., 2020). In a study performed at the global scale, Xu and Liu (2017)did not consider the base of the aquifer as the bottom of the Critical Zone, but they defined this limit as the base of modern groundwater (less than 50 years old). The latter time limit is derived by combining geological, geochemical, and hydrological data following the methodology proposed by Gleeson et al., 2016. This study pointed out the importance of the UCZ, estimating that its thickness, from the ground surface down to the base of modern groundwater, is about four times more extended than the above-ground part. In particular, they found that about 63% of Critical Zone thickness is represented by the unsaturated zone (as a function of water table depth), while about 17% is represented by the saturated zone. The thickness of the UCZ is, therefore, extremely and intrinsically dependent on the depth of the groundwater table, which is a variable feature depending, in turn, on many controlling factors as well as the investigation scales. Fan et al. (2013) mapped the water table depth worldwide, highlighting that about a third of the land area is underlined by shallow groundwater usually detected at a relatively shallow depth of less than 5 m below the ground surface.
Water table depth regulates vertical fluxes in the unsaturated zone, influencing soil moisture and, consequently, plant uptake in the root-zone, becoming increasingly important during dry periods when the surface soil dries (Brooks et al., 2015). In addition, groundwater is commonly shallow enough to be reached by plant roots (Canadell et al., 1996; Schenk and Jackson 2002), which grow longer according to water table deepening (Stromberg et al., 1996; Naumburg et al., 2005).
Upward movement of groundwater toward the unsaturated zone and, consequently, soil moisture not only regulates vegetation equilibrium but also sustains evapotranspiration processes (Soylu et al., 2011; Miguez-Macho and Fan 2012; Brooks et al., 2015). This finding is particularly relevant in the framework of incoming climate changes, which strongly impact the different components of the water cycle, such as recharge (Cuthbert et al., 2019). The last IPCC report (IPCC 2021) foresees, for the Mediterranean area, a decrease in recharge due to both an increase in temperatures (with a consequent increase in evapotranspiration) and a change in precipitation distribution which becomes heavier, favoring runoff and flooding (Wang et al., 2015). The occurrence of these intense phenomena produces different responses in terms of recharge of the groundwater system (Taylor et al., 2013; Jasechko and Taylor 2015; Boas and Mallants 2022), depending on soil permeability.
Changes in recharge consequently lead to changes in the thickness of the UCZ, which remains a challenging parameter to estimate. Although UCZ thickness is the issue, all studies highlighted the pivotal role of groundwater, which regulates and is regulated by the different players and processes (both at short and long-time scales) involving the UCZ and, more generally, Critical Zone systems (Singha and Navarre-Sitchier, 2022).
In this study, we carried out a comprehensive assessment of the evolution during the time of different parameters, characterizing the saturated and unsaturated parts of the UCZ underlying the Castelporziano Presidential Estate. The Estate is a natural reserve located in a coastal area surrounded by the heavy and densely populated City of Rome (about three million inhabitants). The purpose of this multi-parameter analysis was to monitor the potential depletion of groundwater resources and to understand the recharge processes characterizing, in detail, the studied UCZ, which could influence the health of the Mediterranean forest hosted in the Estate. Other recent studies (Recanatesi et al., 2018; Recanatesi et al.,2020) have also pointed out a widespread decline in oak and, in general, tree health conditions.
For achieving these goals, the results of groundwater monitoring activities, carried out in the last 25 years, have been examined in terms of medium and long-term water table variations. The latter has been analyzed in relation to the climate parameter trend over time recorded by the weather station network of the Estate, with particular attention paid to water table changes in response to rainfall input. In this way, the relationship between meteoric recharge and the saturated part of the Castelporziano UCZ can be defined for different areas of the Estate.
In addition, to shed more light on the infiltration processes, which allow the deep recharge of the water table and the feed of forest roots, the water content at three different depths in the first meter of soil in two areas of the Estate has been analyzed. Therefore, the role of the unsaturated UCZ in capturing rainfall water during different periods of the year and under different rainfall input conditions has been assessed. Groundwater stable isotope fingerprint has been also determined to validate the recharge conceptual model of the Castelporziano UCZ. By this approach, a still lacking overall view of the Estate UCZ has been carried out as a useful tool to understand the processes governing the equilibrium of the entire Critical Zone. Moreover, the analyses of the parameters mentioned above in the framework of a nearly undisturbed natural system, where potential variations and impact on the UCZ are examined net of anthropogenic pressures, is the added value of this study, which can offer insights into a larger Mediterranean scale.
Materials and Methods
Site Description
The Castelporziano natural reserve covers an area of 59 km2 and mainly lies in a coastal plain that extends from a marine terrace area (elevation of 20–40 m a.s.l.) toward the shoreline.
Sediment outcroppings in the study area are mainly represented by Pleistocene–Holocene sand dune deposits, from the oldest to the more recent toward the shoreline, and are represented, respectively, by the Tenuta di Campo Selva Unit and Riserva della Macchia Unit and aeolian deposits belonging to the Tiber River Sintema (d, c, and b in Figure 1A). In a limited portion of the coastal area, silty-clay sediments have been detected, related to Tiber River delta evolution (Bellotti et al., 1989; Capelli et al., 2007; Servizio Geologico d’Italia, 2009).
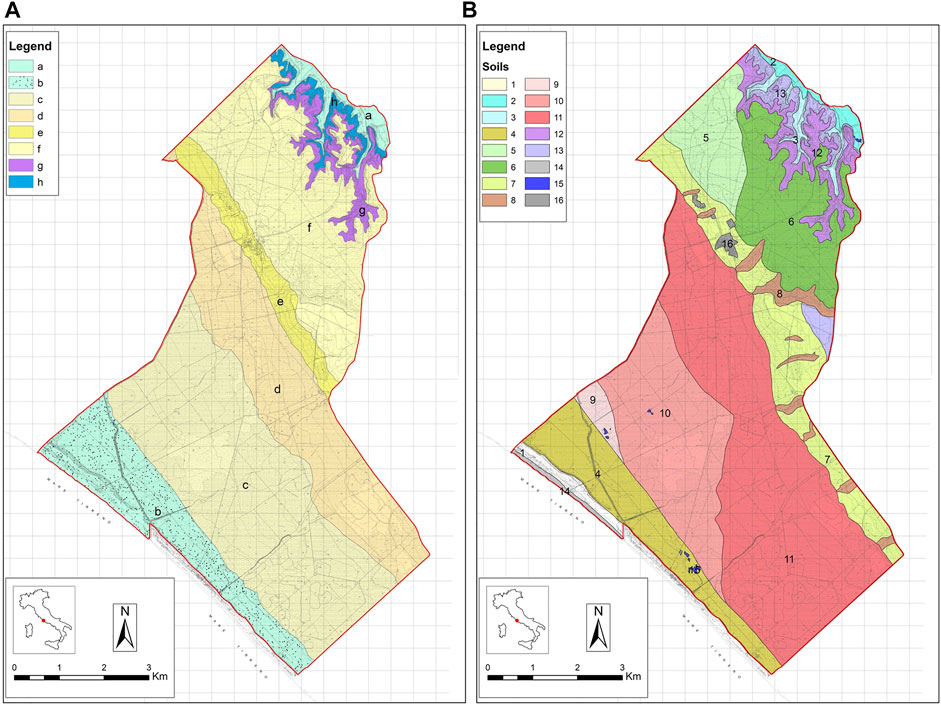
FIGURE 1. (A) Sediment outcropping in the study area: Holocene deposits of alluvial (a) or coastal (b) origin; Pleistocene sands (c–f), volcanic deposits of the Colli Albani Volcanic sequence (g); and transitional and continental deposits (h) (mod. from Servizio Geologico d’Italia, 2009). (B) Map of soil distribution: soil of actual sandy deposits (1); soils of alluvial deposits (2–3); soil of recent sandy deposits (4); soils of coastal terraced area (5–6); soils of terrace scarp (7–8); soils of coastal plain (9–11); soil of volcanic deposits (12); soil of deltaic deposits (13); and soils of mixed areas (14–16) (mod. from Biondi et al., 2001).
The coastal plain has the typical dunal undulate morphology, characterized by the presence of temporary or permanent pools and wetland areas featured by seasonal flooding activated by meteoric recharge (Fricano et al., 2001; Tinelli et al., 2012). Going inland, the coastal plain is followed by terraced areas where the sand and gravel deposits of the Aurelia Formation outcrop (e in Figure 1A).
The northern area of the Estate is represented by a mild plateau (about 80 m.a.s.l.) largely composed of the Pleistocene sandy deposits of the Castelporziano Unit (f in Figure 1A) (Servizio Geologico d’Italia, 2009). Under the sandy Unit, at the northern border of the Estate in correspondence with the Malafede Ditch, volcanic deposits attributed to the Colli Albani Volcanic sequence outcrop (g in Figure 1A) are in contact with the heterometric deposits of Ponte Galeria Formation (h in Figure 1A) (Servizio Geologico d’Italia, 2009). The latter is in lateral continuity, toward the south-east, with the sandy deposits of the Monte Mario Formation which underlie the dunal sediments in the coastal area of the Estate (La Vigna and Mazza, 2015). Holocene sediments attributable to the Tiber River Sintema have also been recognized in this northern area (a in Figure 1A).
Figure 1B shows the soil map of the Estate, which is mainly represented, according to Biondi et al. (2001), by Entisol, Inceptisol, and Alfisol types. Along the shoreline (4 in Figure 1B), the soil is generally thin and classifiable from somewhat poorly to excessively drained. Moving inland in the coastal plain (9, 10, and 11 in Figure 1B), soils are characterized by a higher thickness and a reduction in drainage classes which go from very poorly up to moderately well drained. Terraced area (7 and 8 in Figure 1B) hosts soils with a relatively high thickness, classifiable as moderately and well drained. In the northern area, soil thicknesses are high (5 and 6 in Figure 1B) with a very poor to moderately well drainage feature. In correspondence with the incision of the Malafede Ditch, different soil types have been recognized (2, 3, 12, and 13 in Figure 1B) with thicknesses ranging from thin to very high, but all are classifiable in moderate to well drained classes. Areas belonging to 1, 15, and 16 soils (Figure 1B) cover a limited portion of the Estate territory and are referred to as actual sandy soil or mixed areas (beach, surface water, or urbanized).
The land use of the Estate territory remained substantially steady over the last few decades, allowing an undisturbed growth of different kinds of vegetation which cover more than 90% of the area (Recanatesi, 2015). With time, a fragmentation of landscape and land use classes has been recorded by comparing aerial photographs of 1930 with those of 2010, mainly due to reforestation and road construction, the latter nowadays covering less than 1% of the entire territory. Despite the documented fragmentation, the management of the Estate guarantees its natural integrity up to the present day (Recanatesi, 2015).
The whole of the previously described geological units and formations hosts the main aquifer underlying the Estate, limited by a clay impermeable bedrock represented by the fine sediments of the Monte Mario Formation and the clays attributable to the Monte Vaticano Formation (La Vigna and Mazza, 2015). The thickness of the aquifer is variable depending on the depth of the clayed aquiclude top, being very thin in some areas of the Estate, while in the coastal sector, it reaches a thickness of more than 40 m. In the northern sector of the Estate, the Malafede Ditch partially separates the regional groundwater flow of the volcanic aquifer of Albani Hills from the Castelporziano aquifer. At the south-western border of the Estate, the top of the clay layer almost reaches the ground surface, representing a local no-flow limit.
The groundwater table elevations, referred to in autumn 2020, vary from a maximum value of 35 m a.s.l., reached in the eastern sector of the Estate to values of about 1 m a.s.l. close to the shoreline (Figure 2). The groundwater table shows a hydraulic gradient of 10‰ in the northern area upgradient to an isopiezometric contour line of 5 m a.s.l., while downgradient, toward the shoreline, the hydraulic gradient decreases to a value lower than 3‰, according to what has already been highlighted in previous studies (Bucci and Grillini, 2001; Banzato et al., 2013). This change is due to the difference in permeability values, which are higher in the coastal area and lower inland. Groundwater flow inside the Estate (light blue arrows in Figure 2) is mainly toward the coastline, the Tevere River, and the Malafede Ditch (Petitta et al., 2021). In addition, in the eastern area of the Estate where higher groundwater levels are recorded, an external contribution (blue arrows in Figure 2) from the volcanic aquifer of Colli Albani is identifiable (Capelli and Mazza, 2005; Banzato et al., 2013).
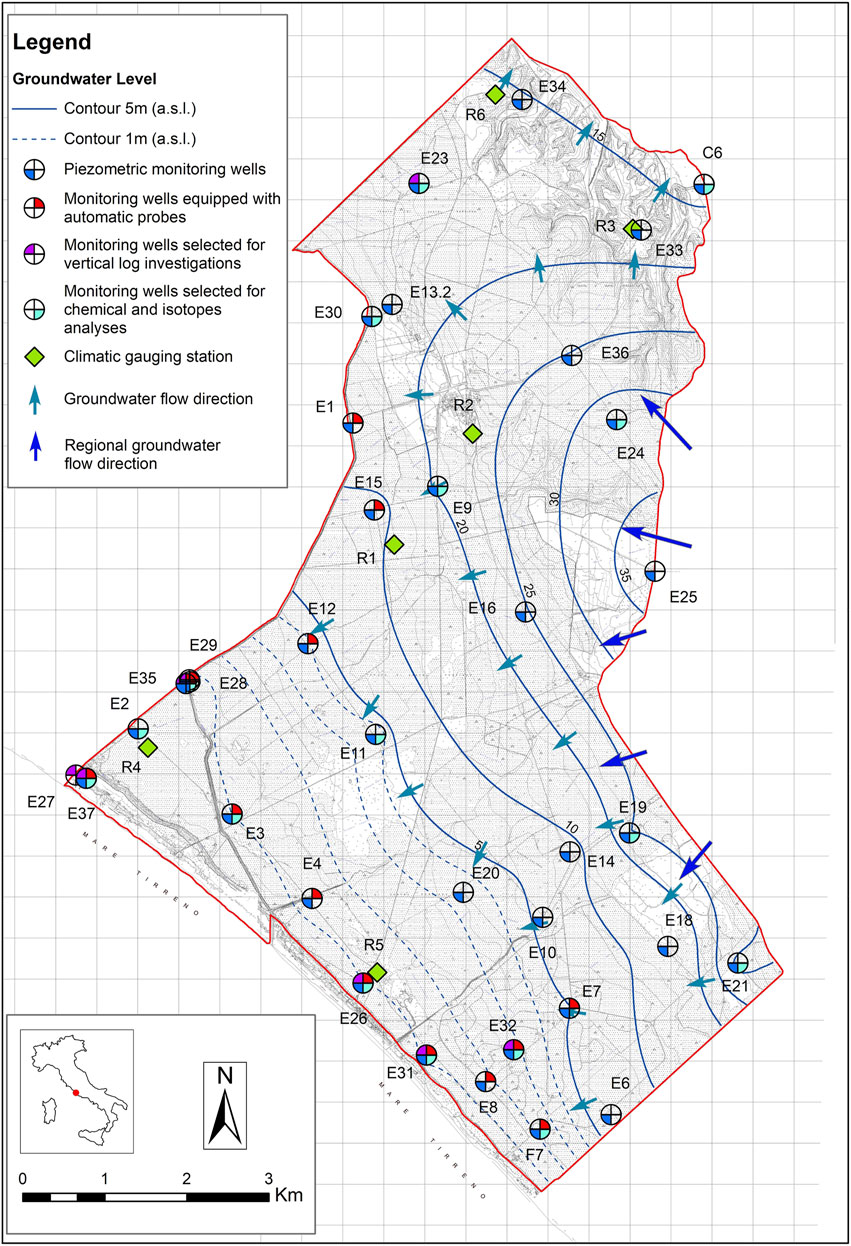
FIGURE 2. Location map of the groundwater monitoring network (E#) and climate gauging stations (R#); piezometric surface referred to in autumn 2020 (light blue lines) and main groundwater flow directions (light blue and blue arrows).
Groundwater Monitoring Network, Climate and Soil Moisture Gauging Stations, Data Acquisition and Analyses
The water table depth in the Castelporziano UCZ is monitored, as shown in Figure 2, by a network of 36 monitoring wells, 14 of which are equipped with automatic probes for the daily acquisition of water table levels, electrical conductivity, and temperature values. Manual measurements of the water table have been carried out on a monthly basis from 1995 to 2006 and on a quarterly basis from 2007 to date, to define the flow pattern and the main groundwater flow directions, and to monitor seasonal water table variations and water table trend on medium- and long-term scale.
To monitor the potential changes and trends over time of climate parameters, rainfall and temperature (P and T) data have been acquired through a network of 6 gauging stations (Figure 2) homogeneously distributed within the Estate and collected by the CREA Institute (Council for Agricultural Research and Agricultural Economics). In addition, hourly data of soil moisture measured at three different depths (10, 50, and 100 cm) have been acquired at R1 and R4 gauging stations, located, respectively, in the central and the coastal sectors of the Estate. Details about gauging station characteristics are listed in Table 1.
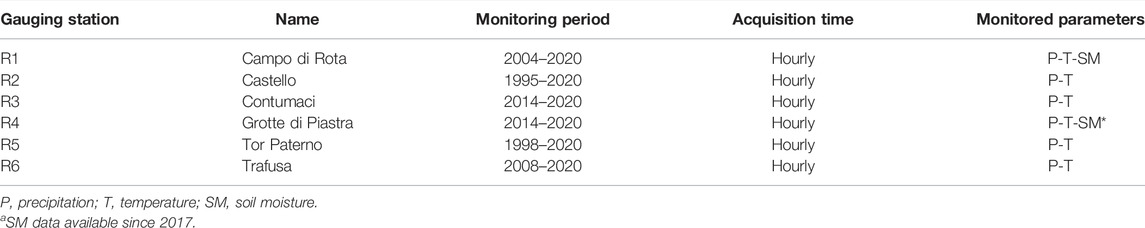
TABLE 1. Name, monitoring period, acquisition time, and monitored parameters of the Estate gauging stations from R1 to R6 (see Figure 1 for their location).
In order to fill the gaps in monitoring data and to obtain consistent representative climate parameter trends over time, daily, monthly, and annual average values of precipitation and temperature among the stations have been calculated. Then, the analyses of climate data have been performed using average values from a new benchmark station, named the Average Station. Cumulated annual rainfall data have been calculated over the hydrologic year, starting in September, considering autumn as the rainiest season in the Mediterranean area.
To correctly manage all collected data, a Database Management System (DBMS) has been developed in MsAccess to allow the systematic analysis of all the information related to a single point/station located inside the Estate. Data have been organized in tables related to each other by a pecking order which refers to an identification code specific for each observation point. The DBMS is continuously updated with different data, and it allows for managing and easily drawing the information required through specific queries.
The analyses of water table variation, over the last 25 years, has been carried out by analyzing the piezometric trend of the 22 monitoring wells of the Estate monitoring network, having an almost complete dataset from 1995 to 2020. Specifically, for each monitoring point, the mean annual water table elevation has been calculated to obtain the trend over time. For each pattern, the slope of the trend line (negative or positive) has been extrapolated, and a slope distribution map has been carried out using an iterative finite difference interpolation technique in ArcGis 10.8 environment (ESRI), based on the ANUDEM (Australian National University’s Digital Elevation Model) program developed and integrated by Hutchinson et al. (2011).
A detailed analysis of the relationship between water table variations and rainfall regime has been also carried out, coupled with soil moisture profile examination, to deeply investigate and understand the recharge mechanisms characterizing both the saturated and the unsaturated components of the Castelporziano UCZ.
In addition, to assess the net infiltration that feeds the Castelporziano aquifer, estimations of monthly and annual evapotranspiration have been calculated by applying the Thornthwaite and Mather (1957) method, referring to data of the Average Station. Using this method, the role of the unsaturated UCZ in influencing evapotranspiration has also been considered. Due to missing detailed information about the available water capacity (AWC) of the soil, it has been considered uniform and equal to 100 mm, as reported in a previous study (Biondi et al., 2001). The contribution of runoff was considered negligible at the study site due to the mainly flat morphology of the Estate, the nature of outcropping sediments, and the extension of the canopy cover (Petitta et al., 2021).
Groundwater Isotope Investigations
To refine the recharge conceptual model of the Estate and to highlight possible seasonal variations, four stable isotope sampling surveys have been carried out in 2020–2021, specifically in May, August, and November 2020 and in February 2021.
The samples have been collected from 16 monitoring wells (see Figure 2) and stored in cool boxes at 4°C. Isotopic composition has been expressed in part per mil accordingly to the usual δ notation, with respect to the V-SMOW (Vienna standard Mean Oceanic Water). Analysis has been performed in the Isotopes Laboratory of the University of Parma and the IT2E Laboratory in Milan using a mass spectrometer equilibrated at 25°C as described by Epstein and Mayeda (1953) for the determination of oxygen isotope composition, while hydrogen measurements have been carried out by reducing the water sample to hydrogen by passage over hot zinc at about 520°C according to the procedure described by Coleman et al. (1982). The analytical accuracy is ± 0.1‰ both for 18O and 2H.
Results
Figure 3 shows the results of the 25-year water table variation analyses for four monitoring wells, selected from different areas of the Estate (black circles in Figure 4), by using the mean annual value of the water table in each monitoring well and calculating the consequent trend expressed by equation lines shown in Figure 3. In the coastal area, the monitoring well E8 (Figure 3A) shows a decreasing trend, characterized by oscillations, with the highest water level recorded in 1998 (2.71 m a.s.l.) and the lowest in 2017 (1.67 m a.s.l.). Monitoring well E11 water levels (Figure 3B), situated in the central area of the Estate, show a sharp and continuous decreasing trend in water levels, reaching the maximum (4.75 m a.s.l.) and the minimum (3.12 m a.s.l.) values, respectively, in 1998 and 2017. Water table levels in E13.2 (Figure 3C), located in the northern sector, show significant oscillations with time (higher than 1 m), following a slight decreasing trend. The minimum value of 17.63 m a.s.l. has been measured in 2003, while the maximum value of 18.85 m a.s.l. has been reached in 1998. An increasing trend has been instead recorded in the eastern sector in monitoring well E19 (Figure 3D); here, the maximum water level of 25.53 m a.s.l. has been measured in 2016, while the minimum value of 24.24 m a.s.l. has been detected in 2004.
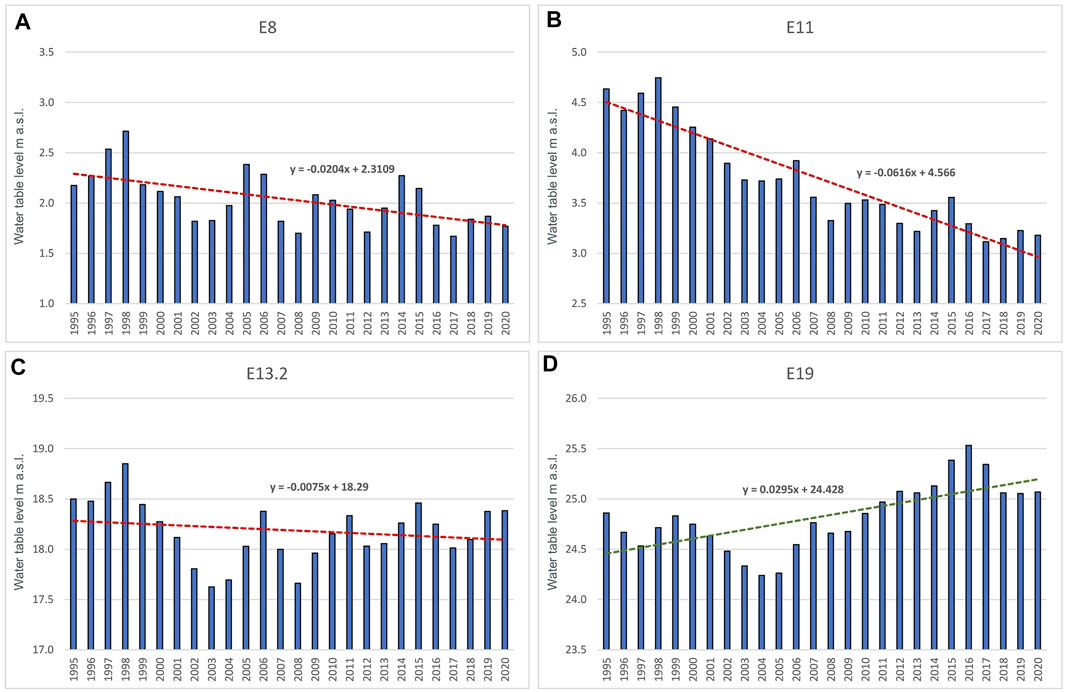
FIGURE 3. Mean annual water table level trend over time of monitoring wells (see Figure 1 for their location) with related equations: E8 [coastal area, (A)], E11 [central area, (B)], E13.2 [northern area, (C)], and E19 [eastern area, (D)].
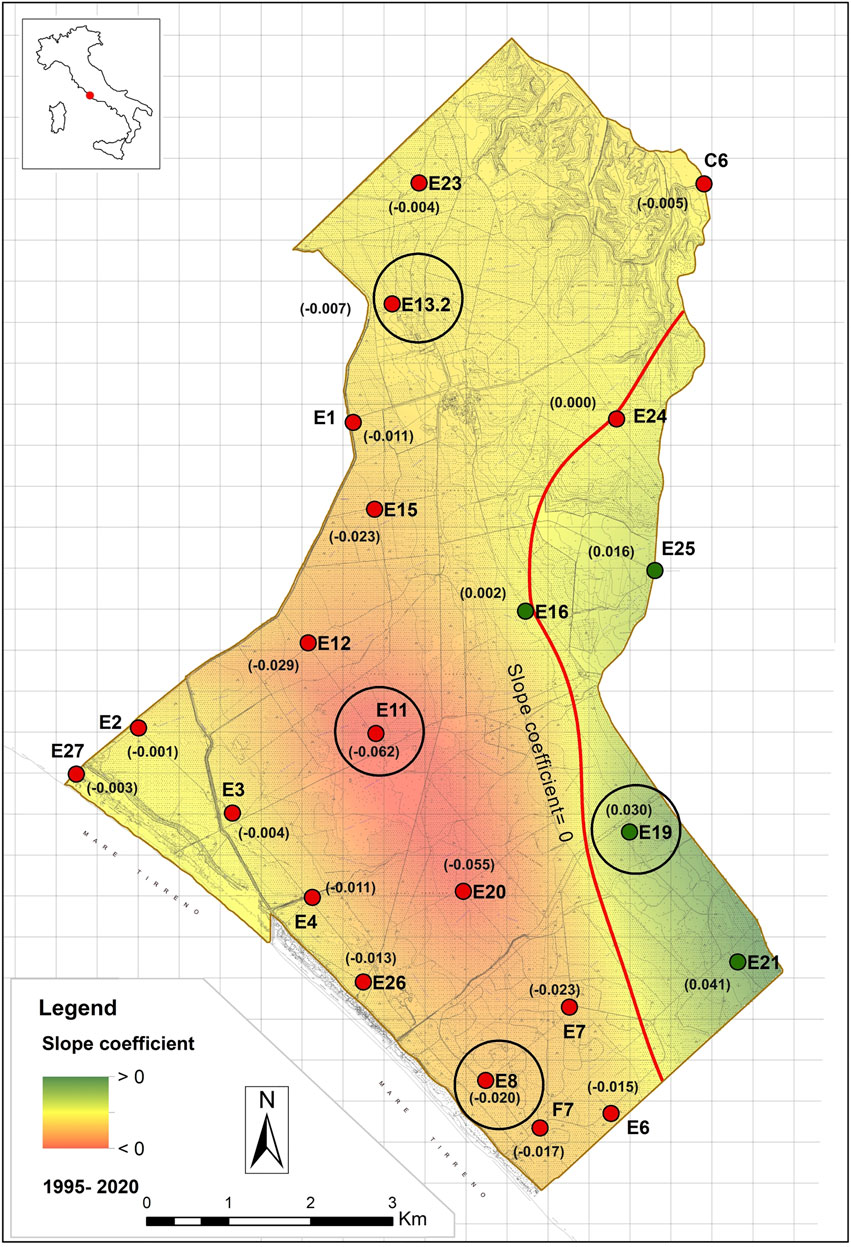
FIGURE 4. Distribution map of the slope coefficient of the water level trends calculated for the 1995–2020 monitoring period in 22 monitoring wells. Values in brackets represent the slope coefficient calculated for each monitoring well. Black circles identify the location of representative monitoring wells shown in Figure 3.
By selecting 22 monitoring wells and having a complete data record of the last 25 years, an analysis of the water table trend has been performed as shown in Figure 4. The slope coefficient of the trend related to each considered monitoring well (see equations in Figure 3) has been considered for building the distribution map in Figure 4. In this way, the water table trend of the entire Estate has been obtained. The map in Figure 4 clearly shows a general decreasing piezometric trend in almost all investigated areas, except the eastern border. The depletion trend is particularly pronounced in the inland area where monitoring wells E11, E12, and E20 are located with slope coefficient values ranging from −0.062 to −0.011, except for monitoring well E16, which shows a value close to zero. Both toward the shoreline and the northern zone of the Estate, slope coefficient values of the water table trend are mild, still maintaining negative trends over time. In fact, in the coastal area, values vary from −0.020 to −0.003 (not considering E2), while in the northern sector, slope coefficients range between −0.007 and −0.004, excluding E24, which falls on the zero isoline (zero slope coefficient). The eastern area is, on the contrary, characterized by positive slope coefficient values testifying to an increasing trend over time of water table levels, with the highest values recorded in E19 and E21. In this area, slope coefficient values range from a minimum of 0.016 to a maximum of 0.041. Differences highlighted by the obtained ranges of slope coefficient values suggest that the saturated part of the UCZ is characterized by different evolution trends of water table levels in different areas of the Estate, over the last 25 years.
Considering that the recharge of the aquifer of the Castelporziano Estate is strictly dependent on local meteoric recharge (Bucci, 2006; Mastrorillo and Petitta, 2010; Banzato et al., 2019), an additional long-term analysis on water table variation based on the available piezometric dataset has been carried out to highlight the seasonal response of the aquifer in the four identified areas.
Results show that the UCZ in the coastal area of the Estate, where well E8 has been selected as representative, is characterized by significative and impulsive fluctuations of water table levels (Figure 5A), linked to seasonal climatic variations, which are wider during years with conspicuous rainfall, such as 1997–1998 and 2013–2014, when maximum water levels were reached. Conversely, limited changes result during drought periods such as 2002–2003, 2007–2008, and 2016–2017, when the lowest water levels have been recorded. Net of seasonal and pluriannual variations, a slightly decreasing trend over the long monitoring period has been confirmed, although less pronounced with respect to the upgradient area of the Estate.
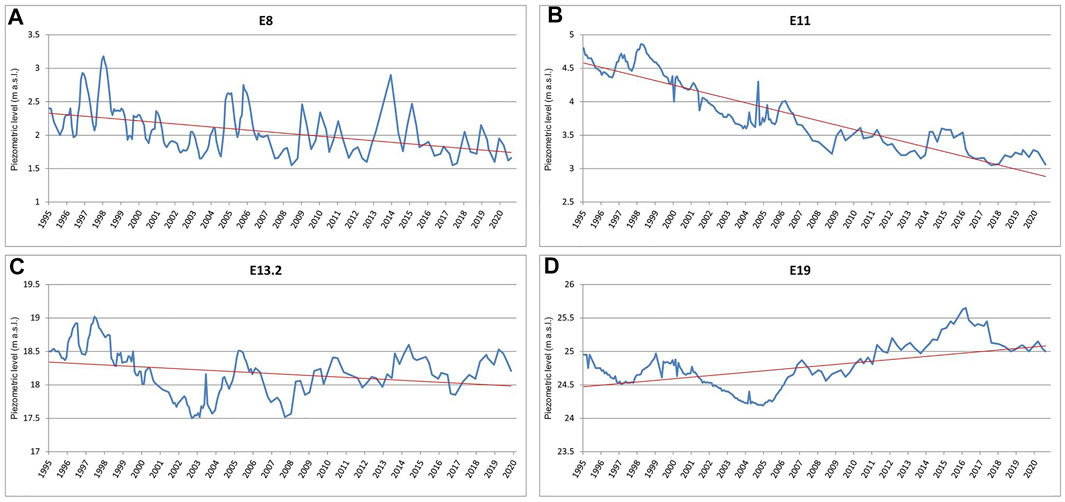
FIGURE 5. Piezometric trend over time of four representative monitoring wells: E8 [coastal area, (A)], E11 [central area, (B)], E13.2 [northern area, (C)], and E19 [eastern area, (D)].
In the central area of the Estate, the thickness of the unsaturated zone increases, and the seasonal variations in water table levels are attenuated, as shown in Figure 5B for E11, representative of this area. The succession of the recharge and drought periods mentioned above is otherwise reflected in water table variations, which follow a decreasing trend over time. Anyway, net of annual variations, a less pronounced decreasing trend has been identifiable since 2008.
In E13.2 (Figure 5C), representative of the northern sector of the Estate, wide water level variations in response to multiannual recharge and exhaustion phases have been detected. A slight depletion trend over the last 25 years has been assessed, but a reversal trend recorded since 2008, suggesting that the aquifer in this sector is also fed by a contribution from the eastern area of the Estate.
In the eastern area, the influence of seasonal and multiannual variations of recharge input on water table levels is also identifiable, but differently in the other areas of the Estate, the long-term analyses reveal an increasing trend in water table levels (E19, Figure 5D), probably due to the groundwater contribution from the Colli Albani aquifer. As for the central and the northern sector, two different trends are recognized, the first one characterized by a decrease in the water level from 1995 to 2005, followed by a second increasing phase that continues up to the end of the monitoring period.
These pieces of evidence, coupled with the findings pointed out from the slope coefficient analyses in terms of the degree of decrease or increase in water table levels, allow us to clearly distinguish four distinct “recharge areas,” characterized by homogeneous behavior in piezometric variations in response to recharge input, both at seasonal and long-term scales. Specifically, in the Central and the Coastal areas, the piezometric variations are mainly linked to local meteoric recharge, showing, respectively, a sharp and a mild decreasing trend of water table levels. In the Eastern area, oscillations are also influenced by an external contribution from the regional volcanic aquifer additionally proven by the positive slope coefficients calculated for this area. In the Northern area, multiannual variations linked to the rainfall regime have been identified, also supported by a lateral groundwater input from the eastern sector, as highlighted by the mildest calculated decreasing trend. The location of the four areas, including different numbers of monitoring wells, is resumed in Figure 6.
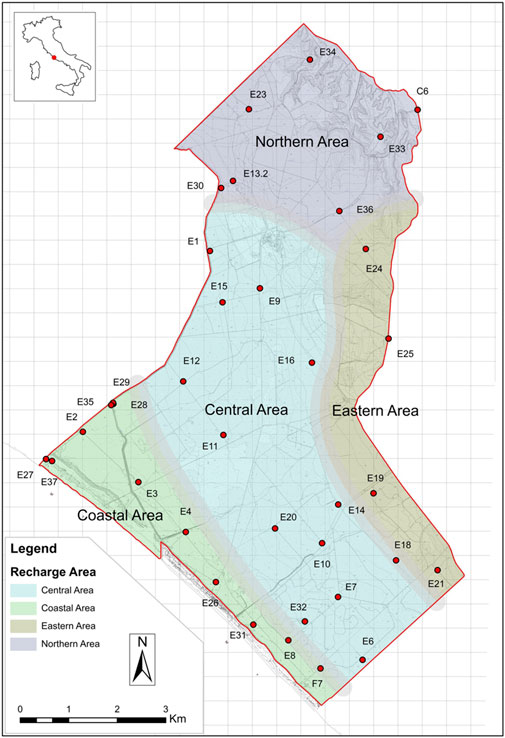
FIGURE 6. Location map of the four identified recharge areas.
Accumulated annual rainfall data for the Average Station, calculated over the hydrologic year (Figure 7), showed significant fluctuation over time, with values ranging between 573 and 1,090 mm/y, recorded, respectively, during 2007 and 1998 and an average value over the entire monitoring period of 782 mm/y.

FIGURE 7. Cumulated annual rainfall R (mm/y), net infiltration NI (mm/y), and average annual temperature T (°C) calculated for the Average Station in the 1995–2020 monitoring period.
Mean annual temperature values have been characterized by an increasing trend over the last 25 years, with an average temperature of 15.4°C, a minimum annual value of 14.2°C recorded in 1995, and a maximum annual value of 16.2°C measured in 2018.
Annual effective infiltration values calculated net of real evapotranspiration are characterized by strong variability, with the lowest value of 104 mm/y and the highest of 641 mm/y obtained, respectively, for 2007 and 1998. The average calculated value is 311 mm/y. Net infiltration calculated for 2002 has to be considered anomalous due to missing information on rain amount in February.
Groundwater isotope data collected in 16 monitoring wells generally fall between the Central Italy Meteoric Water line (C-IMWL) formulated by Longinelli and Selmo (2003) and the Latium region Meteoric Water Line (L-MWL) described in Bono et al., 2005, confirming the direct dependence of the aquifer on local meteoric recharge (Figure 8).
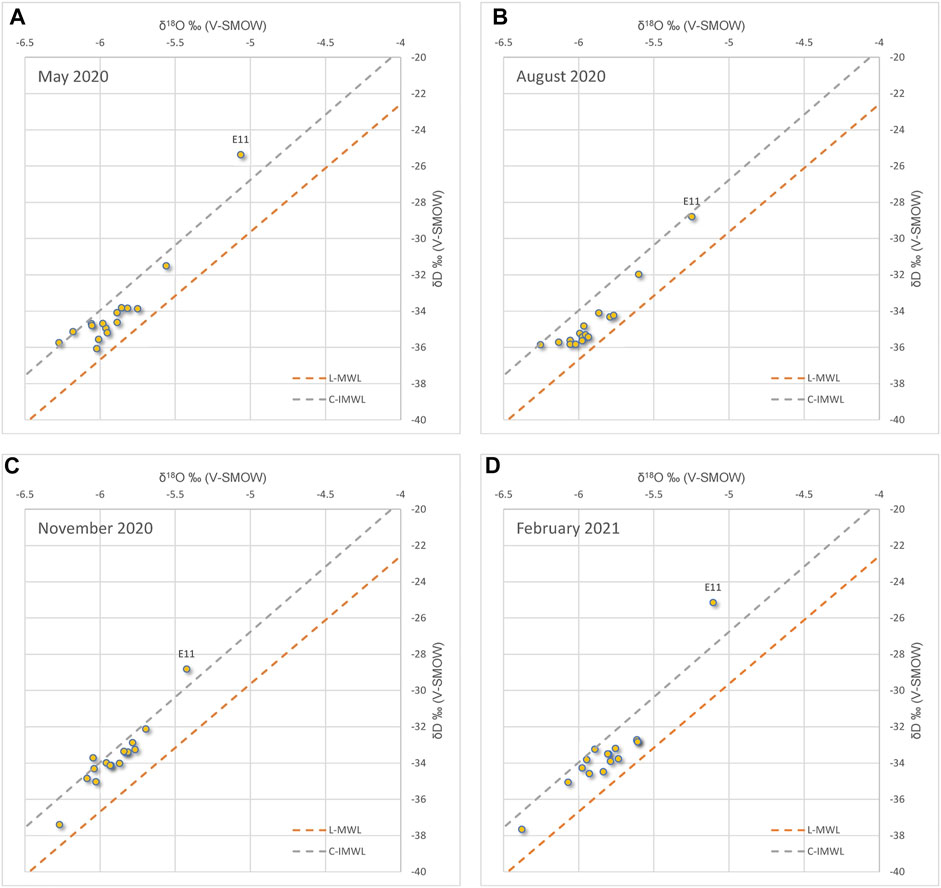
FIGURE 8. δ18O-δD plot of May 2020 (A), August 2020 (B), November 2020 (C), February 2021 (dD) sampling surveys. L-MWL represents the Latium region Meteoric Water Line (orange dashed line, Bono et al., 2005); C-IMWL represents the Central Italy Meteoric Water Line (gray dashed line, Longinelli and Selmo, 2003).
Data for the four sampling surveys show a limited variability both in δ18O and δD values. Specifically, δ18O values are included in the range from −6.5‰ to −5.5‰, while δD ranges between −38.0‰ and −31.5‰ with an average standard deviation value of ± 0.2‰ for δ18O and ±2.2‰ for δD, suggesting the lack of influence of seasonal variability on UCZ feeding in terms of rainfall isotope signature and, consequently, origin. To further validate this hypothesis, deuterium excess (d-excess) has been calculated using the Dansgaard (1964) equation. Obtained values again show a limited variability of d-excess with the lowest value of 12.7‰ reached in the August 2020 sampling survey, and the maximum value of 13.5‰ obtained in the November 2020 survey. The average d-excess value of 13.1‰ is perfectly in line with values recorded for Central Italy (Giustini et al., 2016), highlighting the influence of clouds and rains originating from the Atlantic Ocean (Craig, 1996). During all sampling surveys, the outlier values are measured in E11, which shows the most enriched isotope signal.
Discussion
The spatial slope coefficient distribution, coupled with the long-term analyses of piezometric levels, allowed us to identify four main recharge areas inside the UCZ of the Estate characterized by similar variation trends in terms of depletion or rise (see Figure 4) and similar behavior in response to recharge input (see Figure 5).
Despite the differences observed among the four areas by the analyses of the piezometric trend over time, a common feature is the clear influence on seasonal and multiannual scales of recharge input on water table variations in the Castelporziano UCZ. The different responses of the aquifer are certainly linked to rainfall fluctuation but also to their position inside the Estate and to the thickness of the unsaturated zone, which greatly increases from the coastal area toward the northern sector from 2–3 m to more than 40 m.
Consequently, to shed more light on the recharge mechanisms characterizing the Estate and to explain the different trends of water table levels detected during the time in the four recharge areas, a comparison between cumulated annual rainfall amount calculated over hydrologic years and mean annual piezometric values has been carried out.
The mean rainfall value of 782 mm/y measured in the Average Station is comparable to the value of about 728 mm/y recorded along the Latium coast from 1951 to 2009 (Bramati et al., 2014) and to the value of 794 mm/y measured in the urban area of Rome from 1984 to 2014 (Conte et al., 2014), not showing any decreasing trends over the last 25 years that can explain the recorded depletion of the water table. Nevertheless, it is possible to observe that in the second half of the monitoring period (2008–2020), annual rainfall values are generally higher than in the first half (1995–2007) showing, respectively, mean values of 802 and 757 mm/y.
From the comparison between rainfall and water table variations in monitoring well E8 (Figure 9A), representative of the Coastal area, an immediate response to different rainfall input reflects on piezometric levels. Annual groundwater variations strictly follow annual rainfall fluctuations, and this is due to the relatively high permeability characterizing the aquifer sediments in this area and the limited thickness of the unsaturated zone. The relatively lower amount of rainfall recorded in the first half of the monitoring period affects the piezometric trend, which gradually decreases up to 2008, followed by a mild and incomplete recovery phase supported by the relative increase of rainfall values.
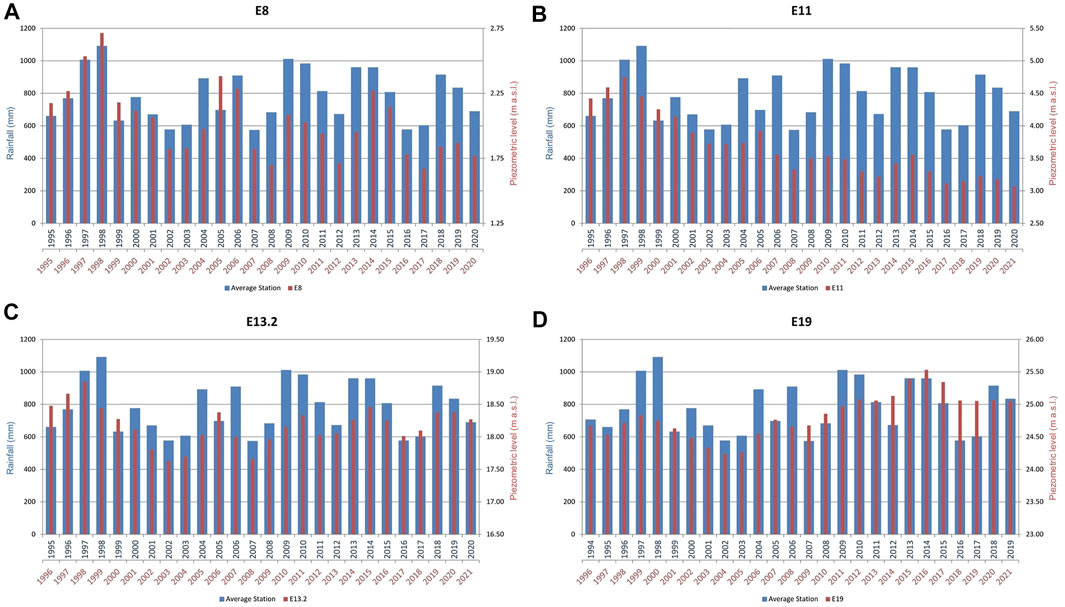
FIGURE 9. Comparison between cumulated annual rainfall values (blue value in the x-axis) and mean annual piezometric levels (red value in the x-axis) in four representative monitoring wells: E8 [coastal area, (A)], E11 [central area, (B)], E13.2 [northern area, (C)], and E19 [eastern area, (D)].
In the Central area, the piezometric level in the E11 monitoring well (Figure 9B), due to the increase in the thickness of the unsaturated zone and the presence of dense vegetation, shows a delayed response to precipitation input; indeed, variation in rainfall amount (blue value in the x-axis) is recorded the following year in the water table level (red value in the x-axis). By applying this shift, oscillations in both parameters follow the same pattern. The water table levels, while following annual rainfall variations, sharply decrease in the first half of the monitoring period; the relative increase in mean annual rainfall values recorded after 2008 was not sufficient to overcome the water table lowering, allowing only mitigation of the groundwater decrease.
In the Northern sector of the Estate, where the unsaturated zone reaches its maximum thickness, a similar one-year delayed response on water table level with respect to rainfall variations has been recorded, as highlighted in Figure 9C for monitoring well E13.2. In this area, after a first slight depletion phase recorded up to 2008, the double effect due to the increase in mean rainfall amount coupled with the contribution flowing from the Eastern area of the Estate, allowed a trend inversion in water table levels, which increase up to values comparable to those observed at the beginning of the monitoring period (1995).
The comparison between annual rainfall variations and water table response in monitoring well E19, representative of the Eastern area, highlights that a shift of 2 years is needed to appreciate rainfall recharge input on piezometric levels. Despite the increasing water table trend recorded over the entire monitoring period, a temporary depletion phase ending in 2005 has been detected. Since 2006 (refer to the red value in the x-axis in Figure 9D) a continuous increasing trend in water table levels confirms the clear influence of external input from the Colli Albani volcanic aquifer on the groundwater flow in this area, in addition to local meteoric recharge contribution.
This analysis enabled us to identify two sub-periods characterized by different rainfall contributions that lead to different responses of water table trends, at the Estate scale, as shown in Figures 10A,B. Specifically, the water table slope coefficient map related to 1995–2007 (Figure 10A), shows a decreasing trend on the entire UCZ of the Estate, where the most impacted areas are the Central and the Northern areas, while the Coastal and the Eastern sectors result in a relatively mitigated depletion. The sole exception is represented by the E21 monitoring well, located along the eastern border of the Estate, showing a modest increasing trend. The rainfall data (Figure 7) for this period suggest that the net decrease in piezometric levels is probably linked to the occurrence of drought in consecutive years as they happened from 1999 to 2003, in which cumulated rainfall amount was, on average, 24% lower than the mean value calculated during the 1995–2007 sub-period.
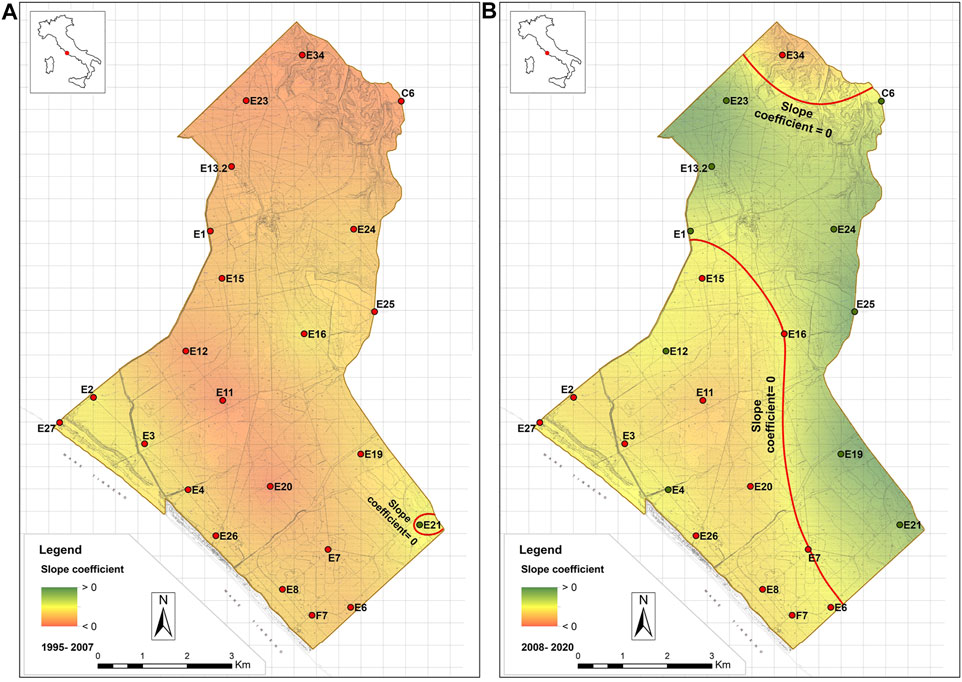
FIGURE 10. Slope coefficient distribution maps of water level trend calculated for the 1995–2007 monitoring period (A) and 2008–2020 (B).
The water table slope coefficient map related to 2008–2020 (Figure 10B) highlights that the relative increase in rainfall recorded in this period was not sufficient to recover previous groundwater depletion in the central and coastal areas despite these sectors being almost exclusively fed by local meteoric recharge; on the contrary, for the eastern and northern sectors, a general recovery of the piezometric levels is supported, respectively, by the regional groundwater flow (Banzato et al., 2013) and from contribution from the eastern area.
Considering the pivotal role of rainfall in regulating the equilibrium of the UCZ of the Castelporziano Estate, an analysis of the distribution of intense rainfall events over time also focusing on their effect on both saturated and unsaturated zones has been performed.
In the context of climate change, recent literature poses questions relating to how rainfall “intensity” plays different roles due to local factors (i.e., land cover, outcropping sediments, and topography). Studies performed in tropical areas (Taylor et al., 2013; Jasechko and Taylor, 2015) and arid or semi-arid environments (Cuthberth et al., 2019; Boas and Mallants 2022), characterized by relatively high soil permeability, have underlined the resilience of the groundwater system in adapting to different recharge input and assessed that extreme rainfall events generally favor the recharge of aquifers by different infiltration mechanisms, whereas there are still considerable uncertainties about the role of heavy rain in less permeable soils.
Figure 11 shows the box plot distribution of daily rainfall, considering only values greater than or equal to 1 mm, related to the Average Station for the two analyzed subperiods.

FIGURE 11. Box and Whisker plot distribution of daily rainfall events calculated for the 1995–2007 subperiod (yellow box) and 2008–2020 subperiod (purple box).
The comparison between the two distributions has clearly shown the increase in rainfall amount during the period 2008–2020 (purple box), not only in the annual average value as previously discussed but also in the mean daily amount, which increased from 7.8 mm/d to 9.4 mm/d with an increase in the intensity of +17%. In addition, out of a total of 2,298 rainy days recorded from 1995 to 2020, 1,196 occurred in the first subperiod, while 1,102 occurred in the second one with a decrease of −8%. Besides these outcomes, an increase in events characterized by heavier intensity has been recorded in 2008–2020. During the first subperiod, the maximum recorded intensity reached a value of 62 mm/d, while in the second, the maximum value was 108 mm/d.
Considering a rainfall threshold value of 30 mm/d, which represents the 95th percentile of the 2008–2020 dataset, the number of rainy days above this rainfall value was 39 for the 1995–2007 subperiod and 53 days for the following subperiod.
The effect of rainy events of different intensities on the UCZ (saturated and unsaturated zones) has been evaluated by analyzing the soil moisture content recorded at three different depths (10, 50, and 100 cm) at the R1 and R4 stations located, respectively, in the central and in the coastal area of the Estate (see Figure 2).
The response of soil water contents and water table levels in the Central sector to heavy rain is well depicted in Figure 12. During the rainy season (Figure 12A), the occurrence of an intense event (>80 mm) leads to an immediate increase in soil moisture at the two shallowest depths and only partially at the deepest level. The soil moisture measured at a depth of 100 cm reaches its maximum values only at the end of the rainy period for this observation window. This maximum saturation level (about 50%) remains steady for a relatively long time, starting to decrease after about 1 month. Soil moisture recorded at 10 and 50 cm is sensitive to single rainy events, independent of their intensities, with moisture values always lower than 30%.
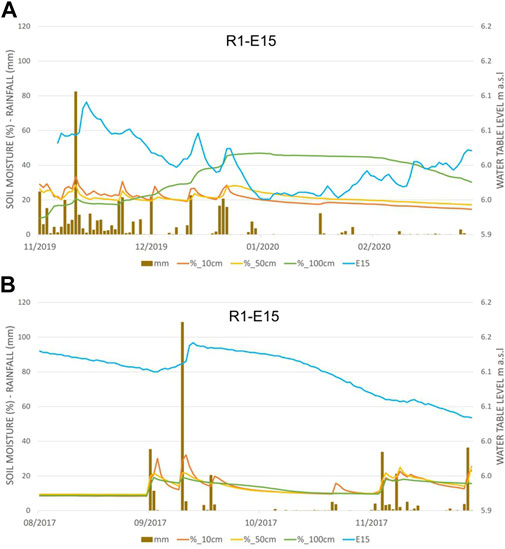
FIGURE 12. Comparison of rainfall daily data, soil moisture percentage at different depths measured in the R1-Campo di Rota gauging station, and water table level in the E15 monitoring well, for the November heavy event (A) and the September heavy event (B).
A quick peak on the E15 monitoring well water level was recorded after the intense event, as expected, with a few days of delay with respect to soil moisture. The water table level, net of some fluctuations due to rainfall input, follows a decreasing trend up to the end of continuous rainy days. As for the deepest soil moisture profile, the piezometric level remains almost steady, starting its rise in correspondence to the decrease in soil water content at 100 cm.
Figure 12B shows the response of soil and water levels to a very intense rainy event (>100 mm), occurring at the end of the summer season in soil drought conditions and during the aquifer exhaustion phase. In this case, the isolated heavy event reflects on soil moisture with a fast peak, having a considerable intensity at a depth of only 10 cm, while depths of 50 and 100 cm are less affected. The water table level in E15, as in the previous case, rises after a few days from the occurrence of the event, followed by a slow and continuous decreasing phase.
The comparison of the effects of these two different episodes on the UCZ in the Central area of the Estate, characterized by a thick canopy cover and relatively low soil permeability (Biondi et al., 2001), the latter proved also by the presence of pools and wetland areas (Tinelli et al., 2012), was useful to clarify recharge mechanisms in this suffering area of the Estate. The analyses suggest that a continuous succession of rainy days, even of low intensity, are needed to allow deep soil saturation, enabling the recharge of the water table and feeding the forest roots, while the occurrence of heavy events during the drought season does not lead to water storage in soil.
The analyses of the same intense events have also been performed in the Coastal area (Figure 13) characterized by relatively high permeability of the soil and by the presence of Mediterranean scrub cover (Recanatesi, 2015). The occurrence of heavy rain during the recharge season causes an immediate rise of soil moisture recorded at depths of 50 and 100 cm, up to values of about 30% (Figure 13A), which remain relatively high until the end of December, thanks also to the almost continuous rainy days. Water content measured at a depth of 10 cm does not show the effect of this event, certainly due to the high permeability of soil which favors fast infiltration processes. The occurrence of immediate infiltration is proved by the rise of the water table level recorded in the E31 monitoring well, which shows a continuous increase after the event, typical of the recharge season.
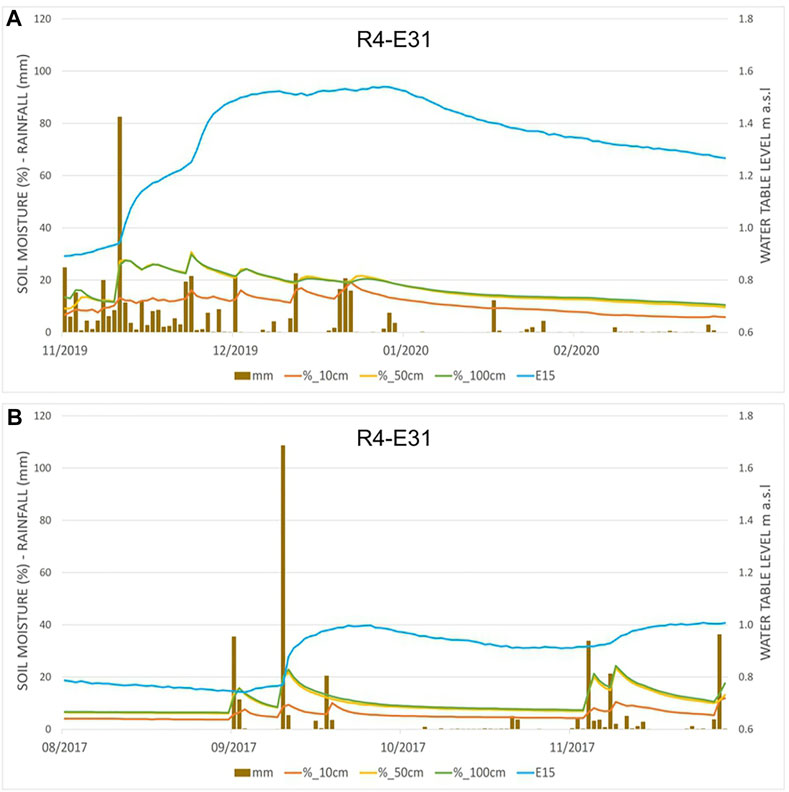
FIGURE 13. Comparison of rainfall daily data, soil moisture percentage at different depths measured in the R4-Grotte di Piastra gauging station, and water table level in the E31 monitoring well for the November heavy event (A) and the September heavy event (B).
An immediate response is also recorded due to the occurrence of intense rain events during the drought season (Figure 13B). The deeper levels of soil rapidly increase the relative water content, followed, in this case, by a decrease due to the limited contribution of rainfall input in the next days, while the shallower level, due to the high permeability of the soil, does not show significant soil moisture increase. Conversely, the piezometric level measured in E31, instead, quickly reacts to the input of heavy rainfall with a significant increase in the water table, which remains nearly steady for a relatively long time, suggesting that the intense events can feed the aquifer in this area of the Estate.
Analysis of rain distribution over time is a key parameter, especially in areas characterized by thick vegetation cover and low permeable soils, such as the central area of the Castelporziano Estate. In this sector, soil acts as a water reservoir available both for forest feeding and aquifer recharge, but considering the occurring increase in temperature, which favors evapotranspiration processes and probably increases the water demand of forests, the occurrence of poorly distributed rainfall could lead to a progressive depletion of groundwater resources by water table lowering.
The recharge mechanism occurring in the Central area is also validated by the enriched values recorded in each sampling survey for E11 (Figure 8), which confirm that this area is characterized by slow infiltration processes. The relative low soil permeability (Biondi et al., 2001) and presence of temporary or permanent pools (Tinelli et al., 2012) suggest that before rainwater infiltrates the soil it can be affected by evaporation processes also favored by the increase in temperature values, which reflect on the detected enriched isotope signal. This insight points to the sensitivity of this area of the UCZ to the changes in climate parameters.
Conclusion
The results obtained from this study highlight the importance of a deep knowledge of the UCZ, especially in the framework of the occurring and incoming climate changes that could strongly affect the equilibrium of the whole Critical Zone.
The analyses of water table level data, regularly collected at monthly and seasonal scales during the last 25 years in the Castelporziano Estate, allowed us to obtain a local-scale effect on recharge mechanisms, identifying four areas characterized by different responses to recharge input variations and defining the long-term trends of piezometric levels.
A comparison of rainfall amounts and water table levels at the annual scale provides additional insights into the recharge mechanisms characterizing the four sectors, which indicate the strong dependence of piezometric variations on local meteoric recharge of the UCZ, in particular of the Central and the Coastal areas of the Estate, as they have seen a decrease in water table levels over the last 25 years. Two subperiods characterized by different rainfall amounts have been recognized, confirming the continuous decrease in water table levels in the Central and Coastal areas, despite a relative increase in average rainfall amount.
By analyzing the daily rain distribution, the second half of the monitoring period clearly shows an increase in the average daily rain amount coupled with an increase in heavy rain events, even though for the Mediterranean regions, the last IPCC report (2021) does not foresee a relevant increase in extreme precipitation events. The impact of intense rainy events has been evaluated both in terms of the response of soil moisture and water table variations in the two areas of the UCZ. The results reveal that intense rain in the Central area, characterized by low soil permeability and thick vegetation cover, enables water soil storage and, consequently, forest and aquifer feeding, only when it occurs during rainy periods, and that single events do not lead to benefits, especially during the drought season. Conversely, in the Coastal area, the high permeability of the soil and the different vegetation cover allowed intense rain to infiltrate through the unsaturated zone, reaching the water table both in rainy and drought periods.
Cross-analyses of precipitation and piezometric values are very useful in assessing the sensitivity of coastal Mediterranean aquifers and ecological habitats to changes and trends in climate parameters, with different effects at the local scale, attributable to the role of the UCZ (soil permeability and evaporation processes). Results of limited changes in climate parameters, for example, precipitation distribution and rain intensity, can affect the groundwater resources and the water table depletion to different extents and in different periods, with possible consequences on coastal forest health. Indeed, intense and multi-parameter monitoring of the three systems (climate parameters, soil moisture content, and water table trend) influencing the UCZ is highly recommended, if not necessary, to preserve the delicate equilibrium of coastal areas and their vegetation and ecological functions in a climate change context.
Data Availability Statement
The original contributions presented in the study are included in the article/Supplementary Material; further inquiries can be directed to the corresponding author.
Author Contributions
CS: conceptualization, formal analysis, writing original draft, investigation and revision; AL: conceptualization, formal analysis, data curation, visualization, investigation and revision; MP: conceptualization, formal analysis, supervision, funding acquisition and revision. All authors contribute to the research an approved the submitted version.
Funding
The research has been supported by the “Accademia Nazionale delle Scienze” and “Servizio Tenuta Presidenziale di Castelporziano,” in the framework of the project “Studio della falda e della zona non satura della Tenuta di Castelporziano.”
Conflict of Interest
The authors declare that the research was conducted in the absence of any commercial or financial relationships that could be construed as a potential conflict of interest.
Publisher’s Note
All claims expressed in this article are solely those of the authors and do not necessarily represent those of their affiliated organizations, or those of the publisher, the editors, and the reviewers. Any product that may be evaluated in this article, or claim that may be made by its manufacturer, is not guaranteed or endorsed by the publisher.
Acknowledgments
Authors would like to thank The CREA Institute in charge responsible for providing climate and soil moisture data, and the technicians of “Servizio Tenuta Presidenziale di Castelporziano” for their fruitful collaboration and support in field work activities. We greatly appreciated the useful comments provided by the reviewers, which significantly improved the manuscript
References
Anderson, S. P., Bales, R. C., and Duffy, C. J. (2008). Critical Zone Observatories: Building a Network to Advance Interdisciplinary Study of Earth Surface Processes. Mineral. Mag. 72 (1), 7–10. doi:10.1180/minmag.2008.072.1.7
Banwart, S. A., Chorover, J., Gaillardet, J., Sparks, D., White, T., Anderson, S., et al. (2013). Sustaining Earth’s Critical Zone Basic Science and Interdisciplinary Solutions for Global Challenges. United Kingdom: University of Sheffield, ISBN: 978-0-9576890-0-8.
Banzato, F., Barberio, M. D., Del Bon, A., Lacchini, A., Marinelli, V., Mastrorillo, L., et al. (2019). Relationship between Rainfall and Water Table in a Coastal Aquifer: the Case Study of Castelporziano Presidential Estate. AS-ITJGW 379, 27–33. doi:10.7343/as-2019-379
Banzato, F., Caschetto, M., Lacchini, A., Marinelli, V., Mastrorillo, L., and Sbarbati, C. (2013). Recharge and Groundwater Flow of the Coastal Aquifer of Castelporziano Presidential Estate (Rome, Italy). Rend. Online Soc. Geol. Ital. 24, 22–24.
Bellotti, P., Carboni, G., Milli, S., Tortora, P., and Valeri, P. (1989). La piana deltizia del fiume Tevere: analisi di facies e ipotesi evolutiva dall’ultimo low stand glaciale all’attuale. G. Geol. 3 (51/1), 71–91.
Biondi, F. A., Dowgiallo, G., Gisotti, G., Tinelli, A., Figliola, A., and Scarascia Mugnozza, G. (2001). “Memoria illustrativa della carta dei suoli della Tenuta di Castelporziano,” in Il Sistema Ambientale della Tenuta Presidenziale di Castelporziano. Ricerche sulla complessità di un ecosistema forestale costiero mediterraneo. Scritti e Documenti XXVI (Roma: Accademia Nazionale delle Scienze detta dei XL).
Boas, T., and Mallants, D. (2022). Episodic Extreme Rainfall Events Drive Groundwater Recharge in Arid Zone Environments of Central Australia. J. Hydrology Regional Stud. 40, 101005. doi:10.1016/j.ejrh.2022.101005
Bono, P., Gonfiantini, R., Alessio, M., Fiori, C., and D’Amelio, L. (2005). “Stable Isotopes (δ18O, δ2H) and Tritium in Precipitation: Results and Comparison with Groundwater Perched Aquifers of Central Italy IAEA,” in Isotopic Composition of Precipitation in the Mediterranean Basin in Relation to Air Circulation Patterns and Climate. Vienna: IAEA-TECDOC-1453, 115–124.
Bouma, J. (2012). Hydropedology as a Powerful Tool for Environmental Policy and Regulations: Toward Sustainable Land Use, Management and Planning. Hydropedology 15, 483–512. doi:10.1016/B978-0-12-386941-8.00015-0
Bramati, M. C., Tarragoni, C., Davoli, L., and Raffi, R. (2014). Extreme Rainfall in Coastal Metropolitan Areas of Central Italy: Rome and Pescara Case Studies. Geogr. Fis. Dinam. Quat. 37, 3–13. doi:10.4461/GFDQ.2014.37.1
Brooks, P. D., Chorover, J., Fan, Y., Godsey, S. E., Sarah, . E., McNamara, J. P., et al. (2015). Hydrological Partitioning in the Critical Zone: Recent Advances and Opportunities for Developing Transferable Understanding of Water Cycle Dynamics. Water Resour. Res. 51, 6973–6987. doi:10.1002/2015WR017039
Bucci, M., and Grillini, M. (2001). Studi geologici, geomorfologici ed idrogeologici nella Tenuta presidenziale di Castelporziano (Roma). Geol. Tecnica Ambientale 4, 21–32.
Bucci, M. (2006). “Stato Delle Risorse Idriche,” in Il sistema ambientale della Tenuta Presidenziale di Castelporziano. Ricerche sulla complessità di un ecosistema forestale costiero mediterraneo Vol. I. Scritti e Documenti XXXVII (Roma: Accademia Nazionale delle Scienze detta dei XL), 327–387.
Canadell, J., Jackson, R. B., Ehleringer, J. B., Mooney, H. A., Sala, O. E., and Schulze, E. D. (1996). Maximum Rooting Depth of Vegetation Types at the Global Scale. Oecologia 108 (4), 583–595. doi:10.1007/BF00329030
Capelli, G., and Mazza, R. (2005). “Individuazione dei bacini idrogeologici. Analisi della circolazione idrica sotterranea,” in Strumenti e strategie per la tutela e l’uso compatibile della risorsa idrica nel Lazio Bologna: Quaderni di tecniche di protezione ambientale Pitagora Editrice 78, 41–80.
Capelli, G., Mazza, R., and Papiccio, C. (2007). Intrusione salina nel delta del Fiume Tevere. Geologia, idrologia e idrogeologia del settore romano della piana costiera. G. Geol. Appl. 5, 13–28.
Coleman, M. L., Shepherd, T. J., Durham, J. J., Rouse, J. E., and Moore, G. R. (1982). Reduction of Water with Zinc for Hydrogen Isotope Analysis. Anal. Chem. 54, 993–995. doi:10.1021/ac00243a035
Condon, L. E., Markovich, K. H., Kelleher, C. A., McDonnell, J. J., Ferguson, G., and McIntosh, J. C. (2020). Where Is the Bottom of a Watershed? Water Resour. Res. 56 (3). doi:10.1029/2019WR026010
Conte, G., Del Bon, A., Gafà, R. M., Martarelli, L., and Monti, G. M. (2014). Meteo-climatic Analysis during the Period 1984 - 2014 in Rome Area (Central Italy). AS-ITJGW AS15071–045. doi:10.7343/AS-130-15-0157
Craig, H. (1961). Isotopic Variations in Meteoric Waters. Science 133, 1702–1703. doi:10.1126/science.133.3465.1702
Cuthbert, M. O., Gleeson, T., Moosdorf, N., Befus, K. M., Schneider, A., Hartmann, J., et al. (2019). Global Patterns and Dynamics of Climate-Groundwater Interactions. Nat. Clim. Change 9 (2), 137–141. doi:10.1038/s41558-018-0386-4
Dansgaard, W. (1964). Stable Isotopes in Precipitation. Tellu 16, 436–468. doi:10.1111/j.2153-3490.1964.tb00181.x
Epstein, S., and Mayeda, T. (1953). Variation of O18 Content of Waters from Natural Sources. Geochimica Cosmochimica Acta 4, 213–224. doi:10.1016/0016-7037(53)90051-9
Fan, Y., Li, H., and Miguez-Macho, G. (2013). Global Patterns of Groundwater Table Depth. Science 339 (6122), 940–943. doi:10.1126/science.1229881
Field, J. P., Breshears, D. D., Law, D. J., Villegas, J. C., López-Hoffman, L., Brooks, P. D., et al. (2015). Critical Zone Services: Expanding Context, Constraints, and Currency beyond Ecosystem Services. Vadose Zone J. 14 (1), vzj2014.10.0142. doi:10.2136/vzj2014.10.0142
Fricano, F., Neri, U., Scandella, P., Di Blasi, N., and Mecella, G. (2001). “Studio del sistema di alimentazione di invasi naturali in un particolare ambiente umido costiero mediterraneo,” in Il sistema ambientale della Tenuta Presidenziale di Castelporziano (Roma: Scritti e Documenti XXVI Accademia Nazionale delle Scienze), 99–109.I
Giustini, F., Brilli, M., and Patera, A. (2016). Mapping Oxygen Stable Isotopes of Precipitation in Italy. J. Hydrology Regional Stud. 8, 162–181. doi:10.1016/j.ejrh.2016.04.001
Gleeson, T., Befus, K. M., Jasechko, S., Luijendijk, E., and Cardenas, M. B. (2016). The Global Volume and Distribution of Modern Groundwater. Nat. Geosci. 9 (2), 161–167. doi:10.1038/ngeo2590
Graham, C. B., van Verseveld, W., Barnard, H. R., and McDonnell, J. J. (2010). Estimating the Deep Seepage Component of the Hillslope and Catchment Water Balance within a Measurement Uncertainty Framework. Hydrol. Process. 24 (25), 3631–3647. doi:10.1002/hyp.7788
Hutchinson, M. F., Xu, T., and Stein, J. A. (2011). Recent Progress in the ANUDEM Elevation Gridding Procedure. Geomorphometry, 19–22.
Intergovernmental Panel on Climate Change (2021). Climate Change 2021: The Physical Science Basis. Contribution of Working Group I to the Sixth Assessment Report of the Intergovernmental Panel on Climate Change. Cambridge, UN: Cambridge University Press.
Jasechko, S., and Taylor, R. G. (2015). Intensive Rainfall Recharges Tropical Groundwaters. Environ. Res. Lett. 10, 124015. doi:10.1088/1748-9326/10/12/124015
La Vigna, F., and Mazza, R. (2015). Hydrogeological map of Rome–1:50,000 scale. Pomezia, Roma: PO.LI.GRAF.
Lin, H. (2010). Earth's Critical Zone and Hydropedology: Concepts, Characteristics, and Advances. Hydrol. Earth Syst. Sci. 14 (1), 25–45. doi:10.5194/hess-14-25-2010
Longinelli, A., and Selmo, E. (2003). Isotopic Composition of Precipitation in Italy: A First Overall Map. J. Hydrol. 270 (1-2), 75–88. doi:10.1016/S0022-1694(02)00281-0
Mastrorillo, L., and Petitta, M. (2010). La rete di monitoraggio idrogeologico della Tenuta presidenziale di Castelporziano (Roma). IX Giornata Mondiale dell’Acqua 23 Marzo 2009 – Il bacino del Tevere. Atti Convegni Lincei 254, 105–118.
Miguez-Macho, G., and Fan, Y. (2012). The Role of Groundwater in the Amazon Water Cycle: 2. Influence on Seasonal Soil Moisture and Evapotranspiration. J. Geophys. Res. D: Atmos 117 (D15), 27. doi:10.1029/2012JD017540
Montanarella, L., and Panagos, P. (2015). Policy Relevance of Critical Zone Science. Land Use Policy 49, 86–91. doi:10.1016/j.landusepol.2015.07.019
Naumburg, E., Mata-gonzalez, R., Hunter, R. G., Mclendon, T., and Martin, D. W. (2005). Phreatophytic Vegetation and Groundwater Fluctuations: A Review of Current Research and Application of Ecosystem Response Modeling With an Emphasis on Great Basin Vegetation. Environ. Manag. 35, 726–740. doi:10.1007/s00267-004-0194-7
Petitta, M., Lacchini, A., and Sbarbati, C. (2021). “Regime e ricarica della falda sotterranea di Castelporziano: utilità del monitoraggio per la valutazione dello Stato della Foresta,” in Il Sistema Ambientale della Tenuta presidenziale di Castelporziano. Ricerche sulla complessità di un ecosistema forestale costiero mediterraneo”, Scritti e documenti LXII (Roma: Accademia Nazionale delle Scienze detta dei XL), 67–82 (ISBN 978-88-9807542-3, ISSN 03-91-4666.
Recanatesi, F., Giuliani, C., Piccinno, M., Cucca, B., Rossi, C. M., and Ripa, M. N. (2020). An Innovative Environmental Risk Assessment Approach to a Mediterranean Coastal Forest: the Presidential Estate of Castelporziano (Rome) Case Study. Ann. Silvic. Res. 44 (2), 80–85. doi:10.12899/asr-1884
Recanatesi, F., Giuliani, C., and Ripa, M. N. (2018). Monitoring Mediterranean Oak Decline in a Peri-Urban Protected Area Using the NDVI and Sentinel-2 Images: The Case Study of Castelporziano State Natural Reserve. Sustainability 10, 3308. doi:10.3390/su10093308
Recanatesi, F. (2015). Variations in Land-Use/land-Cover Changes (LULCCs) in a Peri-Urban Mediterranean Nature Reserve: the Estate of Castelporziano (Central Italy). Rend. Fis. Acc. Lincei 26 (3), 517–526. doi:10.1007/s12210-014-0358-1
National Research Council (2001). Basic Research Opportunities in Earth Sciences. Washington, D. C: National Academies Press, National Research Council.
Schenk, H. J., and Jackson, R. B. (2002). The Global Biogeography of Roots. Ecol. Monogr. 72 (3), 311–328. doi:10.1890/0012-9615(2002)072[0311:tgbor]2.0.co;2
Servizio Geologico d’Italia (2009). Foglio 387 Albano Laziale. Carta Geologica d’Italia scala 1, 50.
Singha, K., and Navarre‐Sitchler, A. (2022). The Importance of Groundwater in Critical Zone Science. Groundwater 60 (1), 27–34. doi:10.1111/gwat.13143
Soylu, M. E., Istanbulluoglu, E., Lenters, J. D., and Wang, T. (2011). Quantifying the Impact of Groundwater Depth on Evapotranspiration in a Semi-arid Grassland Region. Hydrol. Earth Syst. Sci. 15 (3), 787–806. doi:10.5194/hess-15-787-2011
Stromberg, J. C., Tiller, R., and Richter, B. (1996). Effects of Groundwater Decline on Riparian Vegetation of Semiarid Regions: The San Pedro, Arizona. Ecol. Appl. 6, 113–131. doi:10.2307/2269558
Taylor, R. G., Todd, M. C., Kongola, L., Maurice, L., Nahozya, E., Sanga, H., et al. (2013). Evidence of the Dependence of Groundwater Resources on Extreme Rainfall in East Africa. Nat. Clim. Change 3, 374–378. doi:10.1038/nclimate1731
Thornthwaite, C. W., and Mather, J. (1957). Instructions and Tables for Computing Potential Evapotranspiration and the Water Balance. Publ. Climatol. 10 (3), 185–311.
Tinelli, A., Folletto, A., Manfredi Frattarelli, F., Maffei, L., Musicanti, A., and Recanatesi, F. (2012). Le Zone Umide. Segretariato Generale Della Presidenza Della Repubblica Italiana. Roma: Accademia Nazionale delle Scienze detta dei XL ISBN: 978-8898075003.
Wang, H., Gao, J. E., Zhang, M.-j., Li, X.-h., Zhang, S.-l., and Jia, L.-z. (2015). Effects of Rainfall Intensity on Groundwater Recharge Based on Simulated Rainfall Experiments and a Groundwater Flow Model. Catena 127, 80–91. doi:10.1016/j.catena.2014.12.014
Keywords: Castelporziano Estate, UCZ monitoring, recharge areas, water table decline, soil moisture
Citation: Sbarbati C, Lacchini A and Petitta M (2022) The Role of Hydrogeological Monitoring in a Multidisciplinary Context for the Preservation of the Critical Zone in the Natural Reserve of Castelporziano Estate. Front. Earth Sci. 10:935791. doi: 10.3389/feart.2022.935791
Received: 04 May 2022; Accepted: 24 June 2022;
Published: 05 August 2022.
Edited by:
Stephane Binet, Université d’Orléans, FranceCopyright © 2022 Sbarbati, Lacchini and Petitta. This is an open-access article distributed under the terms of the Creative Commons Attribution License (CC BY). The use, distribution or reproduction in other forums is permitted, provided the original author(s) and the copyright owner(s) are credited and that the original publication in this journal is cited, in accordance with accepted academic practice. No use, distribution or reproduction is permitted which does not comply with these terms.
*Correspondence: Chiara Sbarbati, Y2hpYXJhLnNiYXJiYXRpQHVuaXR1cy5pdA==