 Vincenzo Costanzo-Álvarez1,2*
 Jorge Mendoza3
 Milagrosa Aldana2Maria Jacome4Marisel Díaz5Keyla Ramirez6
 Cristina H. Amon1,7
- 1Department of Mechanical and Industrial Engineering, University of Toronto, Toronto, ON, Canada
- 2Departamento de Ciencias de la Tierra, Universidad Simón Bolívar, Caracas, Venezuela
- 3Facultad de Ingeniería en Ciencias de la Tierra, Escuela Superior Politécnica del Litoral ESPOL, Guayaquil, Ecuador
- 4Faculty of Applied Sciences and Technology, Humber Institute of Technology and Advanced Learning, Toronto, ON, Canada
- 5Centro de Física, Instituto Venezolano de Investigaciones Científicas, Miranda, Venezuela
- 6FUNVISIS Fundación Venezolana de Investigaciones Sismológicas, Caracas, Venezuela
- 7Department of Chemical Engineering and Applied Chemistry University of Toronto, Toronto, ON, Canada
The footprints of petroleum microseepage can be associated with chemical and microbial processes in initially homogeneous strata and/or with the fluid transport properties of the rocks through which oil and gas migrate. This work examines the role of such driving factors in two contrasting geological settings by comparing numerical modeling predictions for upward methane microseepage with some field evidence for hydrocarbons transport and accumulation. The two case studies are a monitoring borehole (BH8) from a landfill in southern Ontario, Canada, and an oil well (Saltarin 1A) from the Eastern Llanos Basin in Colombia. Profiles of relative methane concentrations versus depth were generated using a time-dependent, one-dimensional, simulation of the advection-diffusion equation applied to multiple strata of soils, and sediments. The model employs the layered sequences of these two geological settings. The results obtained hinge on the standard permeability values for the rock types involved and their corresponding flow velocities and diffusion coefficients. Resistivity logs were utilized as direct proxies of hydrocarbon concentrations. As additional evidence for petroleum microseepage, experiments of electron paramagnetic resonance (EPR) were carried out in drilling cuts of Saltarin 1A to measure traces of organic matter free radicals concentrations (OMFRC). Extractable organic matter (EOM) and magnetic susceptibility data were also considered in interpreting the EPR results. Qualitative comparisons between modeled methane profiles and their corresponding resistivity logs suggest that microseepage and hydrocarbon accumulations are conditioned by the fluid transport properties of the rocks contained by BH8 and Saltarin 1A. Moreover, in most of the Saltarin 1A sequence, the OMFRC profiles follow the trends displayed by the resistivity and modeled methane logs. Thus, the EPR data also indicates that hydrocarbon microseepage and accumulation are largely controlled by lithology. Conversely, EOM and magnetic susceptibility appear to be evidence for hydrocarbon-mediated near-surface chemical processes.
Introduction
For more than 50 years, a share of research in petroleum exploration has been centered on studying the physical and chemical signatures produced by hydrocarbons microseepage through the sedimentary strata overlying a reservoir. Hence, some near-surface magnetic and geochemical anomalies, identified in regions affected by oil and gas leaks, can be regarded as evidence of how hydrocarbon accumulations are vertically focused and distributed along their migration paths (Schumacher, 1996). Indeed, airborne magnetic surveys and direct measurements of magnetic properties in soils, sediments and drilling cuts, are widely used to characterize the surface expression of this form of tertiary migration through the top layers of a stratigraphic sequence (e.g., Donovan et al., 1984, Saunders et al., 1991; Aldana et al., 2003; Guzmán et al., 2011; Abubakar et al., 2020 among others).
Some indications for petroleum microseepage are the magnetically enhanced zones located at relatively shallow strata in some oil fields. These anomalies are allegedly produced by the hydrocarbon-mediated alteration of the original magnetic phases to secondary Fe oxides and/or sulfides (e.g., Reynolds et al., 1990; Foote, 1996; Costanzo-Álvarez et al., 2000; Díaz et al., 2000; Costanzo-Álvarez et al., 2006; Liu et al., 2006; Rijal et al., 2012). Numerous studies suggest that certain thermochemical conditions (e.g., appropriated redox environments, pressure, temperature, sulfur content, among others) and/or microbial processes trigger diagenetic changes in initially homogeneous soils and sediments (e.g., Machel, 1995; Ellwood and Burkart, B., 1996). Conversely, few works deal with the role played, in the origin of such magnetic anomalies, by the lithology of the rocks affected by the presence of hydrocarbons (e.g., Hall and Evans, 1995; Mena and Walther, 2012; Costanzo-Álvarez et al., 2019). This observable fact is supported by theoretical considerations demonstrating that pressure and concentration gradients appear to be important mechanisms that activate the migration of oil and gas through the porous media (e.g., Matthews, 1996; Brown, 2000). Consequently, the amount of hydrocarbons seeping through, and accumulating in, soils and sediments would be effectively controlled by the fluid transport properties of these strata and, hence, by their lithologies (Jones and Burtell, 1996).
Different mechanisms, such as buoyancy of microbubbles, continuous gas-phase flow, diffusion, and transport water solution, have been proposed to explain microseepage in oil prospective regions (e.g., Clayton and Dando, 1996; Klusman and Saeed, 1996; Kroos and Leythaeuser, 1996; Brown, 2000; Etiope 2015; Anderson et al., 2019) and anthropogenic settings, such as landfills and underground gas storage complexes (e.g., El-Fadel et al., 1996a,b; Jones and Burtell, 1996; Chen et al., 2000; Nastev et al., 2001; Martín et al., 2001; Zeng, 2019). The theoretical treatment of this phenomenon can be challenging, depending on the numerous factors considered in the problem statement, such as dimensionality, hydrocarbons source model, multiphase hydrocarbons transport, and time-variation hydrocarbons composition. However, regardless of the complexity of the numerical approach used to simulate petroleum microseepage, the results obtained should be versatile enough to work in different situations and be adjustable to existing field and laboratory evidence (Klusman and Saeed, 1996).
In the present work, we compare numerical predictions of a time-dependent, one-dimensional model of upwards methane migration through multiple layers of soils and sediments, with field evidence for hydrocarbons microseepage, in two contrasting geological settings: a landfill’s monitoring borehole in southern Ontario and an oil well in eastern Colombia. Landfills are ideal natural laboratories in this kind of study due to the possibility of tracking down the time evolution of some site-specific variables and their smaller dimensions compared with an oil field (Ellwood and Burkart, 1996; Cogoini, 1997). Moreover, methane is the most abundant biogas migrating to the surface in such sites, while hydrocarbons’ long-term macro and microseepage in oil fields involve different solid, liquid, and gaseous components, with molecular sizes spanning a wide range of orders of magnitude (Matthews, 1996). Thus, it is reasonable to scale up the example of the borehole in the landfill to the oil well, in the same way that the properties of drilling cores are commonly extrapolated to infer the behavior of an oil reservoir. The higher volumes of hydrocarbons migrating to the surface in the oil well would compensate for the larger depths compared with the monitoring well. Ultimately, we would expect to assess the extent to which the fluid transport properties of different lithofacies effectively control the field evidence of hydrocarbons microseepage available for each of these geological settings.
The rock types introduced as input in the model would be taken directly from the stratigraphic descriptions of these two wells (i.e., Jacome et al., 2021; Bayona et al., 2008). On the other hand, the process simulation would be based on the advection-diffusion equation for saturated water and unsaturated porous media. The velocity of the gas vertical movement, in the advection term, corresponds to a Darcy flow that considers permeability, buoyancy, and pressure gradient for a system of ascending colloidal-size gas microbubbles dissolved in pore water. This model also assumes a continuous generation of a single gas component without distinguishing between CH4 and CO2 (Arigala et al., 1995; Chen et al., 2000). In the same way, the slight differences between thermogenic and biogenic methane with δ13Cs’ of −55 and −460/00, respectively, make negligible any possible contrast of mobility and partial pressure exerted by each of these two species of the same gas (Stolper et al., 2015; Moore et al., 2018). Since this is not a laboratory-controlled simulation, the tests of the model would be carried out with the typical absolute permeability ranges of various rock types, previously reported in the literature and their corresponding flow velocities and methane diffusion coefficients (e.g., Krooss and Leythaeuser, 1988; Liu et al., 2012; Evirgen et al., 2015; Chen et al., 2018).
The first case study is a long-screening borehole (BH8) used to monitor groundwater quality in a closed landfill in southern Ontario. In this geological setting the alleged source of biogas is a waste stabilization zone within the first 30 m of depth, in which the combined effects of multiple hydrogeochemical leachate processes occur. The field evidence for the accumulation of landfill gases along a sedimentary column of clays and sands is given by a resistivity log obtained from a direct current (DC) geoelectrical survey. In fact, in dumping grounds, high resistivity values could be associated with buildup of biogases, and their changes over time linked to the variability of their transport processes (e.g., Dahlin et al., 2010 and, 2011; Rosqvist et al., 2010; Johansson et al., 2011). However, in this type of site, high resistivity might also reveal the presence of uncontaminated saturated soils (e.g., Guerin et al., 2004; Dahlin et al., 2010; Abdulrahman et al., 2016). In this particular landfill, Jacome et al. (2021) previously obtained a statistically significant empirical relationship that accounts for a possible association between geophysical proxies of leachate accumulation (i.e., direct current resistivity and induced polarization) and surficial methane emissions. Thus, they have demonstrated that surface methane concentrations are vertical projections of a deep source of biogas.
The second case study is an oil well (Saltarin 1A) located in the Eastern Llanos Basin in Colombia. Besides a detailed lithostratigraphic description for this well (Bayona et al., 2008), and a resistivity type-log for the Eastern Llanos Basin (Barrero et al., 2007), there is some rock magnetic data available that seem to characterize hydrocarbon-mediated diagenetic effects on the magnetic signature of its different lithofacies (Costanzo-Álvarez et al., 2012). Previous studies on drill cuttings, taken from diverse oil wells in South America, have shown that magnetic susceptibility anomalies, at depth levels far above the reservoirs and close to peaks of organic matter free radical concentrations (OMFRC), coincide with highs of extractable organic matter (EOM) and the presence of spherical aggregates of authigenic Fe-rich minerals (e.g., magnetite and/or pyrrhotite framboids). Therefore, OMFRC, EOM, and magnetic susceptibility anomalous values appear to be the footprints of hydrocarbons that have migrated from the reservoir to the surface, inducing a redox environment along their pathway with consequent alteration of primary Fe oxides. The relationship observed between OMFRC, and magnetic susceptibility anomalies could be explained as the result of the diagenesis of magnetic minerals, primarily driven by chemical changes associated with the degradation of organic matter in which free radicals play an important role (e.g., Costanzo-Álvarez et al., 2000; Díaz et al., 2000; Aldana et al., 2003; Costanzo-Álvarez et al., 2006; Guzmán et al., 2011; Costanzo-Alvarez et al., 2019). In Saltarin 1A, we complement magnetic information with additional EOM experiments and electronic paramagnetic resonance (EPR) to obtain a profile of OMFRC that could provide additional field evidence about the passage of hydrocarbons through this sedimentary sequence. This work is the first one in which results from a numerical model for hydrocarbon microseepage are substantiated with combined resistivity, EPR, and EOM field data.
Case Studies and Field Evidence
Borehole BH8—Closed Landfill in Southern Ontario
The long-screening monitoring well BH8 is a 25 m borehole located, approximately, 20 m southwest of a 30 years old closed and non-engineered landfill (i.e., no lining and no gas or leachate recovery systems) in southern Ontario, Canada (Figure 1A). The site comprises a northeasterly trending waste-filled trench, of about 3 ha and 10 m deep, encircled by a contaminant attenuation zone (CAZ) (Dewaele, 2019). The host lithology is a 10–15 m thick sequence of glaciolacustrine sands that contains an upper unconfined aquifer, draining to the south/southwest in the direction of the groundwater flow. Underlying these strata, there is a 4–15 m thick aquitard of cohesive silty clays that separates the upper unconfined aquifer from a confined one underneath (Figure 1B). BH8 is one of the few boreholes used to check, up to four times per year, the time-evolution of the leachate plume. The seasonal and annual water quality tests at this borehole have shown that the concentrations of some indicators of landfill influence in the unconfined aquifer exceed the reasonable use criteria (Dewaele, 2019).
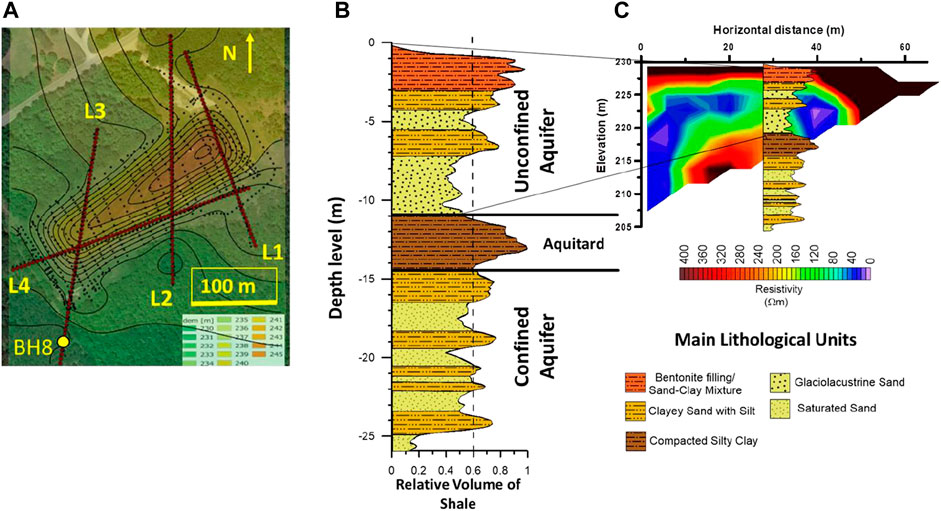
FIGURE 1. (A) Map of the landfill site in southern Ontario showing the four geoelectrical surveyed lines, topographic data (black dots), and location of borehole BH8 that lies on the lower end of the western most L3. (B) Hydrostratigraphic interpretation of the Gamma Ray (GR) log for borehole BH8 using volumes of shale. (C) Correlation between GR information and the inverted electrical resistivity tomography image for the westernmost geoelectrical surveyed L3 (after Jacome et al., 2021).
Jacome et al. (2021) carried out a regional 2D resistivity and induced polarization (IP) survey on this site, along four about 300 m-long transects that cut crosswise and throughout the strike of the landfill (Figure 1A). A penetration of about 50 m depth was achieved using a Dipole-Dipole array of 60 electrodes per Line, separated by 5 m intervals. Figure 1C shows the southern portion of a resistivity tomographic cross-section of the surveyed Line 3 that cuts through BH8. In the southwestern end of the landfill, where BH8 is located, there is evidence for a low resistivity anomaly, that could be the result of a leachate plume that has percolated through the aquitard reaching depths of about 20 m.
An almost continuous (i.e., every 0.1 m) depth referenced gamma-ray (GR) profile, through BH8, was acquired with a natural GR probe attached to a wireline and winch to move it up and down the borehole (Jacome et al., 2021). These data were used to calculate the relative clay content at each depth level applying a linear approximation of the GR index (Figure 1B). Such information was combined with an inverted resistivity tomographic image, obtained at the location of this borehole on the southwestern end of surveyed Line 3 (Figures 1A,C). The high GR values for the top 3 m of BH8 are explained as the result of a bentonite lining. However, the corresponding resistivity values for this depth interval (i.e., 300–500 Ωm) are representative of a mixture of unsaturated poorly-sorted gravel and clayey sand roofed by subsoils with high organic matter content (Michaels, 2007; Engineering ToolBox as cited in; Aderibigbe et al., 2017).
For the depth interval, between 3 and 11 m, the average volume of shale for a sequence of non-cohesive moist clayey and glaciolacustrine sands is about 40%. The typical resistivity values for these sediments, which contain the unconfined aquifer, are about 120 Ωm as expected for this kind of soils (e.g., Michaels, 2007). Further down, between 11 and 14.5 m, the highest volumes of shale (about 60%) correspond to an aquitard (silty clay sequence) that separates the upper and lower aquifers. The average resistivity for this sequence is, approximately, 200 Ωm that agrees with values previously reported for compacted/unsaturated clays (Engineering ToolBox as cited in Aderibigbe et al., 2017). The lowermost layer recorded by the GR log, between 14.5 and 26 m, corresponds to the water-saturated soils containing the confined aquifer with a shale volume of about 53% (Figures 1B,C).
Methane concentrations of 40–160 ppm, measured over all the surveyed lines, have also been reported by Jacome et al. (2021). They obtained numerical relationships linking these surface emissions with geoelectrical proxies of a waste stabilization zone that seems to have acted as the main biogas supply (i.e., minimum resistivity and their corresponding IP values). These results support the hypothesis of vertically focused gas migration from the source to the surface, which could be used as a surveillance test to approximate the areal extent of the leachate plume underground.
Oil Well Saltarin 1A- Eastern Llanos Basin, Colombia
A detailed analysis of lithofacies for different units of the oil well Saltarin 1A, located in the central part of the Eastern Llanos Basin in Colombia (Figure 2A), was carried out by Bayona et al. (2008). The lowest geological unit reached by this well, at depths between 546.9 and 608.2 m, is part of the Upper Carbonera Formation (i.e., reservoir rock), encompassing a sequence of fluvial-deltaic sandstones. The seal of the reservoir is the Leon Formation that overlies Carbonera (441.8–546.9 m), with a fraction of shales of circa 80% (Costanzo-Álvarez et al., 2012). The Leon Formation is a homogeneous green-colored muddy sequence of freshwater lacustrine sediments. On top of Leon lies Guayabo, divided into six different units. G1 (388.0–441.8 m) and G2 (312.9–388.0 m) are mostly green-colored laminated mudstones grading to sandstones and interbedded with light-colored mudstones and ferruginous nodules. These sequences represent the possible transition between a fluvial-deltaic system and the more continental facies accumulated in fluvial floodplains. On top of G2 lie the fluvial floodplain sequences of mudstones and siltstones of both G3 (271.5–312.9 m) and G4 (205.5–271.5 m). G3 shows evidence for subaerial exposure (i.e., light-colored mudstones and ferruginous nodules), contrasting with the floodplains sequence displayed by G4 with signs of little sub-aerial exposure (i.e., preservation of coal beds and laminated mudstones). The average volume of shales for these four units is about 50% (Costanzo-Álvarez et al., 2012). On top of G4 lies G5 (81.6–205.5 m), a feldspar and lithic rich sequence of immature sandstones with average volumes of shales of about 20% (Costanzo-Álvarez et al., 2012), that was interpreted as the filling of fluvial channels. Finally, the youngest unit G6 (0–81.6 m) encompasses light-colored mudstones interbedded with quartzose sandstones and seems to have accumulated on a floodplain showing evidence for both subaerial exposure and filling of fluvial channels (Figure 2B).
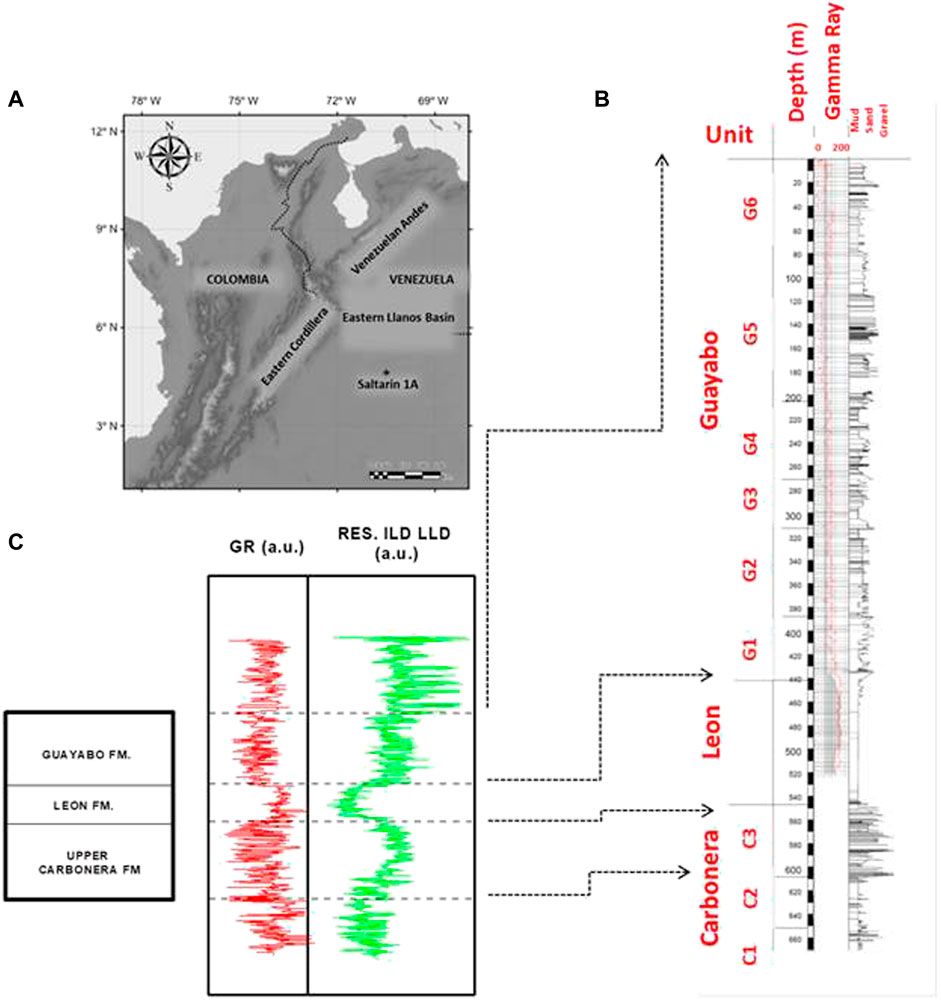
FIGURE 2. (A) Geographical setting of the stratigraphic well Saltarín 1A in the Colombian Eastern Llanos Basin (after Camacho et al., 2013). (B) Lithologic column of the stratigraphic well Saltarín 1A showing the limits, textures, and sedimentary structures for Upper Carbonera, Leon, and Guayabo Formations and the corresponding Gamma Ray (GR) log for the first 520 m (after Costanzo-Álvarez et al., 2012). (C) Gamma Ray and Resistivity type-logs for the Eastern Llanos Basin showing the approximate boundaries of the Upper Carbonera, Leon and Guayabo Formations (Petroleum system chart for the Eastern Llanos Basin by Barrero et al., 2007). Arrows correlate the formational boundaries of the resistivity type-log with their corresponding equivalents fully identified in the Saltarin 1A (Bayona et al., 2008).
Palmer and Russell (1988) identified five different families of crude oils in the Eastern Llanos Basin which, in most cases, are a combination of hydrocarbons generated in Cretaceous marine (siliciclastic and carbonate) and terrestrial (deltaic) source rocks. According to its location, Saltarin 1A belongs to a region in the Basin characterized by Family 2 (approximately 30–40 API and up to 0.5% of Sulfur), Family 3 (approximately from 10 to 35 API and up to 0.5% of Sulfur), and Family 4 (15–32 API and 0.75–1.8% of Sulfur). Family 2 shows a terrestrial origin, whereas Families 3 and 4 are mixtures of mature hydrocarbons of terrestrial and marine origins. The Basin comprises the largest oil fields in Colombia, with total cumulative production up to 2,007 of 2,900 million barrels of oil equivalent, and the potential for future discoveries of large to medium new fields (Moretti et al., 2009). It also contains the largest proven reserves of natural gas in the country, with about 50% of a total of 5.5 TPC for 2013 (UPME Unidad de Planeación Minero Energética, 2013).
There is no resistivity information specific to Saltarin 1A. However, Figure 2B shows the GR and Resistivity type-logs of a stratigraphic type-section for the Eastern Llanos Basin that integrates data from an unspecified number of oil wells and was reported by Barrero et al. (2007) in a Petroleum System Chart for the Eastern Llanos Basin. Since the tops of Guayabo, Leon, and Carbonera are clearly recognized in this generic profile, it is possible to precisely correlate them with their Saltarin 1A counterparts, as indicated in Figures 2B,C.
Geochemical analyses (i.e., gas chromatography-mass spectroscopy GC-MS and Fourier transform infrared FTIR), carried out on bitumen samples extracted from oil-stained rocks in the Saltarin 1A, identify an oil and gas-prone kerogen type II, possibly generated from a source of organic matter of mixed terrestrial and marine origin, accumulated in an anoxic paleoenvironment (Emmerton et al., 2013). Moreover, GC-MS and FTIR analyses on four rock samples from Carbonera, Leon, and Guayabo, show dominant abundances of aliphatic n-alkanes (i.e., between 74% and 94%) with little evidence for biodegradation (Emmerton et al., 2013).
A rock magnetic characterization of the hydrocarbon-mediated processes that have acted on this sedimentary sequence, accounts for a conspicuously high anomaly of the magnetic susceptibility, which covers an interval between 75 and 175 m of depth (i.e., units G5 and G6) at the top of the Guayabo Formation (Costanzo-Álvarez et al., 2012) (Figure 3A). Thermomagnetic and isothermal remanent magnetization curves suggest that the primary mineral, responsible for these susceptibility peaks, is magnetite with a minor Fe-sulfide contribution. Besides, analysis of Scanning Electron Microscopy (SEM), on magnetic separates from levels 142.25 and 127.40 m (i.e., G5 unit), identify microframboids of pyrite (about 6 mm) partially replaced by magnetite, the likely by-product of hydrocarbon-related diagenesis (insets Figure 3A). Magnetite, hematite, and some of the Fe-sulfides recognized at the bottom of Guayabo, Leon, and top of Carbonera Formations, stand as additional proof for the diagenetic effects of hydrocarbons microseepage through these strata (Costanzo-Álvarez et al., 2012).
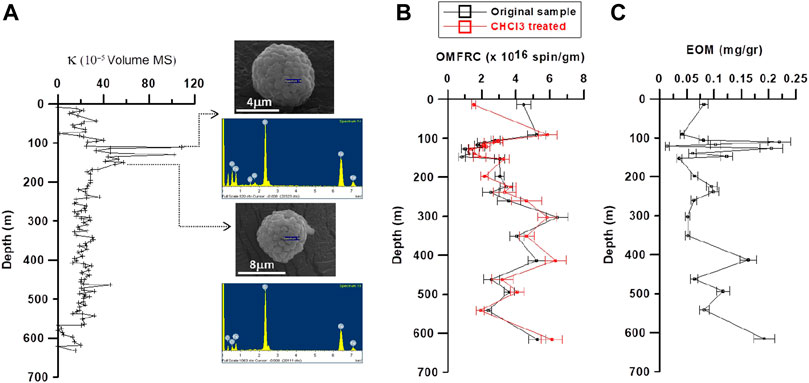
FIGURE 3. Comparative profiles for the first 600 m of the stratigraphic well Saltarin 1A. (A) Bulk magnetic susceptibility (κ). The insets show the scanning electron microscope (SEM) photomicrographs and results of Energy Dispersive X-Ray analyses (EDX) of hydrocarbon-related Fe and S-rich framboids, identified at 127.4 and 147.2 m, within Guayabo’s G5 anomalous magnetic susceptibility peak (after Costanzo-Álvarez et al., 2012). (B) Concentrations of organic matter free radicals (OMFRC) for both chloroform-treated and untreated samples, obtained from the Electron Paramagnetic Resonance (EPR) experiments. (C) Concentrations of extractable organic matter (EOM).
To increase the available evidence of hydrocarbons migration through the Saltarin 1A sequence, we carried out electron paramagnetic resonance (EPR) and extractable organic matter (EOM) experiments in 21 drill cuttings. These rock samples were taken at average depth intervals of about 30 m along the circa 600 m encompassed by this oil well. The EPR technique allows measuring tiny concentrations of paramagnetic species, such as organic matter free radicals (OMFR) contained in asphaltenes and kerogen, whereas the EOM identifies the soluble fraction of hydrocarbons in oil-stained rocks.
For the EPR analysis, approximately 10 g per sample were ground to less than 150 mesh and mixed thoroughly to avoid possible heterogeneities of the paramagnetic species concentrations. After this initial handling, they were divided into two fractions. One was treated with trichloromethane (CHCL3) in a beaker with magnetic agitation at room temperature, to dissolve the EOM. This CHCL3 was then filtered and dried out to separate the EOM from the rest of the sample. The second fraction was not treated. EPR measurements were carried out on both treated and untreated samples to investigate the possible differences in their respective EPR spectra (i.e., OMFRC in spin/gm units). The EOM concentrations were also determined in mgr/gm. There are multiple procedures to extract the soluble organic matter from oil-stained rocks using organic solvents such as benzene, methanol-benzene mixtures, and chloroform (e.g., Radke et al., 1978; Monin et al., 1988; Elmore et al., 1993; Chen et al., 2009; Hou et al., 2021). These experiments are commonly carried out in a Soxhlet extractor, a mixer, an ultrasonic apparatus, or a beaker, at temperatures varying from approximately 25°C to the boiling point of the solvents employed.
The EPR spectra of each sample were obtained at room temperature employing a Bruker EMX spectrometer that works at a frequency of approximately 9.3 GHz (X-band). This instrument comprises a rectangular cavity, and a modulation of 100 kHz. Experimental conditions are adjusted to avoid saturation of the signal. The OMFRC for the samples analyzed were obtained by comparison with a calibration standard of 2,2-diphenyl-1-picrylhydrazyl (DPPH) measured at the same experimental conditions. The number of spins, proportional to the OMFRC, is calculated directly from the EPR spectrum (i.e., the area under the curve obtained from the first derivative of the absorbed energy as a function of the magnetic field).
The profile in Figure 3B shows the OMFRC for the CHCL3 treated (red) and untreated (black) rock specimens, with average experimental errors of about 10%, suggesting that there is not a statistically significant difference between the two profiles. Thus, it is plausible to rule out the presence of asphaltenes, a soluble compound with stable free radicals (Yen et al., 1962). Asphaltenes are highly resistant to microbial attack, so their absence in the Saltarin 1A supports previous geochemical evidence that accounts for little or no biodegradation at all in these specific hydrocarbons in Saltarin 1A (Emmerton et al., 2013). Another feature of this profile is that the maximum OMFRC coincide neither with the peak of magnetic susceptibility nor with the levels at which framboids of Fe sulfides and oxides were previously identified. However, the EOM profile shows its higher concentrations at the same depths where the maxima of magnetic susceptibility occurs (Figures 3A,C).
Methane Vertical Microseepage
Numerical Modeling
One of the first hydrocarbon seepage mechanisms is the process of diffusion, represented by the Fick’s second law, which predicts diffusion-mediated concentration (C) variations through time t. If we apply this concept to a one-dimensional stratigraphic column, the concentration change is given by:
where D is the diffusion coefficient and z the depth along the column (Clark et al., 2018).
Klusman and Saeed (1996), Brown (2000), Wang (2012) and Wang et al. (2016) show that, below the water table, microseepage is predominantly caused by microbubbles buoyancy, with diffusion as a secondary mechanism. Conversely, above the water table diffusion appears to be the principal mechanism for hydrocarbons vertical migration, with a minor influence of gas convection. To account for the advection related to buoyancy and the effective diffusion caused by molecular diffusion, we use the following one-dimensional linear advection-diffusion model (Jaiswal et al., 2011):
This model quantifies the vertical microseepage mechanisms of light hydrocarbon, where U is the flow velocity of natural gas. We need to emphasize that the time-dependent equation to be solved is one dimensional in space, with concentration changes of solute gas moving vertically along the z direction from the bottom to the top of the stratigraphic/geological column.
The initial and boundary conditions are C(z,t) = 0; z ≥ 0, t = 0.
This means that, at initial time (t = 0), there is no propagation of the solute in the whole media C(z,t) = C0; z = 0, t > 0 and
This means that, the initial concentration of solute at the source is C0 and the velocity of solute spread is zero at an infinite distance from the source.
The analytical solutions of Eq. 2 are given by Jaiswal et al. (2011):
In the expression above, erfc(x) is the complementary error function of the Gauss error function, erf(x), used instead of erf(x) for large values of x (Chevillard, 2012). The computed concentration C(z,t) provides values for a single layer only, going from a continuous source of gas at its bottom (z = 0) to the surface (z = zmax) (Figure 4A). Hence, in the two case studies (Figures 4B,C) corresponding to layered media, the superposition principle is used to obtain the numerical solution of the time-dependent one-dimensional linear advection-diffusion Eq. 2. This principle is widely applied to solve problems such as those dealing with boundary values in transient well testing (Lee et al., 2003).
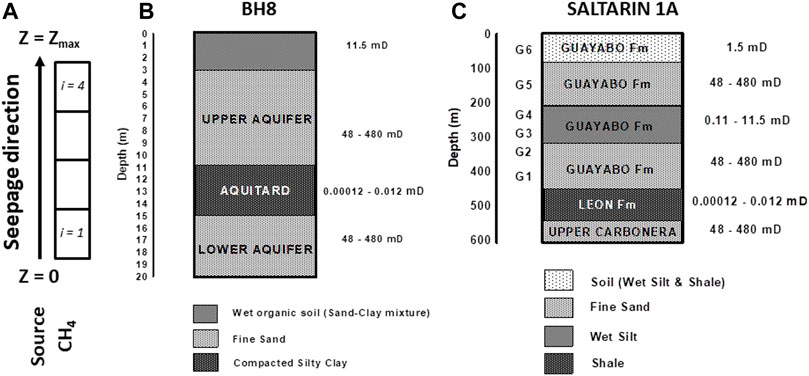
FIGURE 4. (A) Border conditions and parameters used for the numerical modeling (superposition principle). The continuous gas source for BH8 was set at 20 m coinciding with a low resistivity anomaly in the southern end of the landfill (Jacome et al., 2021). In Saltarin 1A the methane source was placed in the upper unit of the reservoir Carbonera Formation (608.2 m). The figure also shows the arrangements of sedimentary layers, with their possible permeability ranges, used to model the fraction of methane concentrations with depth for: (B) Borehole BH8 based on the hydrostratigraphic description by Jacome et al. (2021) of Figure 1B. (C) Oil well Saltarin 1A based on the lithological description by Bayona et al. (2008) of Figure 2B.
To employ the superposition principle in our case, we calculate the response of Eq. 3 for every single layer that defines the stratigraphic model according to their physical parameters (Ki, Ui, Di and t) and from z=0 to z=zmax. Subindex i refers to the i layer of the model. Then, we add the contributions of Eq. 3 for each layer only within the intervals we have divided the model. For instance, in the case of three layers with (K1,U1, D1) (from z0 to z1), (K2,U2, D2) (from z1 to z2) and (K3,U3, D3) (from z2 to z3), and t fixed in each numerical simulation (e.g., 1, 15, 30, 120, 1,200 days), we would obtain:
We coded and implemented a MATLAB algorithm to generate the numerical modeling predictions for the changes in concentration C as a function of time and height of the stratigraphic columns of Figure 4. The program also calculates the speed of the natural gas transport throughout the media by using the following equation (Brown, 2000):
The term K represents the absolute permeability of the media in which the solute is moving; Kg is the gas relative permeability; µg is the gas viscosity; g is the gravity acceleration and ρg, ρw represent the density of gas and water, respectively. The term dPg/dz is the pressure gradient as in the Darcy classical equation (e.g., De Schampheleire et al., 2016). The relative permeability is a non-dimensional indicator of the amount of absolute permeability existing in a multi-fluid, contained in pore space, with respect to a particular phase. In other words, this term is a percentage related to gas or water saturation that varies according to the lithology of the layer being considered.
We checked the model prediction using the absolute permeability coefficients K reported in the literature for coarse, fine, silty, and clay sands (e.g., Evirgen et al., 2015). The corresponding flow velocities U for these permeability values were obtained from Eq. 4. The relative natural permeability of gas employed in Eq. 4 for water-saturated strata (e.g., fine sandstones) was taken as 17%, according to Conant et al. (1996). Consequently, the penetration potential of gas and water in these layers was determined by pressure and buoyancy. Conversely, in unsaturated layers (e.g., shales and silts), the relative gas permeability was taken as 71% (i.e., penetration potential mainly controlled by pressure) (Conant et al., 1996).
Numerical Modeling Predictions
The arrangement of sedimentary layers for BH8 and Saltarin 1A, used to determine the distribution of methane content with depth, is based on the stratigraphic descriptions by Jacome et al. (2021) and Bayona et al. (2008), respectively (Figures 4B,C). To simplify the porous media data introduced to the model we reduced the number of sedimentary facies by merging similar adjacent lithological units. For example, BH8 glaciolacustrine sands interbedded with clayey sands and silts, containing the upper and lower aquifers (Figure 1B), were regarded as undifferentiated layers of fine sands (Figure 4B). Similarly, in Saltarin 1A, some units from the Guayabo Formation were combined into single lithologies labeled as wet silts (G3 and G4) and fine sands (G1 and G2) (Figure 4C).
The continuous gas source for BH8 was positioned at 20 m, just below the aquitard. This depth level corresponds to a low resistivity anomaly previously recognized by Jacome et al. (2021) as a possible extension of the leachate plume at the location of this borehole (i.e., southern end of the landfill). In the case of Saltarin 1A, the source was located in the upper unit of the reservoir rock (i.e., Carbonera Formation) at 608 m depth.
To choose the most appropriate diffusion coefficients (D) for hydrocarbons with low molecular weights (e.g., CH4), we used a series of laboratory results by Krooss and Leythaeuser (1988), Liu et al. (2012), and Chen et al. (2018). These studies aim to find a link between D and some petrophysical properties, such as permeability (K) and porosity. To measure methane diffusion coefficients in different rock types, they employed the same experimental procedure of free gas concentration at formation temperatures of about 50°C in a series of sedimentary rocks. The samples used were claystone/limestones, shales, mudstones, siltstones, and medium to fine-grained sandstones. Figure 5 shows a scatter plot of these experimental diffusion coefficients (x10−11 m2/s) versus absolute permeability K (mD). Despite data dispersion, they seem to vary following a trend whose best approximation is a quadratic function. Thus a series of empirical Ds are associated to the absolute permeability values assigned to each lithology in the stratigraphic sequences of Figures 4B,C.
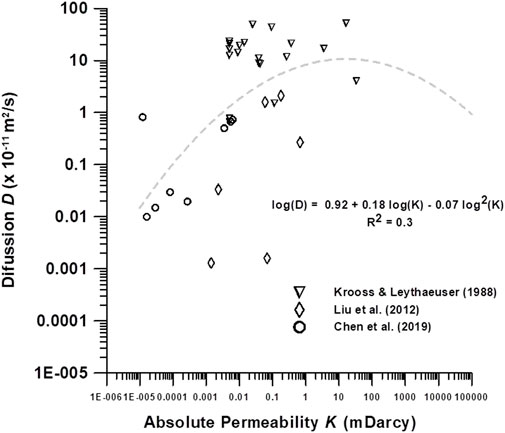
FIGURE 5. Scatter log-log plot of diffusion coefficient for methane (x 10−11 m2/s) in different rock samples (i.e., claystone/limestones, shales, mudstones, siltstones, and medium/fine-grained sandstones) versus absolute permeability values (after Krooss and Leythaeuser, 1988; Liu et al., 2012; Chen et al., 2018). The best approximation to the trend displayed by these data is the sketched quadratic function (dotted-line) used to assign empirical D values to each permeability range for the lithologies studied.
The temporal variations of methane fractions versus depth were monitored by applying Eq. 3 to the control sequences (i.e., upper values of the permeability ranges of each lithological layer) of both geological settings (Figure 6). In agreement with the boundary conditions, the normalized methane concentrations at the base of these stratigraphic columns are always one (i.e., continuous source). As time passes, there is a progressive growth of gas content at the surface of both wells, approaching saturation up to the same source’s maximum. This behavior appears to be an artifact of the model that assumes a constant methane influx at one end of the sequence without a corresponding outflow at the other end. Specifically, in BH8, a direct consequence of this conditional fact is a tendency to a gas buildup through time observed in the less permeable layers (i.e., topsoils and aquitard), contrasting with little accumulation of methane in the more permeable layers of fine sandstones.
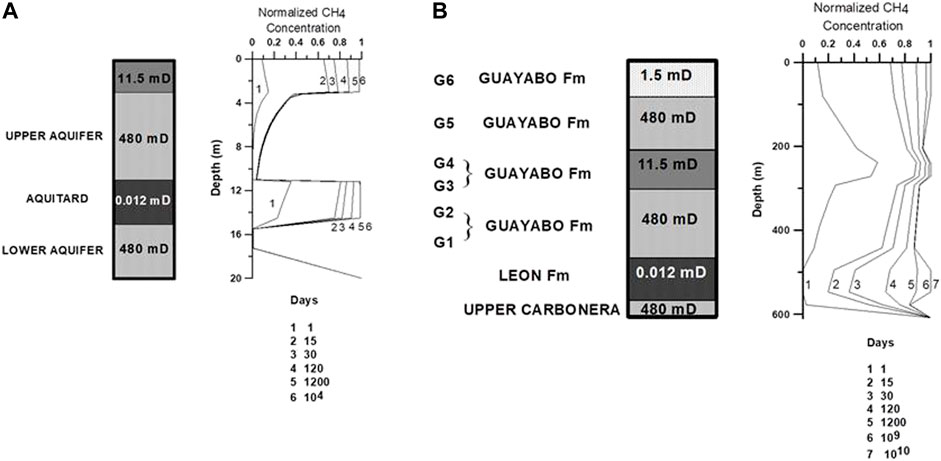
FIGURE 6. Numerical predictions of the methane fractions variations versus depth for different times (indicated by days in the legends). The examples are for the control sequences (i.e., maximum permeability values and corresponding diffusion coefficients) of (A) borehole BH8 and (B) stratigraphic well Saltarin 1A.
A qualitative inspection of Figure 6A shows no appreciable difference between the 1,200 days profile (i.e., circa 3 years) and its 27 years counterpart (i.e., the approximate landfill age). Also, in Saltarin 1A, the normalized methane concentrations in the reservoir seal (Leon Formation) shift from a low to a hump sometime between 120 and 1,200 days, followed by a trend towards gas overload afterward (Figure 6B). Therefore, it seems reasonable to roughly define a time of 1,200 days in both case studies as the approximated threshold in which the model starts to deviate appreciably from an actual situation, showing anomalous accumulations of methane.
We also tested the model’s sensitivity in BH8 and Saltarin 1A sequences, varying the absolute permeability, flow velocity, and correlative diffusion coefficients according to the empirical relationship of Figure 5. For each numerical simulation, we employed the minimum end values of the absolute permeability range (and their corresponding U and Ds) for some particular layers while keeping fixed the Ks to their respective maxima in the rest of the strata. The red arrows in Figure 7 (BH8) and 8 (Saltarin) illustrate the relative changes of K and D in each trial, for certain lithologies, compared with their previous neighboring profile (i.e., increase/arrow up or decrease/arrow down). These variations derive from the curve in Figure 5 showing that any decrease in K above its local maximum (i.e., approximately 11.5 mD) would increase D (e.g., fine-sands with absolute permeability values between 48 and 480 mD in BH8 and Saltarin 1A). Conversely, any decrease in K below 11.5 mD would be accompanied by a decrease of D (e.g., less permeable layers in Saltarin 1A). Regardless of how feasible the use of an empirical curve like the one in Figure 5 would be, the numerical results derived from the solution of Eq. 3 seem to be quite sensitive to the combined variations of the absolute permeability Ks and their corresponding diffusion coefficients Ds (e.g., Figure 8).

FIGURE 7. Examples of sensitivity checks varying the permeability of a specific lithology and its correlative U and Ds in borehole BH8. (A) Arrangement of sedimentary layers of the control sequence (i.e., maximum permeability and corresponding diffusion coefficients in all the layers), with the permeability values tested for the fine sands containing the upper aquifer (i.e., layer 2). Numerical results using (B) maximum 480 mD and (C) minimum 48 mD K values in layers 2 and 4 (and corresponding U and Ds) for 1, 15, 30 and 120 days. The red arrows besides the profiles in (C) illustrate the increase (arrow up) or decrease (arrow down) of the Ks and Ds, relative the profiles in (B), according to the empirical D/K relationship of Figure 5.
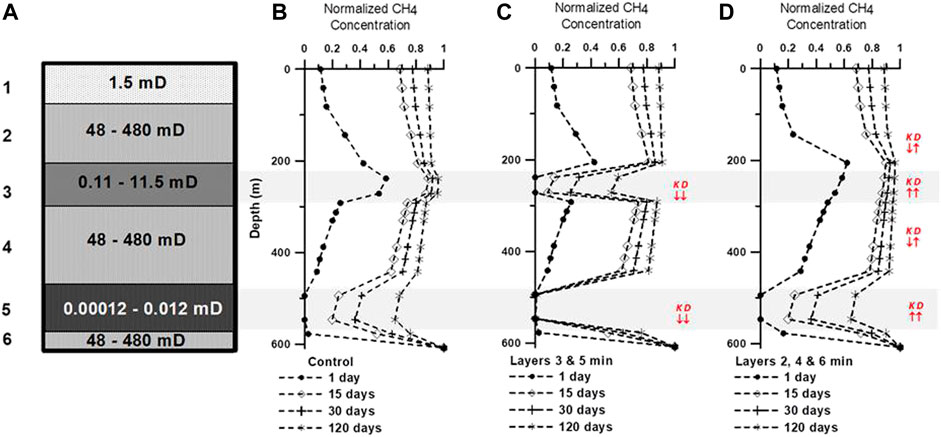
FIGURE 8. Examples of sensitivity tests in stratigraphic well Saltarin 1A varying the permeability of some specific lithologies and their correlative U and Ds. (A) Arrangement of sedimentary layers, with their possible permeability ranges. Numerical results are compared with the control sequence in (B) (i.e., maximum permeability and corresponding diffusion coefficients in all the layers) for 1, 15, 30, and 120 days. (C) Numerical results using Ks minima of 0.11 and 0.00012 mD (and corresponding U and Ds) in layers 3 and 5, respectively, and keeping the rest of the Ks fixed at their maxima values. (D) Numerical results using a K minimum of 48 mD (and corresponding U and Ds) in layers 2, 4, and 6, keeping the rest of the Ks fixed at their maxima values. The red arrows besides the profiles in (C) and (D) exemplify the increase (arrow up) or decrease (arrow down) of the Ks and Ds, relative to their previous neighboring profiles in (A) and (B), according to the empirical D/K relationship of Figure 5.
Figure 7 shows the modeled profiles of methane fractions versus depth for the BH8 control sequence in which we have tested the effects of changing the absolute permeability (and corresponding U and Ds) of layers 2 and 4. These trials were carried out for 1, 15, 30, and 120 days. There is a steady increase of gas concentrations in the fine sands between 11 and 3 m (unconfined aquifer) and 20 to 15 m (confined aquifer) for all the times checked. Moreover, these numerical results show that with a maximum absolute permeability of 480 mD we obtain, in these layers, lower biogas accumulations (Figure 7B) that those obtained by using a minimum value of 48 mD (Figure 7C) (and corresponding U and Ds). On the other hand, as time increases, the progressive buildup of methane in layer 3 could be a dam-like effect produced by the low permeability shales of the aquitard sitting between these two fine-sands layers.
The influence of the correlative changes of K and D on the computed methane concentrations for each stratigraphic layer is inferred from the results obtained for BH8 and Saltarin 1A (Figures 7, 8). In the oil well (Figure 8), the variations of these two parameters are tested, not only for the fine-sands (layers 2, 4, and 6), but also for the less permeable wet silts and shales (i.e., layers 3 and 5) and time-lapses of 1, 15, 30 and 120 days. In a typical scenario of hydrocarbon migration in water-saturated rocks, a rise in absolute permeability would bear lower accumulations of oil and gas (i.e., a more effortless gas flow through) and vice versa. Such behavior is observed in the fine sands (layers 2 and 4) of BH8 and layers 2, 4, and 6 of Saltarin 1A (Figures 7, 8), somehow counterbalanced by an opposite relative change of their corresponding diffusion coefficients (i.e., an increase or decrease in K is associated with a decrease or increase in D, respectively). However, this pattern is not the same in the wet silts and shales of Saltarin 1A, for which a rise or a lessening of the Ks yields an increase or decrease in gas accumulations, respectively (e.g., Figures 8C,D). Thus, D would be the dominant factor determining the amount of gas added to such specific lithofacies. That is, to say, the greater the diffusion, the larger the gas content regardless of the variations in K. Indeed, it has been previously suggested that diffusion is the leading mechanism in hydrocarbon microseepage for strata with low water saturation, such as layers 3 and 5 in Saltarin 1A with a given relative gas permeability of 71% (Krooss et al.,1992 a and b).
Discussion
Figure 9 shows the modeled methane profiles for BH8, along with a resistivity log obtained by inverting the geoelectric data from the surveyed line comprising this borehole (Jacome et al., 2021). A comparative analysis of the information contained in Figures 9B,C could be challenging due to the ambiguities that might arise when interpreting a resistivity log from a landfill setting. Indeed, although high to intermediate resistivity values can be considered proxies of methane buildups in dumping grounds (e.g., Dahlin et al., 2010, 2011; Rosqvist et al., 2010; Johansson et al., 2011), they could also be understood as evidence for uncontaminated saturated soils (e.g., Guerin et al., 2004; Dahlin et al., 2010; Abdulrahman et al., 2016). Likewise, low to intermediate resistivity values indicate little biogas content, leachate accumulation, and/or could be related to the clays’ electrical properties (e.g., McCarter, 1984; Siddiqui and Osman, 2012; Abdulrahman et al., 2016; Kibrian and Hossain, 2017). In any case, from approximately 11 up to 3 m, Figures 9B,C reveal a gradual rise for both the resistivity and the modeled methane fractions, coinciding with the fine sands that enclose the upper aquifer. This behavior is likely controlled by the fluid transport properties of these strata.
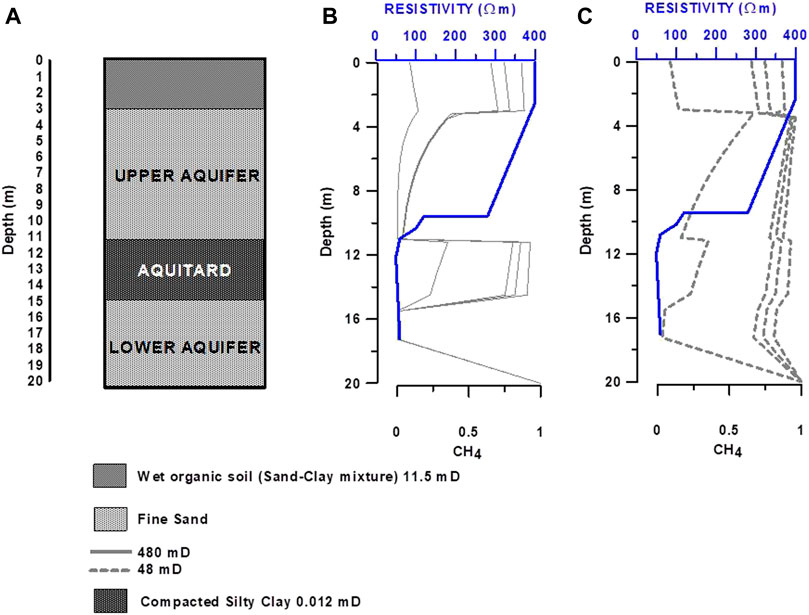
FIGURE 9. Borehole BH8: (A) Arrangement of sedimentary layers for the control sequence featuring maximum permeability values according to Figure 4. Resistivity log (solid blue line) obtained from the inverted electrical resistivity data at the cross-section of surveyed line L3 that includes BH8 (Figure 1) is compared with the methane profiles for 1, 15, 30 and 120 days in (B) and (C). (B) Comparison of the resistivity log with modeled methane profiles using permeability values of 480 mD (solid gray lines) for layers 2 and 4 containing the unconfined and confined aquifers, respectively (C) Comparison of the resistivity log with modeled methane profiles using permeability values of 48 mD (dotted gray lines) for the fine sands containing the unconfined aquifer.
On the other hand, the resistivity type-log for the Eastern Llanos Basin in Figure 2C has been used to obtain evidence for hydrocarbon microseepage and accumulation in Saltarin 1A. To correlate the stratigraphic sequence of this oil well with such a profile, we considered, as a calibration guide, the limits between the different geological formations and units precisely defined in Figures 2B,C. Assuming an almost continuous lithofacies distribution between consecutive formational boundaries, we assigned a type-resistivity value to each depth level in Saltarin 1A with a resolution of less than 1 m. Despite the approximations and assumptions made and the complexity of this stratigraphic sequence, the resistivity type-log closely follows the main trends described by the modeled methane profiles (Figure 10C). Unlike BH8, in this particular case there is a seemingly direct relationship between low resistivity values and a low concentration of hydrocarbons and vice versa.
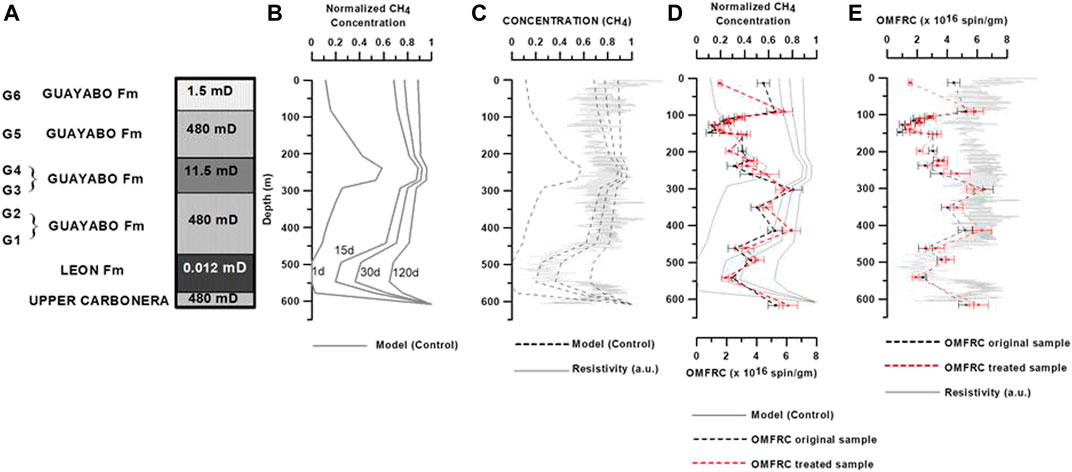
FIGURE 10. Stratigraphic well Saltarin 1A: (A) Arrangement of sedimentary layers for the control sequence featuring maximum permeability values. (B) Numerical results of methane distributions versus depth for timespans of 1, 15, 30, and 120 days. (C) Resistivity type-log (arbitrary units) of the Eastern Llanos Basin (from Figure 2B after Barrero et al., 2007) correlated with the stratigraphic sequence of Saltarin 1A and compared with the numerical results of methane distributions versus depth. (D) OMFRC for both chloroform-treated and untreated samples compared with the numerical results of methane distributions versus depth. (E) Resistivity type-log for the Eastern Llanos Basin compared with the OMFRC profiles.
Additional evidence for hydrocarbons microseepage in Saltarin 1A comes from the OMFRC profile that would have resulted from the oil upwards migration throughout the sedimentary sequence (Figure 10D). Molecular sizes of around 10−9 m for water and methane (thermogenic and biogenic) are slightly larger than the tiniest shale pores, and considerably smaller than oil colloids and other hydrocarbon particles, covering a wide size range of pore dimensions from approximately 10−9 to 10−6 m (Matthews, 1996). Thus, a selective leakage of the different petroleum phases through the porous media would be expected. According to the model proposed by Matthews (1996), in the final post-expulsion stage of the hydrocarbon movement into a carrier rock, the oil, and gas might stay together by constant re-equilibration. Still, they will eventually become detached from each other and accumulate in specific porous media due to their different molecular sizes, which constrain their potential migration pathways and transport velocities.
Regardless of the possible lag offs in the vertical movement towards the surface of these two hydrocarbon phases, the OMFRCs and the methane curves seem to vary in like fashion from the bottom of the sequence up to approximately 300 m (Figure 10D). Indeed, these profiles show an increasing tendency in this depth interval from the Leon to the base of the Guayabo Formations (i.e., G1/G2). Further up, there is a pronounced decrease in OMFR concentrations, beginning at, approximately, 300 m and reaching a minimum value at about 150 m. Conversely, the modeled methane curves display a relatively moderate decline that starts at 200 m and continues up to the top of the sequence. Since the fluid transport properties of the strata control the modeled distribution of methane versus depth, it could be argued that, at least for the interval between 600 and 300 m, the OMFRC profiles would also reflect the different lithological contrasts through which the microseepage of hydrocarbons has taken place. However, for the top 300 m, the correlation between these profiles does not seem to be straightforward, possibly due to other factors as chemical-mediated changes that might be intervening in defining the distribution pattern of OMFR concentrations versus depth.
It is particularly noticeable that, within these upper 300 m, the OMFRC curves show a conspicuous void between 100 and 150 m (Figures 11A,B). Such a feature also defines a stripe characterized by peaks of magnetic susceptibility and EOM values (Figure 11C), where an appropriated thermochemical environment, together with the presence of hydrocarbons in pore waters, might have induced local chemical changes in the redox conditions of these rather homogeneous lithofacies (Machel, 1995; Costanzo-Álvarez et al., 2000). This result agrees with previous interpretations of hydrocarbon-mediated near-surface anomalies of magnetic susceptibility, suggesting that highly reactive OMFRs would act as reducing agents that yield electrons to the Fe3+, with the consequent formation of high susceptibility Fe2+ magnetic minerals (e.g., Díaz et al., 2000; Aldana et al., 2003; Costanzo-Álvarez et al., 2006; Costanzo-Alvarez et al., 2019). It has been demonstrated that these anomalies are not usually associated with identifiable lithological contrasts (Costanzo-Álvarez et al., 2000; Guzmán et al., 2011). Providing that most electrons from the OMFRs were exhausted during this process, those depth levels with the lowest OMFRs concentrations would coincide with peaks of EOM and the presence of Fe oxides and sulfides with high magnetic susceptibility values (Figure 11C).
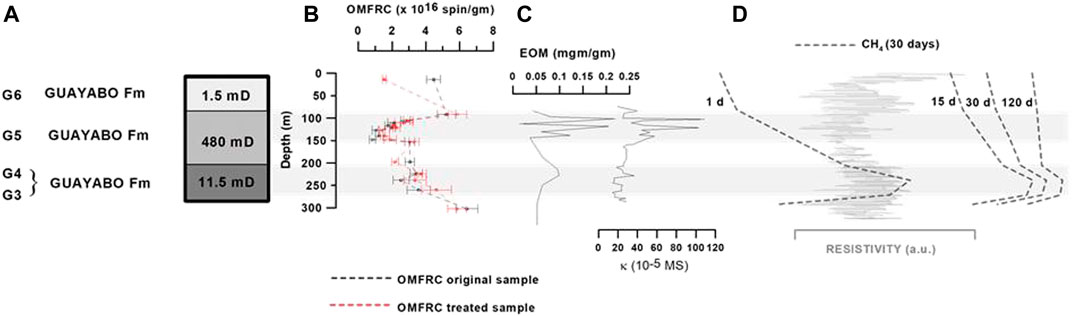
FIGURE 11. Profiles corresponding to the upper Guayabo Formation in Saltarin 1A (i.e., units G3/G4, G5, and G6) that compare: (A) Control sequence (B) Concentrations of organic matter free radicals (chloroform-treated and untreated samples) for the depth interval between 0 and 300 m (C) EOM and magnetic susceptibility anomalies from Figures 3A,C for a depth interval between 100 and 300 m corresponding to a near-surface reducing zone that coincides with a void in the OMFRC profile. (D) Upper (0 and 300 m) section of the resistivity type-log in arbitrary units (a.i.) for the Eastern Llanos Basin compared with the modeled methane profile (control sequence 1, 15, 30 and 120 days). The gray stripes show the two depth intervals in which redox reactions appear to be triggered (i.e., G3/G4) and reach the maximum generation of EOM and Fe-oxides and/or sulfides (upper G5).
Moreover, between 271.5 and 205.5 m (G3/G4 wet silts), Figure 11D shows an anomaly in the modeled methane profiles that coincides with a peak in the resistivity log and small humps in the EOM and the magnetic susceptibility curves. These features suggest that the electron transfer from the EOM was first triggered at such depth levels, favored perhaps by the combination of appropriate thermochemical conditions and the fluid transport properties of the low-permeability strata. The petroleum migrating above G3/G4 might have been progressively depleted the OMFRs, reaching a minimum concentration at the 150–100 m band, where the maximum redox activity appears to have occurred, as described before, independently of the lithology. Beyond 100 m, up to the surface, the OMFRC and resistivity profiles follow similar trends outlining the lithological contrasts between G5 and G6 (Figures 11A,B,D). However, this trend is not entirely replicated by the methane modeled profile. The effect of near-surface hydrocarbon-mediated changes in the primary Fe-oxides and sulfides, controlled by the fluid transport properties of these hydrocarbon-bearing rocks, might be responsible for the resulting trends in the OMFRC profiles and their departure from the modeled methane distribution throughout the top 300 m of this sequence. These results also reveal that, while the OMFRC and resistivity profiles could be considered as primary indicators of hydrocarbon microseepage, the EOM and magnetic susceptibility likely stand as secondary evidence reflecting chemical changes.
Conclusion
Direct numerical simulations of methane microseepage through multiple layers of soils and sediments were performed using a time-dependent one-dimensional convection advection equation, for two different geological settings corresponding to a landfill’s monitoring borehole and an oil well. The results obtained were compared with field evidence for hydrocarbons microseepage in each geological setting considered. The main concluding remarks derived from this work are:
• In both case studies, the synthetic methane profiles properly correlate with the resistivity data considered as direct proxies of hydrocarbon accumulation. The complexities inherent in these two examples and/or the assumptions and approximations used to conduct a direct modeling of methane microseepage, should be taken into account to extend these results to other geological settings.
• In Saltarin 1A, the residual OMFRC are also used as proxies of petroleum microseepage. Modeled methane logs closely follow the main trends displayed by the OMFRC profiles at those depth ranges where there is no evidence of hydrocarbon-induced chemical changes. Along the whole depth range, minor mismatches could be the result of possible differences between gas and oil mobility.
• Comparisons between field evidence and numerical modeling predictions of the vertical methane migration show that both microseepage and hydrocarbon accumulations are mostly skillful by the fluid transport properties of the different rock types contained in BH8 and Saltarin 1A.
• In Saltarin 1A, EOM and magnetic susceptibility anomalies appear to stand as a different kind of evidence for microseepage, resulting from hydrocarbon-mediated changes in the redox environment of relatively uniform strata.
The results of this study reveal that some near-surface magnetic and geochemical anomalies are vertical projections of deeper hydrocarbon sources, useful in reconnaissance surveys to map the spatial distribution of leachate plumes or oil reservoirs.
Data Availability Statement
The raw data supporting the conclusions of this article will be made available by the authors, without undue reservation.
Author Contributions
We the undersigned declare that the manuscript Comparing Direct Numerical Modeling Predictions With Field Evidence for Methane Vertical Microseepage in Two Geological Settings is original, has not been published before and is not currently being considered for publication elsewhere. We confirm that the manuscript has been read and approved by all named authors and that there are no other persons who satisfied the criteria for authorship but are not listed. The first draft of the manuscript was written by Vincenzo Costanzo-Alvarez and all authors commented on previous versions of the manuscript. We further confirm that the order of authors listed in the manuscript has been approved by all of us. We understand that the Corresponding Author is the sole contact for the Editorial process. He is responsible for communicating with the other authors about progress, submissions of revisions and final approval of proofs.
Funding
This research was partially funded by Humber College Applied Research & Innovation and, the Natural Sciences and Engineering Research Council of Canada (NSERC) through an Engage and a Discovery grant.
Conflict of Interest
The authors declare that the research was conducted in the absence of any commercial or financial relationships that could be construed as a potential conflict of interest.
Publisher’s Note
All claims expressed in this article are solely those of the authors and do not necessarily represent those of their affiliated organizations, or those of the publisher, the editors and the reviewers. Any product that may be evaluated in this article, or claim that may be made by its manufacturer, is not guaranteed or endorsed by the publisher.
Acknowledgments
Robert McCullough and Laura Barret, from the Office of Solid Waste Management at Simcoe County, shared with us valuable information about the landfill in southern Ontario and provided access to the site and boreholes. Borehole GR data were acquired by Pamela Patraskovic and Chris Drielsma from DGI Geoscience Inc. (Toronto, Canada). Alejandro Mora (Hocol S.A., Bogotá) and German Bayona (Corporacion Geologica ARES, Bogota) provided the samples and valuable information from the oil well Saltarin 1A.
References
Abdulrahman, A., Nawawi, M., Saad, R., Abu-Rizaiza, A. S., Yusoff, M. S., Khalil, A. E., et al. (2016). Characterization of Active and Closed Landfill Sites Using 2D Resistivity/IP Imaging: Case Studies in Penang, Malaysia. Environ. Earth Sci. 75, 347. doi:10.1007/s12665-015-5003-5
Abubakar, R., Muxworthy, A. R., Fraser, A., Sephton, M. A., Watson, J. S., Heslop, D., et al. (2020). Mapping Hydrocarbon Charge-Points in the Wessex Basin Using Seismic, Geochemistry and Mineral Magnetics. Mar. Petrol. Geol. 111, 510–528. doi:10.1016/j.marpetgeo.2019.08.042
Aderibigbe, A. I., Samuel, I., Adetokun, B., and Tobi, S. (2017). Monte Carlo Simulation Approach to Soil Layer Resistivity Modelling for Grounding System Design. Int. J. Appl. Eng. Res. 12 (23), 13759–13766.
Aldana, M., Costanzo-Alvarez, V., and Díaz, M. (2003). Magnetic and Mineralogical Studies to Characterize Oil Reservoirs in Venezuela. Lead. Edge 22, 526–529. doi:10.1190/1.1587674
Anderson, J., Romanak, K., Alfi, M., and Hovorka, S. (2019). Light Hydrocarbon and Noble Gas Migration as an Analogue for Potential CO 2 Leakage: Numerical Simulations and Field Data from Three Hydrocarbon Systems. Greenh. Gas. Sci. Technol. 9, 226–244. doi:10.1002/ghg.1841
Arigala, S. G., Tsotsis, T. T., Webster, I. A., Yortsos, Y. C., and Kattapuram, J. J. (1995). Gas Generation, Transport, and Extraction in Landfills. J. Environ. Eng. 121, 33–44. doi:10.1061/(asce)0733-9372(1995)121:1(33)
Barrero, D., Pardo, A., Vargas, C. A., and Martínez, J. F. (2007). Colombian Sedimentary Basins: Nomenclature, Boundaries and Petroleum Geology, a New Proposal. Colombia: Agencia Nacional de Hidrocarburos (ANH) Bogota, 91.
Bayona, G., Valencia, A., Mora, A., Rueda, M., Ortiz, J., and Montenegro, O. (2008). Estratigrafia y procedencia de las rocas del Mioceno en la parte distal de la cuenca antepais de los Llanos de Colombia. Geol. Colomb. 33, 23–46. doi:10.15446/gc
Brown, A. (2000). Evaluation to the Possible Mechanism of Gas Microseepage. Am. Assoc. Pet. Geol. Bull. 84 (11), 1175–1189. doi:10.1306/8626C389-173B-11D7-8645000102C1865D
Chen, J., Deng, C., and Wang, H. (2009). A Comparison of Geochemical Features of Extracts from Coal-Seams Source Rocks with Different Polarity Solvents. Energy Explor. Exploitation Exploit 27 (1), 29–46. doi:10.1260/014459809788708228
Chen, S., Chen, S., Clementine, U., Liu, Y., and Zhang, C. (2018). Reservoir Diffusion Properties of the Longmaxi Shale in Shizhu Area, Southern Sichuan Basin, China. Energy Explor. Exploitation 36, 1086–1102. doi:10.1177/0144598717751182
Chen, Y. C., Wu, C. H., and Hu, H. Y. (2000). Numerical Simulation of Gas Emission in a Sanitary Landfill Equipped with a Passive Venting System. J. Environ. Sci. Health, Part A 35 (9), 1735–1747. doi:10.1080/10934520009377067
Chevillard, S. (2012). The Functions Erf and Erfc Computed with Arbitrary Precision and Explicit Error Bounds. Inf. Comput. 216, 72–95. doi:10.1016/j.ic.2011.09.001
Clark, J. J., Qian, Q., Voller, V. R., and Stefan, H. G. (2018). Hyporheic Exchange in a Gravel Bed Flume with and without Traveling Surface Waves. Adv. Water Resour. 123, 120–133. doi:10.1016/j.advwatres.2018.11.005
Clayton, C. J., and Dando, P. R. (1996). Comparison of Seepage and Seal Leakage Rates. In Hydrocarbon Migration and its Near-Surface Expression: AAPG Mem 66. Editors D. Schumacher, and M. A. Abrams, Tulsa, Oklahoma, U.S.A: The American Association of Petroleum Geologists, 169–171.doi:10.1306/m66606c13
Cogoini, M. (1997). Soil Magnetic Susceptibility Anomalies At A Landfill: Investigating Their Occurrence and Origin. Graduate College, Norman, Oklahoma: Master of Science Thesis, University of Oklahoma, 60.
Conant, B. H., Gillham, R. W., and Mendoza, C. A. (1996). Vapor Transport of Trichloroethylene in the Unsaturated Zone: Field and Numerical Modeling Investigations. Water Resour. Res. 32 (1), 9–22. doi:10.1029/95wr02965
Costanzo-Álvarez, V., Aldana, M., Bayona, G., López-Rodriguez, D., and Blanco, J. M. (2012). Rock Magnetic Characterization of Early and Late Diagenesis in a Stratigraphic Well from the Llanos Foreland Basin (Eastern Colombia). In Remagnetization and Chemical Alteration of Sedimentary Rocks. Geol. Soc. Spec. Publ 371. Editors R. D. Elmore, A. R. Muxworthy, M. Aldana, and M. Mena Bath, UK: Geological Society Publishing House, 199–216.
Costanzo-Álvarez, V., Aldana, M., Aristiguieta, O., Marcano, M., and Aconcha, E. (2000). Study of Magnetic Contrast in the Guafita Oil Field (Southwestern Venezuela). Phys. Chem. Earth 25, 437–445. doi:10.1016/S1464-1895(00)00068-5
Costanzo-Álvarez, V., Aldana, M., Díaz, M., Bayona, G., and Ayala, C. (2006). Hydrocarbon-induced Magnetic Contrasts in Some Venezuelan and Colombian Oil Wells. Earth Planets Space 58, 1401–1410. doi:10.1186/BF03352636
Costanzo-Álvarez, V., Rapalini, A., Aldana, M., Díaz, M., Kietzmann, D., Iglesia-Llanos, M. P., et al. (2019). A Combined Rock-Magnetic and EPR Study about the Effects of Hydrocarbon-Related Diagenesis on the Magnetic Signature of Oil Shales (Vaca Muerta Formation, Southwestern Argentina). J. Pet. Sci. Eng. 173, 861–879. doi:10.1016/j.petrol.2018.10.082
Dahlin, T., Rosqvist, H., Johansson, S., Mansson, C.-H., Svensson, M., Lindsjo, M., et al. (2011). Geoelectrical Monitoring for Mapping of Gas and Water Migration in Landfills. Berichte Geol. 93, 260–264.
Dahlin, T., Rosqvist, H., and Leroux, V. (2010). Resistivity-IP Mapping for Landfill Applications. First Break 28, 101–105. doi:10.3997/1365-2397.28.8.40742
De Schampheleire, S., De Kerpel, K., Ameel, B., De Jaeger, P., Bagci, O., and De Paepe, M. (2016). A Discussion on the Interpretation of the Darcy Equation in Case of Open-Cell Metal Foam Based on Numerical Simulations. Materials 9 (6), 409. doi:10.3390/ma9060409
Dewaele, P. (2019). Flos North Landfill – Simcoe County Waste Disposal Site #5 2018 Annual Report. Toronto: Golder Associates, Ltd., 744.
Díaz, M., Aldana, M., Costanzo-Álvarez, V., Silva, P., and Perez, A. (2000). EPR and Magnetic Susceptibility Studies in Well Samples from Some Venezuelan Oil Fields. Phys. Chem. Earth 25, 447–453. doi:10.1016/S1464-1895(00)00069-7
Donovan, T. J., Hendricks, J. D., Roberts, A. A., and Eliason, P. T. (1984). Low‐altitude Aeromagnetic Reconnaissance for Petroleum in the Arctic National Wildlife Refuge, Alaska. Geophysics 49, 1338–1353. doi:10.1190/1.1441760
El-Fadel, M., Findikakis, A. N., and Leckie, J. O. (1996a). Numerical Modelling of Generation and Transport of Gas and Heat in Landfills I Model Formulation. Waste Manag. Res. 14, 483–504. doi:10.1177/0734242x9601400506
El-Fadel, M., Findikakis, A. N., and Leckie, J. O. (1996b). Numerical Modelling of Generation and Transport of Gas and Heat in Sanitary Landfills II. Model Application. Waste Manag. Res. 14, 537–551. doi:10.1177/0734242x9601400603
Ellwood, B. B., and Burkart, B. (1996). Test of Hydrocarbon-Induced Magnetic Patterns in Soils: the Sanitary Landfill as Laboratory. In Hydrocarbon Migration and its Near-Surface Expression: AAPG Mem 66. Editors D. Schumacher, and M. A. Abrams, Tulsa, Oklahoma, U.S.A: The American Association of Petroleum Geologists, 91–98.
Elmore, R. D., Imbus, S. W., Engel, M. H., and Fruit, D. (1993). Hydrocarbons and Magnetizations in Magnetite. Appl. Paleomagnetism Sediment. Geol. 49, 181–191. SEPM Spec. Publ. doi:10.2110/pec.93.49.0181
Emmerton, S., Muxworthy, A. R., Sephton, M. A., Aldana, M., Costanzo-Alvarez, V., Bayona, G., et al. (2013). Correlating Biodegradation to Magnetization in Oil Bearing Sedimentary Rocks. Geochimica Cosmochimica Acta 112, 146–165. doi:10.1016/j.gca.2013.03.008
Evirgen, B., Onu, M. I., Tuncan, M., and Tuncan, A. (2015). Determination of the Freezing Effect on Unconfined Compression Strength and Permeability of Saturated Granular Soils. Int. J. GEOMATE 8, 1283–1287. doi:10.21660/2015.16.4369
Foote, R. S. (1996). Relationship of Near-Surface Magnetic Anomalies to Oil-And Gas-Producing Area, Hydrocarbon Migration and its Near-Surface Expression. In Hydrocarbon Migration and its Near-Surface Expression: AAPG Mem 66. Editors D. Schumacher, and M. A. Abrams, Tulsa, Oklahoma, U.S.A: The American Association of Petroleum Geologists, 111–126.
Guérin, R., Munoz, M. L., Aran, C., Laperrelle, C., Hidra, M., Drouart, E., et al. (2004). Leachate Recirculation: Moisture Content Assessment by Means of a Geophysical Technique. Waste Manag. 24, 785–794. doi:10.1016/j.wasman.2004.03.010
Guzmán, O., Costanzo-Álvarez, V., Aldana, M., and Díaz, M. (2011). Study of Magnetic Contrasts Applied to Hydrocarbon Exploration in the Maturín Sub-basin (Eastern Venezuela). Studia Geophys Geod 55, 359–376. doi:10.1007/s11200-011-0020-7
Hall, S. A., and Evans, I. (1995). Palaeomagnetic and Rock Magnetic Properties of Hydrocarbon Reservoir Rocks from the Permian Basin, Southeastern New Mexico, USA. Geol. Soc. Lond. Spec. Publ. 98 (1), 79–95. doi:10.1144/gsl.sp.1995.098.01.05
Hou, L., Luo, X., Lin, S., Zhao, Z., and Li, Y. (2021). Quantitative Measurement of Retained Oil in Organic-Rich Shale-A Case Study on the Chang 7 Member in the Ordos Basin, China. Front. Earth Sci. 9, 662586. doi:10.3389/feart.2021.662586
Jacome, M., Costanzo-Alvarez, V., Aldana, M., Patraskovic, P., Drielsma, C., Galatro, D., et al. (2021). A Methodology to Characterize a Sanitary Landfill Combining, through a Numerical Approach, a Geoelectrical Survey with Methane Point-Source Concentrations. Environ. Technol. Innovation 21, 101225. doi:10.1016/j.eti.2020.101225
Jaiswal, D. K., Kumar, A., and Yadav, R. R. (2011). Analytical Solution to the One-Dimensional Advection-Diffusion Equation with Temporally Dependent Coefficients. J. Water Resour. Prot. 03 (01), 76–84. doi:10.4236/jwarp.2011.31009
Johansson, S., Rosqvist, H., Svensson, M., Dahlin, T., and Leroux, V. (2011). An Alternative Methodology for the Analysis of Electrical Resistivity Data from a Soil Gas Study. Geophys. J. Int. 186, 632–640. doi:10.1111/j.1365-246x.2011.05080.x
Jones, V. T., and Burtell, S. G. (1996). Hydrocarbon Flux Variations in Natural and Antrhopogenic Seeps. In Hydrocarbon Migration and its Near-Surface Expression: AAPG Mem 66. Editors D. Schumacher, and M. A. Abrams, Tulsa, Oklahoma, U.S.A., 203–221.
Kibria, G., and Hossain, S. (2019). Electrical Resistivity of Compacted Clay Minerals. Environ. Geotech. 6, 18–25. doi:10.1680/jenge.16.00005
Klusman, R. W., and Saeed, M. A. (1996). Comparison of Light Hydrocarbon Microseepage Mechanisms. In Hydrocarbon Migration and its Near-Surface Expression: AAPG Mem 66. Editors D. Schumacher, and M. A. Abrams, Tulsa, Oklahoma, U.S.A: The American Association of Petroleum Geologists, 157- 168.doi:10.1306/m66606c12
Kroos, B. M., and Leythaeuser, D., (1996). Molecular Diffusion of Light Hydrocarbons in Sedimentary Rocks and its Role in Migration and Dissipation of Natural Gas. In Hydrocarbon Migration and its Near-Surface Expression: AAPG Mem 66. Editors D. Schumacher, and M. A. Abrams, Tulsa, Oklahoma, U.S.A: The American Association of Petroleum Geologists, 173–183.doi:10.1306/m66606c14
Krooss, B. M., and Leythaeuser, D. (1988). Experimental Measurements of the Diffusion Parameters of Light Hydrocarbons in Water-Saturated Sedimentary Rocks-II. Results and Geochemical Significance. Org. Geochem. 12 (2), 91–108. doi:10.1016/0146-6380(88)90247-1
Krooss, B. M., Leythaeuser, D., and Schaefer, R. G. (1992). The Quantification of Diffusive Hydrocarbon Losses through Cap Rocks of Natural Gas Reservoirs—A Reevaluation. Am. Assoc. Pet. Geol. Bull. 76, 403–406. doi:10.1306/bdff8af6-1718-11d7-8645000102c1865d
Lee, J., Rollin, J. B., and Spivey, J. P. (2003). Pressure Transient Testing (SPE Textbook) (Paperback; 2003-12. United States of America: SPE Textbook Series.9.
Liu, G., Zhao, Z., Sun, M., Li, J., Hu, G., and Wang, X. (2012). New Insights into Natural Gas Diffusion Coefficient in Rocks. Petroleum Explor. Dev. 39 (5), 597–604. doi:10.1016/s1876-3804(12)60081-0
Liu, Q., Liu, Q., Chan, L., Yang, T., Xia, X., and Cheng, T. (2006). Magnetic Enhancement Caused by Hydrocarbon Migration in the Mawangmiao Oil Field, Jianghan Basin, China. J. Petroleum Sci. Eng. 53, 25–33. doi:10.1016/j.petrol.2006.01.010
Machel, H. G. (1995). Magnetic Mineral Assemblages and Magnetic Contrasts in Diagenetic Environments - with Implications for Studies of Palaeomagnetism, Hydrocarbon Migration and Exploration. Geol. Soc. Lond. Spec. Publ. 98 (1), 9–29. doi:10.1144/gsl.sp.1995.098.01.02
Martín, S., MarañóN, E., and Sastre, H. (2001). Mathematical Modelling of Landfill Gas Migration in MSW Sanitary Landfills. Waste Manag. Res. 19 (5), 425–435. doi:10.1177/0734242x0101900507
Matthews, M. D., (1996). Migration – A View from the Top. In Hydrocarbon Migration and its Near-Surface Expression: AAPG Mem 66. Editors D. Schumacher, and M. A. Abrams, Tulsa, Oklahoma, U.S.A: The American Association of Petroleum Geologists, 139–155.
McCarter, W. J. (1984). The Electrical Resistivity Characteristics of Compacted Clays. Géotechnique 34, 263–267. doi:10.1680/geot.1984.34.2.263
Mena, M., and Walther, A. M. (2012). Rock Magnetic Properties of Drill Cutting from a Hydrocarbon Exploratory Well and Their Relationship to Hydrocarbon Presence and Petrophysical Properties. Geol. Soc. Lond. Spec. Publ. 371 (1), 217–228. doi:10.1144/sp371.14
Michaels, K. (2007). “IEEE Recommended Practice for Grounding of Industrial and Commercial Power Systems,” in IEEE Recommended Practice for Grounding of Industrial and Commercial Power Systems IEEE Std 142-2007 (New York, USA: The Institute of Electrical and Electronics Engineers Inc.), 161–182. doi:10.1109/IEEESTD.2007.4396963
Monin, J. C., Barth, D., Perrut, M., Espitalié, M., and Durand, B. (1988). Extraction of Hydrocarbons from Sedimentary Rocks by Supercritical Carbon Dioxide. Org. Geochem 13 (4-6), 1079–1086. doi:10.1016/0146-6380(88)90292-6
Moore, M. T., Vinson, D. S., Whyte, C. J., Eymold, W. K., Walsh, T. B., and Darrah, T. H. (2018). Differentiating between Biogenic and Thermogenic Sources of Natural Gas in Coalbed Methane Reservoirs from the Illinois Basin Using Noble Gas and Hydrocarbon Geochemistry. Geol. Soc. Lond. Spec. Publ. 468 (1), 151–188. doi:10.1144/sp468.8
Moretti, I. C., Mora, W., Zamora, M., Valendia, M., Mayorga, G., and Rodriguez, G. (2009). Petroleum System Variations in the Llanos Basin (Colombia). X Simposio Bolivariano Exploración Petrolera en Cuencas Subandinas. Cartagena, Colombia: Asociacion Colombiana de Geologos y Geofisicos del Petroleo (ACGGP).
Nastev, M., Therrien, R., Lefebvre, R., and Gélinas, P. (2001). Gas Production and Migration in Landfills and Geological Materials. J. Contam. Hydrol. 52 (1-4), 187–211. doi:10.1016/s0169-7722(01)00158-9
Palmer, S. E., and Russell, J. A. (1988). The five oil families of the Llanos Basin. III Simposio Bolivariano de Exploración Petrolera en las Cuencas Subandinas. Venezuela: Caracas, 724–754.
Radke, M., Sittardt, H. G., and Welte, D. H. (1978). Removal of Soluble Organic Matter from Rock Samples with a Flow-Through Extraction Cell. Anal. Chem. 50 (4), 663–665. doi:10.1021/ac50026a035
Reynolds, R. L., Fishman, N. S., Wanty, R. B., and Goldhaber, M. B. (1990). Iron Sulfide Minerals at Cement Oil Field, Oklahoma: Implications for Magnetic Detection of Oil Fields. Geol. Soc. Am. Bull. 102, 368–380. doi:10.1130/0016-7606(1990)102<0368:ismaco>2.3.co;2
Rijal, M. L., Porsch, K., Appel, E., and Kappler, A. (2012). Magnetic Signature of Hydrocarbon-Contaminated Soils and Sediments at the Former Oil Field Hänigsen, Germany. Stud. Geophys Geod. 56, 889–908. doi:10.1007/s11200-010-0040-8
Rosqvist, H., Leroux, V., Dahlin, T., Svensson, M., Lindsjo, M., Månsson, C.-H., et al. (2010). Mapping Landfill Gas Migration Using Resistivity Monitoring. Proc. Inst. Civil Eng. -. Waste Res. manage. 164 (1), 3–15. doi:10.1680/warm.2011.164.1.3
Saunders, D., Burson, K., and Thompson, C. K. (1991). Observed Relation of Soil Magnetic Susceptibility and Soil Gas Hydrocarbon Analyses to Subsurface Hydrocarbon Accumulations. Am. Assoc. Pet. Geol. Bull. 55, 344–353.
Schumacher, D., (1996). Hydrocarbon-induced Alteration of Soils and Sediments. In Hydrocarbon Migration and its Near-Surface Expression: AAPG Mem 66 Tulsa. Editors D. Schumacher, and M. A. Abrams, Oklahoma, U.S.A., 71–89.doi:10.1306/m66606c6
Siddiqui, F. I., and Osman, S. B. h. A. B. S. (2012). Integrating Geo-Electrical and Geotechnical Data for Soil Characterization. Ijapm 2, 104–106. doi:10.7763/ijapm.2012.v2.63
Stolper, D. A., Martini, A. M., Clog, M., Douglas, P. M., Shusta, S. S., Valentine, D. L., et al. (2015). Distinguishing and Understanding Thermogenic and Biogenic Sources of Methane Using Multiply Substituted Isotopologues. Geochimica Cosmochimica Acta 161, 219–247. doi:10.1016/j.gca.2015.04.015
UPME Unidad de Planeación Minero Energética (2013). Balance de Gas Natural en Colombia 2015-2023. Available at: https://www1.upme.gov.co/Hidrocarburos/publicaciones/BALANCE_GAS_NATURAL_FINAL.pdf (Accessed July, 2021).
Wang, C. K. (2012). A Gas Generation, Migration and Extraction Model for Landfills (Unpublished Master's Thesis). Calgary, AB: University of Calgary. doi:10.11575/PRISM/4779
Wang, G., Tang, Y., Cheng, T., Tang, J., Fan, M., and Lu, L. (2016). Laboratory Simulation of the Formation Process of Surface Geochemical Anomalies Applied to Hydrocarbon Exploration. Acta Geol. Sin. - Engl. Ed. 90 (6), 2149–2162. doi:10.1111/1755-6724.13028
Yen, T. F., Erdman, J. G., and Saraceno, A. J. (1962). Investigation of the Nature of Free Radicals in Petroleum Asphaltenes and Related Substances by Electron Spin Resonance. Anal. Chem. 34, 694–700. doi:10.1021/ac60186a034
Keywords: methane microseepage, advection-diffusion equation, hydrocarbon-induced diagenesis, electron paramagnetic resonance, resistivity log, organic matter free radical, extractable organic matter
Citation: Costanzo-Álvarez V, Mendoza J, Aldana M, Jacome M, Díaz M, Ramirez K and Amon CH (2022) Comparing Direct Numerical Modeling Predictions With Field Evidence for Methane Vertical Microseepage in Two Geological Settings. Front. Earth Sci. 10:940799. doi: 10.3389/feart.2022.940799
Received: 10 May 2022; Accepted: 20 June 2022;
Published: 09 August 2022.
Edited by:
Adrian R. Muxworthy, Imperial College London, United KingdomCopyright © 2022 Costanzo-Álvarez, Mendoza, Aldana, Jacome, Díaz, Ramirez and Amon. This is an open-access article distributed under the terms of the Creative Commons Attribution License (CC BY). The use, distribution or reproduction in other forums is permitted, provided the original author(s) and the copyright owner(s) are credited and that the original publication in this journal is cited, in accordance with accepted academic practice. No use, distribution or reproduction is permitted which does not comply with these terms.
*Correspondence: Vincenzo Costanzo-Álvarez, di5jb3N0YW56b0B1dG9yb250by5jYQ==