 Xiehui Li
 Zifan Chen2,1
- 1Plateau Atmosphere and Environment Key Laboratory of Sichuan Province, School of Atmospheric Sciences, Chengdu University of Information Technology, Chengdu, China
- 2Shiyan Meteorological Bureau, Shiyan, China
Southwest China, which is close to the Qinghai-Tibet Plateau, presents complex topography. As a result of the combined influence of the South Asian monsoon, East Asian monsoon, and plateau monsoon, climate in this region is unique. Since Southwest China is one of the areas where extreme weather events occur more frequently, this region is sensitive and vulnerable to climate change. In the present research, daily temperature from 1969 to 2020 recorded at 93 weather stations in Southwest China, and data from nine models for the period 1995 to 2040 were used in CMIP6 (Coupled Model Intercomparison Project Phase 6) to calculate 17 ETIs (Extreme Temperature Indices). Furthermore, we analyzed and compared the annual change rate, temporal and spatial change trend, and mean change of extreme temperature events in Southwest China and four subzones during historical period and under SSP2-4.5 scenario for the next 20 years. The results showed: 1) The 8 ECTIs (Extreme Cold Temperature Indices) and the 8 EWTIs (Extreme Warm Temperature Indices) in 1969–2020 were corroborated. These results indicated a warming trend. Also, DTR (Diurnal temperature range) showed a decreasing trend, and different degrees of warming were observed in the four subzones. 2) From 2021 to 2040 and under the SSP2-4.5 scenario, the annual rates of change for 17 ETIs in Southwest China showed that extreme cold events will continue to decrease. On the other hand, extreme warm events will continue to increase. 3) Under the SSP2-4.5 scenario in the next 20 years, CSDI (cold spell duration indicator) will decrease, while WSDI (warm spell duration indicator), TMINmean (average daily minimum temperature), and TMAXmean (average daily maximum temperature) will increase. Moreover, the decrease in amplitude of CSDI was smaller than the increase in amplitude of WSDI. Also, the increase in amplitude of TMINmean was slightly smaller than that of TMAXmean. The projected WSDI, TMINmean, and TMAXmean obtained with the preferred three models and MEM-9 (nine-Model Ensemble Mean) showed an overall growing trend with respect to space; however, the increased range fluctuated in different regions. 4) In 2021–2040, mean values of 4 ETIs in different subzones indicated that the lowest TMINmean and TMAXmean were observed in the ZP (Zoigê Plateau), the highest in the YGP (Yunnan-Guizhou Plateau), and intermediate higher in the SB (Sichuan Basin). Compared with the 4 ETI mean values corresponding to 1969–2020, the persistence and average state of extreme cold and warm events in different subzones showed that future change trends depend on altitude.
1 Introduction
Working Group I contribution to the Sixth Assessment Report (AR6) of IPCC (Intergovernmental Panel on Climate Change) states that global average surface temperature in the past 10 years (2011–2020) increased by 1.09 [0.95–1.20] °C as compared with that from 1850 to 1900. From 2003 to 2012 (the historical period of the Fifth Assessment Report (AR5)), a global warming of 0.19 [0.16–0.22] °C was observed. In addition, the global average surface temperature was higher in every decade of the past 40 years than in any other decade of previous periods (IPCC, 2021; Zhou, 2021). Continuous temperature rise has resulted in the warming of the upper layer of the world’s ocean, glacial melting, and frequent extreme climate events. Studies have shown that for every 1 K increase in global temperature, the water vapor content in the atmosphere will increase by 7%. The increase in atmospheric humidity will augment the intensity of extreme precipitations, and a temperature rise can cause droughts (Wentz et al., 2007; Allen and Ingram, 2012). In the past 20 years, over 90% of the natural disasters such as droughts, floods, and high-temperature heat waves have been related to extreme climate events. In recent years, droughts and high temperature heat waves have received a significant amount of attention (Sun, 2018). Climate extremes have been identified by the WCRP (World Climate Research Program) as part of the seven “grand challenges”. They are also a central component of IPCC assessments. For the first time, the IPCC AR6 report includes a chapter dedicated to a comprehensive and systematic evaluation of climate extremes, including extreme temperatures and droughts. Assessment of extreme temperature events suggests that in the context of further global warming, extreme warm events will continuously increase on the global and continental scales and in all inhabited regions of the Earth even if the global temperature rise level stabilizes at 1.5°C. Moreover, the extreme warm events will increase in intensity, while the extreme cold events will decrease in both frequency and intensity. The more significant the global warming, the higher the reliability of the projection (IPCC, 2021; Zhou and Qian, 2021). To this point, CMIP6 have been used to project future trends, intensity, duration, and frequency of extreme temperature events in different parts of the world. Scholars have assessed the projection uncertainty and compared the simulation performance of different models. Various projections of extreme temperature events for future periods on different time scales and in different regions have been obtained (Chen et al., 2020; Grose et al., 2020; Kim et al., 2020; Wehner, 2020; Wehner et al., 2020; Ajjur and Al-Ghamdi, 2021; Quenum et al., 2021; Sobie et al., 2021; Zhang et al., 2021; Das and Umamahesh, 2022).
In the context of global warming, China’s temperature has risen significantly as in many other parts of the world. Between 1901 and 2020, China’s annual average temperature increased at a rate of 0.15°C/10 years. This increase was even more significant between 1951 and 2020, where a rate of 0.26°C/10 years was observed. The past 20 years represent the warmest period since the early 20th century (China Meteorological Administration Climate Change Centre, 2021). In the future, China will experiment further warming. According to the results projected by Yang et al. (2021) using the CMIP6 multi-model ensemble in the reference period 1995–2014, under the SSP2-4.5 and SSP5-8.5 scenarios, the annual average temperature in China will increase by the end of this century in 2.7 and 5.4°C, respectively. Both values are higher than the global average increase. It is expected that global warming will rise the frequency and intensity of warm events, and decrease the frequency and intensity of cold events. These will be important features of China’s extreme temperature events. However, some differences may occur across regions. For example, Li et al. (2018) projected changes for the six ETIs in China based on eight selected CMIP5 general circulation models during future periods (2021–2100) under the RCP4.5 and 8.5 scenarios. The results showed that FD0 (frost days) and TN10p (cool nights) will present decreasing trends, and more meteorological stations will show increasing TNn (coldest daily minimum temperature) trends as compared to corresponding decreasing trends. The decreases in FD0 and TN10p will reach 31.4 and 27.4 days from 2021 to 2060 and 42.6 and 29.7 days from 2061 to 2100. However, TD30 (tropical days), TX90p (warm days) and TXx (warmest daily maximum temperature) will show increasing trends. TNn, TD30, TX90p, and TXx will increase in 8.7°C, 45.3 days, 41.6 days, and 5.7°C from 2021 to 2060 and 7.2°C, 65.6 days, 62.4 days, and 6.4°C from 2061 to 2100. You et al. (2021) analyzed 20 models corresponding to the CMIP6 under three SSP (Shared Socio-economic Pathway) scenarios (SSP126, SSP245 and SSP585). With respect to 1986–2005, the regional average surface temperature from the multi-model ensemble mean (MMEM) of 20 models in CMIP6 were projected to increase by 1.31°C, 1.32°C, and 1.45°C in the near-term (2021–2040); 1.75°C, 2.06°C, and 2.66°C in the mid-term (2041–2060); and 1.08°C, 2.97°C, and 5.62°C in the long-term (2081–2100) under SSP126, SSP245, SSP585 scenarios, respectively. Ai et al. (2021) projected spring climate extremes in China based on models in CMIP6. The results reported that the models were generally able to capture mean climate extremes and trends. By the end of the 21st century, wet and warm extreme climate events were projected to increase, particularly in northern and western China. In addition, dry and cold extreme climate events were projected to decrease, particularly in southern China. Xiang et al. (2021) used the EC-Earth3 model in CMIP6 to project China’s extreme temperatures between 2021 and 2100 under four future scenarios (SSP1-2.6, SSP2-4.5, SSP3-7.0, SSP5-8.5). Data indicated that China would present a significant temperature increase. Moreover, before the 2050s, the resulting ETIs were similar under the four scenarios. However, after this point, variations appeared. Except for parts of southern Tibet, both TXx and TNn increased in all the regions. The maximum TXx was concentrated in Northern China, and that of TNx was found in North China and Northeast China.
Southwest China (21°08’∼34°19′ N, 97°21’∼110°11’ E) is located in the southeastern part of the Tibetan Plateau, a transition zone between mountains, plateau, and basin. This region has complex topography and unique climate, which is complicated and variable due to the dynamic and thermodynamic effects of the Qinghai-Tibet Plateau and several monsoon circulations (Wu et al., 2012). Southwest China is highly vulnerable to climate change. Ma et al. (2006) observed a significant temperature rise from 1961 to 2000 in the Qinghai-Tibet Plateau, Western Sichuan Plateau, and YGP of Southwest China. However, a significant temperature decrease in SB and Chongqing was determined. These climate changes were asynchronous with global warming. In the past few decades, extreme temperature events have become increasingly frequent in Southwest China, negatively impacting human activities and the ecosystem (Luo et al., 2016; Zhou et al., 2017; Xue et al., 2020). Some scholars determined the feasibility of obtaining temperature simulations and future projections using the models from CMIP5. For example, Wu et al. (2017) used surface temperature observations at 115 stations and historical simulations from CMIP5 in Southwest China from 1961 to 2005. Performance of 40 global climate models (GCMs) for the simulation of surface temperature were assessed in three aspects: simulations of the intensity, interdecadal variation, and mutation of warming. Most models indicated a significant increase in annual average temperature in the past 45 years in different parts of Southwest China. However, only six models replicated the effect of altitude on surface temperature increase. Ten models simulated the interdecadal decrease in annual average temperature in the SB and the hilly area of Chongqing, where the altitude is lower. However, none of the models simulated the air temperature mutation. Wu et al. (2018) used the data from 11 GCMs in CMIP5 and the multimodel ensemble method to project future changes in air temperature at the height of 2 m in Southwest China from 2020 to 2050 under the RCP4.5 scenario and in the presence of intermediate radiative forcing. They determined that the annual average temperature and the temperatures in the four seasons in Southwest China will increase significantly from 2020 to 2050. The rise in temperature was higher during winter and smaller during summer. Regions with a higher and lower temperature increase were mainly located west of 102°E and on the border between southwest Sichuan and northwest Yunnan, respectively.
The future trends of extreme temperature events in China have been intensively studied (Hu et al., 2013; Shen, 2014; Zhang, 2015; Li et al., 2017; Li et al., 2018; Ai et al., 2021; Xiang et al., 2021; You et al., 2021). Yuan and Zhen (2015), Luo et al. (2016), and Li et al. (2020) determined the spatial-temporal variation trends of historical extreme temperature events in Southwest China. However, there is a need for more refined projections of extreme temperature events in this region. The CMIP6 incorporates the largest number of climate models, presents the most reasonable experimental design, and provides the biggest volume of simulation data ever since the CMIP was first launched over 20 years ago (Zhou et al., 2019). Compared with models in CMIP5, CMIP6 models have dramatically improved kinetic parameterization and model resolution (Eyring et al., 2016; Zhan et al., 2020). In addition, performance of models from CMIP6 for extreme climate events simulation has been assessed. It has been suggested that models from CMIP6 outperformed those from CMIP5 in simulating the averages and trends of extreme climates, though only by a slight margin (Chen et al., 2020; Fan et al., 2020; Kim et al., 2020; Lin and Chen, 2020; Jiang and Chen, 2021; Xiang et al., 2021). Chen et al. (2020) made projections based on models in CMIP6, finding an increased consistency in extreme high and low temperatures on the global scale. Data indicated that the probability that high temperature heat waves occur in the future will increase significantly, while that of low-temperature cold damage will decrease. However, projection uncertainty was higher when models in CMIP6 were used as compared with models in CMIP5. According to similar studies, the probability of extreme high and low temperatures will increase in China, and a smaller projection uncertainty was achieved with models in CMIP6 as compared to models in CMIP5 (Luo et al., 2020). CMIP6 simulations vary for different regions, and further investigations are needed.
In the present research, we used nine models in CMIP6 to obtain 17 ETIs for Southwest China. We analyzed historical extreme temperature events during 1969–2020 and variation trends for the period 2021–2040 in four subzones divided by meteorological and topographical characteristics. Also, the SSP2-4.5 scenario was considered, which represents the “middle of the road” development pattern. At the same time, we also evaluated and compared the simulation performance of the selected models for different ETIs in Southwest China. Our findings will inform the government about extreme temperature events in Southwest China in the near future. In the context of global warming, our data will assist during the formulation of disaster relief and prevention measures and for decision-making purposes.
2 Data and methodology
2.1 Data
According to China’s meteorological and geographical division, the study area in Southwest China consists of four provinces and cities: 1) Chongqing City; 2) Sichuan Province; 3) Guizhou Province; and 4) Yunnan Province. In the present research, Southwest China was divided into four landform units based on climate and hydrologic conditions, geographical location, as well as altitude from north to south: 1) Zoigê Plateau; 2) Hengduan Mountains; 3) Sichuan Basin; and 4) Yunnan-Guizhou Plateau. The Zoigê Plateau (ZP) covers part of northern Sichuan; Hengduan Mountains (HMs) cover western and southern Sichuan and northern Yunnan; the Sichuan Basin (SB) covers most of Chongqing City and eastern and central Sichuan; and the Yunnan-Guizhou Plateau (YGP) covers most of Guizhou as well as part of southern Yunnan.
As previously reported for ETIs, quality control was performed on daily maximum temperature and daily minimum temperature (Zhang and Yang, 2004). Data were obtained from the China Meteorological Data Service Center (MDSCC) (http://data.cma.cn) for the period 1969 to 2020. Ninety-three weather stations located in Southwest China were chosen for the study. Three quality control methods (internal consistency check, climate limit value check and station extreme check) were used. Interpolation was performed to fill data gaps in adjacent stations by using the linear regression method, which ensured that the corrected meteorological data presented high accuracy, homogenization and continuity (Li et al., 2020). Figure 1 displays the geographical locations of the 93 studied stations in Southwest China and the digital elevation model (DEM) of the four geographical divisions. Among them, 4 stations were located in the ZP (No.1–4), 22 stations in the HMs (No.5–26), 23 stations in the SB (No.27–49), and 44 stations in the YGP (No.50–93). DEM data were obtained from the SRTM data (http://www.cgiar-csi.org/) published by the National Imagery and Mapping Agency.
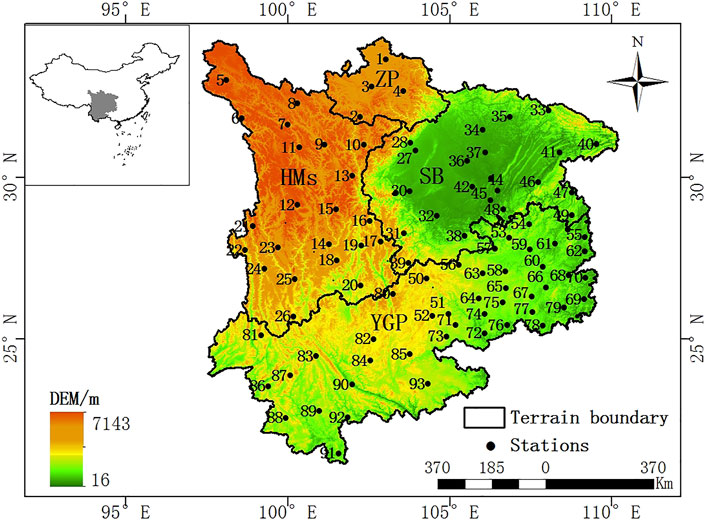
FIGURE 1. Spatial distribution of weather stations and topographical division in Southwest China
Many studies have indicated that GCMs is able to simulate some climatic factors on a large scale. However, simulation performance of GCMs may significantly vary across the regions due to differences in working mechanism, initial condition configuration, parameterization scheme setting, and spatial resolution (Walsh et al., 2008; Mote and Salathé, 2010). At present, most studies using models from CMIP for temperature projections in Southwest China have assessed the performance of different models. For example, Wu et al. (2017) performed temperature projections in Southwest China using models in CMIP5. ACCESS1.0, ACCESS1.3, CanESM2, CESM1, INM-CM4, IPSL-CM5A-LR, MIROC5, and MPI-ESM-LR were able to simulate a significant increase in annual average temperature in different parts of Southwest China. Among these models, ACCESS1.0, CESM1, and MIROC5 displayed a better performance in simulating the effect of altitude on surface temperature increase. Wu et al. (2018) projected air temperatures in Southwest China from 2020 to 2050 using 11 models from CMIP5. CanESM2, INM-CM4, IPSL-CM5A, and MIROC5 showed better performances. The results indicated that the statistical downscaling method and the multimodel ensemble method effectively reduced simulation errors, and the latter had smaller errors. Chu et al. (2015) assessed the efficacy of some models from CMIP5 for the simulation of air temperature in the Yangtze River Basin, including Southwest China, between 1961 and 2005. CanESM2 and MPI-ESM-LR produced simulations that were consistent with the observations and showed good temporal and spatial correlations. Xiang et al. (2021) evaluated the capacity of models in CMIP6 to simulate extreme temperatures in the major regions of China. These researchers reported that 20 GCMs produced different simulations for the following five ETIs: TXx (Max Tmax), TNn (Min Tmix), DTR (diurnal temperature range), TN10P (cool nights), and TX90P (warm days). The simulations also varied significantly across the regions. ACCESS-CM2, CanESM5, INM-CM5-0, IPSL-CM6A-LR, MIRCO6, and MPI-ESM1-2-LR displayed better simulation performance when they were applied to Southwest China.
With respect to projections, we additionally considered the entire model data obtained from the literature and selected nine models from CMIP6 with proven temperature simulation performance. Table 1 shows the basic information of the nine selected models. These data were obtained from the website https://esgf-node.llnl.gov/search/cmip6/. Since spatial resolution varied across the models, a bilinear interpolation with a spatial resolution of 0.5 ° × 0.5 ° was performed using all the models to determine the daily highest and lowest temperature. At the same time, data from each model were uniformly interpolated to the 93 weather stations. Then, 17 ETIs were calculated, and the Taylor diagram was plotted to assess the degree of correspondence between the modeled and observed data in the historical period. Finally, models with better simulation performance were selected to project and compare the spatial and temporal variations of 17 ETIs. The time-series data covered the period from 1995 to 2040. The period 1995–2014 represented the historical base period, and corresponding data were used to assess the model’s simulation performance. The data for the period 2020–2040 were used for the projection. The future scenario SSP2-4.5 was chosen for the following reasons: 1) SSP2-4.5 is an updated version of the RCP4.5 scenario in CMIP5 and combines intermediate social vulnerability with intermediate radioactive forcing. This scenario is usually used as a CMIP6 reference scenario, as in the Decadal Climate Projection Project (DCPP) under the Coordinated Regional Downscaling Experiment (CORDEX). The most important and intensively discussed scenario in relevant research corresponds to SSP2-4.5 (Jiang et al., 2020). 2) Since the reform and opening-up, China has been undergoing a rapid economic growth and development. This situation has resulted in severe damage to the urban eco-environment. The SSP2-4.5 scenario properly represents China’s national conditions 3) Existing studies have shown that the projected ETIs trends in the major regions of China displayed small variations under different recent scenarios. The resulting signal-to-noise ratio was usually larger under high-emissions scenarios as compared to low-emissions scenarios (Jiang and Chen, 2021; Xiang et al., 2021).
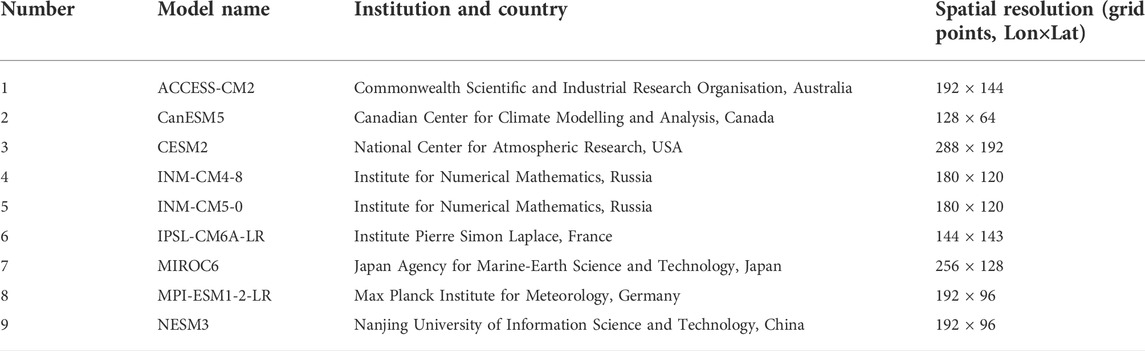
TABLE 1. Basic information of 9 models in CMIP6 chosen for future projection (the full model names can be found at https://esgf-node.llnl.gov/search/cmip6/).
3 Methodology
3.1 Extreme temperature index
In order to monitor, detect, and analyze the impact of climate change, it is better to use extreme climate indices than average values (Peterson et al., 2008). Herein, 17 ETIs were selected to analyze the characteristics of past and future extreme temperature events in Southwest China (Table 2). This was performed in accordance with the Expert Team on Climate Change Detection and Indices (ETCCDI) recommended by the Commission for Climatology (CCI) of the World Meteorological Organization (WMO) and Climate Variability and Predictability Program (CLIVAR) (Liu and Xu, 2014). The ETIs were calculated by using the RClimDex (1.0) software developed by Xuebin Zhang and Feng Yang (http://etccdi.pacificclimate.org) (Zhang and Yang, 2004). The 17 ETIs included 8 extreme warm temperature indices (EWTIs), 8 extreme cold temperature indices (ECTIs) and 1 index of diurnal temperature range (DTR).
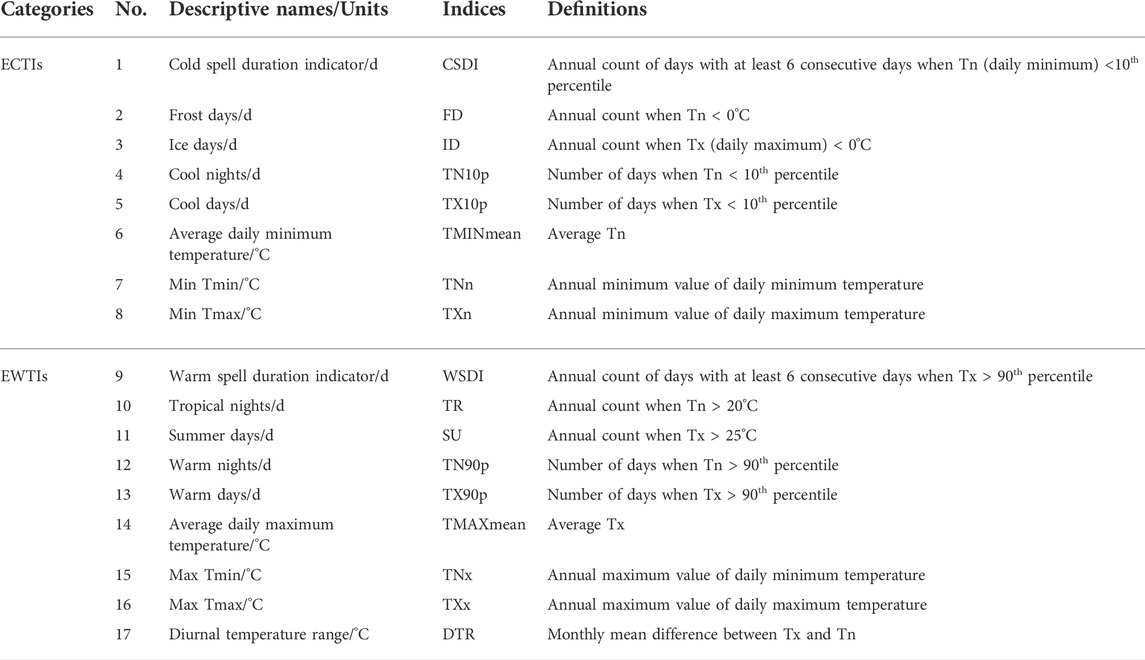
TABLE 2. List of the 17 selected ETIs.
3.2 Taylor diagram
The Taylor diagram presents three statistics, the spatial correlation coefficient between the simulated and the observed value, standard deviation, and RMSE (Root mean square error) of the simulated value relative to the observed field. Differences between the simulated results and reference data can be observed intuitively. Taylor diagram provides information on the simulation performance of the model. We first plotted the Taylor diagram for nine selected single models and MEM-9 (nine-Model Ensemble Mean) to assess their simulation performance for 17 historical ETIs in Southwest China. Then, models with better simulation performance were selected to project the spatiotemporal change trends of future extreme temperature events. The spatial correlation coefficient between the simulated and the observed values estimates the performance of model’s simulation at the central location. In addition, the standard deviation ratio indicates the model’s simulation performance for central amplitude. Moreover, RMSE measures pattern similarities between the simulated and the observed values. The closer the RMSE to 0, the stronger the simulation performance. These three statistics were calculated, and results are shown herein (Taylor, 2001; Zhang et al., 2015; Jiang and Chen, 2021):
Where R corresponds to correlation coefficient; x is the dataset of the test field; y is the dataset of the observed field;
3.3 Skill score
In order to quantitatively describe the simulation performance of the models, the skill score (S) was selected according to Taylor (2001) to quantitatively evaluate the simulation ability of nine single models and MEM-9 to 17 ETIs. The larger the S, the better the simulation ability of the models. Eq. 4 displays the formula used for this purpose (Zhang et al., 2015):
Where R is the correlation coefficient between simulated and observed value; R0 represents the maximum correlation coefficient that can be obtained; and STDR indicates the standard deviation ratio. When the variance of simulated value is close to the variance of observed value, the closer the spatial correlation coefficient between simulated and observed value is to R0, the closer S is to 1; when the variance ratio is close to 0 or infinity, the correlation coefficient is close to −1, and S is close to 0.
4 Results
4.1 Interannual variation of extreme temperature events between 1969 and 2020
According to the interannual variability of ETIs in Southwest China from 1969 to 2020 (figures omitted), the 8 ECTIs were reciprocally corroborated with the 8 EWTIs, which indicated a warming trend. Significant differences were observed in amplitude variations of different types of indices. TN10p and TX90p displayed higher daily amplitude variations than other indices. DTR showed a decreasing trend, indicating a narrowing monthly average difference between daily lowest and highest temperatures. In addition, the interannual propensity rates of all indices passed the significance test at the 0.05 level. Varying degrees of warming were also observed in the four subzones. The specific means of each index can be found in Table 3. Data indicated that the lowest CSDI and WSDI values were found in the ZP. In addition, the highest number of extreme cold days, the lowest number of extreme warm days, the lowest extreme temperature, and the highest DTR were observed in the ZP. Moreover, the HMs presented fewer extreme cold days than ZP. However, in the HMs, the number of cold days were higher than those observed in the SB and the YGP. The number of extreme warm days, extreme temperatures, and DTR were higher in the HMs than in the ZP but lower than in the SB and the YGP. Data also indicated that WSDI displayed the highest value in the SB and the lowest in DTR. In the SB, the largest number of extreme warm days, the smallest number of extreme cold days (TX10p), and the highest extreme temperature indices (TMINmean, TNn, TNx, and TXx) were observed. Also, the highest CSDI, the lowest extreme cold indices (FD, ID, and TN10p), and extreme warm index TN90p were obtained in the YGP. With respect to extreme temperatures, maximum values corresponded to TXn and TMAXmean in the YGP. Among the four geographical divisions shown in Figure 1, the highest and lowest elevations correspond to northwestern Southwest China (ZP and HMs) and eastern Southwest China (SB and northeast YGB), respectively. The population density and urbanization rate in the east are significantly higher than those in the west. As previously shown, regions in higher altitudes and sparsely inhabited displayed larger temperature differences due to the effects of geographical partitioning and human activities. In these regions, fewer extreme warm events were observed, while extreme cold events were more frequent.
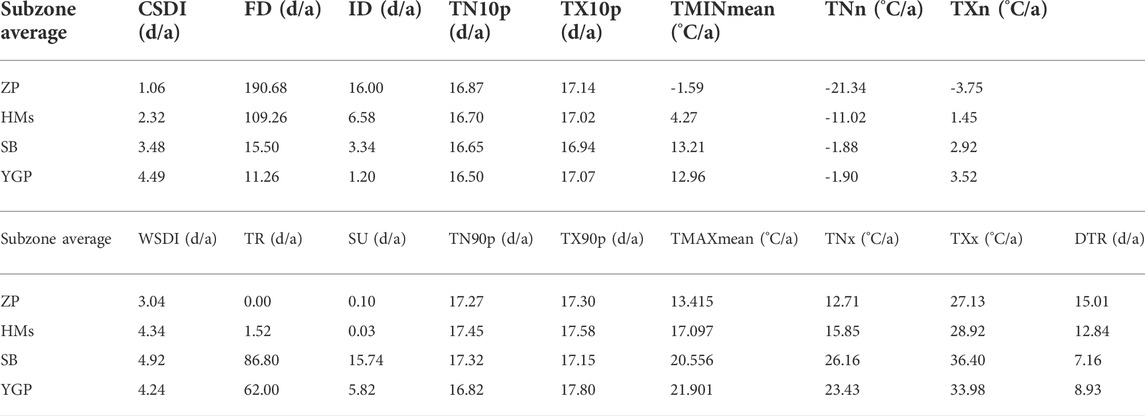
TABLE 3. Average values of 17 ETIs in different subzones from 1969 to 2020.
4.2 Evaluation of the simulation performance of the models in CMIP6
We plotted a Taylor diagram to assess the simulation performance of the nine models for 17 ETIs in Southwest China. Previous studies have shown that multimodal ensemble-based simulated values were similar to observed values (Zhao et al., 2014). Thus, in order to obtain MEM-9, nine models were combined into multimodel ensembles using model averaging. The Taylor diagram was used to compare the simulation performance of nine models and MEM-9.
Figure 2 shows the Taylor diagram of 17 ETIs in Southwest China based on simulated and observed data in the historical base period. Three evaluation parameters, R, STDR, and RMSE, were involved. REF represents the observed data. The closer the model data to REF, the higher the simulation performance. According to our results, the R value was consistently smaller with all nine models and MEM-9 for CSDI simulation. Comparatively speaking, MEM-9 and ACCESS-CM2 displayed a better simulation performance, where STDR was close to 1 and a small RMSE was obtained. The nine models and MEM-9 presented the best simulation performance for FD, TR, and TNx, with STDR close to 1, R value above 0.8, and a small RMSE. In the case of ID, the best simulation performance corresponded to CESM2 and CanESM5. Also, the nine models and MEM-9 inadequately simulated TN10p, TX10p, TN90p, and TX90p. However, they properly simulated TMINmean, TMAXmean, and TXx. For all nine models and MEM-9, the R value of 0.6–0.8, STDR close to 1, and small RMSE were achieved. CESM2, ACCESS-CM2, INM-CM5-0, and MEM-9 were able to simulate TNn. In addition, TXn was best simulated with CESM2 and ACCESS-CM2, and MEM-9 presented the best simulation performance for WSDI. The best agreement between observed values and SU simulations were obtained with CESM2, ACCESS-CM2, and MIROC6. Furthermore, CanESM5, MPI-ESMI-2-LR, NESM3, and MEM-9 presented a better simulation performance for DTR. In these models, R displayed a high value, STDR was close to 1, and RMSE was small. Although the simulated results of each index varied across the models, CESM2, CanESM5, ACCESS-CM2, and MEM-9 had a relatively better simulation performance for the 17 ETIs.
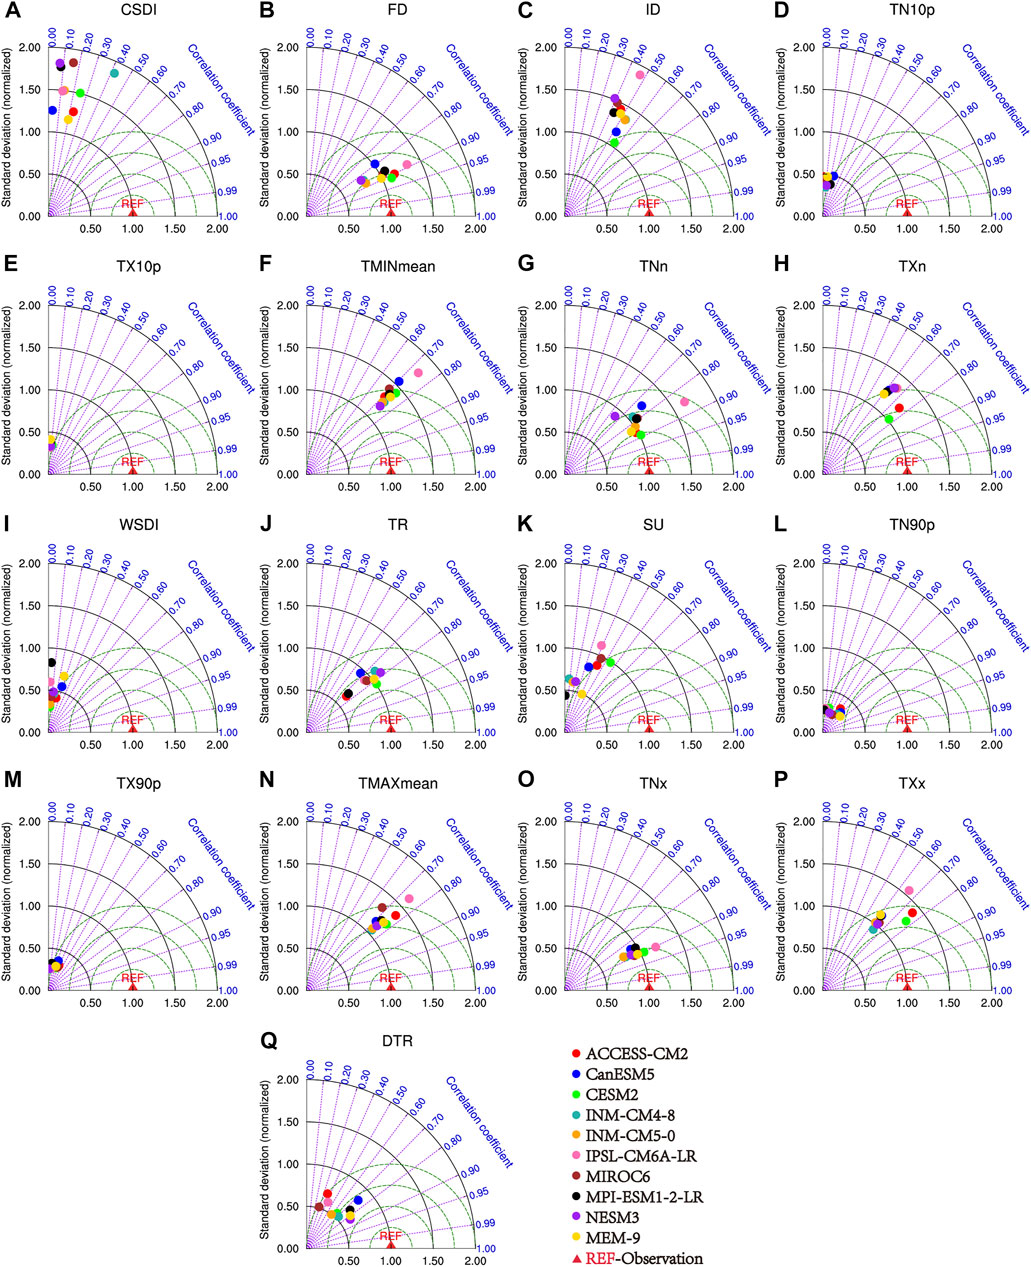
FIGURE 2. Taylor diagram of 9 CMIP6 models and MEM-9 simulated fields relative to observed fields for 17 ETIs in the historical base periods (A) CSDI (B) FD (C) ID (D) TN10p (E) TX10p (F) TMINmean (G) TNn (H) TXn (I) WSDI (J) TR (K) SU (L) TN90p (M) TX90p (N) TMAXmean (O) TNx (P) TXx (Q) DTR
Table 4 presents the Ss between 17 simulated and observed ETIs calculated with nine models and MEM-9 using Eq. 4. Results indicated that the Ss of the nine models and MEM-9 for all 17 ETIs were different. However, according to the average S of each model and MEM-9, the highest Ss were obtained with CESM2, MEM-9, ACCESS-CM2 and CanESM5. These data were consistent with the results obtained with Taylor diagram analysis.
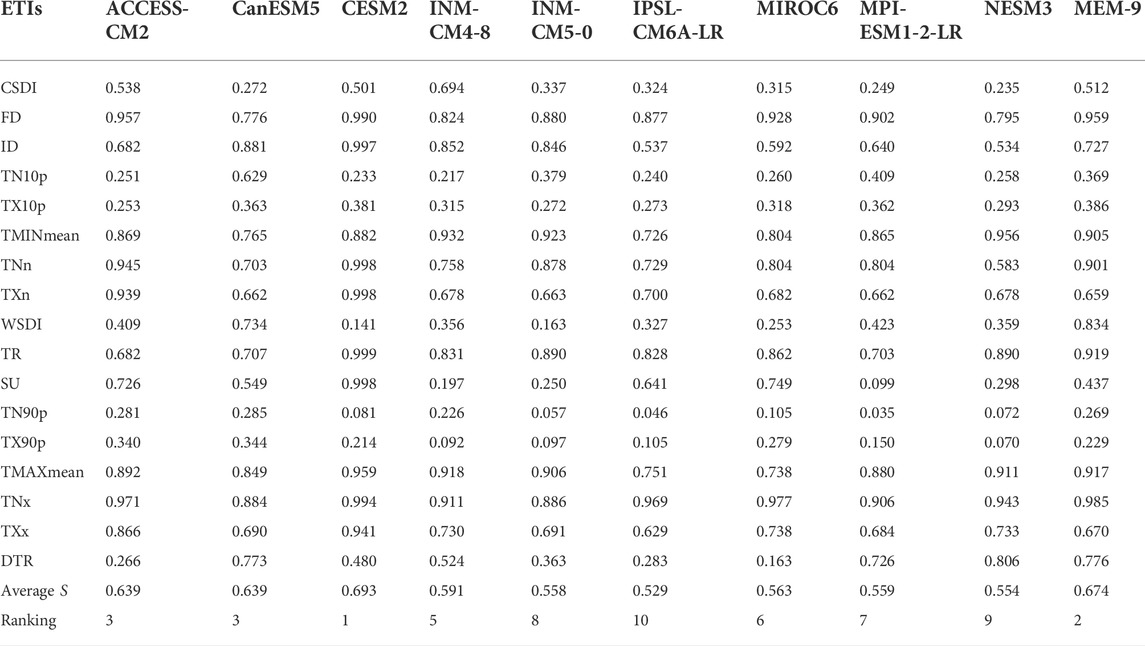
TABLE 4. Skill scores (Ss) between simulated and observed ETIs for nine single models and MEM-9.
4.3 Projection of the future temporal and spatial variation trends of extreme temperature events
4.3.1 Annual change rates
Taking into account the Taylor diagram and skill score of ETIs assessed by nine models and MEM-9, and considering the best projection performance on 17 ETIs, we selected CESM2, CanESM5, ACCESS-CM2, and MEM-9. In order to improve the accuracy and reduce the uncertainty of future projections, we used these three models and MEM-9 to project extreme temperature events in Southwest China under the SSP2-4.5 scenario between 2021 and 2040. Table 5 displays the projected annual change rates of 17 ETIs for this period. According to the three models and MEM-9 prediction, and considering the increasing trend in CSDI projected by MEM-9, it is expected that in the next 20 years the annual change rates of the ECTIs CSDI, FD, ID, TN10p, and TX10p will decrease, while TMINmean, TNn, and TXn will increase. That is, the number of cold days is projected to decrease, and the lowest temperature is projected to increase. In addition, the annual change rates of 8 EWTIs indicated an increase in the number of extreme warm days and highest temperature. The annual change rate of DTR displayed a small value with a slightly increasing trend, except for ACCESS-CM2, which showed a slight downward trend. Although the projected annual change rate values differed between the three models and MEM-9, the change trends were generally consistent. Thus, under the SSP2-4.5 scenario, the extreme cold events in Southwest China will continuously decrease in the next 20 years, while the extreme warm events will continuously increase.
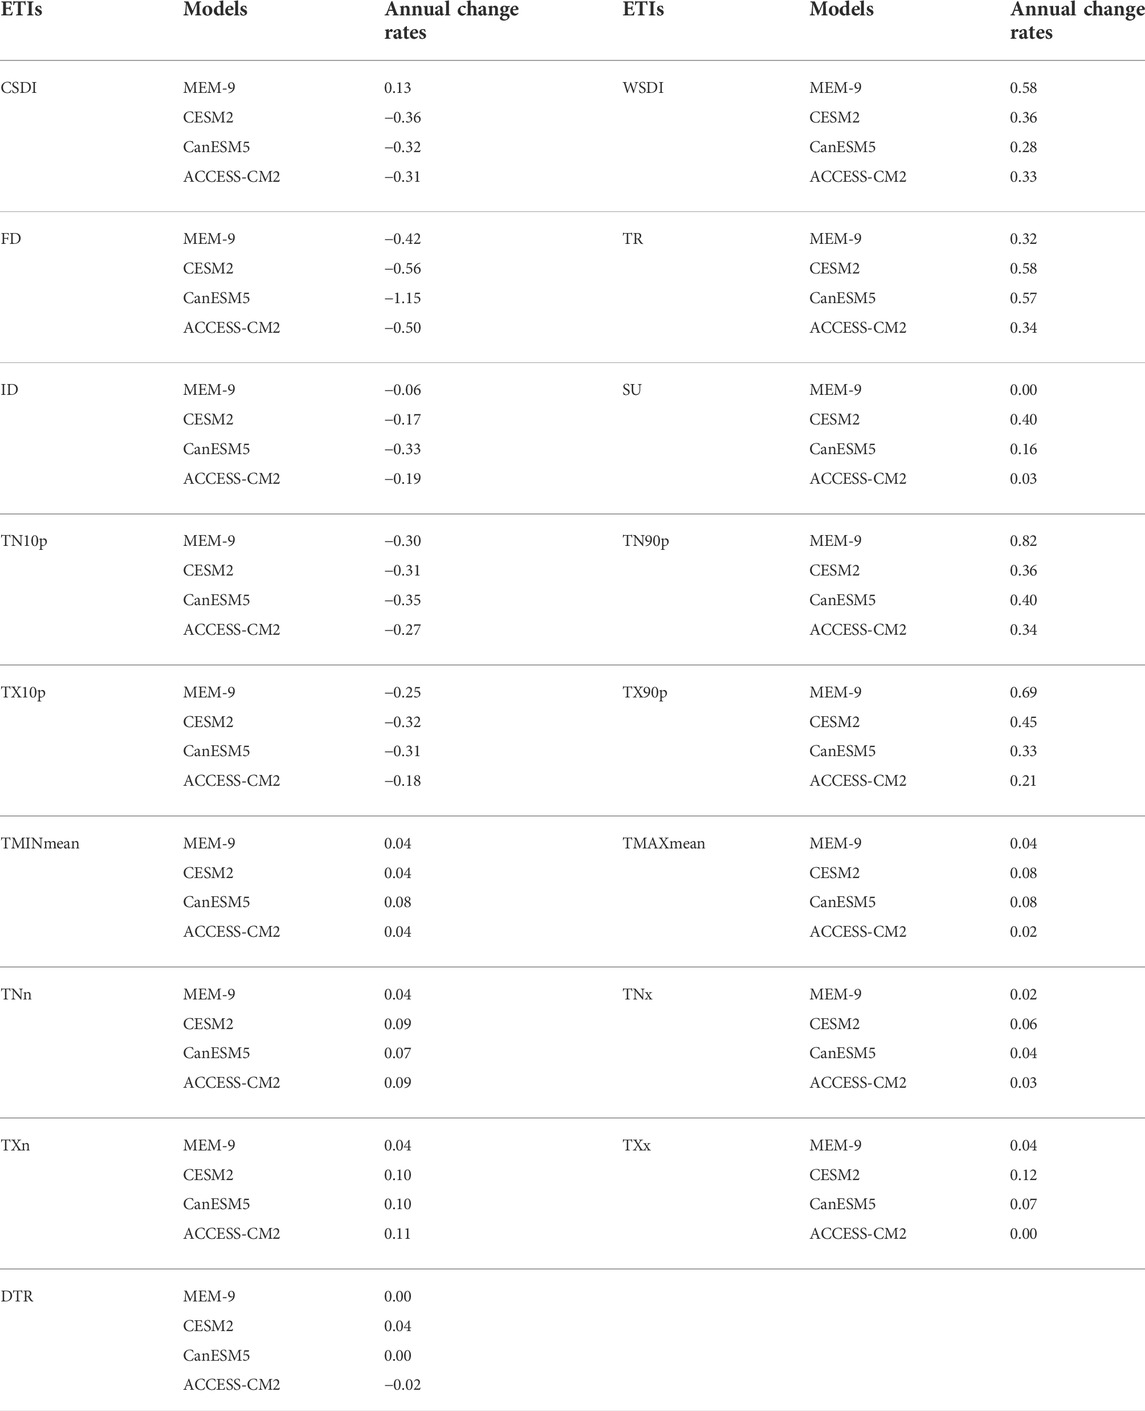
TABLE 5. Future projections of the annual change rates of 17 ETIs from 2021 to 2040 obtained with different models under the SSP2-4.5 scenario.
In the case of the 8 ECTIs, the projections of annual change rates obtained using the three models and MEM-9 showed that MEM-9 projected an annual change rate of 0.13 for CSDI, which corresponds to an increasing trend. In contrast, the other three models projected a decreasing trend in annual change rates for CSDI, and the projected annual change rates were very close to each other. The projected variation ranges of FD and ID were [−1.15, −0.42] and [−0.33, −0.06], respectively. In both cases, the smallest projection corresponded to CanESM5, and the largest to MEM-9. The projected variation ranges of TN10p, TX10p, TMINmean, TNn, and TXn were [−0.35, −0.27], [−0.32, −0.18], [0.04, 0.08], [0.04, 0.09], and [0.04, 0.11], respectively. The results were similar to each other. Thus, among the three models and MEM-9, this last one produced larger ECTIs projections, while the smallest values were obtained with CanESM5. With respect to the 8 EWTIs, the three models and MEM-9 indicated an increasing trend. The projected variation range for WSDI was [0.28, 0.58]. The largest projected values were produced by MEM-9 and the smallest by CanESM5. The projected TR and SU variation ranges were [0.32, 0.58] and [0.00, 0.40], respectively. In both cases, the largest and smallest projections were obtained using CESM2 and MEM-9, correspondingly. The projected TN90p and TX90p variation ranges corresponded to [0.34, 0.82] and [0.21, 0.69], respectively. Herein, the largest and smallest projections were produced by MEM-9 and ACCESS-CM2, correspondingly. The projected variation ranges for TMAXmean, TNx, and TXx were [0.02, 0.08], [0.02, 0.06], and [0.00, 0.12], in that order. Data also indicated that, when different models were used, the projections were similar. In general, the highest and smallest EWTIs projections were obtained using MEM-9 and ACCESS-CM2, respectively. In the three models and MEM-9, the projected variation range for DTR corresponded to [−0.02, 0.04]. ACCESS-CM2 and CESM2 projected a decreasing and increasing trend, correspondingly. On the other hand, the annual change rates projected by MEM-9 and CanESM5 were zero, indicating no change.
4.3.2 Temporal variation trends
CSDI and WSDI represent the continuity of extreme cold and warm events. TMINmean and TMAXmean represent the averages of extreme cold and warm events. Thus, the variation features of extreme cold and warm events can be obtained by combining the two groups of indices. In order to reduce projection uncertainty and increase accuracy, and because of limited space, we applied the three models in addition to MEM-9 to project the spatial and temporal variation trends of these four indices representing the extreme temperature events from 2021 to 2040 under the SSP2-4.5 scenario. Figure 3 shows the projected temporal variation trends in the next 20 years.
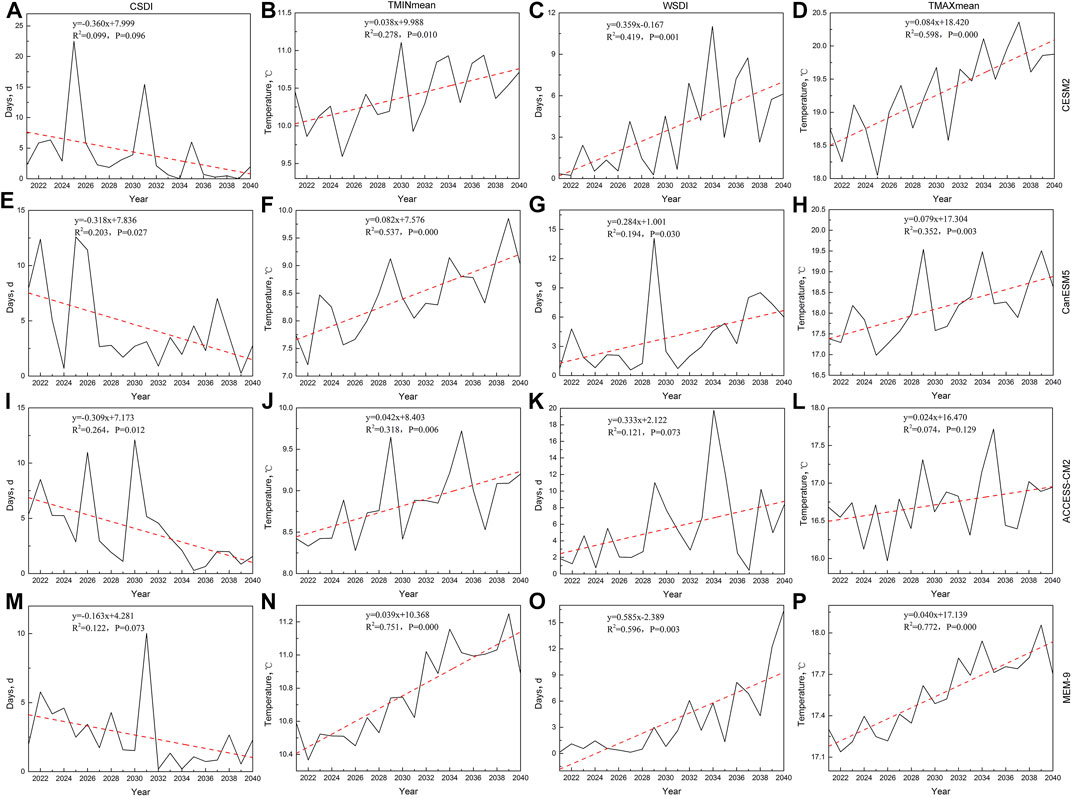
FIGURE 3. Projections of the temporal change trends of the 4 ETIs in the next 20 years by different models under the SSP2-4.5 scenario. CESM2 [(A) CSDI (B) TMINmean (C)WSDI (D) TMAXmean], CanESM5 [(E) CSDI (F) TMINmean (G)WSDI (H) TMAXmean], ACCESS-CM2 [(I) CSDI (J) TMINmean (K)WSDI (L) TMAXmean], MEM-9 [(M) CSDI (N) TMINmean (O)WSDI (P) TMAXmean]
When CESM2 was used, an annual CSDI average value of 4.2 days was obtained, which was higher than the WSDI average of 3.5 days. Thus, the cold spell duration is expected to decrease in the next 20 years, while the warm spell duration is expected to increase. In addition, the decreasing trend of extreme cold events was comparable to the increasing trend of extreme warm events. The annual TMINmean average displayed a value of 10.5°C, and that of TMAXmean was 19.5°C. Both showed an increasing trend, and the increase in TMAXmean was larger than that in TMINmean. The projected CSDI was statistically significant at the 0.1 level. In addition, the projected WSDI, TMAXmean, and TMINmean were statistically significant at the 0.01 level and a good linear fit was obtained. When CanESM5 was applied, CSDI presented an annual average value of 4.5 days, which was higher than the average WSDI of 4.0 days. However, the decrease in CSDI was higher than that in WSDI, indicating that the decrease in extreme cold spells was greater than the increase in extreme warm spells. The annual TMINmean average was 9.5°C, and that of TMAXmean was 18.5°C, both showing an increasing trend. Besides, TMINmean showed an amplitude increase slightly larger than that of TMAXmean. Among the four indices, the projected TMINmean and TMAXmean were statistically significant at p < 0.01. In addition, the projected CSDI and WSDI were statistically significant at p < 0.05, and a good linear fit was achieved. According to the ACCESS-CM2 projections, the resulting WSDI value was 5.6 days, which was higher than the annual average CSDI value of 3.9 days. The TMINmean was 9.0°C, and TMAXmean 16.8°C. Specifically, the decrease in extreme cold spells amplitude was slightly smaller than the increase in extreme warm spells amplitude. TMINmean displayed a higher amplitude increase than TMAXmean. Test of significance indicated that projected TMINmean was statistically significant at the 0.01 level, and corresponding CSDI at the 0.05 level. According to MEM-9 projections, the WSDI resulted in 1.1 day, which was higher than the CSDI value of 0.7 days. Moreover, TMINmean and TMAXmean presented values of 10.8 and 17.6°C, respectively. Results indicated that extreme cold spells displayed a decrease in amplitude far smaller than the increase in amplitude observed in extreme warm spells. In addition, the increase in TMINmean and TMAXmean were similar. The projected WSDI, TMAXmean, and TMINmean were statistically significant at p < 0.01 and a good linear fit was achieved. As previously shown, extreme cold events are expected to decrease, and extreme warm events are expected to increase in Southwest China in the next 20 years under the SSP2-4.5 scenario. In addition, CSDI might decrease, while WSDI, TMINmean, and TMAXmean might increase. Moreover, CSDI presented a smaller decrease in amplitude than WSDI amplitude increase. The amplitude increase of TMINmean was slightly smaller than that of TMAXmean.
When different models were used, a CSDI projected variation of 0.7–5.6 days was obtained. The lowest projection was produced by MEM-9 and the highest by ACCESS-CM2. The largest and smallest interannual decrease variability were projected by CESM2 and MEM-9, respectively. In addition, a projected WSDI variation of 1.1–4.0 days was obtained using different models. The lowest projection was produced by MEM-9 and the highest by CanESM5. Moreover, the highest and smallest interannual increase variability were obtained with MEM-9 and CanESM5, in that order. In addition, a projected TMINmean variation of 9.0–10.8°C was achieved. The lowest projection was produced by ACCESS-CM2 and the highest by MEM-9. The maximum interannual increase in variability was obtained with CanESM5, and those of the remaining three models were alike. The projected TMAXmean variation derived from different models was 16.8–19.5°C. The lowest projection was produced by ACCESS-CM2 and the highest by CESM2. In this case, the highest and smallest interannual increase in variability were obtained with CESM2 and ACCESS-CM2, respectively. As previously shown, the lowest and highest CSDI and WSDI projected values were obtained with MEM-9 and ACCESS-CM2, correspondingly. Furthermore, the lowest and highest TMINmean and TMAXmean projected values were achieved using ACCESS-CM2 and CESM2, in that order.
4.3.3 Spatial variation trends
Figure 4 shows the projected spatial variation of regression coefficients (RCs) for 4 ETIs in 93 weather stations for the next 20 years. According to our results, CESM2 indicated that projected CSDI decreased dramatically in Southwest China, and the decrease in amplitude augmented from the center to the periphery. WSDI generally increased, and its value decreased from southwest to northeast. TMINmean and TMAXmean showed an overall increasing trend in Southwest China, and its increasing rate decreased from east to the west. The CSDI projected by CanESM5 primarily decreased in Southwest China, and its amplitude reduction decreased from southeast to northwest. In general, WSDI, TMINmean, and TMAXmean increased. Specifically, WSDI increased from east to west, while TMINmean and TMAXmean increased in the south to north direction. The CSDI projected by ACCESS-CM2 primarily decreased in Southwest China, and its amplitude reduction decreased from east to west. WSDI, TMINmean, and TMAXmean generally increased. Specifically, WSDI increased from north to south; TMINmean increased from south to north; and TMAXmean increased from east to west. The CSDI projected by MEM-9 was different from the values projected by the remaining three models. Different increasing and decreasing trends were projected in different parts of the study area. Nevertheless, regions projected to have an increasing CSDI outnumbered those projected to have a decreasing CSDI. A significant increasing trend was projected in the SB and the eastern YGP. In contrast, a significant decreasing trend was projected in the northern HMs and the ZP. In general, WSDI, TMINmean, and TMAXmean increased; WSDI increased from east to the west; and finally, TMINmean and TMAXmean increased from south to north. As previously indicated, the CSDI values projected by CESM2, CanESM5, and ACCESS-CM2 decreased in space as a whole, and that projected by MEM-9 generally increased. The values of WSDI, TMINmean, and TMAXmean projected by the three models and MEM-9 increased in general, though the increase in amplitude varied from one part to another. Regions with high projected WSDI values were located in western YGP. In addition, regions with low projected WSDI values were located in the SB and eastern YGP. Moreover, the northern HMs and ZP regions displayed high projected TMINmean values, while the southern HMs and the western YGP areas showed low projected TMINmean values. Regions with high projected TMAXmean values were located in ZP and northern HMs, while regions with low projected TMAXmean values were located in southern HMs. The spatial distributions of intermediate values of the four indices projected using the three models and MEM-9 varied more significantly.
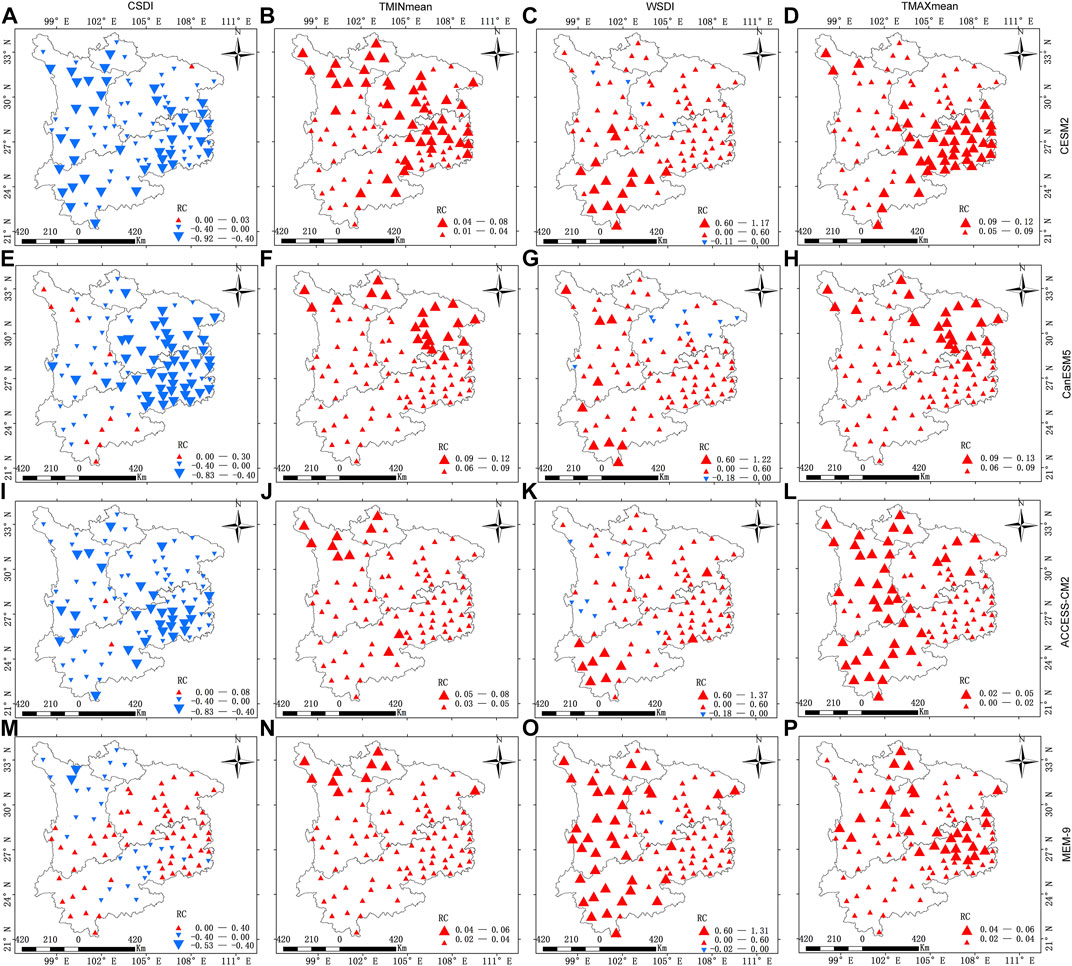
FIGURE 4. Projections of spatial change trends of the 4 ETIs in the next 20 years obtained using different models under the SSP2-4.5 scenario. CESM2 [(A) CSDI (B) TMINmean (C)WSDI (D) TMAXmean], CanESM5 [(E) CSDI (F) TMINmean (G) WSDI (H) TMAXmean], ACCESS-CM2 [(I) CSDI (J) TMINmean (K)WSDI (L) TMAXmean], MEM-9 [(M) CSDI (N) TMINmean (O)WSDI (P) TMAXmean]
4.3.4 Variation trends in the four subzones
Table 6 shows the four projected ETIs average values for different subzones of Southwest China from 2021 to 2040 under the SSP2-4.5 scenario. These values were obtained using the three models and MEM-9. With respect to CESM2, ZP displayed the smallest TMINmean and TMAXmean projected values. That is, the extreme high and low temperatures were the lowest in this region. In the HMs, the lowest CSDI and highest WSDI were observed. This means that the largest number of extreme warm spells correspond to the HMs region. In addition, the SB presented the lowest projected WSDI and the highest projected TMINmean and TMAXmean values. This indicated that this region is expected to have a smaller number of extreme warm spells and larger extreme high and extreme low temperatures. The highest projected CSDI, WSDI, TMINmean, and TMAXmean values were observed in this region. Therefore, extreme cold and warm events occurred more frequently in the YGP. According to the CanESM5 and ACCESS-CM2 projections, the four smallest ETIs projected values were observed in the ZP. Except for WSDI, the largest projected ETIs values corresponded to the YGP. Regions with the highest WSDI projected by CanESM5 were located in the HMs. Regions with the highest WSDI projected by CCESS-CM2 were located in the SB. Among the MEM-9 projections, except for WSDI, the projected values of the three remaining ETIs were consistent with those projected by CanESM5 and ACCESS-CM2. Regions with the lowest projected WSDI values corresponded to the YGP, and those with the highest projected values were located in the HMs. According to the projected averages of the 4 ETIs in the subzones, the lowest, highest, and higher intermediate TMINmean and TMAXmean were located in the ZP, the YGP, and the SB, respectively. Except for CESM2, the lowest and highest CSDI values projected by the remaining three models corresponded to the ZP and the YGP, in that order. However, the projected WSDI values varied significantly across the models.
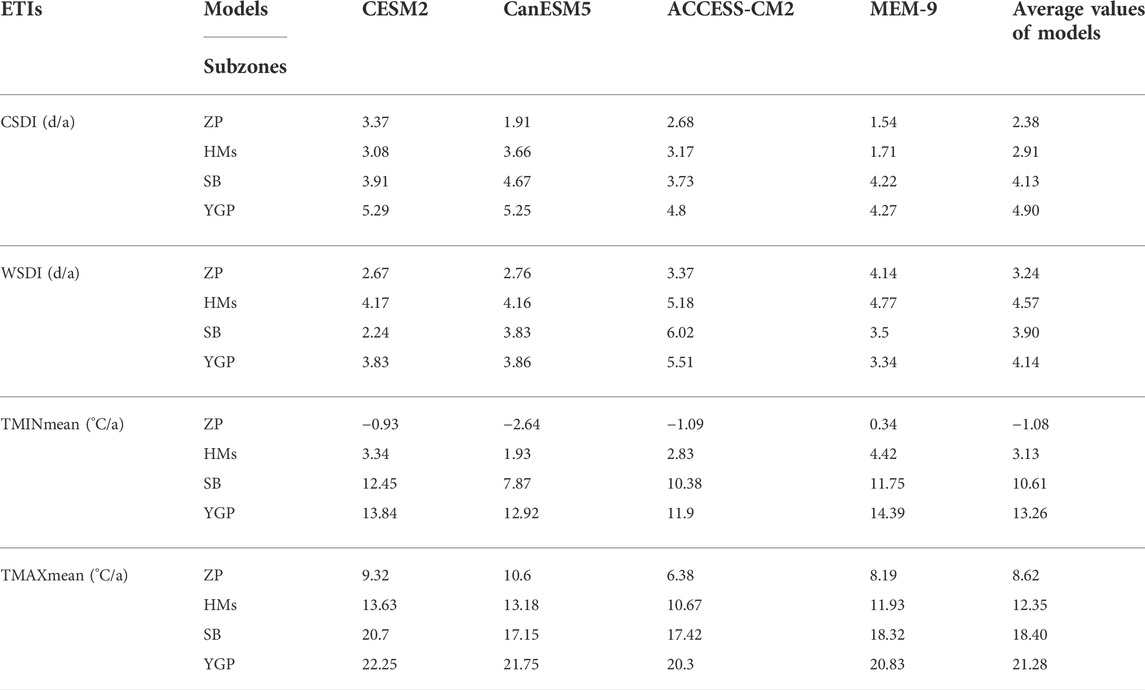
TABLE 6. Future projections for average values of the 4 ETIs in different subzones for 2021–2040 under the SSP2-4.5 scenario obtained with three models and MEM-9.
According to the data presented in Table 3, when the four ETIs averages of the historical period are compared with the ETIs obtained with the three models and MEM-9, it is expected that in the next 20 years: CSDI and WSDI will increase in the ZP; TMINmean will augment while TMAXmean will decline. In addition, it is projected that in the HMs, CSDI and WSDI will increase, while TMINmean and TMAXmean will decrease. Moreover, in the SB, CSDI will likely increase, WSDI will likely decrease, and TMINmean and TMAXmean are expected to decline. Also, in the YGP, CSDI are expected to increase, while WSDI to decrease. TMINmean is projected to escalate, while TMAXmean is projected to decline. This means that in the ZP, the number of extreme cold and warm spells as well as the average daily lowest temperature are expected to increase, and the average daily highest temperature to decrease. Similarly, in the HMs, the number of extreme cold and warm spells are projected to increase, and the average daily lowest and highest temperatures to decrease. With respect to the SB, the average daily lowest and highest temperatures are projected to decrease; the number of extreme cold spells will likely increase, while the number of extreme warm spells will likely decrease. Moreover, the average daily lowest and highest temperatures are projected to decrease. It is also projected that in the YGP, the number of extreme cold spells will increase, the number of extreme warm spells will decrease, the average daily lowest temperature will increase, and the average daily highest temperature will decrease.
5 Discussion
At present, GCM is the most powerful tool for climate change simulation and future projection, which can provide climate change data at the global and regional scales. Luo et al. (2020) evaluated 27 models from CMIP6. They simulated extreme temperatures over China and compared observed data for the period 1979–2005. Their results showed that these models contained the observed extreme temperature trends. The ability of individual models varied for different indices, although some models outperformed the others. The models in CMIP6 were able to properly reproduce the spatial distribution of TXx, TNn and FD. And the model spread in CMIP6 was reduced with respect to CMIP5 for some temperature indices, such as TXx, WSDI and TX90p. The study by Chen et al. (2020) indicated that the models from CMIP6 exhibited a general improvement in terms of simulation of climate extremes and their trend patterns compared to observations. Particularly for regions in the high northern latitudes, the model spread in CMIP6 models tended to be much smaller than those of their predecessors. However, the improvement was limited or even decreased for some individual models, which still needs further explanation from other perspectives. The research of Fan et al. (2020) also showed that models from CMIP6 adequately captured the spatial patterns and temporal variations of the observed temperature extremes for some indices, although they were less accurate for others. We plotted the Taylor diagram and calculated skill score to assess the simulation performance of the nine models and MEM-9 in the historical base period before making the projections of 17 ETIs for the next 20 years. We found that, although the average simulation performance of the multimodel ensemble was better than that obtained using individual models, the simulation performance of the nine single models and MEM-9 varied considerably for different ETIs. This result agreed with the findings mentioned above. Thus, in order to improve the projection reliability and to reduce uncertainty, we selected three CMIP6 models and MEM-9 for further comprehensive evaluation.
To the best of our knowledge, many projections of extreme temperature events have been performed on the global and large regional scales. However, few projection studies have focused on the small regional scale, especially in Southwest China, which is more susceptible to climate change, presents complex topography, and has frequently experienced extreme climate events. IPCC AR6 has pointed out that since the 1950s, the number of warm days and warm nights has increased, while the number of cold days and cold nights has decreased on a global scale. Among them, both TXx and TNn showed an increasing trend, and the average increase of TNn was higher than that of TXx in the land area. Moreover, this variation trend of extreme temperature events on the global scale was also observed on the continental and regional scales. The confidence of Asia on the continental scale was very likely. In addition, more than 90% of the regional scale changes presented with above moderated confidence (IPCC, 2021; Zhou and Qian, 2021). In the present research, climate projections over Southwest China for the period between 1969 and 2020 showed consistency with the IPCC AR6 results, with TNn and TXx rising by 0.44°C/10 years and 0.28°C/10 years, respectively.
Xiang et al. (2021) assessed the extreme temperature simulation ability of models from CMIP6 in the major regions of China and conducted projections under future scenarios. They reported significant differences in the simulation of ETIs across GCMs and regions. These researchers used the bias-corrected EC-Earth3 to project the five ETIs (TXx, TNn, DTR, TN10P, and TX90P) in the future period. It was projected that, from 2021 to 2100, Southwest China may have a significant increase in TXx and TNn under all four scenarios (SSP1-2.6, SSP2-4.5, SSP3-7.0, and SSP5-8.5). In addition, temperature increase amplitude is expected to gradually increase under the four scenarios. Moreover, TX90P will dramatically increase, while TN10P will dramatically decrease. DTR showed a significant decreasing trend. These findings agreed with those obtained in the present research. Later, we used the three models and MEM-9 selected by the Taylor diagram and skill score to project the annual change rates of 17 ETIs in the next 20 years under the SSP2-4.5 scenario. It was found that the extreme cold index TN10P will dramatically decrease while TNn will increase. Among the extreme warm indices, TX90P will considerably increase, and TXx will also augment but to a lesser extent as compared to TX90P. However, DTR displayed small variations. Our DTR projections were different from those reported by Xiang et al. (2021). Such difference may be the effect of Southwest China complex topography and zoning differences. In addition to variations in projection trends for annual rates of change of the 17 ETIs that were obtained for the period 2021 to 2040 using the three models and MEM-9, we also calculated the ranges of annual change rates of these 17 ETIs using different models. We expect to gain a thorough understanding of the change rates of different ETIs in the future. Among the projections of extreme cold and heat indices obtained using the three models and MEM-9, the MEM-9 projections were generally larger, which agreed with data reported by Luo et al. (2020) and Fan et al. (2020).
Previous research has indicated that the signal-to-noise ratio observed under high emissions scenarios is usually larger than that obtained under low emissions scenarios. Recent studies on the variation trends of ETIs in the major regions of China have shown insignificant differences between scenarios. Therefore, in order to determine near future projections (from 2021 to 2040), we chose the SSP2-4.5 scenario, which better represents China’s national conditions. However, in the present study, we only chose one scenario and one future period. Considering the spatial resolution of the study area, we performed data processing by statistically downscaling the data from CMIP6. However, this method may increase model projection uncertainty, which can be addressed by bias correction, dynamic downscaling, and regional model ensemble. These data processing methods are expected to enhance projection reliability, and they will be further developed and improved as part of future research.
6 Conclusions
Daily temperature observations at 93 weather stations in Southwest China from 1969 to 2020 and data from nine models in CMIP6 from 1995 to 2040 were used to calculate 17 ETIs. First, the interannual variation of extreme temperature events and the averages of 17 ETIs in the four subzones were analyzed from 1969 to 2020. Then, the models’ simulation performance was assessed by plotting the Taylor diagram and calculating skill score. In order to reduce the projection uncertainty, we selected the three models plus MEM-9, which had a better simulation performance. Finally, these models were used to project and compare the following analysis in Southwest China from 2021 to 2040 under the SSP2-4.5 scenario: annual change rates of 17 ETIs, spatial and temporal variation trends of four representative ETIs, and the average variations of these four ETIs in different subzones. According to our results, we formulated the following conclusions:
(1) From 1969 to 2020, the 8 ECTIs and the 8 EWTIs were mutually confirmed, which consistently indicated a warming trend. DTR showed a decreasing trend, indicating a narrowing monthly average difference between the daily lowest and highest temperatures. Varying degrees of warming were also observed in the four subzones. Regions in higher altitudes and sparsely inhabited displayed larger temperature differences due to the effects of geographical partitioning and human activities. In these regions, fewer extreme warm events were observed, while extreme cold events were more frequent.
(2) Taylor diagram and skill score analysis showed that CESM2, CanESM5, ACCESS-CM2, and MEM-9 had a relatively better simulation performance for the 17 ETIs. Under the SSP2-4.5 scenario, the extreme cold events in Southwest China will continuously decrease in the next 20 years, while the extreme warm events will continuously increase. Among the three models and MEM-9, MEM-9 produced larger ECTIs projections, while the smallest were obtained with CanESM5. The highest and smallest EWTIs projections were obtained using MEM-9 and ACCESS-CM2, respectively. However, the three models and MEM-9 had little differences in DTR predictions.
(3) The results of temporal change trends of the 4 ETIs representing extreme temperature events indicated CSDI might decrease, while WSDI, TMINmean, and TMAXmean might increase in Southwest China in the next 20 years under the SSP2-4.5 scenario. Moreover, CSDI presented a smaller decrease in amplitude as compared with the amplitude increase of WSDI. The amplitude increase of TMINmean was slightly smaller than that of TMAXmean. The lowest and highest CSDI and WSDI projected values were obtained with MEM-9 and ACCESS-CM2, correspondingly. And the lowest and highest TMINmean and TMAXmean projected values were achieved using ACCESS-CM2 and CESM2, in that order. The results of spatial variation trend showed that the CSDI values projected by CESM2, CanESM5, and ACCESS-CM2 decreased in space as a whole, and that projected by MEM-9 generally increased. The values of WSDI, TMINmean, and TMAXmean projected by the three models and MEM-9 increased in space as a whole, though the increase in amplitude varied from one part to another.
(4) According to the projected averages of the 4 ETIs in the subzones, the lowest, highest, and intermediate higher TMINmean and TMAXmean were located in the ZP, the YGP, and the SB, respectively. Except for CESM2, the lowest and highest CSDI values projected by the remaining three models corresponded to the ZP and the YGP, in that order. However, the projected WSDI values varied significantly across the models. Compared with the 4 ETI mean values corresponding to 1969–2020, the persistence and average state of extreme cold and warm events in different subzones showed that future change trends depend on altitude.
Data availability statement
The raw data supporting the conclusions of this article will be made available by the authors, without undue reservation.
Author contributions
Project suggested by WL. Analysis done by CZF and LXH. Data and comments contributed by LXH and CZF. Article written by LXH, CZF, WL, and LH. All authors revised it critically for important intellectual content.
Funding
This work was funded by the Second Tibetan Plateau Scientific Expedition and Research Program (2019QZKK0105).
Acknowledgments
The authors thank the modelling groups, the Coupled Model Inter-comparison Project Phase 6 of the World Climate Research Program (WCRP) (https://esgf-index1.ceda.ac.uk/projects/cmip6-ceda/) for their roles in making available the nine-model data set.
Conflict of interest
The authors declare that the research was conducted in the absence of any commercial or financial relationships that could be construed as a potential conflict of interest.
Publisher’s note
All claims expressed in this article are solely those of the authors and do not necessarily represent those of their affiliated organizations, or those of the publisher, the editors and the reviewers. Any product that may be evaluated in this article, or claim that may be made by its manufacturer, is not guaranteed or endorsed by the publisher.
References
Ai, Y. W., Chen, H. P., and Sun, J. Q. (2021). Model assessments and future projections of spring climate extremes in China based on CMIP6 models. Int. J. Climatol. 42 (9), 4601–4620. doi:10.1002/joc.7492
Ajjur, S. B., and Al-Ghamdi, S. G. (2021). Global hotspots for future absolute temperature extremes from CMIP6 models. Earth Space Sci. 8, 1–16. doi:10.1029/2021EA001817
Allen, M. R., and Ingram, W. J. (2012). Constraints on future changes in climate and the hydrologic cycle. Nature 489, 228–232. doi:10.1038/nature01092
Chen, H. P., Sun, J. Q., Lin, W. Q., and Xu, H. W. (2020). Comparison of CMIP6 and CMIP5 models in simulating climate extremes. Sci. Bull. 65, 1415–1418. doi:10.1016/j.scib.2020.05.015
China Meteorological Administration Climate Change Centre (2021). Blue book on climate change in China (2021). Beijing: Science Press.
Chu, Q., Xu, Z. Z., Liu, W. F., and Liu, L. (2015). Assessment on 24 global climate models in the CMIP5 over the Yangtze River. Resour. Environ. Yangtze Basin 24, 81–89. doi:10.11870/cjlyzyyhj201501011
Das, J., and Umamahesh, N. V. (2022). Heat wave magnitude over India under changing climate: Projections from CMIP5 and CMIP6 experiments. Int. J. Climatol. 42, 331–351. doi:10.1002/joc.7246
Eyring, V., Bony, S., Meehl, G. A., Senior, C. A., Stevens, B., Stouffer, R. J., et al. (2016). Overview of the coupled model Intercomparison project Phase 6 (CMIP6) experimental design and organization. Geosci. Model Dev. 9, 1937–1958. doi:10.5194/gmd-9-1937-2016
Fan, X., Miao, C., Duan, Q., Shen, C., and Wu, Y. (2020). The performance of CMIP6 versus CMIP5 in simulating temperature extremes over the global land surface. J. Geophys. Res. Atmos. 125, 1–16. doi:10.1029/2020jd033031
Grose, M. R., Narsey, S., Delage, F. P., Dowdy, A. J., Bador, M., Boschat, G., et al. (2020). Insights from CMIP6 for Australia's future climate. Earth's. Future 8, 1–24. doi:10.1029/2019EF001469
Hu, B. Y., Tang, J. P., and Wang, S. Y. (2013). Evaluation and projection of extreme events over China under PCCA1B scenario by MM5V3 model. Chin. J. Geophys. 56, 2195–2206. doi:10.6038/cjg201307
IPCC (2021). Climate change 2021: the physical science basis [M/OL]. Available at: https://www.ipcc.ch/report/ar6/wgl/downloads/report/IPCC_AR6_WGI_Full_Report.pdf (Accessed 08 01, 2021).
Jiang, T., Lv, Y. R., Huang, J. L., Wang, Y. J., Su, B. D., and Tao, H. (2020). New scenarios of CMIP6 model (SSP-RCP) and its application in the huaihe River Basin. Adv. Met. S&T. 10, 102–109. doi:10.3969/j.issn.2095-1973.2020.05.016
Jiang, W. H., and Chen, H. P. (2021). Assessment and projection of changes in temperature extremes over the mid-high latitudes of Asia based on CMIP6 models. Trans. Atmos. Sci. 44, 592–603. doi:10.13878/j.cnki.dqkxxb.20210203001
Kim, Y. H., Min, S. K., Zhang, X. B., Sillmann, J., and Sandstad, M. (2020). Evaluation of the CMIP6 multi-model ensemble for climate extreme indices. Weather Clim. Extrem. 29, 100269. doi:10.1016/j.wace.2020.100269
Li, D. H., Zhou, L. W., and Zhou, T. J. (2017). Changes of extreme indices over China in response to 1.5°C global warming projected by a regional climate model. Adv. Earth Sci. 32, 446–457. doi:10.11867/j.issn.1001-8166.2017.04.0446
Li, L. C., Yao, N., Li, Y., Liu, D. Li., Wang, B., Ayantobo, O. O., et al. (2018). Future projections of extreme temperature events in different sub-regions of China. Atmos. Res. 217, 150–164. doi:10.1016/j.atmosres.2018.10.019
Li, X. H., Chen, Z. F., and Wang, L. (2020). Analysis of the spatiotemporal variation characteristics of main extreme climate indices in Sichuan Province of China from 1968 to 2017. Appl. Ecol. Environ. Res. 18, 3211–3242. doi:10.15666/aeer/1802_32113242
Lin, W. Q., and Chen, H. P. (2020). Assessment of model performance of precipitation extremes over the mid-high latitude areas of northern hemisphere: from CMIP5 to CMIP6. Atmos. Ocean. Sci. Lett. 13, 598–603. doi:10.1080/16742834.2020.1820303
Liu, L., and Xu, Z. X. (2014). Spatiotemporal distribution of the extreme climate indices in the five southwestern provinces of China. Resour. Environ. Yangtze Basin 23, 294–301. doi:10.11870/cjlyzyyhj201402020
Luo, N., Guo, Y., Gao, Z. B., Chen, K. X., and Chou, J. M. (2020). Assessment of CMIP6 and CMIP5 model performance for extreme temperature in China. Atmos. Ocean. Sci. Lett. 6, 589–597. doi:10.1080/16742834.2020.1808430
Luo, Y., Fan, G. Z., Zhou, D. W., Hua, W., and Zhang, Y. L. (2016). Trend of extreme temperature in Southwest China in the recent 41 years. J. Southwest Univ. Nat. Sci. Ed. 38, 161–167. doi:10.13718/j.cnki.xdzk.2016.05.027
Ma, Z. F., Peng, J., Gao, W. L., and Tian, H. (2006). Climate variation of Southwest China in recent 40 years. Plateau Meteorol. 25, 633–642.
Mote, P. W., and Salathé, E. P. (2010). Future climate in the pacific northwest. Clim. Change 102, 29–50. doi:10.1007/s10584-010-9848-z
Peterson, T. C., Zhang, X. B., Brunet-India, M., and Vazquez-Aguirre, J. L. (2008). Changes in North American extremes derived from daily weather data. J. Geophys. Res. 113, D07113. doi:10.1029/2007jd009453
Quenum, G. M. L. D., Nkrumah, F., Klutse, N. A. B., and Sylla, M. B. (2021). Spatiotemporal changes in temperature and precipitation in west Africa. Part I: Analysis with the CMIP6 historical dataset. Water 13, 3506. doi:10.3390/w13243506
Shen, Y. C. (2014). Projection and evaluation of the temperature extremes indices over China by CMIP5 models. Nanjing: Nanjing University of Information Science & Technology.
Sobie, S. R., Zwiers, F. W., and Curry, C. L. (2021). Climate model projections for Canada: a comparison of CMIP5 and CMIP6. Atmosphere-Ocean 59, 269–284. doi:10.1080/07055900.2021.2011103
Sun, F. Y. (2018). Drought and flood outlook for the Yangtze River basin. Shanghai: East China Normal University.
Taylor, K. R. (2001). Summarizing multiple aspects of model performance in a single diagram. J. Geophys. Res. 106, 7183–7192. doi:10.1029/2000JD900719
Walsh, J. E., Chapman, W. L., Romanovsky, V., Christensen, J. H., and Stendel, M. (2008). Global climate model performance over Alaska and Greenland. J. Clim. 21, 6156–6174. doi:10.1175/2008jcli2163.1
Wehner, M. F. (20202020). Characterization of long period return values of extreme daily temperature and precipitation in the CMIP6 models: part 2, projections of future change. Weather Clim. Extrem. 30, 100284. doi:10.1016/j.wace.2020.100284
Wehner, M. F., Gleckler, P., and Lee, J. (2020). Characterization of long period return values of extreme daily temperature and precipitation in the CMIP6 models: Part 1, model evaluation. Weather Clim. Extrem. 30, 100283. doi:10.1016/j.wace.2020.100283
Wentz, F. J., Ricciardulli, L., Hilburn, K., and Mears, C. (2007). How much more rain will global warming bring? Science 317, 233–235. doi:10.1126/science.1140746
Wu, D., Pei, Y. S., Zhao, Y., and Xiao, W. H. (2012). Numerical simulations of climate change under IPCC A1B scenario in Southwestern China. Prog. Geogr. 31, 275–284.
Wu, Q., Jiang, X. W., and Xie, J. (2017). Evaluation of surface air temperature in Southwestern China simulated by the CMIP5 models. Plateau Meteorol. 36, 358–370. doi:10.7522/j.issn.1000-0534.2016.0046
Wu, Q., Jiang, X. W., Xie, J., and Zhu, H. (2018). Multimodel superensemble prediction of air temperature in Southwestern China during 2020-2050 based on CMIP5 data. J. Arid Meteorology 36, 971–978. doi:10.11755/j.issn.1006-7639(2018)-06-0971
Xiang, J. W., Zhang, L. P., Deng, Y., She, D. X., and Zhang, Q. (2021). Projection and evaluation of extreme temperature and precipitation in major regions of China by CMIP6 models. Eng. J. Wuhan Univ. 54, 46–57+81. doi:10.14188/j.1671-8844.2021-01-007
Xue, Y. T., Chen, Q. L., Zhang, J. Y., and Huang, P. (2020). Trends in extreme high temperature at different altitudes of Southwest China during 1961–2014. Atmos. Ocean. Sci. Lett. 13, 417–425. doi:10.1080/16742834.2020.1799689
Yang, X. L., Zhou, B. T., Xu, Y., and Han, Z. Y. (2021). CMIP6 evaluation and projection of temperature and precipitation over China. Adv. Atmos. Sci. 38, 817–830. doi:10.1007/s00376-021-0351-4
You, Q. L., Cai, Z. Y., Wu, F. Y., Jiang, Z. H., Pepin, N., Shen, S. S. P., et al. (2021). Temperature dataset of CMIP6 models over China: evaluation, trend and uncertainty. Clim. Dyn. 57, 17–35. doi:10.1007/s00382-021-05691-2
Yuan, W. D., and Zhen, J. K. (2015). Spatial and temporal variations of extreme temperature events in Southwestern China during 1962-2012. Resour. Environ. Yangtze Basin 24, 1246–1254. doi:10.11870/cjlyzyyhj201507023
Zhan, M. Y., Wang, G. J., Lu, J., Chen, L. Q., Zhu, C. X., Tong, J., et al. (2020). Projected evapotranspiration and the influencing factors in the Yangtze River Basin based on CMIP6 models. Trans. Atmos. Sci. 43, 1115–1126. doi:10.13878/j.cnki.dqkxxb.20200927002
Zhang, B. (2015). Evaluation and projection for extreme temperature events in China by CMIP5 global climate models. Chengdu: Chengdu University of Information Technology.
Zhang, G. W., Zeng, G., Yang, X. Y., and Jiang, Z. H. (2021). Future changes in extreme high temperature over China at 1.5°C-5°C global warming based on CMIP6 simulations. Adv. Atmos. Sci. 38, 253–267. doi:10.1007/s00376-020-0182-8
Zhang, W. L., Zhang, J. Y., and Fan, G. Z. (2015). Evaluation and projection of dry- and wet-season precipitation in Southwestern China using CMIP5 models. Chin. J. Atmos. Sci. 39, 559–570. doi:10.3878/j.issn.1006-9895.1408
Zhang, X., and Yang, F. (2004). RClimDex 1.1. Available at: http://etccdi.pacificclimate.org/software.shtml (Accessed July 15, 2019).
Zhao, T. B., Chen, L., and Ma, Z. G. (2014). Simulation of historical and projected climate change in arid and semiarid areas by CMIP5 models. Chin. Sci. Bull. 59, 412–429. doi:10.1007/s11434-013-0003-x
Zhou, B., T., and Qian, J. (2021). Changes of weather and climate extremes in the IPCC AR6. Clim. Change Res. 17, 713–718. doi:10.12006/j.issn.1673-1719.2021.167
Zhou, B. T. (2021). Global warming: scientific progress from AR5 to AR6. Trans. Atmos. Sci. 44, 667–671. doi:10.13878/j.cnki.dqkxxb.20210815009
Zhou, Q., Xing, Y., Ma, S. M., Zhang, X. D., Chen, J., Shi, C., et al. (2017). Responses of soil respiration to extreme low temperature and hydro-thermal factors in dryland region with different cropping patterns in Southwest China. Acta Prataculturae Sin. 26, 37–44. doi:10.11686/cyxb2016377
Keywords: extreme temperature index, spatiotemporal variation, CMIP6, projection of future trend, southwest China
Citation: Li X, Chen Z, Wang L and Liu H (2022) Future projections of extreme temperature events in Southwest China using nine models in CMIP6. Front. Earth Sci. 10:942781. doi: 10.3389/feart.2022.942781
Received: 13 May 2022; Accepted: 01 July 2022;
Published: 05 August 2022.
Edited by:
Xiefei Zhi, Nanjing University of Information Science and Technology, ChinaReviewed by:
Xiuxi Wang, Lanzhou University, ChinaShuyun Zhao, China University of Geosciences Wuhan, China
Copyright © 2022 Li, Chen, Wang and Liu. This is an open-access article distributed under the terms of the Creative Commons Attribution License (CC BY). The use, distribution or reproduction in other forums is permitted, provided the original author(s) and the copyright owner(s) are credited and that the original publication in this journal is cited, in accordance with accepted academic practice. No use, distribution or reproduction is permitted which does not comply with these terms.
*Correspondence: Xiehui Li, bGl4aWVodWkzMjUzMjhAMTYzLmNvbQ==