 Yu Wan1,2
 Zhicong Yin
 Qianyi Huo
 Botao Zhou
- 1Key Laboratory of Meteorological Disaster, Ministry of Education/Joint International Research Laboratory of Climate and Environment Change (ILCEC)/Collaborative Innovation Center on Forecast and Evaluation of Meteorological Disasters (CIC-FEMD), Nanjing University of Information Science and Technology, Nanjing, China
- 2Wuhan Central Meteorological Observatory, Wuhan, China
- 3Southern Marine Science and Engineering Guangdong Laboratory (Zhuhai), Zhuhai, China
- 4Nansen-Zhu International Research Centre, Institute of Atmospheric Physics, Chinese Academy of Sciences, Beijing, China
As global warming intensifies, hot extremes and heavy precipitation frequently happen in East of China. Meanwhile, severe surface ozone (O3) pollution resulting from the interactions of anthropogenic emissions and meteorological conditions also occur more frequently. In this study, we quantified the impact of weather extremes on ground-level O3 concentration during the summers of 2015–2021 and associated premature deaths in East of China. The O3 pollution influenced by hot extremes [maximum 8-h average O3 concentration (MDA8 O3) = 152.7 μg m−3] was 64.2% more severe than that associated with heavy rain (MDA8 O3 = 93 μg m−3) on the daily time scale. The compound hot and dry air extremes had a larger impact, and the associated MDA8 O3 could be up to 165.5 μg m−3. Thus, weather extremes could drastically perturb the O3 level in the air to exhibit large variability. Based on GEOS-Chem simulations with fixed anthropogenic emissions, forcing of weather extremes could successfully reproduce the large daily variability of O3 concentration because the weather extremes significantly influenced the physicochemical processes in the atmosphere. Furthermore, hot extremes magnified the single-day O3-related premature death to 153% of that under other-condition events, while heavy rain events decreased it to 70% in East of China. The findings of the present study have the potential to promote daily to weekly O3 forecasts and further improve our comprehensive understanding of the health effects of weather extremes and air pollution.
Introduction
Weather extremes have been occurring more frequently and are posing huge threats to human society, infrastructure, and the natural environment (Zhang Q. et al., 2017; Chen and Sun, 2021; Wang et al., 2022). The sequential flood-heatwave disasters in Japan during 2018 caused thousands of deaths in a single week (Kim et al., 2019). In 2021, an extreme precipitation event hit the Henan Province in China and resulted in more than 300 deaths and an economic loss of 17.7 billion dollars (World Meteorological Organization, 2021). In addition, the heatwave in the summer of 2003 led to about 70,000 deaths in Europe (Robine et al., 2008). Furthermore, largest warming (particularly increases in maximum air temperature) and enhanced heavy precipitation were projected to occur in East of China in most of the coming decades (Zhou et al., 2014; Li et al., 2021; Qiao et al., 2021; Yang et al., 2021).
In recent years, ground-level ozone (O3) has exceeded fine particulate matters to become a primary air pollutant that affects East of China (Wang et al., 2017; Fu et al., 2019). Meanwhile, the O3 pollution in the summer was the most serious and would have caused a greater impact on human health. Because anthropogenic emissions remain approximately invariant on the daily time scale, the daily variability of O3 concentration was mainly dominated by weather conditions (Han et al., 2020; Yin and Ma, 2020; Tang G. et al., 2021). Large concentrations of surface O3 were observed to occur frequently with high air temperature, strong solar radiation, and low air humidity (Pu et al., 2017; Li et al., 2022). The relationships between high ozone days and weather extremes in the eastern U.S. have been analyzed, and Zhang H. et al. (2017) found that high ozone extremes were most sensitive to daily maximum air temperature and minimum relative humidity. Based on simulations of the Weather Research and Forecasting model coupled with Chemistry (WRF-Chem), the O3 concentration in the U.S. associated with heat waves and atmospheric stagnation proved to be much larger than that under non-extreme weather conditions in the present and also in the future. Moreover, compound weather events had a larger impact than a single event because the temperature was noticeably higher and the wind speed was abnormally weaker (Zhang et al., 2018). However, quantitative studies on the impacts of weather extremes on O3 pollution in East of China are far less than sufficient to the best of our knowledge.
Short-term exposure to peak levels of ozone can largely affect the lungs, the respiratory tract, and the eyes, and increase susceptibility to inhaled allergens. In the worst situation, it can even lead to premature mortalities (Chen et al., 2017; Orellano et al., 2020). Even when O3 concentration was lower than the level influencing pulmonary function, the blood pressure of healthy adults could still increase and possibly affect their cardiovascular health (Day et al., 2017). Fenech et al. (2019) examined the meteorological drivers associated with two five-day episodes of air pollution in 2006 and found about 70 daily premature deaths because of short-term O3 exposure across the UK. In China, the number of premature deaths attributed to short-term O3 exposure increased by 9,100 from 2013 to 2018 in 74 key cities, and the national premature mortalities in 2018 were 6.32 × 10⁴ (Wang et al., 2021). With every 10 μg/m3 increase in ozone, the rates of respiratory deaths and non-accidental deaths respectively increased by 2.22 and 0.05% in highly O3-polluted areas of China (Lei et al., 2019). As shown clearly from site observations, large daily variabilities of O3 concentration existed (Supplementary Figure S1), and must have resulted in evident day-to-day differences in premature mortalities.
At present, few studies have been conducted to quantify to what extent weather extremes (e.g., hot, hot-dry, and heavy rain events) influence O3 concentration and their associated health effects in East of China. Accurate quantification of large O3 variability and premature deaths associated with different weather extremes could not only provide scientific support for O3 pollution forecasts but also contribute to a comprehensive understanding of the health effects of weather extremes and air pollution.
Data and Methods
Observations
The daily meteorological data with a horizontal resolution of 0.5° latitude by 0.625° longitude from 1981 to 2021 were derived from the Modern-Era Retrospective analysis for Research and Applications version 2 (MERRA2) dataset (Gelaro et al., 2017). The data included daily maximum temperature (Tmax), surface relative humidity, precipitation, planetary boundary layer (PBL) height, and downward solar radiation. In addition, the Tmax and precipitation data from the gridded daily observation dataset over China region (CN05.1) were downloaded to verify the impact of weather extremes on O3. Surface O3 concentrations have been observed and widely implemented since 2015 in China. The impact of weather extremes on O3 during 2015–2021 were studied. Ground-level O3 concentrations from 2015–2021 were downloaded from https://quotsoft.net/air/. The daily maximum 8-h average O3 concentration (MDA8 O3) was used to represent ozone pollution condition.
Weather Extremes
Following Lu et al. (2016) and Zhang et al. (2011), we used percentile-based indices to describe three types of weather extremes as follows:
(1) Warm temperature events indicated weather conditions with Tmax higher than the 90th percentile threshold during 1981–2010 (hereafter called TX90).
(2) Compound hot and dry air events indicated weather conditions with Tmax higher than the 90th percentile threshold and relative humidity smaller than 10th percentile during 1981–2010 (hereafter called TX90H10).
(3) Heavy precipitation events indicated weather conditions with daily precipitation higher than the 95th percentile threshold during 1981–2010 (hereafter called R95).
All other weather conditions, except for the aforementioned three weather extremes in the summer, were defined as other-condition events (hereafter called OCE).
GEOS-Chem Simulation
A global 3-D chemical transport model (GEOS-Chem) was implemented to simulate surface ozone concentration in East of China. The GEOS-Chem model includes fully coupled O3-NOx-hydrocarbon and aerosol chemistry with more than 80 species and 300 reactions (Bey et al., 2001). The major physical-chemical processes used for the budget diagnostics included chemical reaction, transport, PBL mixing, convection, and their summary within the PBL (Liao et al., 2006).
The GEOS-Chem model could well reproduce the daily-interannual variation and spatial distribution of surface ozone concentration (Yin and Ma, 2020; Ma and Yin, 2021). In this study, we also evaluated the performance of the GEOS-Chem model. Observations and model results during the summer of 2020 and extreme weather events during 2015–2021 were shown in Supplementary Figure S1. Statistical metrics such as correlation coefficient (Cor), normalized mean bias (NMB), and normal mean error (NME) were calculated. The spatial correlation coefficient between observations and the model simulation, respectively, is 0.87 and 0.82 during the summer of 2020 and extreme weather events, indicating that the simulated MDA8 O3 agreed well with the observed distribution. Moreover, NMB was 0.49% (4.9%) and NME was 10.2% (11.2%) during the summer of 2020 (extreme weather events), indicating a good capability of the GEOS-Chem model for the simulation of MDA8 O3 concentration both on a daily time scale and weather extremes. However, the GEOS-Chem model was short of reproduction when the MDA8 O3 > 150 μg m−3, i.e., underestimating the severest surface O3 caused by weather extremes (Supplementary Figure S1b).
Premature Mortality
The Environmental Benefits Mapping and Analysis Program-Community Edition (BenMAP-CE) has been used to calculate the premature mortality due to short-term exposure to ozone pollution (Fenech et al., 2019). The formulas are as follows:
where M is the all-cause premature mortality attributed to ambient ozone, Y0 is the baseline mortality rate due to a specific disease category, and P is the population. The value of Y0 from 2015 to 2019 could be obtained from the China Public Health and Family Planning Statistical Yearbook, and Y0 for 2020–2021 was set to be the same as that in 2019. The gridded population data were downloaded from the Socioeconomic Data and Applications Center. R is the relative risk for a specific disease, which can be calculated by utilizing the integrated exposure response (IER) model. β is the estimated slope of the log-linear relationship between ozone concentration and all-cause mortality. Ye et al. (2020) conducted a meta-analysis of the associations between short-term ozone exposure and human mortality in China. Their result (β = 0.0003992) was used in the present study. C is the observed ozone concentration (unit: μg m−3), and
Large O3 Variabilities Due to Weather Extremes
During the summers of 2015–2021, the occurrence frequencies of hot extreme and heavy rain (i.e., TX90 and R95) were higher than those during 1981–2014 in most of the stations in East of China (Figures 1A,C). There were 10.2 TX90 days per summer in East of China (8.3 in NC, 8.4 in YRD, and 15 days in PRD) during 2015–2021, while the number of R95 days was 5.1 per summer (5, 6.1, and 4 days in NC, YRD, and PRD, respectively). The mean of Tmax values accompanied with the occurrences of TX90 and R95 events were 37.3 and 28.9°C, respectively. The intensities of precipitation during TX90 and R95 were 0.4 and 34 mm/d, respectively. This result indicated significant differences in meteorological conditions (above 95% confidence level). Furthermore, the mean PBL heights on the days of TX90 and R95 were 585.7 m (12.7% higher than OCE) and 442.6 m (14.8% lower than OCE) and the surface incoming shortwave fluxes were 9.7 × 10⁵ J m−2 (26% stronger than OCE) and 4.8 × 10⁵ J m−2 (37.7% weaker than OCE), respectively (Supplementary Figure S2). As a compound extreme weather, TX90H10 represented the meteorological conditions with both hot temperature (mean Tmax = 37.5°C) and dry air (mean relative humidity = 29.4%). There were 2.8 TX90H10 days per summer in East of China (2.1, 2.2, and 7 days in NC, YRD, and PRD, respectively, as shown in Figure 1B). Hot temperature contributed to efficient photochemical reactions and natural precursor emissions (Pu et al., 2017). Dry air and strong solar radiation also helped to enhance photochemical reactions in the air (Zhang and Wang, 2016; Lu et al., 2019). Detected by tethered balloons, higher PBL height with stronger free convection condition were found to be beneficial for the aggravation of ozone pollution in China (Tang R. et al., 2021). The impacts of precipitation on surface O3 were relatively complex. In addition to temperature reduction and cloud shading accompanied with precipitation process, heavy rain itself could remove the stock of O3 in the air (Meleux et al., 2007). Therefore, large daily differences in weather conditions potentially resulted in large variabilities of surface O3 concentration.
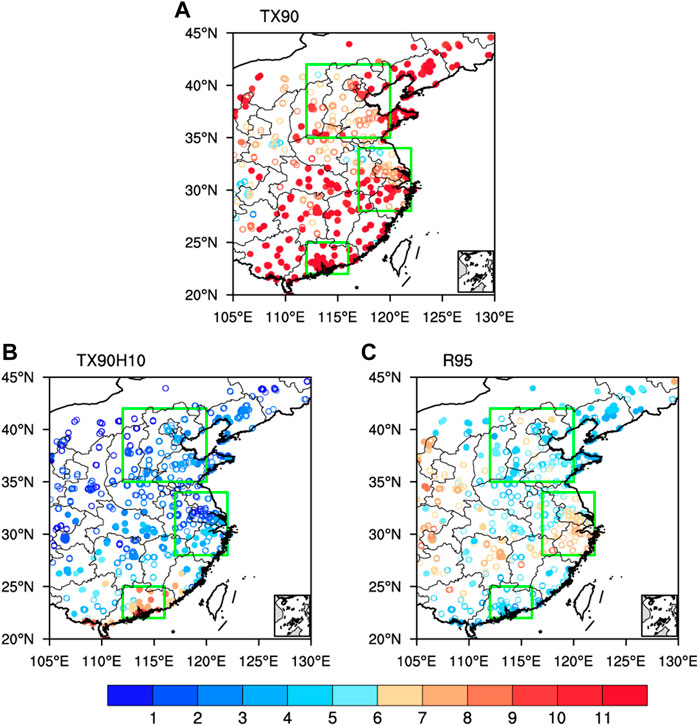
FIGURE 1. Observed numbers of (A) warm temperature events (TX90), (B) compound hot and dry air events (TX90H10), and (C) heavy precipitation events (R95) in the summers of 2015–2021. The solid circles indicate that the mean extreme weather days during 2015–2021 were higher than that during 1981–2014. The green boxes represent the location of North China, Yangtze River Delta, and Pearl River Delta.
To quantify the impacts of weather extremes, O3 concentrations under TX90, TX90H10, and OCE during the summers of 2015–2021 were composited. The values were 152.7 μg m−3, 165.5 μg m−3, and 115.6 μg m−3, respectively, in East of China (Figure 2). That is, the hot extremes could increase O3 concentration by 32.1% in East of China with respect to O3 concentration under OCE conditions. When dry air was coexistent with hot temperature (i.e., compound extreme TX90H10), the anomalous percentage of O3 concentration was raised to 43.2%. However, the mean O3 concentration in R95 days was only 93 μg m−3, indicating that the meteorological condition of heavy rain could reduce O3 concentration by 19.6% (Figure 2). In general, the O3-polluted condition corresponding to TX90 (TX90H10) was 51.7% (62.8%) worse than that corresponding to R95. In other words, weather extremes resulted in quite large variabilities of ground-level O3 concentration. In addition to the aforementioned observational analysis, the GEOS-Chem model was also driven by weather extremes but with fixed anthropogenic emissions to simulate O3 concentration. Many previous studies pointed out that numerical models had limited capability for the simulation of weather extremes and air pollution in response to the extremes (Zhang and Wang, 2016; Zhang et al., 2018; Zhang et al., 2020).
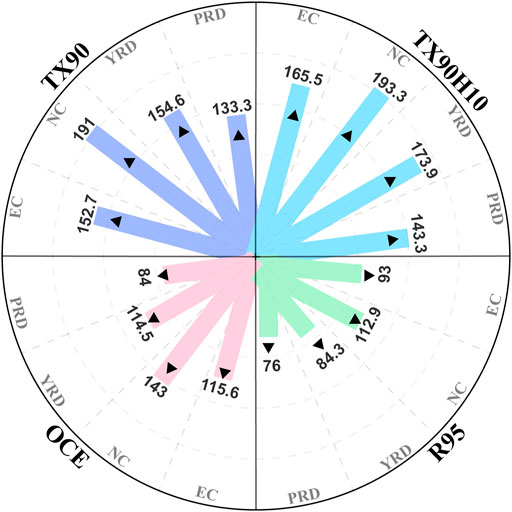
FIGURE 2. Area-averaged MDA8 O3 concentrations (unit: μg m−3) corresponding to TX90, TX90H10, R95, and OCE during the summers of 2015–2021 in East of China (EC), North China (NC), the Yangtze River Delta (YRD), and the Pearl River Delta (PRD). The numbers represent ozone concentrations. The results from GEOS-Chem simulations were denoted by solid triangles on the bars.
Underestimation of high concentrations of O3, as shown in Supplementary Figure S1B, is one of the possible reasons that the GEOS-Chem model failed to simulate the large percentage change of MDA8 O3 induced by weather extremes in East of China. Results of the present study indicate that, although the quantitative values simulated by the GEOS-Chem model were smaller, the significant influences of TX90, TX90H10, and R95 on O3 concentration were well verified (Figure 2; Supplementary Figure S3). Similar analysis was also conducted for each individual year. The abnormal percentages of O3 concentration remain steadily at around 30% under TX90, 40% under TX90H10, and −20% under R95 during the years of 2015–2021 (Supplementary Figure S3). These quasi-steady percentage changes would be helpful in forecasting O3 pollution on daily to weekly time scales.
To explore the spatial heterogeneity of O3 concentration, the impact of weather extremes in three severely O3-polluted areas were analyzed. The summer-mean O3 pollution was the severest in NC (145.7 μg m−3), followed by that in YRD (115.9 μg m−3) and PRD (91.2 μg m−3). O3 concentrations in all the three areas significantly exceeded the peak-season threshold of O3 concentration (i.e., 60 μg m−3) recommended by the World Health Organization (Zhu et al., 2022). Closely related to the regional O3-polluted level, the O3 concentrations under TX90 (TX90H10) were 191 (193.3), 154.6 (173.9), and 133.3 (143.3) μg m−3 in NC, YRD, and PRD during the summers of 2015–2021 (Figure 2). Under the meteorological condition of heavy rain, however, the O3 concentrations were only 112.9, 84.3, and 76.0 μg m−3 in NC, YRD, and PRD, respectively (Figure 2). Unlike absolute O3 concentration, the anomalous percentage of O3 concentration under TX90 compared to that under OCE was about 34% both in NC and YRD, but it increased to 60% in PRD (Supplementary Figure S4). This result indicated that hot extremes could induce a larger percentage increase of O3 concentration compared to that in normal conditions in PRD than in the other two regions. The O3 anomalous percentage under R95 was −20.9, −25.8, and −6.1% in NC, YRD, and PRD, respectively, during the summers of 2015–2021. These regional differences were also evident in the GEOS-Chem simulations (Supplementary Figure S4), and they probably had close relationships with local climate conditions and anthropogenic emissions.
Associated physical-chemical processes in East of China were analyzed based on the GEOS-Chem simulations (Figure 3). During OCE days, the mass fluxes of chemistry, transport, convection, and PBL mixing were 6.36, −1.14, 0.44, and −2.14 Tons d−1. In regard to chemical processes, high temperature could induce larger natural emissions of BVOCS and soil NOX, accelerate photochemical reaction (Lu et al., 2019), and enhance thermal decomposition of peroxyacetyl nitrate (PAN) to provide additional NOX (Doherty et al., 2013). Conversely, heavy rain with more cloud cover could reduce the photolysis rate of NO2 (Lien and Hung, 2021). Meanwhile, the reduced solar radiation led to decreases in ozone production rate and natural emission (Jiang et al., 2021). Consequently, hot extremes led to almost double mass flux of chemistry (11.32 Tons d−1). In contrast, the chemical flux was largely suppressed by heavy rainfall in East of China (1.55 Tons d−1, Figure 3). The fluxes of transport and mixing processes heavily depended on wind anomalies, free convection conditions, ozone level and its concentration gradient (Jiang et al., 2021; Tang G. et al., 2021). During TX90 days, the atmospheric circulation could transport more O3 pollutants under TX90 condition (−3.07 Tons d−1). However, the mass flux of transport turned out to be positive (1.37 Tons d−1) during heavy rainfall events, indicating that more O3 pollutants remained in the air (Figure 3). Compared to that in the OCE days, the anomaly of PBL mixing flux was negative (−0.69 Tons d−1) due to hot temperature, while that under the influence of heavy rain was positive (0.68 Tons d−1). As shown in Figure 3, the quantity value of convection and its response to weather extremes were both tiny. In summary, when the weather was hot (hot-dry), 64.6% (72.5%) more O3 pollutants were produced. However, the O3 production was reduced by half during heavy precipitation events (Figure 3).
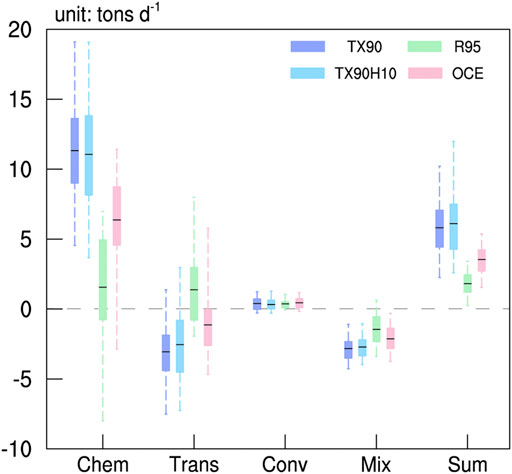
FIGURE 3. Mass fluxes of ozone (units: tons d−1) simulated by the GEOS-Chem corresponding to TX90, TX90H10, R95, and OCE during the summers of 2015–2021 in East of China. The boxplots showed the 25th percentile and 75th percentile and medians. The x-axis indicates the physicochemical processes: chemistry, transport, convection, mixing and their sum within the planetary boundary layer.
Impacts on Premature Deaths
Weather extremes not only affected human health by basic meteorological factors (i.e., hot environment and rainfall intensity), but also modulated premature deaths associated with surface O3 pollution. Short-term O3 exposure could increase human premature deaths by elevating the risks of respiratory and cardiovascular diseases (Dong et al., 2016; Lei et al., 2019). To comprehensively understand the causes and consequences related to large variabilities of ozone pollution, the all-cause premature mortalities due to short-term O3 exposure were calculated using the BenMAP-CE approach. The number of accumulated premature mortalities in the summers of 2015–2021 was 13.8 × 10⁴ (90% CI: 12.4–15.1 × 10⁴) in East of China (Figure 4). Furthermore, the premature mortalities were greatly different between NC (5.6 × 10⁴, 90% CI: 5.0–6.1 × 10⁴), YRD (2.7 × 10⁴, 90% CI: 2.4–3.0 × 10⁴), and PRD (0.3 × 10⁴, 90% CI: 0.29–0.35 × 10⁴). These obvious regional differences were mainly a result of local levels of O3 pollution and resident population. For example,
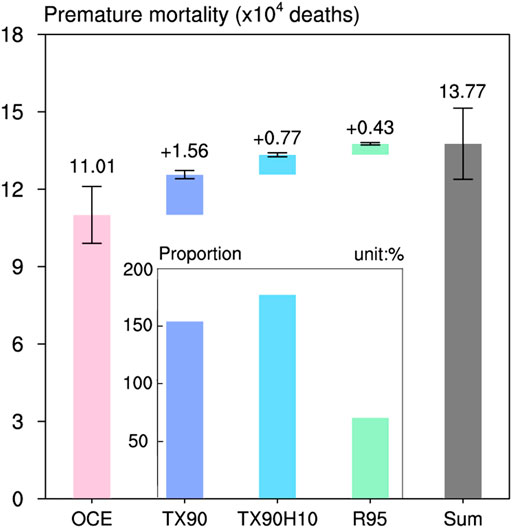
FIGURE 4. Numbers of premature deaths in East of China corresponding to TX90, TX90H10, R95, OCE, and their accumulated total in the summers of 2015–2021. Vertical black bars represent the ±10% intervals. The proportions of area-averaged premature death during TX90, TX90H10, and R95 with respect to those during OCE were also displayed in the inner panel.
In addition to the spatial disparity, the aforementioned premature mortalities also varied greatly on a daily time scale. Hot temperature enlarged the daily death toll owing to short-term O3 exposure to 153% of that under OCE conditions. Dry air would pile up another 23% increase in danger. However, heavy rain would decrease the O3 concentration and thus cause fewer daily premature deaths, which was 70% under the OCE conditions. As shown in Figure 4, the premature mortalities due to O3 exposure associated with TX90 (excluding TX90H10), TX90H10, and R95 in East of China were 1.56 × 10⁴ (90% CI: 1.40–1.71 × 10⁴), 0.77 × 10⁴ (90% CI: 0.69–0.84 × 10⁴), and 0.43 × 10⁴ (90% CI: 0.38–0.47 × 10⁴) persons, respectively. Although the impacts of weather extremes on short-term O3 exposure were significant, 79.7% of premature mortalities occurred without weather extremes because of a much larger OCE frequency (Figure 4). It is noted that while TX90 and R95 were not independent, there was only 1 day in seven summers in East of China when these two weather extremes happened simultaneously, which had little impact on total premature mortalities. The percentages were 82.3, 82.1, and 11.9% in NC, YRD, and PRD (Supplementary Figure S5), respectively. The small percentage in PRD was closely related to the relatively good air quality there, and indicated most remarkable impacts of weather extremes on premature mortalities due to short-term O3 exposure.
Conclusion and Discussion
In this study, we quantified the impacts of weather extremes on surface O3 pollution in East of China and their modulation of premature deaths caused by short-term O3 exposure. Hot extremes (i.e., TX90 with Tmax = 37.3°C) could greatly enhance the mass fluxes of chemistry, which was favorable for production of more O3 pollutants (Figure 3). Although more O3 could be removed by transport and PBL mixing processes, the summary mass fluxes were still 64.6% higher than those under other-condition events (i.e., OCE). Conversely, heavy precipitation (i.e., R95 with rain intensity = 34 mm/d) and associated meteorological conditions could obviously reduce the production of O3 pollutants (−48.7% lower than that in OCE days). Consequently, the MDA8 O3 were 152.7 and 93 μg m−3 in East of China under TX90 and R95 conditions, respectively, which were 32.1% higher and 19.6% lower than their mean values in OCE days. The compound hot-dry extreme could result in a larger O3 concentration that is 43.2% higher than that under the OCE conditions (Figure 2). Furthermore, the impacts of weather extremes on O3 variability were geographically inhomogeneous. That is, a hot environment could lead to a larger deviation of O3 concentration in PRD than in the other two regions, while the influence of heavy rainfall on O3 concentration was the weakest in PRD. In addition to observational analysis, GEOS-Chem simulations were also conducted to verify the large variability in O3 pollution driven by weather extremes. To enhance the reliability of the conclusion, the CN05.1 dataset was also employed to explore the impact of weather extremes on O3 concentration. As shown in Supplementary Figure S6, identical results were obtained.
The health benefits of short-term O3 exposure were also evaluated under different weather conditions. It is found that hot extremes increased the daily death toll to 153% of that under other-condition events. In contrast, the daily death toll decreased to 70% of that under other-condition events by heavy precipitation. The premature mortalities due to short-term O3 exposure respectively associated with TX90 (excluding TX90H10), TX90H10, and R95 were 1.56 × 10⁴ (90% CI: 1.40–1.71 × 10⁴), 0.77 × 10⁴ (90% CI: 0.69–0.84 × 10⁴), and 0.43 × 10⁴ (90% CI: 0.38–0.47 × 10⁴) persons in East of China (Figure 4). However, these results about premature mortality were preliminarily estimated by an idealized tool named BenMAP-CE, and they did not exactly correspond to the actual mortalities. It is imperative to check the relationships based on clinical cases and analyze the associated mechanisms. Furthermore, the weather extremes could also affect human health and lead to premature mortality by the meteorological conditions without O3 pollution. Therefore, it is emergent to distinguish the health effects between weather extremes themselves and the associated O3 extremes. More importantly, the new findings of the present study provides a more comprehensive understanding of health effects of weather extremes and air pollution.
Nowadays, daily to weekly forecasts of weather and air quality to a great extent depends on numerical models. It is widely known that weather models still have limited capability for forecasting weather extremes; that is, obvious biases exist in the numerical prediction (Huang and Ding, 2021). In this study, we find that the atmospheric chemical model failed to simulate the large percentage change of MDA8 O3 induced by weather extremes in East of China, which implies the imperative necessity to improve model performance for the simulation of extreme events by both numerical weather models and atmospheric chemical models. In addition, the mechanisms of how a specific meteorological element influenced the atmospheric physical-chemical processes (particularly fluxes of transport and PBL mixing) were still unclear and needed further studies. The observed quasi-steady changes of MDA8 O3 concentration influenced by weather extremes had the potential to promote daily to weekly forecasts and further support short-term control measures, such as limitations on industrial and traffic emissions.
Data Availability Statement
The original contributions presented in the study are included in the article/Supplementary Material; further inquiries can be directed to the corresponding author.
Author Contributions
HW and BZ designed and supported this research. ZY and YW performed statistical and numerical studies. QH participated in analysis of health benefits. ZY prepared the manuscript with contributions from all co-authors.
Funding
This research is supported by the National Natural Science Foundation of China (No. 42088101).
Conflict of Interest
The authors declare that the research was conducted in the absence of any commercial or financial relationships that could be construed as a potential conflict of interest.
Publisher’s Note
All claims expressed in this article are solely those of the authors and do not necessarily represent those of their affiliated organizations, or those of the publisher, the editors, and the reviewers. Any product that may be evaluated in this article, or claim that may be made by its manufacturer, is not guaranteed or endorsed by the publisher.
Supplementary Material
The Supplementary Material for this article can be found online at: https://www.frontiersin.org/articles/10.3389/feart.2022.947001/full#supplementary-material
References
Bey, I., Jacob, D. J., Yantosca, R. M., Logan, J. A., Field, B. D., Fiore, A. M., et al. (2001). Global Modeling of Tropospheric Chemistry with Assimilated Meteorology: Model Description and Evaluation. J. Geophys. Res. 106, 23073–23095. doi:10.1029/2001jd000807
Chen, H., and Sun, J. (2021). Anthropogenic Influence Has Increased Climate Extreme Occurrence over China. Sci. Bull. 66, 749–752. doi:10.1016/j.scib.2020.12.001
Chen, K., Zhou, L., Chen, X., Bi, J., and Kinney, P. L. (2017). Acute Effect of Ozone Exposure on Daily Mortality in Seven Cities of Jiangsu Province, China: No Clear Evidence for Threshold. Environ. Res. 155, 235–241. doi:10.1016/j.envres.2017.02.009
Day, D. B., Xiang, J., Mo, J., Li, F., Chung, M., Gong, J., et al. (2017). Association of Ozone Exposure with Cardiorespiratory Pathophysiologic Mechanisms in Healthy Adults. JAMA Intern Med. 177, 1344–1353. doi:10.1001/jamainternmed.2017.2842
Doherty, R. M., Wild, O., Shindell, D. T., Zeng, G., MacKenzie, I. A., Collins, W. J., et al. (2013). Impacts of Climate Change on Surface Ozone and Intercontinental Ozone Pollution: A Multi-Model Study. J. Geophys. Res. Atmos. 118, 3744–3763. doi:10.1002/jgrd.50266
Dong, J. Y., Liu, X. R., Zhang, B. Z., Wang, J. Y., and Shang, K. Z. (2016). Meta-analysis of Association between Short-Term Ozone Exposure and Population Mortality in China. Acta Sci. Circums 36, 1477–1485. doi:10.13671/j.hjkxxb.2015.0555
Fenech, S., Doherty, R. M., Heaviside, C., Macintyre, H. L., O'Connor, F. M., Vardoulakis, S., et al. (2019). Meteorological Drivers and Mortality Associated with O3 and PM2.5 Air Pollution Episodes in the UK in 2006. Atmos. Environ. 213, 699–710. doi:10.1016/j.atmosenv.2019.06.030
Fu, Y., Liao, H., and Yang, Y. (2019). Interannual and Decadal Changes in Tropospheric Ozone in China and the Associated Chemistry-Climate Interactions: A Review. Adv. Atmos. Sci. 36, 975–993. doi:10.1007/s00376-019-8216-9
Gelaro, R., McCarty, W., Suárez, M. J., Todling, R., Molod, A., Takacs, L., et al. (2017). The Modern-Era Retrospective Analysis for Research and Applications, Version 2 (MERRA-2). J. Clim. 30, 5419–5454. doi:10.1175/jcli-d-16-0758.1
Han, H., Liu, J., Shu, L., Wang, T., and Yuan, H. (2020). Local and Synoptic Meteorological Influences on Daily Variability in Summertime Surface Ozone in Eastern China. Atmos. Chem. Phys. 20, 203–222. doi:10.5194/acp-20-203-2020
Huang, X., and Ding, A. (2021). Aerosol as a Critical Factor Causing Forecast Biases of Air Temperature in Global Numerical Weather Prediction Models. Sci. Bull. 66, 1917–1924. doi:10.1016/j.scib.2021.05.009
Jiang, Z., Li, J., Lu, X., Gong, C., Zhang, L., and Liao, H. (2021). Impact of Western Pacific Subtropical High on Ozone Pollution over Eastern China. Atmos. Chem. Phys. 21, 2601–2613. doi:10.5194/acp-21-2601-2021
Kim, H., Madakumbura, G. D., Wang, S. Y., Shiogama, H., Fischer, E. M., Utsumi, N., et al. (2019). Flood and Heatwave in Japan 2018 and Future Increase of Consecutive Compound Risk in a Warmer World. AGU Fall Meet. Abstr. GC53C–07. . Available at: https://agu.confex.com/agu/fm19/meetingapp.cgi/Paper/630667.
Lei, R., Zhu, F., Cheng, H., Liu, J., Shen, C., Zhang, C., et al. (2019). Short-term Effect of PM2.5/O3 on Non-accidental and Respiratory Deaths in Highly Polluted Area of China. Atmos. Pollut. Res. 10, 1412–1419. doi:10.1016/j.apr.2019.03.013
Li, C., Zwiers, F., Zhang, X., Li, G., Sun, Y., and Wehner, M. (2021). Changes in Annual Extremes of Daily Temperature and Precipitation in CMIP6 Models. J. Clim. 34, 3441–3460. doi:10.1175/jcli-d-19-1013.1
Li, M., Yang, Y., Wang, P., Ji, D., and Liao, H. (2022). Impacts of Strong El Niño on Summertime Near-Surface Ozone over China. Atmos. Ocean. Sci. Lett. 15, 100193. doi:10.1016/j.aosl.2022.100193
Liao, H., Chen, W.-T., and Seinfeld, J. H. (2006). Role of Climate Change in Global Predictions of Future Tropospheric Ozone and Aerosols. J. Geophys. Res. 111, D12304. doi:10.1029/2005jd006852
Lien, J., and Hung, H.-M. (2021). The Contribution of Transport and Chemical Processes on Coastal Ozone and Emission Control Strategies to Reduce Ozone. Heliyon 7, e08210. doi:10.1016/j.heliyon.2021.e08210
Lu, C., Sun, Y., Wan, H., Zhang, X., and Yin, H. (2016). Anthropogenic Influence on the Frequency of Extreme Temperatures in China. Geophys. Res. Lett. 43, 6511–6518. doi:10.1002/2016gl069296
Lu, X., Zhang, L., Chen, Y., Zhou, M., Zheng, B., Li, K., et al. (2019). Exploring 2016-2017 Surface Ozone Pollution over China: Source Contributions and Meteorological Influences. Atmos. Chem. Phys. 19, 8339–8361. doi:10.5194/acp-19-8339-2019
Ma, X., and Yin, Z. (2021). Dipole Pattern of Summer Ozone Pollution in the East of China and its Connection with Climate Variability. Atmos. Chem. Phys. 21, 16349–16361. doi:10.5194/acp-21-16349-2021
Meleux, F., Solmon, F., and Giorgi, F. (2007). Increase in Summer European Ozone Amounts Due to Climate Change. Atmos. Environ. 41, 7577–7587. doi:10.1016/j.atmosenv.2007.05.048
Orellano, P., Reynoso, J., Quaranta, N., Bardach, A., and Ciapponi, A. (2020). Short-term Exposure to Particulate Matter (PM10 and PM2.5), Nitrogen Dioxide (NO2), and Ozone (O3) and All-Cause and Cause-specific Mortality: Systematic Review and Meta-Analysis. Environ. Int. 142, 105876. doi:10.1016/j.envint.2020.105876
Pu, X., Wang, T. J., Huang, X., Melas, D., Zanis, P., Papanastasiou, D. K., et al. (2017). Enhanced Surface Ozone during the Heat Wave of 2013 in Yangtze River Delta Region, China. Sci. Total Environ. 603-604, 807–816. doi:10.1016/j.scitotenv.2017.03.056
Qiao, S. B., Chen, D., Wang, B., Cheung, H. N., Liu, F., Cheng, J. B., et al. (2021). The Longest 2020 Meiyu Season over the Past 60 Years: Subseasonal Perspective and its Predictions. Geophys Res. Lett. 48, e2021GL093596. doi:10.1029/2021gl093596
Robine, J.-M., Cheung, S. L. K., Le Roy, S., Van Oyen, H., Griffiths, C., Michel, J.-P., et al. (2008). Death Toll Exceeded 70,000 in Europe during the Summer of 2003. Comptes Rendus Biol. 331, 171–178. doi:10.1016/j.crvi.2007.12.001
Tang, G., Liu, Y., Huang, X., Wang, Y., Hu, B., Zhang, Y., et al. (2021). Aggravated Ozone Pollution in the Strong Free Convection Boundary Layer. Sci. Total Environ. 788, 147740. doi:10.1016/j.scitotenv.2021.147740
Tang, R., Huang, X., Zhou, D., Wang, H., Xu, J., and Ding, A. (2021). Global Air Quality Change during the COVID-19 Pandemic: Regionally Different Ozone Pollution Responses COVID-19. Atmos. Ocean. Sci. Lett. 14, 100015. doi:10.1016/j.aosl.2020.100015
Wang, F., Qiu, X., Cao, J., Peng, L., Zhang, N., Yan, Y., et al. (2021). Policy-driven Changes in the Health Risk of PM2.5 and O3 Exposure in China during 2013-2018. Sci. Total Environ. 757, 143775. doi:10.1016/j.scitotenv.2020.143775
Wang, H., Dai, Y., Yang, S., Li, T., Luo, J., Sun, B., et al. (2022). Predicting Climate Anomalies: A Real Challenge. Atmos. Ocean. Sci. Lett. 15, 100115. doi:10.1016/j.aosl.2021.100115
Wang, T., Xue, L., Brimblecombe, P., Lam, Y. F., Li, L., and Zhang, L. (2017). Ozone Pollution in China: A Review of Concentrations, Meteorological Influences, Chemical Precursors, and Effects. Sci. Total Environ. 575, 1582–1596. doi:10.1016/j.scitotenv.2016.10.081
World Meteorological Organization (WMO) (2021). State of the Climate in 2021: Extreme Events and Major Impacts. Available at: https://public.wmo.int/en/media/press-release/state-of-climate-2021-extreme-events-and-major-impacts.
Yang, J., Zhou, M., Ren, Z., Li, M., Wang, B., Liu, D. L., et al. (2021). Projecting Heat-Related Excess Mortality under Climate Change Scenarios in China. Nat. Commun. 12, 1039. doi:10.1038/s41467-021-21305-1
Ye, W. P., Liu, M. M., and Bi, J. (2020). Meta-analysis of the Associations between Short-Term Ozone Exposure and Human Mortality in China. Acta Sci. Circumst. (in Chin. 40, 2644–2651.
Yin, Z., and Ma, X. (2020). Meteorological Conditions Contributed to Changes in Dominant Patterns of Summer Ozone Pollution in Eastern China. Environ. Res. Lett. 15, 124062. doi:10.1088/1748-9326/abc915
Zhang, H., Wang, Y., Park, T.-W., and Deng, Y. (2017). Quantifying the Relationship between Extreme Air Pollution Events and Extreme Weather Events. Atmos. Res. 188, 64–79. doi:10.1016/j.atmosres.2016.11.010
Zhang, J., Gao, Y., Luo, K., Leung, L. R., Zhang, Y., Wang, K., et al. (2018). Impacts of Compound Extreme Weather Events on Ozone in the Present and Future. Atmos. Chem. Phys. 18, 9861–9877. doi:10.5194/acp-18-9861-2018
Zhang, Q., Zheng, Y., Singh, V. P., Luo, M., and Xie, Z. (2017). Summer Extreme Precipitation in Eastern China: Mechanisms and Impacts. J. Geophys. Res. Atmos. 122, 2766–2778. doi:10.1002/2016jd025913
Zhang, X., Alexander, L., Hegerl, G. C., Jones, P., Tank, A. K., Peterson, T. C., et al. (2011). Indices for Monitoring Changes in Extremes Based on Daily Temperature and Precipitation Data. WIREs Clim. Change 2, 851–870. doi:10.1002/wcc.147
Zhang, Y., and Wang, Y. (2016). Climate-driven Ground-Level Ozone Extreme in the Fall over the Southeast United States. Proc. Natl. Acad. Sci. U.S.A. 113, 10025–10030. doi:10.1073/pnas.1602563113
Zhang, Y., Yang, P., Gao, Y., Leung, R. L., and Bell, M. L. (2020). Health and Economic Impacts of Air Pollution Induced by Weather Extremes over the Continental U.S. Environ. Int. 143, 105921. doi:10.1016/j.envint.2020.105921
Zhou, B. T., Wen, Q. H., Xu, Y., Song, L. C., and Zhang, X. B. (2014). Projected Changes in Temperature and Precipitation Extremes in China by the CMIP5 Multimodel Ensembles. J. Clim. 27, 591–6611. doi:10.1175/jcli-d-13-00761.1
Keywords: weather extreme, high temperature, heavy rain, O3 pollution, premature mortality
Citation: Wan Y, Yin Z, Huo Q, Zhou B and Wang H (2022) Weather Extremes Led to Large Variability in O3 Pollution and Associated Premature Deaths in East of China. Front. Earth Sci. 10:947001. doi: 10.3389/feart.2022.947001
Received: 18 May 2022; Accepted: 23 June 2022;
Published: 05 August 2022.
Edited by:
Stephen Outten, Nansen Environmental and Remote Sensing Center (NERSC), NorwayCopyright © 2022 Wan, Yin, Huo, Zhou and Wang. This is an open-access article distributed under the terms of the Creative Commons Attribution License (CC BY). The use, distribution or reproduction in other forums is permitted, provided the original author(s) and the copyright owner(s) are credited and that the original publication in this journal is cited, in accordance with accepted academic practice. No use, distribution or reproduction is permitted which does not comply with these terms.
*Correspondence: Zhicong Yin, eWluemhjQG51aXN0LmVkdS5jbg==