 Yijing Wu
 Jingwei Li
 Dan Wang
 Ling Li
 Wendi Shao
 Shiqiang Du
- School of Environmental and Geographical Sciences, Shanghai Normal University, Shanghai, China
Understanding the characteristics of urbanization under different flood protection levels is vital for sustainable development in coastal flood-prone areas (CFAs). However, little is known about the potential divergences of coastal urbanization across different flood protection levels in the CFAs of China. To fill this research gap, this study investigated the spatio-temporal changes of urban land expansion in Chinese CFAs and explored their relationships with flood protection levels during 2000–2020. It was found that in 2020, the urban lands accounted for 16.35% of the CFAs, 1.81 times that of the non-CFAs (9.04%). The urban lands increased rapidly in the CFAs across all flood protection levels, with an average annual change rate of 6.51%, which was 2.17 times that of non-CFAs (3.00%) and 3.68 times that of the exposed population growth rate (1.77%). Particularly in counties with low flood protection levels (<50 years), the urban lands expanded by 9.40% annually, 1.44 times that of the whole CFAs; moreover, a large portion (39.58%) of the new urban lands were reclaimed from sea waters. These findings suggest that special attention should be paid to coastal landscape changes in the areas of low flood protection levels to reduce flood risk and ensure sustainable cities and communities. Flood adaptation strategies should be applied to include conserving the coastal ecosystem.
Introduction
Coastal flood-prone areas (CFAs) are low-lying areas that are below extreme sea levels and hydrologically connected to the sea (Bilskie et al., 2014; Muis et al., 2016). The CFAs are vulnerable to changing climate, a combined result of sea-level rise, land subsidence, and a potential increase in the probability and intensity of storm surges (Du et al., 2020; Muis et al., 2020). Unfortunately, they are also characterized by a high density of population and land use, which will probably see a further increase during the rapid urbanization process (Jongman et al., 2012; Willner et al., 2018). Therefore, flood risk management in CFAs is critical to achieve the sustainable development goals prompted by United Nations (Reichstein et al., 2021).
Improving flood protection, such as by building levees or dykes, can substantially reduce the probability of flood inundation in CFAs (Ward et al., 2013; Di Baldassarre et al., 2018). Flood protection level (FPL) represents how well a region is protected against flooding, which is generally expressed as the target level of flood return period in designing the flood protection system (Scussolini et al., 2016; Wang et al., 2021). However, high FPLs can cause “levee effect,” a false sense of security, that can lead to more rapid development in CFAs, further increasing the proportion of urban lands, population, and assets exposed to extreme floods (Di Baldassarre et al., 2015; Ferdous et al., 2020). Ferdous et al. (2020) found that the higher the level of flood protection, the greater the increase in population and assets exposed to flooding along the Jamuna River, Bangladesh. Accelerated development stemming from flood protection projects has also been documented in California, United States (Hutton et al., 2019).
The CFAs in China are prone to coastal flooding and sea-level rise (Liu et al., 2013). During 2000–2020, a recorded total of 254 storm surges hit China’s coastal zones, causing 886 causalities and a cumulative loss of US $31.43 billion (COIN, 2021). Meanwhile, the coastal population has risen by about 90 million, boosting the urbanization rate from 37.44% to 64.87% and expanding urban lands from 6.68 × 10⁴ km2 to 1.25 × 10⁵ km2 (NBS, 2019). In the context of climate change, the thriving development is likely to exacerbate coastal flood risk (Wang et al., 2017; Gao et al., 2019; O'Donnell, 2019).
Many studies have examined the urban land increment in China’s coastal zones on various scales. On the regional scale, based on Landsat TM images, Weng (2002) found that urban lands in the Pearl River Delta increased by 47.68% during 1989–1997. Han et al. (2020) revealed an urban growth rate in riverine floodplains as high as 125.20% in the middle and lower reaches of the Yangtze River during 1990–2014. Liu and Li (2020) found that urban lands increased by 34.95% along the Bohai Rim during 2000–2015, mainly occupying farmlands and shallow waters. On a national scale, Zheng et al. (2020) found a much faster urbanization process in coastal cities than the national average pace during 2000–2019. However, those studies did not pay attention to the potential divergences of coastal urbanization across different FPLs, which still remains a research gap to be elucidated.
To fill this research gap, our objective was to investigate the urban land expansion in the Chinese CFAs and assess its potential divergence across different FPLs. We first quantified the spatio-temporal dynamics of urban lands in the CFAs during 2000–2020 and their variations across different FPLs. In addition, the interaction among urban land expansion, disaster exposure, and economic loss was discussed. Such an investigation is vital for promoting risk management and achieving sustainable development goals in the coastal region.
Materials and methods
Study area and data
We used multiple scales (CFA, province, and county scales) to analyze the urban lands in the CFA of China (Figure 1). The study area contained 11 provincial units, such as Jiangsu, Zhejiang, Guangdong, and Shanghai, and involved 182 county-level units. As a consequence of limited data availability, Hong Kong, Macao, and Taiwan were not included in this research. The administrative boundaries were obtained from the Resource and Environment Science and Data Center (https://www.resdc.cn/).
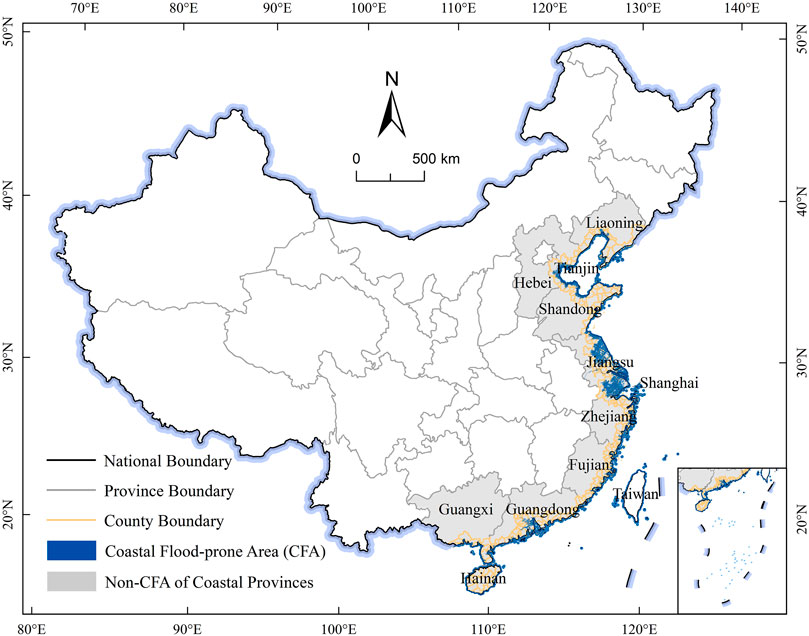
FIGURE 1. The coastal flood-prone areas (CFAs) in China.
The urban lands in 2000, 2010, and 2020 were mapped based on the artificial surface dataset in GlobeLand30 (http://www.globallandcover.com/). The initial resolution, 30 × 30 m, was aggregated to 100 × 100 m in our study in accordance with other data resolutions. The accuracy of GlobeLand30 in the CFAs of China was evaluated using high-precision images from Google Earth. Based on a sample of 3,000 points, the evaluated accuracy was 91.3%, 93.7%, and 92.6% for the 3 years, respectively. The urban land refers to the surfaces formed by man-built activities, including human settlements, industrial and mining area, and transportation facilities (Yu et al., 2014).
The FPLs were originally taken from the Flood Protection Level Database (Wang et al., 2021) and were updated using flood policy documents and plans (Wang, 2022). The FPLs were expressed in flood return period (years). They were applicable to coastal floods caused by a joint effect of tides, storm surges, and mean sea level, but did not consider pluvial floods, for example, urban waterlogging and compound flood scenarios, which referred to a co-occurrence of coastal floods, riverine floods, and pluvial floods.
The economic losses due to the storm surge were derived from Marine Disaster Bulletin (COIN, 2021), which were converted into US dollars by the 2020 price. The population grids in 2000, 2010, and 2020 were derived from WorldPop (https://www.worldpop.org/). The data had a resolution of 100 m.
Defining coastal flood-prone areas of China
The CFAs were defined as the maximum extent of the 100-year return period coastal flood (Du et al., 2018). They comprised continental and island areas hydrologically connected to the sea and lower than the 100-year sea levels. The coastal elevation dataset (Kulp and Strauss, 2019) and sea-level extremes dataset (Muis et al., 2020) were employed to derive the CFAs. The latter was simulated by Global Tide and Surge Model version 3.0, which considered the joint effects of tides, storm surges, and mean sea level on extreme sea levels (Muis et al., 2020). From the multiple return periods contained in the dataset, the 100-year sea-level extremes were employed to produce the CFAs by using a bath-tub model, about which more details are available in Gao et al. (2019).
Calculating indices of urban land
We used the average annual change rate to reflect the intensity of urban land change during 2000–2020 (Du et al., 2018), which was calculated as follows:
where AACR was the average annual change rate;
Analyzing the relationship between flood protection and urban land expansion
The Pearson correlation coefficient (Schober et al., 2018) was used to explore the relationship between the average annual change rate of urban lands in CFAs and FPLs, which was calculated by Eq. 2:
where
The Kruskal–Wallis test is a non-parametric statistical tool that evaluated whether two or more samples were drawn from the same distribution (Guo et al., 2013). We used Eq. 3 to explore whether there were significant differences in the average annual change rate of urban lands under different FPLs.
where
We calculated the transformation matrix of land use changes to reveal the transfer characteristics of land use types (Xu et al., 2013), and then we made a Sankey diagram based on Python to visually display the transformation matrix (Soundararajan et al., 2014).
Results
Urban land patterns of CFAs in 2020
In 2020, the total area of CFAs in China was 7.19 × 10⁴ km2, accounting for 5.60% of the total area of China’s coastal provinces. These areas are mainly distributed in Jiangsu (2.88 × 10⁴ km2), Zhejiang (1.01 × 10⁴ km2), Guangdong (7.33 × 10³ km2), and Shanghai (6.07 × 10³ km2), with obvious spatial agglomeration characteristics (Figure 1).
In 2020, the urban lands in CFAs encompassed a total area of 1.18 × 10⁴ km2. It accounted for 16.35% of the CFAs in China, which was 1.81 times the ratio of urban lands to the non-CFAs in China’s coastal provinces. A large proportion of the urban lands in CFAs (78.31%, 9.20 × 10³ km2) was located in Jiangsu, Zhejiang, Shanghai, and Guangdong. Jiangsu featured the largest urban lands in CFAs (29.54%, 3.47 × 10³ km2), followed by Zhejiang, Shanghai, and Guangdong, whose urban lands in CFAs were about 1,500–2,500 km2. The urban lands in CFAs in other coastal provinces, such as Tianjin, Liaoning, and Shandong, were less than 1,000 km2.
Urban land expansion in CFAs during 2000–2020
Urban lands in CFAs expanded rapidly during 2000–2020 (Figure 2A). It multiplied from 3.33✕103 km2 to 1.18✕104 km2, with a total growth of 8.42 × 10³ km2. The average annual change rate of urban lands in CFAs was 6.51%, much higher than that in non-CFAs (3.00%).
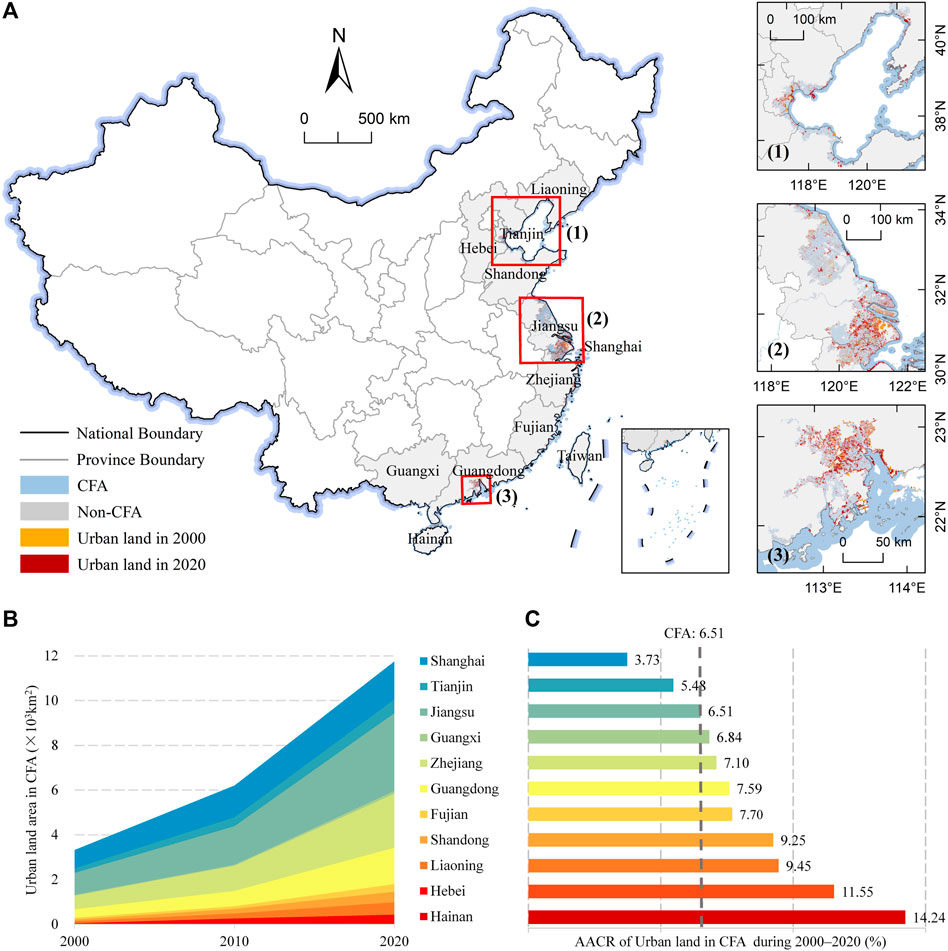
FIGURE 2. Changes of urban lands in CFAs of China during 2000–2020: the pattern (A), growth amount (B), and average annual change rates (C).
Over the past 2 decades, Jiangsu experienced the greatest increase in urban lands in CFAs of 2.49 × 10³ km2, followed by Zhejiang (1.80 × 10³ km2) and Guangdong (1.25 × 10³ km2) (Figure 2B). The average annual change rate of urban lands in CFAs in Hainan and Hebei were the highest, 14.24% and 11.55%, respectively (Figure 2C), which were 2.19 and 1.77 times that of the average rate in CFAs (6.51%), respectively. Both the expanded area and the change rate of urban lands in CFAs were higher during 2010–2020 than those during 2000–2010 in coastal provinces, except Shanghai, Hebei, Shandong, and Tianjin.
Urban land expansion under different flood protection levels
An overwhelming majority of urban lands in CFAs (92.83%, 1.09✕104 km2) were located in areas with FPLs ≥50 years (Table 1). In 2020, there were 4.79 × 10³ km2 (40.91%) of urban lands in CFAs in the areas with the highest FPLs (≥200 years), followed by the areas with FPLs of 100–200 years (4.04 × 10³ km2, or 34.50%) and 50–100 years (2.04 × 10³ km2, or 17.42%). The urban lands in CFAs were less than 500 km2 in those areas with FPLs less than 50 years.
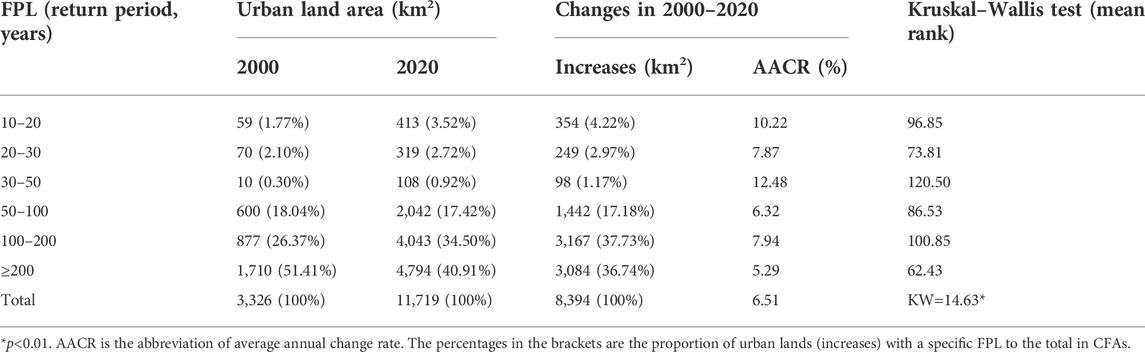
TABLE 1. The urban lands in CFAs and its changes under different FPLs during 2000–2020 in China and the results of the Kruskal–Wallis test.
During 2000–2020, a significant negative correlation was between FPLs (the FPLs of each province was the mode of the FPLs of its coastal counties) and the growth rate of urban lands at the provincial level (r = −0.68, Sig. <0.05), that is, the expansion speed of urban lands in CFAs with low FPLs was relatively high, and vice versa. Meanwhile, at the county level, a significant divergence was also observed in the expanding speed of urban lands in CFAs under different FPLs (Table 1; Figure 3). The average annual change rate of urban lands in CFAs in the 17 counties with FPLs of 10–20 years was 10.22%, 1.57 times of that across all the FPLs (6.51%). For the 12 counties with FPLs of 30–50 years, the average annual change rate of urban lands was the highest (12.48%), which is 1.92 times of that across all the FPLs (6.51%). The average annual change rate of urban lands in CFAs was lowest in the 22 counties with FPLs ≥200 years (5.29%). As a result, for the 42 counties with <50-year flood protection level, the average annual change rate of urban lands in the CFAs was 9.40%, which is 1.44 times of that across all the FPLs (6.51%) and 1.48 times of the remaining counties with a higher flood protection level (≥50 years, 6.33%).
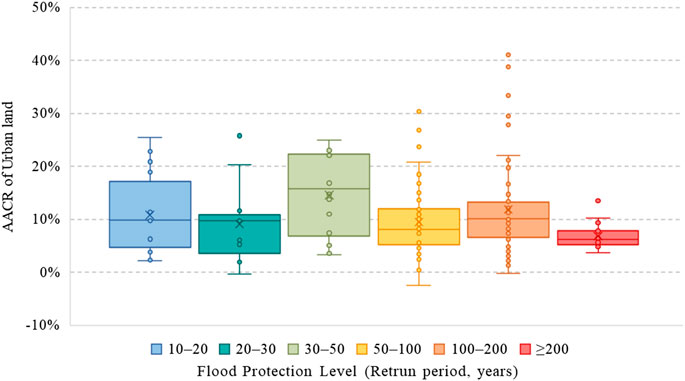
FIGURE 3. The average annual change rates (AACR) of urban lands in CFAs under different FPLs during 2000–2020 in China.
Land use conversion under different flood protection levels
During 2000–2020, the main sources of enlarged urban lands in CFAs in China were farmlands, water bodies, and newly reclaimed lands (Figure 4). Among the expanded urban lands in CFAs, 61.69% (5.19 × 10³ km2) came from farmlands, 20.73% (1.75 × 10³ km2) from water bodies, and 16.42% (1.38 × 10³ km2) from newly reclaimed lands.
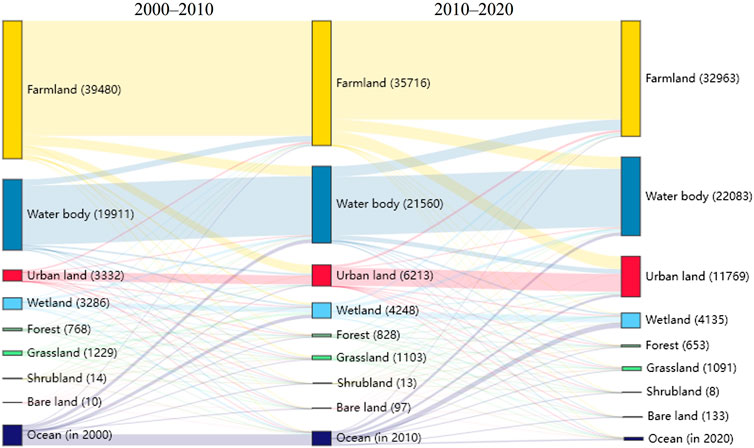
FIGURE 4. The land use conversions in CFAs during 2000–2020. Note: the height of each column represents the total area of a specific land use type, which is presented in brackets (km2); the width of each branch corresponds to the transferred land area.
In the areas with lower FPLs, the gained urban lands in CFAs were mainly from newly reclaimed lands, while in the areas with higher FPLs, they were mostly from farmlands (Figure 5). In CFAs where the FPLs were less than 50 years, 39.58% (287 km2) of the enlarged urban lands came from the newly reclaimed lands, 30.61% (222 km2) from farmlands, and 22.69% (165 km2) from water bodies. In the areas with FPLs ≥50 years, more than 50% (4.95 × 10³ km2) of the new urban lands in CFAs were from farmlands (Figure 5).
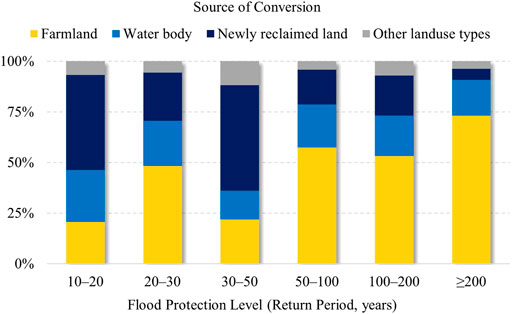
FIGURE 5. Proportion of main sources of urban lands in CFAs of China under different FPLs during 2000–2020.
Discussion
The growth rates of urban lands and population are incompatible
The growth rate of urban lands in CFAs in China was much faster than that of the population during 2000–2020 (Figure 6), and their ratio was higher than those of the national and global levels. The average annual change rate (6.51%) of the urban lands in CFAs was about 3.68 times that of the exposed population (1.77%). For 47 counties with FPLs of 50–100 years, the ratio of two was as high as 15.14, and 22 counties with the highest FPLs (≥200 years) had the lowest ratio of 1.86. Chen et al. (2019) found that the ratio of the average annual change rate of urban lands (3.41%) to the exposed population (1.17%) was about 2.91 in high-frequency flood areas in China during 1995–2015. Ehrlich et al. (2018) pointed out that the ratio of two in floodplains in the world during 2000–2015 was about 1.22. The growth rate of urban lands in CFAs of China was relatively higher, especially in areas with FPLs of 50–100 years.
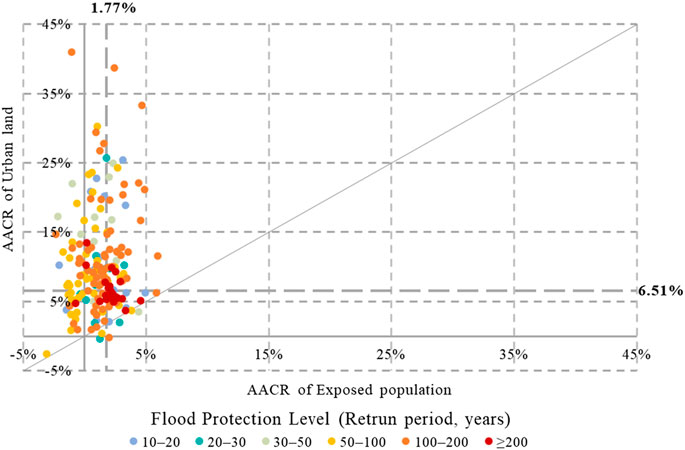
FIGURE 6. The scatter diagram of average annual change rate of urban lands in CFAs and exposed population under different FPLs during 2000–2020.
The CFAs have historically been a natural place for human settlements as they typically offer ready access to water and fertile soil; recently, these areas are seeing rapid urbanization, much faster than that in non-CFAs (UNU-IHDP, 2015). Reclaiming lands for urban development and a growing population is a good example for the CFAs as a favorite place over the non-CFAs. In the context of climate change, the continuous increment of urban lands and population concentration in CFAs of China would exacerbate the flood risk in coastal zones (Du et al., 2018; Gao et al., 2019), thus stepping up the challenges faced by risk management. Therefore, China should pay much more attention to the adjustment of the growth rate of urban lands in CFAs and its optimization of spatial layout.
Reinforced seawalls cannot protect against all coastal flooding
Higher FPLs do not mean absolute safety (Figure 7). The mode of FPLs in Guangdong, Fujian, and Zhejiang was 100–200 years, while the cumulated direct economic losses of storm surges in these three provinces accounted for about 75.47% (US $23.72 billion) of the national total during 2000–2020. Among them, the loss ratio of storm surge to GDP in Fujian was the highest (3.65‰), followed by Zhejiang (1.01‰) and Guangdong (0.98‰).
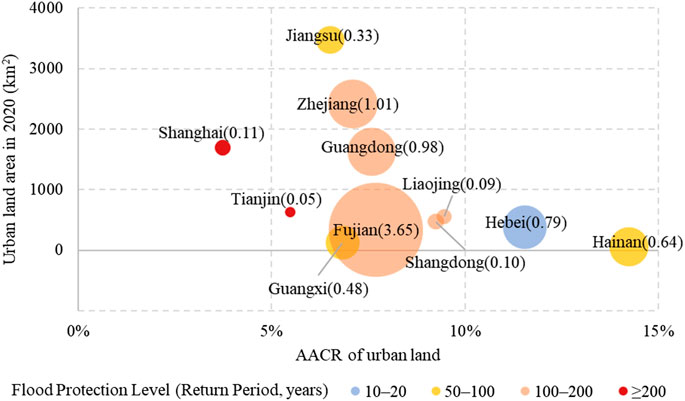
FIGURE 7. The province-level relationship between storm surge losses, urban lands in CFAs in 2020, and its average annual change rates (AACR) during 2000–2020. Note: the circle size represents the rate of storm surge losses to the GDP, which are shown in brackets (‰).
In the past 20 years, these three provinces had placed great emphasis on the construction of storm-surge barriers or seawalls. At the end of 2000, Zhejiang invested nearly US $600 million to build and strengthen the seawalls to protect against coastal flooding, and other coastal provinces also built and strengthened the coastal flood protection system in the following years (Fang et al., 2017). In 2017, the National Development and Reform Commission and the Ministry of Water Resources issued the national seawall construction plan, which planned to further improve the flood-control and disaster-reduction engineering system in coastal zones in about 10 years.
Although the repair and reinforcement of seawalls could improve the FPLs and protect people from frequent floods, it would further accelerate the urbanization of CFAs and aggravate flood exposure. Thus, China should explore additional adaptation solutions to settle the contradiction between urban development and structural protection, and prevent the disorderly spread of flood exposure while improving the FPLs (Du et al., 2019).
Moreover, the seawalls could be greatly lowered by land subsidence (Wu et al., 2007; Bagheri-Gavkosh et al., 2021; Herrera-Garcia et al., 2021). Low-lying coastal cities are increasingly in danger of inundation due to land subsidence, particularly associated with a combined influence of sea-level rise (Bagheri-Gavkosh et al., 2021). In Shanghai, for instance, 87% of the seawalls experienced subsidence during 2009–2015 (Chen et al., 2016). In the future, land subsidence could further aggravate flood risk in Shanghai (Du et al., 2020). Land subsidence should be systematically included in flood risk analyses and adaptation strategy design.
Policy implications
The expansion of urban lands in CFAs directly intensified the exposure and risk of coastal flooding (Sajjad et al., 2018; Willner et al., 2018). Particularly, we found that the urban lands in CFAs with relatively low FPLs were stepping up with great speed, which may further exacerbate flood risk. Moreover, in this process, the land use change, such as the encroachment of farmlands and the newly reclaimed lands, also changed the hydrological process, damaged the flood regulation service of the ecosystem, and aggravated the flood hazards (Shen et al., 2019; Shen et al., 2021; Li et al., 2022).
Therefore, attention should be paid to effectively control the spread of urban lands and limiting the increment of urban lands in areas at high risk. The average annual change rate of China’s urban lands in CFAs (6.51%) was about 3.54 times that of urban lands in global floodplains (1.84%) (Ehrlich et al., 2018), and far exceeded the population growth. It indicated that although China had incorporated flood-control measures into urban planning (Du et al., 2018), it had not limited the enlargement of urban lands in CFAs. Consequently, a large amount of wetlands had been reclaimed for urban expansion.
The ecosystem should be reserved to enhance the resilience of coastal cities. Particularly, coastal wetlands could play a role in “soft adaptation” and nature-based solutions as they can essentially reduce storm surges and water levels (Du et al., 2020). One study indicated that if the wetland rose by 1 km2, the average losses caused by specific storms would be cut by US $12.16 million (in 2020 price) (Liu et al., 2019). However, the wetlands were encroached on Chinese CFAs. In areas where the FPLs were less than 50 years, 39.58% (287 km2) of the enlarged urban lands in CFAs came from newly reclaimed lands, which would further augment the exposure to floods and threaten the coastal ecosystem. Authorities should launch an evaluation of ecosystem services in formulating coastal development plans (Bai et al., 2018) to maximize the flood regulation services of coastal wetlands (Choi et al., 2018) and minimize the protection costs (Van Zelst et al., 2021).
In addition, flood risk information should be made available to facilitate risk-based urban planning (Du et al., 2018). Now, China implements the first National Comprehensive Survey of Natural Disaster Risk (GOSC, 2020), which will provide critical information about flood exposure, vulnerability, protection levels, flood reduction resources, and the risk. Such information should lay a sound basis for urban planning to reasonably avoid high-risk areas or take the way of upgrading the fortification level and enhancing resilience to reduce risks. The choice could be made using a cost and benefit analysis (Du et al., 2020).
Future perspectives
This study has several limitations. First, there is a lack of storm surge economic loss data on a fine scale, so it is unworkable to explore the possible relations between urban land expansion and economic losses in CFAs. Second, when discussing the relationship between FPLs and urban lands in CFAs, the method used is relatively single. Third, we only quantified land use change from the perspective of statistics and policy, and did not take stakeholders’ views or desires into consideration (Huang et al., 2022). Finally, the possible changes in flood risk and the CFAs inundation under the influence of climate change are not considered. In future studies, we plan to extract urban land information based on multi-temporal satellite images and incorporate future climate change scenarios into the study to discuss the enlargement of urban lands in CFAs under different FPLs and adaptation schemes (Chen et al., 2020).
Conclusion
The urban land is disproportionally distributed in the CFAs of China, and it has a divergent pattern across different flood protection levels. In 2020, urban lands in China’s CFAs were about 1.18✕104 km2, accounting for 16.35% of the total area of the CFAs, which was 1.81 times of that in the non-CFAs (9.04%). An overwhelming majority of the urban lands in CFAs (92.83%, 1.09 × 10⁴ km2) were located in the areas of high flood protection levels (≥50 years). During 2000–2020, the urban lands in the CFAs increased rapidly, with an average annual change rates of 6.51%, which was 2.17 times that in non-CFAs (3.00%). The gained urban lands in CFAs mainly came from farmlands (5.19 × 10³ km2, 61.69%) and newly reclaimed lands (1.38 × 10³ km2, 16.42%). Particularly, the urban lands in the CFAs with low flood protection levels (<50 years) increased sharply, where the average annual change rate was 1.44 times of that across all the FPLs (6.51%). Moreover, these low flood protection counties saw a considerable portion (39.58%, 287 km2) of the new urban lands reclaimed from the sea waters, which would dampen the coastal ecosystem services and further aggravate the flood risk. Hence, attention should be paid to the expanding urban lands in Chinese CFAs, particularly in areas of low flood protection levels. Flood adaptation strategies need to be implemented to reduce the flood risk and promote sustainable coastal landscape and human society.
Data availability statement
The original contributions presented in the study are included in the article/Supplementary Material; further inquiries can be directed to the corresponding authors.
Author contributions
YW: formal analysis; investigation; methodology; software; visualization; and writing—original draft, review, and editing. JL: conceptualization; methodology; and writing—original draft, review, and editing. DW, LL, and WS: data curation, formal analysis, and methodology. SD: conceptualization; methodology; and writing—original draft, review, and editing.
Funding
This research was funded by the National Natural Science Foundation of China (Grant Nos. 41871200, 42101251, and 41730642) and the National Key Research and Development Program of China (2017YFC1503001).
Conflict of interest
The authors declare that the research was conducted in the absence of any commercial or financial relationships that could be construed as a potential conflict of interest.
Publisher’s note
All claims expressed in this article are solely those of the authors and do not necessarily represent those of their affiliated organizations, or those of the publisher, the editors, and the reviewers. Any product that may be evaluated in this article, or claim that may be made by its manufacturer, is not guaranteed or endorsed by the publisher.
References
Bagheri-Gavkosh, M., Hosseini, S. M., Ataie-Ashtiani, B., Sohani, Y., Ebrahimian, H., Morovat, F., et al. (2021). Land subsidence: A global challenge. Sci. Total Environ. 778, 146193. doi:10.1016/j.scitotenv.2021.146193
Bai, Y., Wong, C. P., Jiang, B., Hughes, A. C., Wang, M., Wang, Q., et al. (2018). Developing China's Ecological Redline Policy using ecosystem services assessments for land use planning. Nat. Commun. 9 (1), 3034. doi:10.1038/s41467-018-05306-1
Bilskie, M. V., Hagen, S. C., Medeiros, S. C., and Passeri, D. L. (2014). Dynamics of sea level rise and coastal flooding on a changing landscape. Geophys. Res. Lett. 41 (3), 927–934. doi:10.1002/2013gl058759
Chen, Y., Shi, Y. J., Li, B., and Yu, J. W. (2016). Seawall subsidence in Shanghai: Characteristics and driving mechanisms (in Chinese). Mar. Geol. Quat. Geol. 36 (06), 71–78. doi:10.16562/j.cnki.0256-1492.2016.06.009
Chen, Y., Xie, W., and Xu, X. (2019). Changes of population, built-up land, and cropland exposure to natural hazards in China from 1995 to 2015. Int. J. Disaster Risk Sci. 10 (4), 557–572. doi:10.1007/s13753-019-00242-0
Chen, G., Li, X., Liu, X., Chen, Y., Liang, X., Leng, J., et al. (2020). Global projections of future urban land expansion under shared socioeconomic pathways. Nat. Commun. 11 (1), 537. doi:10.1038/s41467-020-14386-x
Choi, C.-Y., Jackson, M. V., Gallo-Cajiao, E., Murray, N. J., Clemens, R. S., Gan, X., et al. (2018). Biodiversity and China's new great wall. Divers. Distrib. 24 (2), 137–143. doi:10.1111/ddi.12675
COIN (2021). China oceanic information network: Marine disaster Bulletin. Available at: http://www.nmdis.org.cn/hygb/zghyzhgb/(accessed 08.08.21).
Di Baldassarre, G., Viglione, A., Carr, G., Kuil, L., Yan, K., Brandimarte, L., et al. (2015). Debates-Perspectives on socio-hydrology: Capturing feedbacks between physical and social processes. Water Resour. Res. 51 (6), 4770–4781. doi:10.1002/2014wr016416
Di Baldassarre, G., Kreibich, H., Vorogushyn, S., Aerts, J., Arnbjerg-Nielsen, K., Barendrecht, M., et al. (2018). Hess Opinions: An interdisciplinary research agenda to explore the unintended consequences of structural flood protection. Hydrol. Earth Syst. Sci. 22 (11), 5629–5637. doi:10.5194/hess-22-5629-2018
Du, S. Q., He, C. Y., Huang, Q. X., and Shi, P. J. (2018). How did the urban land in floodplains distribute and expand in China from 1992-2015? Environ. Res. Lett. 13 (3), 034018. doi:10.1088/1748-9326/aaac07
Du, S. Q., Cheng, X. T., Huang, Q. X., Chen, R. S., Ward, P. J., Aerts, J., et al. (2019). Brief communication: Rethinking the 1998 China floods to prepare for a nonstationary future. Nat. Hazards Earth Syst. Sci. 19 (3), 715–719. doi:10.5194/nhess-19-715-2019
Du, S. Q., Scussolini, P., Ward, P. J., Zhang, M., Wen, J. H., Wang, L. Y., et al. (2020). Hard or soft flood adaptation? Advantages of a hybrid strategy for Shanghai. Glob. Environ. Change 61, 102037. doi:10.1016/j.gloenvcha.2020.102037
Ehrlich, D., Melchiorri, M., Florczyk, A., Pesaresi, M., Kemper, T., Corbane, C., et al. (2018). Remote sensing derived built-up area and population density to quantify global exposure to five natural hazards over time. Remote Sens. 10 (9), 1378. doi:10.3390/rs10091378
Fang, J., Liu, W., Yang, S., Brown, S., Nicholls, R. J., Hinkel, J., et al. (2017). Spatial-temporal changes of coastal and marine disasters risks and impacts in Mainland China. Ocean Coast. Manag. 139, 125–140. doi:10.1016/j.ocecoaman.2017.02.003
Ferdous, M. R., Di Baldassarre, G., Brandimarte, L., and Wesselink, A. (2020). The interplay between structural flood protection, population density, and flood mortality along the Jamuna River, Bangladesh. Reg. Environ. Change 20 (1), 5. doi:10.1007/s10113-020-01600-1
Gao, C., Wang, L., Chen, C., Luo, G., and Sun, Y. W. (2019). Population and economic risk exposure in coastal region of China under sea level rise (in Chinese). ACTA Geogr. SIN. 74 (8), 1590–1604. doi:10.11821/dlxb201908008
GOSC (2020). General office of the state council: Notice of the general office of the state council on carrying out the first national comprehensive risk Survey of natural disasters. Available at: https://www.emerinfo.cn/zt/zrzhzhfxpc1/index.htm (accessed 08.08.21).
Guo, S., Zhong, S., and Zhang, A. (2013). Privacy-preserving kruskal-wallis test. Comput. Methods Programs Biomed. 112 (1), 135–145. doi:10.1016/j.cmpb.2013.05.023
Han, Y. P., Huang, Q. X., He, C. Y., Fang, Y. Q., Wen, J. H., Gao, J., et al. (2020). The growth mode of built-up land in floodplains and its impacts on flood vulnerability. Sci. Total Environ. 700, 134462. doi:10.1016/j.scitotenv.2019.134462
Herrera-Garcia, G., Ezquerro, P., Tomas, R., Bejar-Pizarro, M., Lopez-Vinielles, J., Rossi, M., et al. (2021). Mapping the global threat of land subsidence. Science 371 (6524), 34–36. doi:10.1126/science.abb8549
Huang, X. X., Xu, H., Wen, J. H., Wang, D., Shen, J., and Du, S. Q. (2022). Shanghai residents' perception and adaptation behavior of urban pluvial flood risk (in Chinese). J. Catastrophology 37 (1), 1–10. doi:10.3969/j.issn.1000-811X.2022.01.032
Hutton, N. S., Tobin, G. A., and Montz, B. E. (2019). The levee effect revisited: Processes and policies enabling development in Yuba County, California. J. Flood Risk Manag. 12 (3), e12469. doi:10.1111/jfr3.12469
Jongman, B., Ward, P. J., and Aerts, J. C. J. H. (2012). Global exposure to river and coastal flooding: Long term trends and changes. Glob. Environ. Change 22 (4), 823–835. doi:10.1016/j.gloenvcha.2012.07.004
Kulp, S. A., and Strauss, B. H. (2019). New elevation data triple estimates of global vulnerability to sea-level rise and coastal flooding. Nat. Commun. 10 (1), 4844. doi:10.1038/s41467-019-12808-z
Li, J., Fang, Z., Zhang, J., Huang, Q., and He, C. (2022). Mapping basin-scale supply-demand dynamics of flood regulation service – a case study in the Baiyangdian Lake Basin, China. Ecol. Indic. 139, 108902. doi:10.1016/j.ecolind.2022.108902
Liu, Y. S., and Li, J. T. (2020). The patterns and driving mechanisms of reclaimed land use in China’s 418 coastal areas in recent 30 years (in Chinese). Sci. Sin. -Terrae. 50 (6), 761–774. doi:10.1360/SSTe-2019-0266
Liu, J., Wen, J., Huang, Y., Shi, M., Meng, Q., Ding, J., et al. (2013). Human settlement and regional development in the context of climate change: A spatial analysis of low elevation coastal zones in China. Mitig. Adapt. Strateg. Glob. Chang. 20 (4), 527–546. doi:10.1007/s11027-013-9506-7
Liu, X., Wang, Y., Costanza, R., Kubiszewski, I., Xu, N., Yuan, M., et al. (2019). The value of China’s coastal wetlands and seawalls for storm protection. Ecosyst. Serv. 36, 100905. doi:10.1016/j.ecoser.2019.100905
Muis, S., Verlaan, M., Winsemius, H. C., Aerts, J. C. J. H., and Ward, P. J. (2016). A global reanalysis of storm surges and extreme sea levels. Nat. Commun. 7 (1), 11969. doi:10.1038/ncomms11969
Muis, S., Apecechea, M. I., Dullaart, J., de Lima Rego, J., Madsen, K. S., Su, J., et al. (2020). A high-resolution global dataset of extreme sea levels, tides, and storm surges, including future projections. Front. Mar. Sci. 7. doi:10.3389/fmars.2020.00263
NBS (2019). National bureau of statistics of China: China statistical yearbook. Available at: http://www.stats.gov.cn/tjsj/ndsj/(accessed 08.08.21).
O'Donnell, T. (2019). Contrasting land use policies for climate change adaptation: A case study of political and geo-legal realities for Australian coastal locations. Land Use Policy 88, 104145. doi:10.1016/j.landusepol.2019.104145
Reichstein, M., Riede, F., and Frank, D. (2021). More floods, fires and cyclones - plan for domino effects on sustainability goals. Nature 592 (7854), 347–349. doi:10.1038/d41586-021-00927-x
Sajjad, M., Li, Y., Tang, Z., Cao, L., and Liu, X. (2018). Assessing hazard vulnerability, habitat conservation, and restoration for the enhancement of mainland China's coastal resilience. Earth's. Future 6 (3), 326–338. doi:10.1002/2017ef000676
Schober, P., Boer, C., and Schwarte, L. A. (2018). Correlation coefficients: Appropriate use and interpretation. Anesth. Analg. 126 (5), 1763–1768. doi:10.1213/ANE.0000000000002864
Scussolini, P., Aerts, J. C. J. H., Jongman, B., Bouwer, L. M., Winsemius, H. C., de Moel, H., et al. (2016). Flopros: An evolving global database of flood protection standards. Nat. Hazards Earth Syst. Sci. 16 (5), 1049–1061. doi:10.5194/nhess-16-1049-2016
Shen, J., Du, S. Q., Huang, Q. X., Yin, J., Zhang, M., Wen, J. H., et al. (2019). Mapping the city-scale supply and demand of ecosystem flood regulation services-A case study in Shanghai. Ecol. Indic. 106, 105544. doi:10.1016/j.ecolind.2019.105544
Shen, J., Du, S. Q., Ma, Q., Huang, Q. X., Wen, J. H., Yin, Z. E., et al. (2021). A new multiple return-period framework of flood regulation service-applied in Yangtze River basin. Ecol. Indic. 125, 107441. doi:10.1016/j.ecolind.2021.107441
Soundararajan, K., Ho, H. K., and Su, B. (2014). Sankey diagram framework for energy and exergy flows. Appl. Energy 136, 1035–1042. doi:10.1016/j.apenergy.2014.08.070
UNU-IHDP (2015). Coastal Zones and Urbanization: Summary for Decision-Makers. https://ugec.org/2015/06/29/summary-for-decision-makers-coastal-zones-and-urbanization/.
Van Zelst, V. T. M., Dijkstra, J. T., van Wesenbeeck, B. K., Eilander, D., Morris, E. P., Winsemius, H. C., et al. (2021). Cutting the costs of coastal protection by integrating vegetation in flood defences. Nat. Commun. 12 (1), 6533. doi:10.1038/s41467-021-26887-4
Wang, R., Chen, J. Y., Chen, X. W., and Wang, Y. F. (2017). Variability of precipitation extremes and dryness/wetness over the southeast coastal region of China, 1960-2014. Int. J. Climatol. 37 (13), 4656–4669. doi:10.1002/joc.5113
Wang, D., Scussolini, P., and Du, S. Q. (2021). Assessing Chinese flood protection and its social divergence. Nat. Hazards Earth Syst. Sci. 21 (2), 743–755. doi:10.5194/nhess-21-743-2021
Wang, D. (2022). Study on flood risk and adaptation pathways in Coastal areas of China. Shanghai: Shanghai Normal University. doi:10.27312/d.cnki.gshsu.2022.002155
Ward, P. J., Jongman, B., Weiland, F. S., Bouwman, A., van Beek, R., Bierkens, M. F. P., et al. (2013). Assessing flood risk at the global scale: Model setup, results, and sensitivity. Environ. Res. Lett. 8 (4), 044019. doi:10.1088/1748-9326/8/4/044019
Weng, Q. (2002). Land use change analysis in the Zhujiang Delta of China using satellite remote sensing, GIS and stochastic modelling. J. Environ. Manage. 64 (3), 273–284. doi:10.1006/jema.2001.0509
Willner, S. N., Otto, C., and Levermann, A. (2018). Global economic response to river floods. Nat. Clim. Chang. 8 (7), 594–598. doi:10.1038/s41558-018-0173-2
Wu, J., Shi, X., Xue, Y., Zhang, Y., Wei, Z., Yu, J., et al. (2007). The development and control of the land subsidence in the Yangtze Delta, China. Environ. Geol. 55 (8), 1725–1735. doi:10.1007/s00254-007-1123-x
Xu, Y. Q., McNamara, P., Wu, Y. F., and Dong, Y. (2013). An econometric analysis of changes in arable land utilization using multinomial logit model in Pinggu district, Beijing, China. J. Environ. Manage. 128, 324–334. doi:10.1016/j.jenvman.2013.05.020
Yu, L., Wang, J., Li, X., Li, C., Zhao, Y., Gong, P., et al. (2014). A multi-resolution global land cover dataset through multisource data aggregation. Sci. China Earth Sci. 57 (10), 2317–2329. doi:10.1007/s11430-014-4919-z
Keywords: flood protection, coastal urbanization, land reclamation, flood exposure, risk reduction
Citation: Wu Y, Li J, Wang D, Li L, Shao W and Du S (2022) Does flood protection affect urban expansion in the coastal flood-prone area of China?. Front. Earth Sci. 10:951828. doi: 10.3389/feart.2022.951828
Received: 25 May 2022; Accepted: 11 July 2022;
Published: 05 August 2022.
Edited by:
Jianfeng Li, Hong Kong Baptist University, Hong Kong SAR, ChinaCopyright © 2022 Wu, Li, Wang, Li, Shao and Du. This is an open-access article distributed under the terms of the Creative Commons Attribution License (CC BY). The use, distribution or reproduction in other forums is permitted, provided the original author(s) and the copyright owner(s) are credited and that the original publication in this journal is cited, in accordance with accepted academic practice. No use, distribution or reproduction is permitted which does not comply with these terms.
*Correspondence: Jingwei Li, andsaUBzaG51LmVkdS5jbg==; Shiqiang Du, c2hpcWlhbmdkdUBzaG51LmVkdS5jbg==