 E. Kolesnikov
 I. Kupenko
 M. Achorner1
 H.-P. Liermann
 S. Merkel
 C. Sanchez-Valle
- 1Institute for Mineralogy, University of Münster, Münster, Germany
- 2Deutsches Elektronen-Synchrotron DESY, Hamburg, Germany
- 3Univ. Lille, CNRS, INRAE, Centrale Lille, UMR 8207—UMET—Unité Matériaux et Transformations, Lille, France
Elastic anisotropy of iron-bearing alloys and compounds can lead to a variation of seismic velocities along different directions in planetary cores. Understanding the deformation properties of candidate core-forming materials is thus necessary to reveal the details about the interior of distant planets. Silicon has been considered to be one of the dominant light elements in the cores. Here we investigated the deformation of the ε-FeSi phase up to 49 GPa and 1100 K employing the radial X-ray diffraction technique in diamond anvil cells. Stoichiometric FeSi is a good approximation for the deformation behavior of the Fe-FeSi system and the low-pressure polymorph of FeSi may be the stable phase in the cores of small terrestrial planets such as Mercury. Yield strength in ε-FeSi is higher than in hcp-Fe and hcp-Fe-Si alloys, in the temperature range we investigated here the temperature has little influence on the lattice strain parameters, yield strength, and anisotropy within experimental precision. The azimuthal anisotropy of the longitudinal sound waves in ε-FeSi is below 0.6% at low pressure and decreases further with compression, while the shear wave contrast is below 1.25% in the entire investigated pressure range. Therefore, polycrystalline aggregates of iron silicide are nearly isotropic at extreme conditions. Consequently, any observed anisotropy in planetary cores will be incompatible with silicon being the dominant light element in the core composition.
1 Introduction
The heterogeneous nature of sound wave propagation inside the deepest portions of the Earth’s interior was already discovered 40 years ago (Masters and Gilbert, 1981; Anderson and Dziewonski, 1982; Poupinet et al., 1983; Vinnik et al., 1989; Lay and Young, 1991). One of the first explanations of these effects was the hypothesis of inner core material anisotropy (Morelli et al., 1986; Woodhouse et al., 1986). Later it gained a firm confirmation from other geophysical observations (Creager, 1992; Song and Helmberger, 1993; Tromp, 1993). Evidence for inner core anisotropy comes from two sources—a directional variation of travel times (Poupinet et al., 1983) and an anomalous splitting of the normal modes (Masters and Gilbert, 1981) that cannot be explained by the contributions of the Coriolis effect or the ellipticity of the Earth (Song, 1997). The initial models assumed cylindrical symmetry with the waves travelling 3% faster along the Earth’s north-south spin axis compared to the equatorial plane (Song and Helmberger, 1993; Irving and Deuss, 2011). Later, more complex models were proposed, such as the presence of the innermost inner core (Ishii and Dziewonski, 2002), depth dependence of anisotropic properties (Garcia and Souriau, 2000), and hemispherical variation in anisotropic properties (Creager, 1999; Irving and Deuss, 2011), recently reviewed in Deuss (2014) and Tkalčić (2015).
The anisotropy in the solid inner core originates either from the shape preferred orientation (SPO) or from lattice preferred orientation (LPO) of the core-forming material (Singh et al., 2000; Deuss, 2014). LPO is considered to be more likely due to the anisotropy of iron that most probably crystallizes in the hexagonally close-packed structure at the inner core conditions (Tateno et al., 2010). The anisotropy due to LPO can be induced by (re)crystallization but most likely, it is the result of the deformation-induced lattice rotation of core-forming materials. The deformation may originate from various sources, such as Maxwell stress (Karato, 1999), thermal convection (Wenk et al., 2000), preferential equatorial solidification (Yoshida et al., 1996), or Joule heating (Takehiro, 2011). In the most recent research, Frost et al. (2021) suggested that the structure of the inner core can be well reproduced by the deformation of hcp-Fe-Ni alloy induced by a combination of its preferential growth on one side of the equator followed by a slow translation.
Measurements of the moments of inertia of the terrestrial planets, i.e., Mercury (Genova et al., 2019), Venus (Dumoulin et al., 2017), Mars (Cook, 1977), and the Moon (Toksöz et al., 1974) suggested the existence of dense metallic cores. The presence of the magnetic fields and quite a small mean moment of inertia (Sohl et al., 2002; Breuer et al., 2015) indicate that Jovian moons such as Io, Europa, and Ganymede also have metallic cores (Sohl et al., 2002; Soderlund et al., 2020).
The cores of terrestrial planets are likely comprised of Fe-Ni alloys with some other, lighter elements (Breuer et al., 2015; Trønnes et al., 2019). The amount of light elements can reach up to 25 wt% in the core of Mercury (Chabot et al., 2014), 9 wt% in the core of Venus, 5 wt% in the Moon, and 14 wt% in Mars (Trønnes et al., 2019). Silicon has long been considered as a major light element of the Earth’s core: it has a high cosmic abundance and can be incorporated into Fe-Ni alloy during core formation (Trønnes et al., 2019). Silicon content in planetary cores is heavily dependent on how reducing are the conditions inside the planet. For example, estimations for silicon content in Mercury’s core range from 15 to 25 wt% (Chabot et al., 2014; Knibbe and van Westrenen, 2018; Trønnes et al., 2019), while Venus’s core may contain up to 6 wt% of silicon, (O’Neill, 2021). Pressure conditions in the cores of terrestrial planets span over a huge range, from less than 6 GPa in the Jovian moons and the Moon to 20—40 GPa in Mercury and Mars, over 100 GPa in Venus (Trønnes et al., 2019). This diversity in pressure, temperature, and composition determines the conditions for the study of the physical properties of iron alloys relevant for planetary interiors.
We performed plastic deformation experiments employing diamond anvil cells (DAC) as a deformation apparatus at extreme pressure and temperature conditions coupled with X-ray diffraction in the radial geometry. In view of a potentially high Si content of the core Fe-alloy, we investigated yield strength and anisotropy of stoichiometric ε-FeSi. That provides a good first-order approximation of the deformation behavior of the Fe-FeSi system at the conditions of planetary cores. Our results tell that ε-FeSi is less anisotropic than hcp-Fe and its alloys. This difference can be used for constraining the silicon amount in planetary cores from seismic observations.
2 Materials and methods
2.1 Resistive-heated diamond-anvil cell experiments
We performed all the experiments on commercial iron silicide (FeSi) powders (AlfaAesar, CAS 12022-95-6, 99.9% nominal purity). Upon preliminary X-ray diffraction analysis, we found that the sample powder contained a small amount of SiC impurity (below 3.5 mass%). The initial powder was finely ground in an agate mortar and further loaded into the high-pressure chamber made of an X-ray transparent amorphous boron epoxy gasket (Merkel and Yagi, 2005). Diamond anvils with culet sizes of 300 µm were employed and typical diameters sizes for the sample chamber were 80 µm. The gaskets were held in place by a piece of Kapton. We did not use any pressure transmitting mediums in order to maximize the stress applied to the sample. Mao-Bell piston-cylinder type diamond anvil cells modified for high-temperature studies and equipped with graphite resistive heaters were employed to reach the desired P-T conditions (Liermann et al., 2009; Liermann et al., 2015; Immoor et al., 2020). The temperature was monitored with two type-R thermocouples. One thermocouple was put in contact with the diamond near the compression chamber while the second one was in contact with the heater. A water-cooled vacuum vessel capable to maintain 10–4 mbar was used to avoid oxidation of the diamonds, seats, and electrical connections. Additional details about the design and operation of the resistive heated DAC for X-ray diffraction in radial geometry can be found elsewhere (Liermann et al., 2015; Immoor et al., 2020).
2.2 Synchrotron radial X-ray diffraction experiments
We performed measurements at the P02.2 extreme conditions beamline of PETRA III synchrotron (DESY). The radial X-ray diffraction data were collected along isotherms at 300 K and 1100 K up to 49 GPa (Supplementary Table S1).
The X-ray beam was focused down to 8(H) × 2(V) µm2 by an array of compound refractive lenses. Diffraction experiments were conducted during two separate beamtimes with monochromatic X-rays of 0.4817 Å and 0.4843 Å wavelengths at 300 K and 1100 K, respectively, collected by a Perkin Elmer XRD 1621 flat panel detector. The sample-detector distances were 415.6 mm and 502.3 mm for the experiments at room temperature and high temperature, respectively. The sample-detector distance, tilt, and beam center were calibrated using a CeO2 standard from NIST (674b) in DIOPTAS software (Prescher and Prakapenka, 2015).
We employed the equation of state (EOS) of the sample (Fischer et al., 2014) to determine the pressure in the experiment conducted at room temperature. In the heated cell, the pressure was determined (Supplementary Table S2) using the EOS of Au pieces placed inside the high-pressure chamber (Fei et al., 2007). The pressure dependence of the unit-cell volumes at both temperatures is on Supplementary Figure S1.
2.3 Data reduction
Collected data were divided into 72 azimuthal sections by 5° and each section was fitted using the MAUD software (Lutterotti et al., 1999). The fitting of lattice strain parameters was performed utilizing a model “radial diffraction in the DAC” as implemented in MAUD that relies on the formalism of Singh et al. (1998).
The stress (
where
where
where coefficient
We used the Voigt-Reuss-Hill scheme (Hill, 1952) to calculate the shear modulus
where
where Cij are the corresponding stiffness tensor components. The pressure and temperature dependence of the stiffness tensor components of ε-FeSi were derived from the first-principle calculations by Qi et al. (2019) and presented in Supplementary Table S3. Stiffness tensor components at 1100 K were obtained by linear interpolation of data between 300 K and 2000 K.
The texture of crystallites developed due to the plastic deformation was refined with the E-WIMV model implemented in MAUD with the assumed fiber symmetry around the compression axis. The model is based on the WIMV method (Matthies and Vinel, 1982), extended to be used on irregular grids, which includes a build-in smoothing function (Lutterotti et al., 2004). The corresponding pole figures were exported from MAUD and the MTEX software (Bachmann et al., 2010; Mainprice et al., 2015) was used for plotting the inverse pole figures (IPFs) and the anisotropy of the sound velocities derived from the elastic tensor of Qi et al. (2019).
3 Results
We carried out the experiments in the FeSi polycrystalline sample at pressures from 7 GPa to 49 GPa at 300 K and from 13 to 49 GPa at about 1100 K (1080 ± 30 K). Our diffraction data confirms that the sample remains in the ε-FeSi (B20-structure, P213 space group) throughout the studied range.
Representative unrolled diffraction data are presented in Figure 1. The deviations of d-spacings from the straight line are due to the induced lattice strains, Eq. 2. We used the strongest reflections corresponding to (110), (111), (200), (120), (211), and (130) lattice planes. We used them to derive the lattice strain parameters
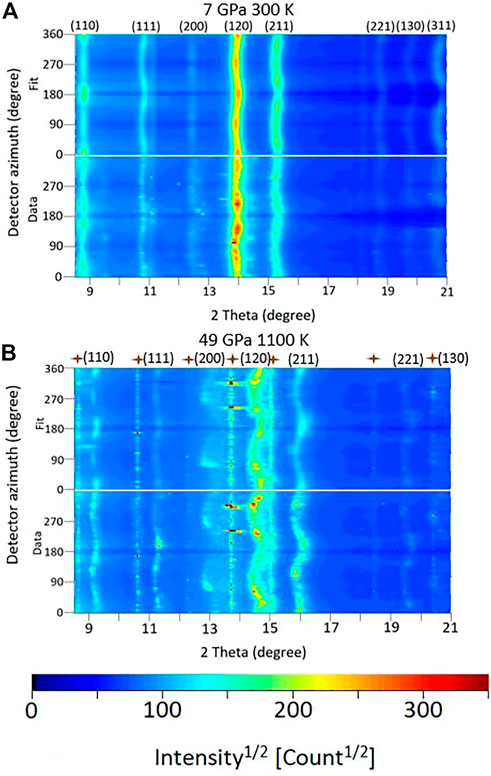
FIGURE 1. Unrolled diffraction patterns (bottom) collected at 7 GPa and 300 K (A) and 49 GPa and 1100 K (B) along with the best-fit models (top). The intensity variations of the diffraction lines are caused by lattice preferred orientation in ε-FeSi, the curvature is a measure of elastic lattice strains. Numbers (e.g., 110) indicate the Laue indices of the Bragg reflections of compressed ε-FeSi, brown crosses are the diffraction lines of ε-FeSi located outside the pressure chamber, as indicated by the absence of strain or change in 2θ upon increasing pressure.
Analysis of the average lattice strain parameters
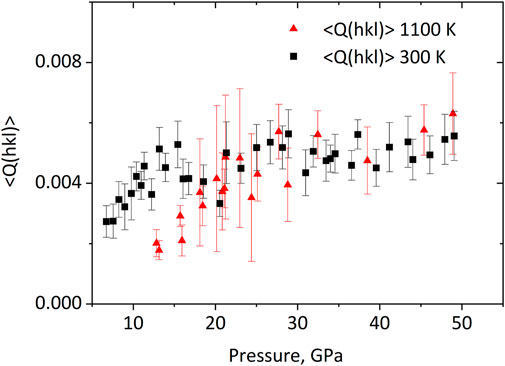
FIGURE 2. Pressure evolution of the average lattice strain parameter
The pressure evolution lattice preferred orientations in ε-FeSi at different temperatures is presented in Figure 3 as IPF of the compression direction. The B20-structure is cubic but without the 4-fold rotation axis and therefore directions
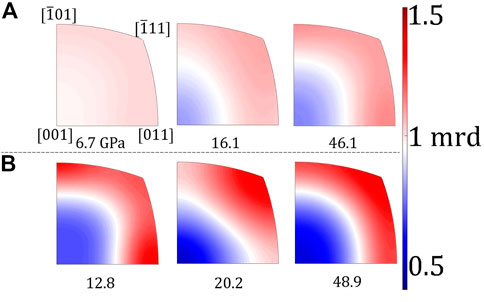
FIGURE 3. Inverse pole figures of the compression direction showing deformation textures in ε-FeSi at 300 K (A) and 1100 K (B) and indicated pressures, in GPa. Texture is expressed in mrd—multiples of a random distribution.
4 Discussion
At all studied pressures we detected only ε-FeSi without evidence for the transition towards the high-pressure FeSi phase (B2-structure, space group
Analysis of texture evolution of B20 ε-FeSi shows strong intensities on [
Our results demonstrate that temperature does not significantly influence the average lattice strain parameter in ε-FeSi, at least within the experimental precision. Brennan et al. (2021) reported a decrease of the
We further employed the experimental
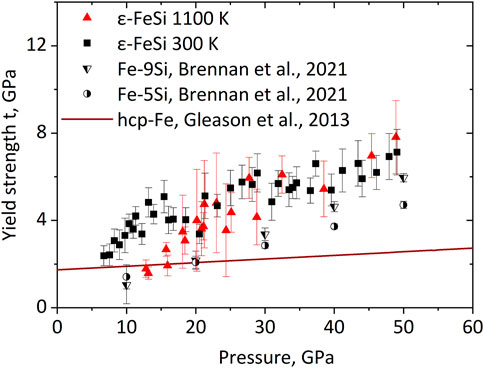
FIGURE 4. Pressure evolution of the yield strength of ε-FeSi at 300 K and 1100 K along with data for hcp-Fe-5Si, hcp-Fe-9Si alloy (Brennan et al., 2021), and hcp-Fe (Gleason and Mao, 2013) for comparison.
Experimental textures combined with elasticity data (Qi et al., 2019) allow calculating the anisotropy of sound velocities in a textured polycrystalline aggregate. The azimuthal anisotropy refers to the relative difference in the velocity of the wave propagation between different propagation directions:
Shear wave splitting could be described by Eq. 9:
where VS1 and VS2 are two perpendicular components of shear waves and their splitting is maximum difference between them. Shear wave contrast is also a measure of difference between the two shear waves given by:
For a single-crystal, anisotropy of sound velocity depends only on the Cij elastic constants (Supplementary Table S3). The calculated values for the anisotropy of the longitudinal waves (VP) in ε-FeSi single-crystal are presented in Figure 5 and for the two transverse waves (VS1 and VS2) in Supplementary Figure S2. Numerical data on sound-wave anisotropy is shown in Supplementary Tables S6, S7 for 300 and 1100 K, respectively. At low pressure, the single-crystal anisotropy is higher at high temperatures. However, the single-crystal VP anisotropy decreases from 4.3% to 0.6% at 300 K and from 4.4% to 0.7% at 1100 K, reaching similar values above 30 GPa.
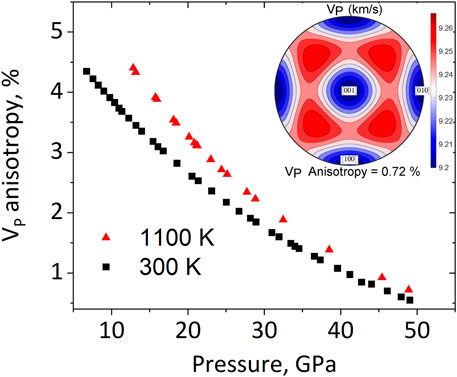
FIGURE 5. Anisotropy of the longitudinal waves (VP) in ε-FeSi single crystal at 300 K (black squares) and 1100 K (red triangles) (recalculated based on elastic constants from Qi et al. (2019). Insert: pole figure of VP anisotropy in ε-FeSi single crystal at 48.9 GPa and 1100 K.
Further, we have utilized experimental deformation textures to model sound velocities for a polycrystalline aggregate of ε-FeSi deformed in compression (Figure 6, Supplementary Figure S3 and Supplementary Tables S8, S9). Due to relatively weak textures, the azimuthal anisotropy for longitudinal waves in a polycrystalline aggregate does not exceed 0.2% above 30 GPa (Figure 6) with anisotropy at the high temperature slightly higher than that at 300 K. Compressional waves are fast along the compression direction and reach a minimum at approximately 45° of the compression direction. The measurement of azimuthal anisotropy of shear waves is currently beyond the capabilities of seismological methods for core studies. Shear wave splitting between two shear waves with different polarization (VS1 and VS2) is presently not measured for the Earth’s inner core but could potentially be addressed in future studies. Our predictions for the shear wave splitting are presented in Figure 7, Supplementary Tables S6, S7, and demonstrate vanishingly low values (less than 0.05 km/s in all cases and all propagation directions). Thus, the shear wave contrast is below 0.1% for all studied pressure-temperature conditions. This value is well below those of anisotropic regions of the Earth’s mantle with typical shear wave splitting of up to several percent in the D″ layer, for instance (Mainprice, 2015).
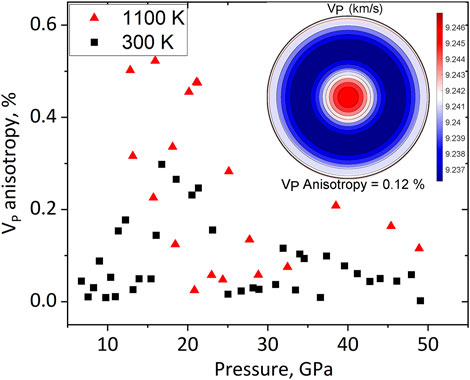
FIGURE 6. Azimuthal anisotropy of the longitudinal waves (VP) in polycrystalline ε-FeSi at 300 K (black squares) and 1100 K (red triangles) based on single-crystal elastic moduli and the measured experimental textures. Insert: pole figure of VP velocities in a polycrystalline ε-FeSi assembly along the compression direction at 48.9 GPa and 1100 K.
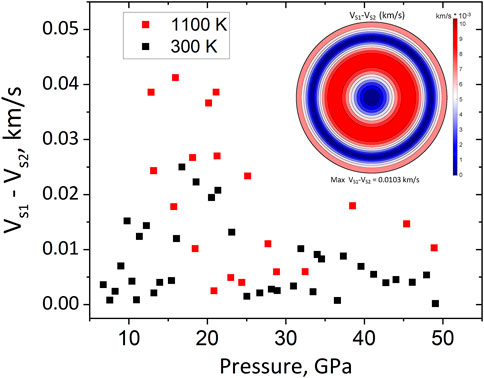
FIGURE 7. Maximum shear wave splitting (VS1-VS2) in polycrystalline ε-FeSi at 300 K (black squares) and 1100 K (red squares) based on single-crystal elastic moduli and the measured experimental textures. Insert: pole figure of VS1-VS2 shear wave splitting in a polycrystalline ε-FeSi assembly along the compression direction at 48.9 GPa and 1100 K.
Obtained results contribute to a global understanding of the effect of elements other than Fe on the mechanical properties of planetary core Fe alloys. Our observations of weak anisotropy of sound waves in ε-FeSi at high-pressure high-temperature conditions may play an important role in understanding the composition of inner cores of small terrestrial planets. Among such bodies is primarily Mercury, where ε-FeSi can crystalize, due to the compatibility with a sufficient amount of silicon in the composition of its core and suitable pressure-temperature conditions for the stability of the ε-FeSi phase. Solidification of the planetary cores can happen in two ways: either from the center of the planet or at some depth within the liquid outer core (Breuer et al., 2015; Edmund et al., 2022). The depth of solidification depends on the change of the liquidus temperature with pressure in the core-forming mixture and on the nature of the core-forming mixture itself. For the cores with high silicon content, and, hence with ε-FeSi as the liquidus phase, solidification of the FeSi layer on the mantle side may take place (Edmund et al., 2022).
The lowest pressure when B2-FeSi appears is 14 GPa and the full transformation to B2-FeSi occurs within the limit of 42 GPa, according to Fischer et al. (2013) and Geballe and Jeanloz (2014). The estimated pressure at the outer border of the Mercury core does not exceed 6 GPa, below which there is a liquid core (Hauck et al., 2013; Trønnes et al., 2019). With a crystallization on the outer portion of the core, we do not expect any B2 FeSi phase but rather the ε-phase to crystallize in Mercury’s core. Core pressures in the Moon and other planetary satellites are below 10 GPa. Hence, FeSi would also solidify there as ε-FeSi. Venus core-mantle boundary pressure is above 100 GPa (Trønnes et al., 2019), while the Mars core-mantle boundary pressure is about 18–19 GPa at temperatures of 1900–2000 K (Stähler et al., 2021). Thus, FeSi could exist in the B2 form in the cores of Mars or Venus. However, current estimations of the amounts of silicon in the Venusian and Martian cores suggest that there are too low concentrations for stoichiometric FeSi crystallization (Trønnes et al., 2019).
Alloys of hcp-Fe-Ni-Si demonstrate stronger texture (Brennan et al., 2021) compared to ε-FeSi (Figure 3). In addition, inelastic X-Ray scattering measurements by Antonangeli et al., 2004 revealed that VP anisotropy in polycrystalline hcp-Fe increases from about 1% at 22 GPa to above 4% at 112 GPa. Thus, hcp-Fe and Fe-Si alloys show at least one order of magnitude higher anisotropy compared to that of ε-FeSi. Our data suggest that, contrary to iron and its alloys, intermetallic FeSi should form an isotropic solid layer on the outer side of the planetary core. Consequently, measurement of the anisotropy of the seismic wave propagation by planetary missions could confirm or rule out iron silicide as a dominant component in planetary cores.
5 Conclusions
We have conducted radial X-ray diffraction experiments on stoichiometric FeSi at 300 K and 1100 K. FeSi remained in the B20-phase (ε-FeSi) up to 49 GPa.
Lattice strains in ε-FeSi do not show significant temperature dependence at least up to 1100 K. At both studied temperatures, 300 K and 1100 K, the lattice strains initially increase fast upon pressurization until about 20 GPa and then stagnate. As a result, the yield strength in ε-FeSi demonstrates only a weak increase above 20 GPa, which originates from the increase of the shear modulus. We have not detected the temperature effect on the yield strength of ε-FeSi within experimental precision.
The yield strength of ε-FeSi is higher compared to iron-silicon alloys and pure iron i.e., ε-FeSi is a harder material to deform. Consequently, the polycrystalline aggregate of ε-FeSi shows weak textures at extreme pressure-temperature conditions, resulting in the weak anisotropy of sound velocities. The anisotropy we estimate for ε-FeSi deformed in axial compression does not exceed 1.2% and decreases below 0.5% upon compression.
The plastic properties of ε-FeSi can be used to constrain the amount of silicon in planetary cores. Our research demonstrates that ε-FeSi should form elastically isotropic structures in the interior of small terrestrial planets. Therefore, any anisotropy detected in planetary cores will be incompatible with crystallized ε-FeSi and could rule out silicon as the dominant element in the core composition.
Data availability statement
The datasets presented in this study can be found in online repositories. The names of the repository/repositories and accession number(s) can be found below: https://zenodo.org/record/6672195#.YrC9NWBBzct.
Author contributions
IK, SM, and CS-V designed and organized the project. IK, MA, CP, H-PL, SM, and CS-V conducted the high-pressure high-temperature radial X-ray diffraction experiments. EK analyzed the data. EK and IK interpreted the results and wrote the manuscript with contributions from all authors.
Funding
This research was partially supported by the German Research Foundation (DFG) through the DFG Project AOBJ:662965 GZ.:KU 3832/2-1 and start-up funds of WWU Münster. This study received support from the bilateral PROCOPE-PPP program (PHC 40555PC; DAAD 57390184). The research leading to this result was also supported by the project CALIPSOplus under the Grant Agreement 730872 from the EU Framework Programme for Research and Innovation HORIZON 2020.
Acknowledgments
The authors acknowledge DESY (Hamburg, Germany), a member of the Helmholtz Association HGF, for the provision of beamtime allocated for proposals I-20170400 and I-20170881.
Conflict of interest
The authors declare that the research was conducted in the absence of any commercial or financial relationships that could be construed as a potential conflict of interest.
Publisher’s note
All claims expressed in this article are solely those of the authors and do not necessarily represent those of their affiliated organizations, or those of the publisher, the editors and the reviewers. Any product that may be evaluated in this article, or claim that may be made by its manufacturer, is not guaranteed or endorsed by the publisher.
Supplementary material
The Supplementary Material for this article can be found online at: https://www.frontiersin.org/articles/10.3389/feart.2022.974148/full#supplementary-material
References
Anderson, D. L., and Dziewonski, A. M. (1982). Upper mantle anisotropy: evidence from free oscillations. Geophys. J. Int. 69, 383–404. doi:10.1111/j.1365-246X.1982.tb04956.x
Antonangeli, D., Occelli, F., Requardt, H., Badro, J., Fiquet, G., and Krisch, M. (2004). Elastic anisotropy in textured hcp-iron to 112 GPa from sound wave propagation measurements. Earth Planet. Sci. Lett. 225, 243–251. doi:10.1016/j.epsl.2004.06.004
Bachmann, F., Hielscher, R., and Schaeben, H. (2010). Texture analysis with MTEX – free and open source software toolbox. Solid State Phenom. 160, 63–68. doi:10.4028/www.scientific.net/ssp.160.63
Brennan, M. C., Fischer, R. A., Couper, S., Miyagi, L., Antonangeli, D., and Morard, G. (2021). High-pressure deformation of iron – nickel – silicon alloys and implications for earth ’ s inner core journal of geophysical research: Solid earth. J. Geophys. Res. Solid Earth 126, 1–14. doi:10.1029/2020JB021077
Breuer, D., Rueckriemen, T., and Spohn, T. (2015). Iron snow, crystal floats, and inner-core growth: modes of core solidification and implications for dynamos in terrestrial planets and moons. Prog. Earth Planet. Sci. 2, 39. doi:10.1186/s40645-015-0069-y
Calnan, E. (1954). Deformation textures of face-centred cubic metals. Acta Metall. 2, 865–874. doi:10.1016/0001-6160(54)90041-3
Chabot, N. L., Wollack, E. A., Klima, R. L., and Minitti, M. E. (2014). Experimental constraints on Mercury’s core composition. Earth Planet. Sci. Lett. 390, 199–208. doi:10.1016/j.epsl.2014.01.004
Cook, A. H. (1977). The moment of inertia of Mars and the existence of a core. Geophys. J. Int. 51, 349–356. doi:10.1111/j.1365-246X.1977.tb06922.x
Creager, K. C. (1992). Anisotropy of the inner core from differential travel times of the phases PKP and PKIKP. Nature 356, 309–314. doi:10.1038/356309a0
Creager, K. C. (1999). Large-scale variations in inner core anisotropy. J. Geophys. Res. 104, 23127–23139. doi:10.1029/1999JB900162
Deuss, A. (2014). Heterogeneity and anisotropy of Earth’s inner core. Annu. Rev. Earth Planet. Sci. 42, 103–126. doi:10.1146/annurev-earth-060313-054658
Dumoulin, C., Tobie, G., Verhoeven, O., Rosenblatt, P., and Rambaux, N. (2017). Tidal constraints on the interior of Venus. J. Geophys. Res. Planets 122, 1338–1352. doi:10.1002/2016JE005249
Edmund, E., Morard, G., Baron, M. A., Rivoldini, A., Yokoo, S., Boccato, S., et al. (2022). The Fe-FeSi phase diagram at Mercury’s core conditions. Nat. Commun. 13, 387. doi:10.1038/s41467-022-27991-9
El-Tahawy, M., Jenei, P., Kolonits, T., Han, G., Park, H., Choe, H., et al. (2020). Different evolutions of the microstructure, texture, and mechanical performance during tension and compression of 316L stainless steel. Metall. Mater. Trans. A 51, 3447–3460. doi:10.1007/s11661-020-05782-5
Fei, Y., Ricolleau, A., Frank, M., Mibe, K., Shen, G., and Prakapenka, V. (2007). Toward an internally consistent pressure scale. Proc. Natl. Acad. Sci. U. S. A. 104, 9182–9186. doi:10.1073/pnas.0609013104
Fischer, R. A., Campbell, A. J., Reaman, D. M., Miller, N. A., Heinz, D. L., Dera, P., et al. (2013). Phase relations in the Fe – FeSi system at high pressures and temperatures. Earth Planet. Sci. Lett. 373, 54–64. doi:10.1016/j.epsl.2013.04.035
Fischer, R. A., Campbell, A. J., Caracas, R., Reaman, D. M., Heinz, D. L., Dera, P., et al. (2014). Equations of state in the Fe‐FeSi system at high pressures and temperatures. J. Geophys. Res. Solid Earth 119, 2810–2827. doi:10.1002/2013JB010898
Frost, D. A., Lasbleis, M., Chandler, B., and Romanowicz, B. (2021). Dynamic history of the inner core constrained by seismic anisotropy. Nat. Geosci. 14, 531–535. doi:10.1038/s41561-021-00761-w
Garcia, R., and Souriau, A. (2000). Inner core anisotropy and heterogeneity level. Geophys. Res. Lett. 27, 3121–3124. doi:10.1029/2000GL008520
Geballe, Z. M., and Jeanloz, R. (2014). Solid phases of FeSi to 47 GPa and 2800 K: New data. Am. Mineral. 99, 720–723. doi:10.2138/am.2014.4612
Genova, A., Goossens, S., Mazarico, E., Lemoine, F. G., Neumann, G. A., Kuang, W., et al. (2019). Geodetic evidence that Mercury has A solid inner core. Geophys. Res. Lett. 46, 3625–3633. doi:10.1029/2018GL081135
Gleason, A. E., and Mao, W. L. (2013). Strength of iron at core pressures and evidence for a weak Earth’s inner core. Nat. Geosci. 6, 571–574. doi:10.1038/ngeo1808
Hauck, S. A., Margot, J.-L., Solomon, S. C., Phillips, R. J., Johnson, C. L., Lemoine, F. G., et al. (2013). The curious case of Mercury’s internal structure. J. Geophys. Res. Planets 118 (6), 1204–1220. doi:10.1002/jgre.20091
Hill, R. (1952). The elastic behaviour of a crystalline aggregate. Proc. Phys. Soc. A 6, 349–354. doi:10.1088/0370-1298/65/5/307
Immoor, J., Marquardt, H., Miyagi, L., Speziale, S., Merkel, S., Schwark, I., et al. (2020). An improved setup for radial diffraction experiments at high pressures and high temperatures in a resistive graphite-heated diamond anvil cell. Rev. Sci. Instrum. 91, 045121. doi:10.1063/1.5143293
Irving, J. C. E., and Deuss, A. (2011). Hemispherical structure in inner core velocity anisotropy. J. Geophys. Res. 116, B04307. doi:10.1029/2010JB007942
Ishii, M., and Dziewonski, A. M. (2002). The innermost inner core of the Earth: Evidence for a change in anisotropic behavior at the radius of about 300 km. Proc. Natl. Acad. Sci. U. S. A. 99, 14026–14030. doi:10.1073/pnas.172508499
Karato, S. (1999). Seismic anisotropy of the Earth’s inner core resulting from flow induced by Maxwell stresses. Nature 402, 871–873. doi:10.1038/47235
Kern, H., and Braun, G. (1973). Deformation und Gefügeregelung von Steinsalz im Temperaturbereich 20-200 °C. Contr. Mineral. Pet. 40, 169–181. doi:10.1007/BF00378174
Kestens, L. A. I., and Pirgazi, H. (2016). Texture formation in metal alloys with cubic crystal structures. Mater. Sci. Technol. 32, 1303–1315. doi:10.1080/02670836.2016.1231746
Khadkikar, P. S., Michal, G. M., and Vedula, K. (1990). Preferred orientations in extruded nickel and iron aluminides. Metall. Trans. A 21, 279–288. doi:10.1007/BF02782408
Knibbe, J. S., and van Westrenen, W. (2018). The thermal evolution of Mercury’s Fe–Si core. Earth Planet. Sci. Lett. 482, 147–159. doi:10.1016/j.epsl.2017.11.006
Lay, T., and Young, C. J. (1991). Analysis of seismic SV waves in the core’s penumbra. Geophys. Res. Lett. 18, 1373–1376. doi:10.1029/91GL01691
Liermann, H.-P., Merkel, S., Miyagi, L., Wenk, H.-R., Shen, G., Cynn, H., et al. (2009). Experimental method for in situ determination of material textures at simultaneous high pressure and high temperature by means of radial diffraction in the diamond anvil cell. Rev. Sci. Instrum. 80, 104501. doi:10.1063/1.3236365
Liermann, H.-P., Konôpková, Z., Morgenroth, W., Glazyrin, K., Bednarčik, J., McBride, E. E., et al. (2015). The extreme conditions beamline P02.2 and the extreme conditions science infrastructure at PETRA III. J. Synchrotron Radiat. 22, 908–924. doi:10.1107/S1600577515005937
Lord, O. T., Walter, M. J., Dobson, D. P., Armstrong, L., Clark, S. M., and Kleppe, A. (2010). The FeSi phase diagram to 150 GPa. J. Geophys. Res. 115, B06208. doi:10.1029/2009JB006528
Lutterotti, L. S., Matthies, S., and Wenk, H.-R. (1999). MAUD: a friendly java program for material analysis using diffraction. IUCr Newsl. CPD 21, 14–15.
Lutterotti, L., Chateigner, D., Ferrari, S., and Ricote, J. (2004). Texture, residual stress and structural analysis of thin films using a combined X-ray analysis. Thin Solid Films 450, 34–41. doi:10.1016/j.tsf.2003.10.150
Mainprice, D., Bachmann, F., Hielscher, R., and Schaeben, H. (2015). Descriptive tools for the analysis of texture projects with large datasets using MTEX : strength, symmetry and components. Geol. Soc. Lond. Spec. Publ. 409, 251–271. doi:10.1144/SP409.8
Mainprice, D. (2015). “Seismic anisotropy of the deep earth from a mineral and rock Physics perspective,” in Treatise on geophysics (Elsevier), 487–538. doi:10.1016/B978-0-444-53802-4.00044-0
Margevicius, R. W., and Cotton, J. D. (1995). Study of the brittle-to-ductile transition in NiAl by texture analysis. Acta Metall. Mater. 43, 645–655. doi:10.1016/0956-7151(94)00273-K
Masters, G., and Gilbert, F. (1981). Structure of the inner core inferred from observations of its spheroidal shear modes. Geophys. Res. Lett. 8, 569–571. doi:10.1029/GL008i006p00569
Matthies, S., and Vinel, G. W. (1982). On the reproduction of the orientation distribution function of texturized samples from reduced Pole figures using the conception of a conditional ghost correction. Phys. Stat. Sol. 111, 111–114. doi:10.1002/pssb.2221120254
Merkel, S., and Yagi, T. (2005). X-ray transparent gasket for diamond anvil cell high pressure experiments. Rev. Sci. Instrum. 76, 046109. doi:10.1063/1.1884195
Merkel, S. (2010). “Radial diffraction in the diamond anvil cell: Methods and applications,” in NATO science for peace and security series B: Physics and biophysics, 111–122. doi:10.1007/978-90-481-9258-8_10
Mi, Z., Shieh, S. R., Kavner, A., Kiefer, B., Wenk, H.-R., and Duffy, T. S. (2018). Strength and texture of sodium chloride to 56 GPa. J. Appl. Phys. 123, 135901. doi:10.1063/1.5022273
Morelli, A., Dziewonski, A. M., and Woodhouse, J. H. (1986). Anisotropy of the inner core inferred from PKIKP travel times. Geophys. Res. Lett. 13, 1545–1548. doi:10.1029/GL013i013p01545
Niu, Z. W., Tang, M., and Cai, L. C. (2020). Mechanism for structure conversion of FeSi under pressures. Phys. Lett. A 384, 126598. doi:10.1016/j.physleta.2020.126598
O’Neill, C. (2021). End‐member venusian core scenarios: Does Venus have an inner core? Geophys. Res. Lett. 48, 1–7. doi:10.1029/2021GL095499
Poirier, J. P. (1995). “Plastic rheology of crystals,” in Mineral physics and crystallosraphy. Washington: American Geophysical Union.
Poupinet, G., Pillet, R., and Souriau, A. (1983). Possible heterogeneity of the Earth’s core deduced from PKIKP travel times. Nature 305, 204–206. doi:10.1038/305204a0
Prescher, C., and Prakapenka, V. B. (2015). DIOPTAS : a program for reduction of two-dimensional X-ray diffraction data and data exploration. High. Press. Res. 35, 223–230. doi:10.1080/08957959.2015.1059835
Qi, S., Zhang, X., Niu, Z., Liu, C., and Cai, L. (2019). First-principles investigations on elasticity properties of FeSi under high pressure and temperature. Phys. B Condens. Matter 557, 82–87. doi:10.1016/j.physb.2019.01.009
Reali, R., Jackson, J. M., Van Orman, J., Bower, D. J., Carrez, P., and Cordier, P. (2019). Modeling viscosity of (Mg, Fe)O at lowermost mantle conditions. Phys. Earth Planet. Inter. 287, 65–75. doi:10.1016/j.pepi.2018.12.005
Singh, A. K., and Balasingh, C. (1994). The lattice strains in a specimen (hexagonal system) compressed nonhydrostatically in an opposed anvil high pressure setup. J. Appl. Phys. 75, 4956–4962. doi:10.1063/1.355786
Singh, A. K., Balasingh, C., Mao, H., Hemley, R. J., and Shu, J. (1998). Analysis of lattice strains measured under nonhydrostatic pressure. J. Appl. Phys. 83, 7567–7575. doi:10.1063/1.367872
Singh, S. C., Taylor, M. A. J., and Montagner, J. P. (2000). On the presence of liquid in Earth’s inner core. Science 287, 2471–2474. doi:10.1126/science.287.5462.2471
Soderlund, K. M., Kalousová, K., Buffo, J. J., Glein, C. R., Goodman, J. C., Mitri, G., et al. (2020). Ice-ocean exchange processes in the jovian and saturnian satellites. Space Sci. Rev. 216, 80–57. doi:10.1007/s11214-020-00706-6
Sohl, F., Spohn, T., Breuer, D., and Nagel, K. (2002). Implications from Galileo observations on the interior structure and chemistry of the Galilean satellites. Icarus 157, 104–119. doi:10.1006/icar.2002.6828
Song, X., and Helmberger, D. V. (1993). Anisotropy of Earth’s inner core. Geophys. Res. Lett. 20, 2591–2594. doi:10.1029/93GL02812
Song, X. (1997). Anisotropy of the Earth’s inner core. Rev. Geophys. 35, 297–313. doi:10.1029/97RG01285
Stähler, S. C., Khan, A., Banerdt, W. B., Lognonné, P., Giardini, D., Ceylan, S., et al. (2021). Seismic detection of the martian core. Science 373 (6553), 443–448. doi:10.1126/science.abi7730
Takehiro, S.-I. (2011). Fluid motions induced by horizontally heterogeneous Joule heating in the Earth’s inner core. Phys. Earth Planet. Inter. 184, 134–142. doi:10.1016/j.pepi.2010.11.002
Tateno, S., Hirose, K., Ohishi, Y., and Tatsumi, Y. (2010). The structure of iron in Earth’s inner core. Science 330, 359–361. doi:10.1126/science.1194662
Tkalčić, H. (2015). Complex inner core of the Earth: The last frontier of global seismology. Rev. Geophys. 53, 59–94. doi:10.1002/2014RG000469
Toksöz, M. N., Dainty, A. M., Solomon, S. C., and Anderson, K. R. (1974). Structure of the moon. Rev. Geophys. 12, 539. doi:10.1029/RG012i004p00539
Tromp, J. (1993). Support for anisotropy of the Earth’s inner core from free oscillations. Nature 366, 678–681. doi:10.1038/366678a0
Trønnes, R. G., Baron, M. A., Eigenmann, K. R., Guren, M. G., Heyn, B. H., Løken, A., et al. (2019). Core formation, mantle differentiation and core-mantle interaction within Earth and the terrestrial planets. Tectonophysics 760, 165–198. doi:10.1016/j.tecto.2018.10.021
Vinnik, L. P., Farra, V., and Romanowicz, B. (1989). Observational evidence for diffracted SV in the shadow of the Earth’s core. Geophys. Res. Lett. 16, 519–522. doi:10.1029/GL016i006p00519
Wenk, H.-R., Baumgardner, J. R., Lebensohn, R. A., and Tomé, C. N. (2000). A convection model to explain anisotropy of the inner core. J. Geophys. Res. 105, 5663–5677. doi:10.1029/1999JB900346
Woodhouse, J. H., Giardini, D., and Li, X. (1986). Evidence for inner core anisotropy from free oscillations. Geophys. Res. Lett. 13, 1549–1552. doi:10.1029/GL013i013p01549
Keywords: diamond-anvil cells, planetary science, core material, anisotropy, yield strength
Citation: Kolesnikov E, Kupenko I, Achorner M, Plückthun C, Liermann H-P, Merkel S and Sanchez-Valle C (2022) Strength and seismic anisotropy of textured FeSi at planetary core conditions. Front. Earth Sci. 10:974148. doi: 10.3389/feart.2022.974148
Received: 20 June 2022; Accepted: 24 October 2022;
Published: 10 November 2022.
Edited by:
Bin Chen, University of Hawaii at Manoa, United StatesReviewed by:
Ryosuke Sinmyo, Meiji University, JapanGuoyin Shen, Argonne National Laboratory (DOE), United States
Copyright © 2022 Kolesnikov, Kupenko, Achorner, Plückthun, Liermann, Merkel and Sanchez-Valle. This is an open-access article distributed under the terms of the Creative Commons Attribution License (CC BY). The use, distribution or reproduction in other forums is permitted, provided the original author(s) and the copyright owner(s) are credited and that the original publication in this journal is cited, in accordance with accepted academic practice. No use, distribution or reproduction is permitted which does not comply with these terms.
*Correspondence: E. Kolesnikov, ZWtvbGVzbmlAdW5pLW11ZW5zdGVyLmRl
‡Present Address: C. Plückthun, Deutsches Elektronen-Synchrotron DESY, Hamburg, Germany