 Francesco Caleca1*
 Veronica Tofani1
 Samuele Segoni1
 Federico Raspini1
 Rachele Franceschini1
 Ascanio Rosi2
- 1Department of Earth Sciences, University of Florence, Florence, Italy
- 2Department of Geosciences, University of Padova, Padova, Italy
Landslides are a worldwide natural hazard that cause more damage and casualties than other hazards. Therefore, social and economic losses can be reduced through a landslide quantitative risk assessment (QRA). In the last two decades, many attempts of quantitative analysis on various scales have been performed; nevertheless, the major difficulty of QRA lies in how precise and reliable the assessment should have to be useful. For this reason, in this paper, we analyzed different freely available datasets and some products of previous research to assess the soundness of the outcomes performed by a recent QRA of slow-moving landslides in the Arno River basin (Central Italy). The validation process was carried out by comparing the abovementioned datasets and two components of the selected QRA (hazard and risk). The obtained results showed a robust correlation between most of the testing dataset and risk components, highlighting the accuracy of the selected QRA.
Introduction
Landslides are one of the major widespread natural hazards; each year, they cause more economic damage and casualties than other natural hazards, such as floods or earthquakes (Dai et al., 2002; Guzzetti, 2006; Petley, 2012; Wirtz et al., 2014). Landslide occurrence is constantly increasing due to climate change, urbanization, deforestation and the greater susceptibility of soil to instability (Nadim et al., 2006). Recent studies have demonstrated that there has been a statistically significant increase in the number of fatal landslide events over the last two decades (Haque et al., 2019) due to global warming. Landslide occurrence triggered by human activity (construction, mining, and hill cutting) is increasing (Froude and Petley, 2018).
Italy is the country most affected by landslides and mass movements. According to Trigila et al. (2010), 6.8% of Italian territory is covered by landslides; specifically, 4,82,272 landslides cover an area of approximately 20,500 km2, and 70.5% of Italian municipalities are affected by them. Landslides are the natural hazards that occur most frequently in Italy, and they cause casualties and damage to buildings and infrastructure (Catani et al., 2005).
Social and economic losses by landslides can be reduced through risk analysis and quantitative risk assessment (QRA), which represent a crucial tool for risk management and planning mitigation measures. To manage risk, it must be first analyzed and evaluated; there is an increasing need to perform quantitative risk analysis (QRA). QRA is distinguished from qualitative risk analysis by the input data, the procedures used in the analysis and the final risk output. In contrast with qualitative risk analysis, which yields results in terms of weighted indices, relative ranks (e.g., low, moderate, and high) or numerical classification, QRA quantifies the probability of a given level of loss and the associated uncertainties.
QRA is important for scientists and planners because it allows risk to be quantified in an objective and reproducible manner, and the results can be compared from one location (site, region, etc.) to another (Corominas et al., 2014); moreover, QRA can facilitate financial and cost–benefit analyses (Fell et al., 2008).
Landslide risk is a measure of the probability and severity of a landslide event to health, property and the environment (Varnes and IAEG Commission on Landslides, 1984; Fell et al., 2008). This definition has been translated into a mathematical form by the Varnes and IAEG Commission on Landslides, 1984: R (I) = H × V(I) × E, where R is the landslide risk, H is the landslide hazard, V is the vulnerability of exposed elements, I is the intensity of landslides and E is the value of the element at risk (e.g., the number of people or the monetary value of buildings).
In the last two decades, many attempts have been made to quantify landslide risk on various geographic scales (Catani et al., 2005; Remondo et al., 2005; van Westen et al., 2006; Zêzere et al., 2007; Lu et al., 2014b; Uzielli et al., 2015a; Uzielli et al., 2015b; Peng et al., 2015; Guo et al., 2020; Huang et al., 2020; Caleca et al., 2022); however, due to the lack of complete data or inability to obtain them, landslide risk studies can be based on indicator definitions (Abella and Van Westen, 2007; Guillard-Gonçalves et al., 2015; de Almeida et al., 2016; Trigila et al., 2018; Pereira et al., 2020; Segoni and Caleca, 2021).
Nevertheless, one of the main difficulties of QRA lies in how precise and reliable the assessment must have to be useful This issue can be resolved only through a solid validation phase of the results performed by a QRA, which is still an aspect of landslide risk assessment that receives less attention by the geoscience community; in contrast to the validation of landslide hazard, which is a well-consolidated topic (Chung and Fabbri, 2003; Remondo et al., 2003; Lombardo and Tanyas, 2020). This lack in the state of art of landslide QRA is mainly due to future scenarios analysis that QRA proposes, which can be validated only verifying future damages and expenses of risk mitigation measures that will be recorded in the expected scenarios.
The raised issue is the starting point of this paper, which aims to analyze a set of available databases for the whole Italian country to define which of them are more suitable to validate QRA for landslides, demonstrating the feasibility of a robust validation process. Specifically, we explore the possibility of using different Italian open-source data and outcomes of previous research studies to assess the soundness of a recently performed regional-scale QRA in Italy (Caleca et al., 2022). The regional-scale QRA selected for validation was performed in the Arno River basin (Central Italy). This QRA was derived from a methodological approach developed for slow-moving landslides, and risk was defined in terms of expected damage to buildings and land use. The methodology was based on the use of freely available open data at the Italian national scale (e.g., IFFI database, ISTAT census sections, OMI database, and VAM database) to compute the components of the risk equation with the final aim of obtaining national reproducible and updatable values of landslide risk at the national level. The obtained results showed high values of landslide risk in the study area, with a total risk of 6.7 billion euros, and the average value for each 1 km2 cell of the grid was 0.946 million euros. These large results were mainly due to the adopted scale of work, which emphasized the great urban centers; therefore, the building exposure role in the risk assessment, specifically, the building risks, were approximately one order of magnitude larger than the land use risk.
Since the aim of this work is to validate landslide risk and its components through a freely available dataset, the validation focused only on landslide hazard and landslide risk values. Nevertheless, we did not validate vulnerability since no open-source database related to building damage from landslides is available, and to carry out the validation, we would have required detailed in situ surveys and investigations to retrieve the damage affecting buildings and land use. Concerning the exposure dataset used in the QRA analyses, these data have been defined by public national institutions as the Revenue Agency, and they do not need validation.
Study area and QRA assessment
The Arno River basin covers an area of approximately 9,100 km2 and is located in Central Italy, mostly in the Tuscany region (98.4%) and a small part is located in the Umbria region (1.6%) (Figure 1). In the Arno River basin, approximately 78% (7,190 km2) of the territory is situated in mountainous and hilly regions. The mean elevation of the whole basin is approximately 235 m above sea level, with 85% of the basin area lower than 600 m and the remaining 15% having elevations greater than 600 m (Lu et al., 2014a). The river originates in Monte Falterona and enters the Thyrrhenian Sea near Pisa after flowing for approximately 241 km (Dapporto et al., 2001).
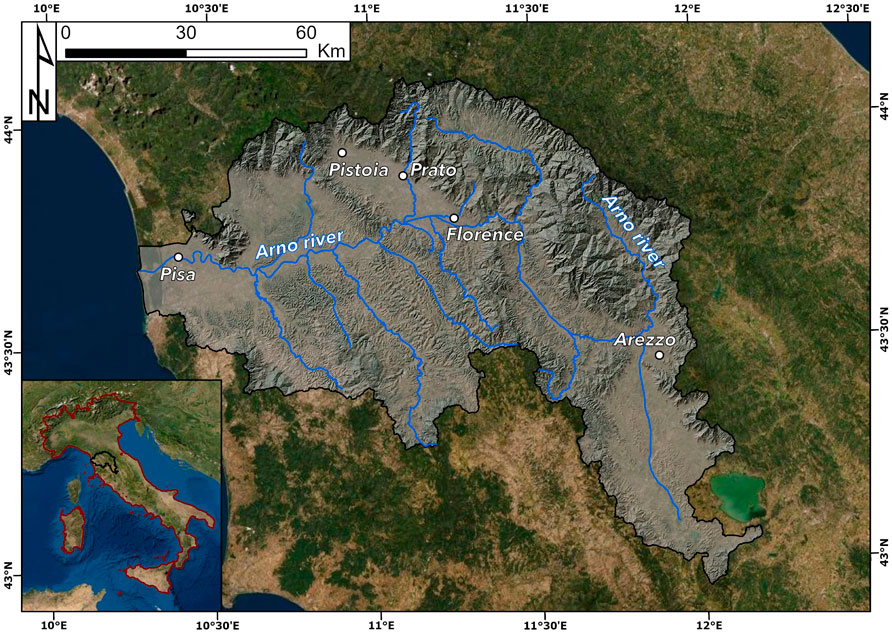
FIGURE 1. Location of the Arno River basin.
The study area is placed across the Northern Apennine chain, which is part of the Alpine orogen. A fold and thrust belt developed in two main stages: first, an oceanic stage (Late Cretaceous–late Eocene/Oligocene), which led to the formation of the Alpine as a consequence of the Ligurian-Piedmont ocean closure through which the Ligurian units (internal oceanic units) were deformed and accreted, and second, an ensialic stage (late Oligocene–Present), during which continental collision formed the Apennine chain (Boccaletti and Sani, 1998). Since the late Tortonian, the internal side of the northern Apennines has been characterized by the deposition, in episutural basins, of marine (to the West) and fluvio-lacustrine (to the East) sediments. This deposition occurred as a consequence of a tectonic regime change from a compressional to extensional regime (Elter, 1975; Carmignani and Kligfield, 1990; Martini and Sagri, 1993; Vai and Martini, 2001).
The Arno River basin is mainly composed of flysch and rocks with a prevailing pelitic fraction along the reliefs and cohesive and granular soils in the hilly basins; obviously, this geological composition affects the type and occurrence of surface processes, primarily through differences in the mechanical properties of the prevalent lithology (Stefanelli et al., 2020).
The study area is mostly affected by landslides; specifically, due to its geological setting and lithological characteristics, slow-moving rotational slides are the mass movements that occur most frequently (IAEG Commission on Landslides, 1990; Bertolini et al., 2004; Catani et al., 2005; Catani et al., 2013; Catani et al., 2016; Lu et al., 2014b; Rosi et al., 2018; Bicocchi et al., 2019). It has been clearly demonstrated that most slope movements are reactivations of pre-existing phenomena that originally occurred in periods characterized by different climatic conditions (e.g., intense rainfall and snowmelt), or anthropogenic activities, in particular agricultural practices, that are identified as the main triggering factors for the reactivation of dormant landslides (Canuti et al., 1979; Farina et al., 2006). According to the Italian landslide inventory, IFFI (Trigila et al., 2007; Trigila et al., 2010), 18,134 landslides have been mapped in the Arno River basin, and their areas range from 100 to 5,106 m2.
In the approach proposed by Caleca et al. (2022), the Arno River basin was divided into a grid with a 1 km2 cell size, and floodplains were excluded from the analysis to simplify the calculation. For each cell, the parameters necessary for the risk assessment were calculated (e.g., hazard, vulnerability, and exposure).
The QRA derives from a methodological approach developed for slow-moving landslides, and risk was defined in terms of expected damage to buildings and land use. The methodology was based on the use of freely available open data at the Italian national scale (e.g., IFFI database, ISTAT census sections, OMI database, and VAM database) to compute the components of the risk equation (hazard, vulnerability, and exposure) with the final aim of obtaining national reproducible and updatable values of landslide risk.
The hazard was considered as the spatial probability of landslide occurrence (e.g., susceptibility) due to the difficulty of retrieving at the national scale information for the evaluation of the temporal probability occurrence of landslides. The hazard values were obtained from an already published slow-moving landslide susceptibility map of Italy (Trigila et al., 2013), which was based on the use of a machine learning algorithm, specifically the random forest treebagger (Breiman, 2001; Brenning, 2005; Catani et al., 2013). The original susceptibility map was updated by combining it with the IFFI database defining a hazard index; then, it was reaggregated to the 1 km2 cell to define a hazard value. The outcomes showed that the hazard values spanned from 0.11 to 1; obviously, there were no cells with hazard values equal to 0 because alluvial plains were removed from the analysis.
The landslide risk was evaluated separately for each type of element at risk (e.g., buildings and land use) in terms of economic losses by applying the equation defined by the Varnes and IAEG Commission on Landslides, 1984. Then, the total risk was obtained by the sum of the buildings and land use. The average value of building risk in the Arno River basin was 0.896 million euros, while the highest value was 67.89 million euros and located in a cell of the municipality of Florence, while the sum of building risk was 6.3 billion euros. The highest value of land use risk was situated in a cell of the municipality of Fiesole, which amounted to 0.809 million euros, and the sum of the land use risk was 0.35 billion euros, while the average value was 0.050 million euros. The highest value of total risk was placed in a cell of the municipality of Florence, and it amounted to approximately 68 million euros (the cell was the same as the building risk); the average value was 0.946 million euros, and the total sum was approximately 6.7 billion euros.
Data and methods
The validation procedure was based on a comparison between the data obtained in Caleca et al. (2022) and several open databases available for the study area (Table 1).
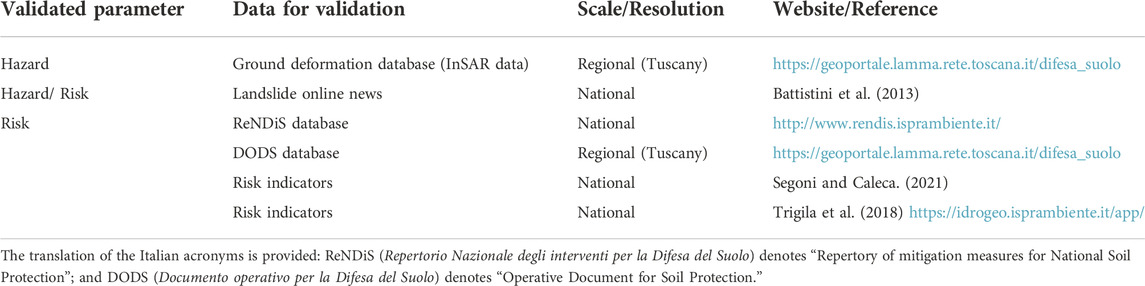
TABLE 1. The data to be validated and used for the validation process.
The validation procedure was carried out for the final output of the QRA, landslide risk values and hazard values. The vulnerability was not analyzed due to the lack of complete data that could be compared with the vulnerability values obtained in our former work.
Data for validation
The database employed to validate intermediate and final outcomes of the QRA for the Arno River basin is described in terms of availability, scale, resolution, and references.
The ground deformation data were used to validate the hazard component of the QRA. The ground deformation data are freely available for the whole Tuscany region and were obtained using the SqueeSAR technique (Ferretti et al., 2011) applied to radar images acquired by the Sentinel-1 satellite constellation of the European Space Agency (ESA) (Bianchini et al., 2018; Raspini et al., 2019). The SqueeSAR technique is a second generation PSInSAR algorithm (Ferretti et al., 2001) and has the great advantage of measuring ground displacements using both Permanent Scatterers (PS) and Distributed Scatterers (DS), identifying a sparse grid of measurement points (MP) for which the displacement time series (TS) along the satellite line of sight (LOS) and the mean yearly velocity can be estimated (Ferretti et al., 2011; Crosetto et al., 2016). Ground deformation data provide deformation map with an excellent spatial and temporal resolution, that can be adopted for validation purposes. According to the literature overview, several studies based on satellite InSAR data have been performed to refine or validate landslide susceptibility maps and models (Ciampalini et al., 2016; Hussain et al., 2021).
The hazard and risk values obtained in our former QRA were also verified through the analysis of landslide online news collected through the employment of a data-mining algorithm named SECaGN (Semantic Engine to Classify and Geotagging News), which is a methodology developed by Battistini et al. (2013). The SECaGN method relies on a mechanism of acquisition, management, publication and geolocation of Google News related to landslides, with a final output represented by an updatable and complete inventory. According to the literature overview, landslide online news report events with high mass-media attention, locating those phenomena that caused huge damage. Therefore, this aspect turns out to be very appropriate for hazard and risk validation purposes (Battistini et al., 2017; Franceschini et al., 2022). Geodatabases that present on-going geomonitoring analysis of the area of a given municipality or province are very useful within validation frameworks (Skrzypczak et al., 2021).
To validate the outcomes of the QRA, financial data concerning the expenses spent on landslide remediation or risk mitigation measures were collected, and these data were provided by the ReNDiS and DODS databases. The first one holds information data (e.g., amount allocated) on mitigation measures and restoration projects of soil protection implemented at the national scale since 2000 (Spizzichino et al., 2009; Campobasso et al., 2013); currently, the ReNDiS database contains 6,063 records, which amount to approximately 6.60 billion euros. Specifically, 3,615 records out of 6,063 are related to landslides. Unfortunately, ReNDiS database does not provide the amount allocated by local and regional administrations, however this gap is filled by the DODS database.
The latter provides information about expenses for hydraulic and hydrogeological hazard mitigation in the Tuscany Region since 2016 spent by the regional administration; specifically, approximately 94 million euros were allocated over the period from 2016 to 2020 (2021 is not yet available).
Last, the outcomes of QRA were verified through two different landslide risk indicator databases, which were adopted to describe in a simplified way a phenomenon of interest. These indicators have the advantage of being concise, easy to understand and easy to measure and update. Undoubtedly, landslide risk indicators are, by definition, are a simple means to frame very useful to frame areas potentially subjected to economic losses due to landslides, despite they represent an oversimplification of the risk analysis topic.
The risk indicators developed by ISPRA (Trigila et al., 2018) are related to population, families, buildings, industries/services and cultural heritage over the whole Italian country. The indicators provide the number of different types of elements at risk for each landslide hazard area (e.g., very high hazard, H4; high, H3; medium, H2; moderate, H1; and attention zones, AA) defined on the basis of the national mosaic of landslide and flood hazard zones realized by ISPRA. The purpose of these indicators is to define an official reference framework for landslide and flood risk in Italy to create a support tool for national mitigation policies by identifying intervention priorities, allocation of funds, programming mitigation measures and planning civil protection measures.
The risk indicators proposed by ISPRA are freely available on the new national IdroGEO web platform, which allows the navigation and download of data and reports and represents a solid infrastructure to communicate and disseminate information about hydrogeological hazards in Italy (Iadanza et al., 2021).
The other set of indicators employed was the one proposed by Segoni and Caleca. (2021), who created indices by overlaying in a GIS environment a susceptibility map (expressing the spatial probability of landslide occurrence) and the nation-wide soil sealing monitoring data (classifying as “1” the urbanized areas and as “0” the natural and seminatural areas). While the susceptibility values are used as a proxy for landslide hazards, soil sealing maps account for the presence/absence of anthropic elements exposed to risk. Two indices were created to quantify the degree of overlap between hazardous areas and built areas, which represent the basic condition to have a relevant degree of risk. The ALR (averaged landslide risk) index characterizes each mapping unit with the mean value of hazard found corresponding to anthropic elements. This index provides an average of how hazardous the portion of the territory that has been urbanized in each mapping unit is. The TLR (total landslide risk) expresses for each mapping unit the sum of the susceptibility values of all urbanized cells. Basically, this index can be used to cumulate for each administration the conditions of interaction between spatial hazard and urbanized areas, expressing how much the development of the municipality has let hazardous areas be “invaded” by construction, infrastructure and services. If compared with a QRA, these very simple indicators can be assumed to consider vulnerability as equal to one and to simply account for the presence of exposed elements, neglecting their worth.
Hazard validation
In this work, the validation process regarding the hazard component of the QRA was based on two different phases: the first phase relied on a comparison between the ground deformation data retrieved by Sentinel-1 and the hazard index map; the other phase concerned the analysis of the relation between the landslide hazard values and the database of landslide online news collected by the SECaGN algorithm.
The ground deformation data were used for the validation process to verify whether areas with higher landslide hazard index values corresponded to active ground movement. In the comparison processes, data acquired in both ascending and descending geometries were considered; subsequently, they were divided into three classes based on their mean yearly velocity expressed in absolute values: MP with velocity <2 mm/yr; MP with 2 mm/yr < velocity <16 mm/yr; and MP with velocity >16 mm/yr. These different threshold values were set according to the landslide velocity classification proposed by Cruden and Varnes (1996). To allow for a proper comparison with the landslide hazard map (which has a 50 m × 50 m pixel resolution), each MP was converted to a cell with a pixel spacing of 30 m × 30 m (which generally corresponds to the resolution of the InSAR processing). Finally, for each ground deformation cell, a mean landslide hazard value was calculated, which was compared with the corresponding velocity class.
The hazard component of the QRA was also analyzed with the inventory of landslide online news collected by the SECaGN data-mining algorithm. The online news used in our validation process ranged from January 2010 to June 2021, and the automatic inventory comprised approximately 51,390 news items regarding the whole Italian territory. Obviously, landslide news was considered only for the study area and was aggregated at the provincial scale to define the amount of landslide news on the territory of each province. Among the different Italian administrative levels, the provincial scale turned out to be the analysis scale that better optimized the spatial distribution of landslide online news. The adoption of higher (i.e., regional) or lower (i.e., municipal) scales of aggregation would have led to an overestimation or underestimation of the amount of news before the comparison with the hazard values. Landslide hazard values, calculated for each of the 1 km2 cell sizes of the grid, were aggregated to the provincial scale to obtain a mean hazard value. Therefore, for each of the nine provinces located in the Arno River basin, a mean hazard value and a number of landslide news items were obtained.
Risk validation
The accuracy of outcomes provided by our former QRA were verified through several databases (financial data, landslide online news and risk indicators) to analyze in detail the landslide risk values. The ReNDiS and DODS data were clipped over the study area and aggregated to the 1 km2 grid to obtain for each cell the sum of expenses from the two databases (Figure 2). Subsequently, the financial data were compared with the landslide risk values obtained in Caleca et al. (2022).

FIGURE 2. Flowchart of the methodology to compute total expenses of mitigation measures provided by the ReNDIS and DODS.
The landslide risk values were also analyzed through online news related to landslides, which were also employed in hazard validation. Nevertheless, online news is mainly related to damage caused by landslides; therefore, it is possible to assume that they can also be used in landslide risk validation. Similar to the hazard validation process, landslide online news and landslide risk values were aggregated to the provincial scale. For each province, the sum of the risk values was computed, and this value was compared with the number of online news items.
Last, the risk values were compared with two different databases of national risk indicators; for this validation phase, the outcome analyzed was the risk to buildings because both risk indicators do not report information about land use risk, while they provide data about buildings; indeed, the ISPRA indicators clearly show the number of buildings for each landslide hazard zone. Likewise, the indices proposed by Segoni and Caleca. (2021) were computed on the basis of the urbanized areas, which can be undoubtedly correlated to the exposure to building risk.
Results and discussion
Hazard vs. ground deformation data
InSAR data represent a valuable support for the validation of landslide hazard maps, as they depict the same geomorphological element from a complementary perspective: While hazard represents the probability of occurrence of slope instability, InSAR measures the corresponding ground deformation with a mutual benefit.
The comparison shows a general agreement between the landslide hazard map and the ground deformation data, highlighting that areas with high hazard values largely correspond to zones with high deformation rates. This general trend was highlighted by both the ascending and descending datasets. Figure 3 clearly includes the frequency distribution of the three velocity classes of MPs for both the ascending and descending geometries; concerning MPs with velocity <2 mm/yr, their peak was in the lower hazard range between 0 and 0.05, while for the other hazard intervals, the percentage of these MP classes was always very low, being less than or equal to 5% for both the ascending and descending datasets.
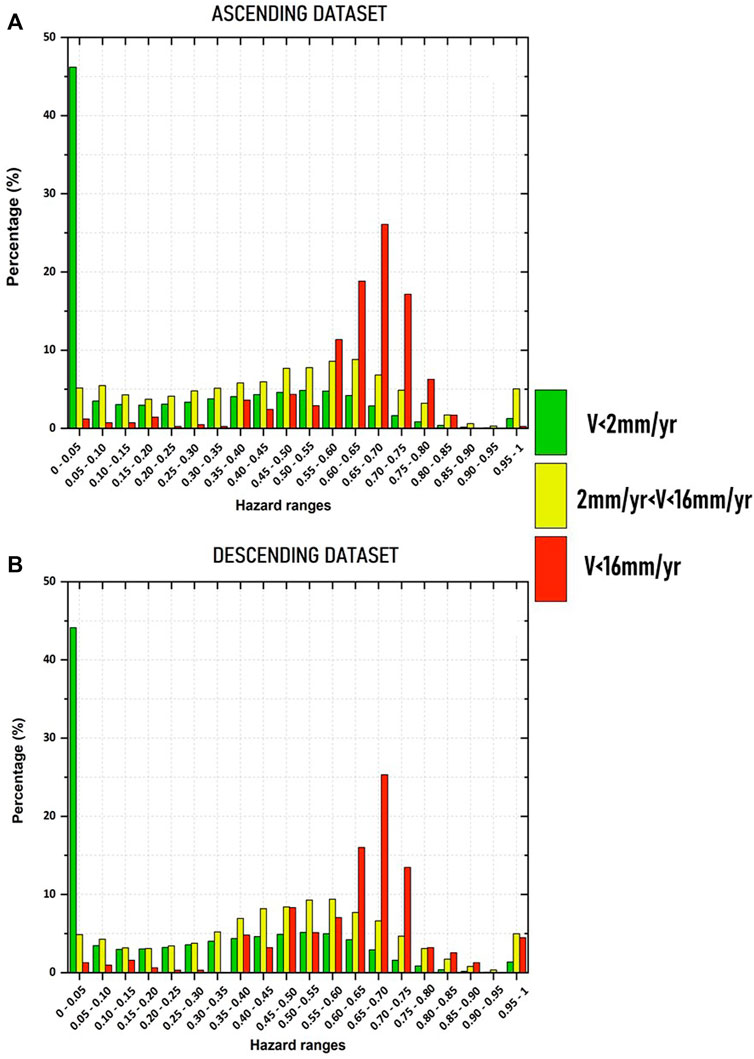
FIGURE 3. Frequency distribution of velocity classes of MP in hazard values. Ascending dataset (A); descending dataset (B).
The frequency distribution of MP with 2 mm/yr< velocity <16 mm/yr showed that this class mainly recurred for hazard values that could be considered medium-high; specifically, for the ascending dataset, approximately 50% of this velocity class was within the hazard range from 0.40 to 0.70 (Figure 3A), while for the descending dataset, approximately 56% of the class was in the same hazard interval (Figure 3B).
Focusing on the highest velocity class of MPs (v > 16 mm/yr), their distribution highlighted that the majority of MPs of this class belonged to areas with high landslide hazard values; approximately 82% of this class in the ascending dataset was characterized by a hazard value greater than 0.60, while approximately 73% was in the descending dataset. Specifically, for both datasets, the peak of the MP with velocity >16 mm/yr was located in the hazard interval between 0.65 and 0.70, with a percentage of approximately 25%.
The results obtained from this validation process clearly reported, despite intrinsic differences between the two sources of information, good agreement between the InSAR and hazard datasets: analysis of the frequency distribution of the three velocity classes of MP showed a positive correlation between the hazard values and ground deformation velocities. The presence, within low hazard classes, of small percentages (on the order of a few percentage points) of MPs with medium and high velocities did not decrease the level of correlation, as these MPs were isolated, single points that most likely represent false positives, being more related to noise (Barra et al., 2017) or artifacts in the interferometric processing chain, rather than to actual deformative processes (Solari et al., 2019).
Hazard and risk vs. landslide online news
The landslide online news collected from January 2010 to June 2021 for the Italian provinces located in the Arno River basin amounted to approximately 2,014 items. The subdivision for each province is reported in Table 2. The province of Florence had the largest number of news items (777); the second largest was the province of Pisa with 314 landslide news items; and Arezzo was the third province with 223 news items recorded in its territory. The provinces reporting the lowest number of news items were Perugia and Livorno, with 13 and 50, respectively. The outcomes concerning the aggregated hazard value at the provincial level clearly showed a homogeneous distribution: the landslide hazard values spanned from 0.42 to 0.57; specifically, there were two provinces in the Arno River basin (Prato and Florence) with the largest hazard value (0.57), while the province of Arezzo had the second largest hazard value with a mean value of 0.56. In contrast, the provinces of Perugia, Pisa, Siena, and Livorno had lower values, which were 0.42 (Livorno), 0.48 (Perugia), and 0.46 (Pisa, Siena). Similar to the hazard validation process, the landslide risk values were compared with online news after a reaggregation at the provincial scale. For all nine provinces located in the Arno River basin, the total landslide risk was calculated as the sum of the risk value of each cell within the province. The province of Florence showed the highest value, with approximately three billion euros, approximately half of the total risk evaluated in Caleca et al. (2022). The second one was Arezzo, which reported approximately 936 million euros, and the third province was Pistoia, with 701 million euros. In contrast, the provinces with the lower sum of landslide risk were Perugia and Livorno, with 15 and five million euros, respectively.
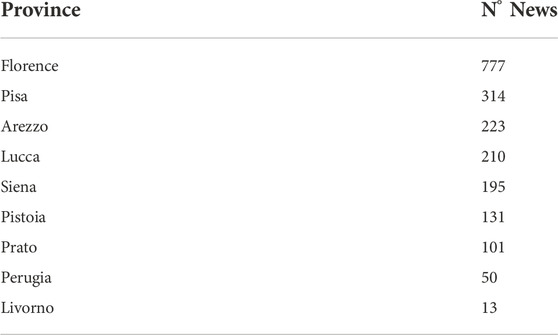
TABLE 2. Amount of landslide online news for each province.
The results carried out from the comparison between the two datasets provided by the QRA and the landslide online news for each province are reported in Figure 4. The analysis performed demonstrated the absence of a robust correlation between the mean hazard value and the news collected for each province. Specifically, the r squared factor of the regression line (Figure 4A) was approximately 0.18. In contrast, the comparison between the total landslide risk and the amount of news for each province (Figure 4B) showed a positive and robust correlation, with a very high value of the r squared factor (0.90). Specifically, the performed analysis demonstrated for most provinces that by increasing the risk, the number of news items also increased. In addition, the provinces showing an inconsistent trend (Pisa and Lucca with a high number of news items but a low total risk) were the same as the smaller portion of their territory within the Arno River basin; therefore, a small number of cells were involved in the QRA, leading to a very low total risk.
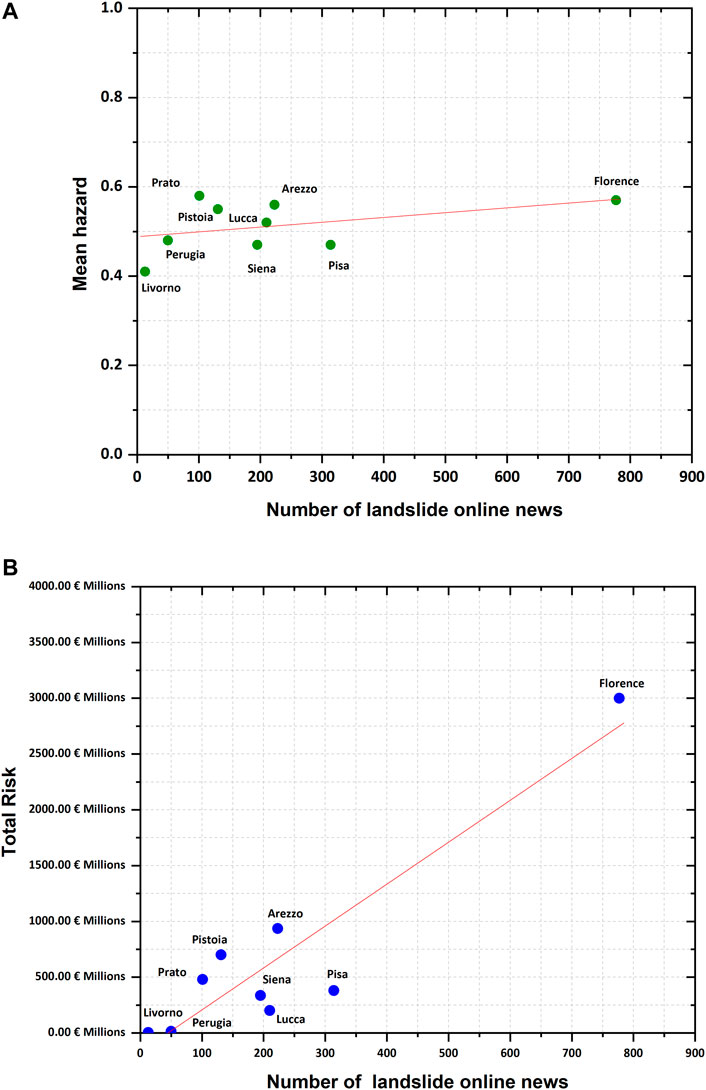
FIGURE 4. Number of landslide online news items versus QRA values. Mean hazard (A); and total risk (B).
Risk vs. expense mitigation measures
The locations of mitigation measures in the Arno River basin provided by the ReNDiS and DODS databases are reported in Figure 5. For the validation of risk, expenses related to 167 measures were considered; 80 of these were related to the ReNDiS inventory, and the remaining 87 were related to the DODS inventory. The analysis performed through the comparison between landslide risk values and financial data highlighted that approximately 2% of 1 km2 cells had at least one landslide risk prevention or mitigation measure. Specifically, 47.5% of these cells had only measures reported by the DODS inventory, 44.9% had only measures reported by the ReNDiS, and the remaining 7.6% had measures reported by both the DODS and ReNDiS databases.
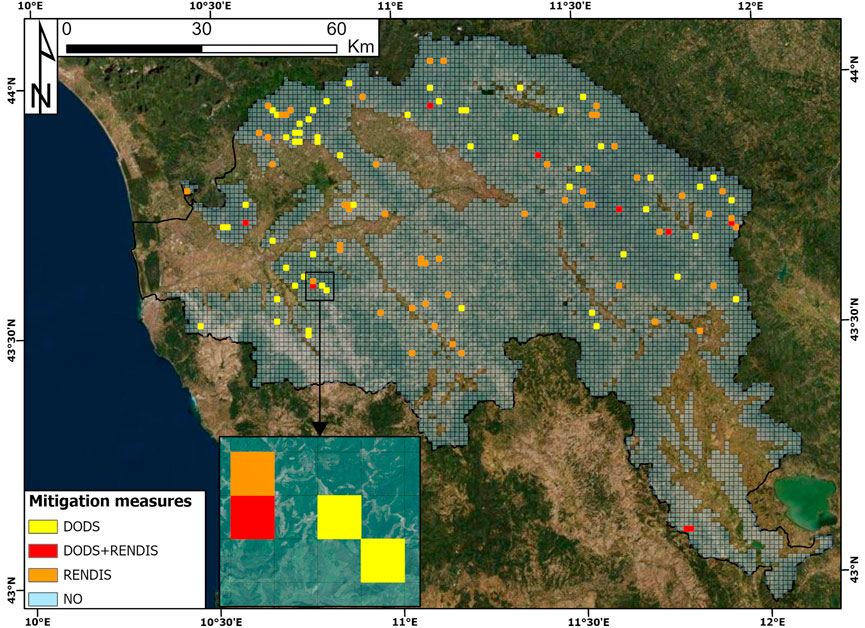
FIGURE 5. Location of mitigation measures.
The total amount of expenses related to mitigation measures was approximately 54 million euros: 19 million from the DODS database and 35 million from the ReNDiS database. The cell with the highest value of total expenses was located in the municipality of Pontassieve in the province of Florence, and the total amount was approximately 2.5 million euros compared to a landslide risk of 21 million euros. Specifically, approximately 1.8 million of this expense was provided by the ReNDiS inventory, while the remaining 0.7 million euros were provided by the DODS database. This cell reported the following parameters: Hazard = 0.85, landslide intensity = I3, building vulnerability = 0.5, land use vulnerability = 0.194, building exposure = 49 million euros, and land use exposure = 1.2 million euros.
The highest expense reported by the DODS database was in a cell at the boundary between the municipality of Capannori in the province of Lucca and the municipality of Buti in the province of Pisa, and it amounted to 1.35 million euros, while the cell with the highest value provided by the ReNDiS database was the same with the highest total expenses (DODS + ReNDiS).
Furthermore, the comparison between risk values and financial data showed that the cell with the highest landslide risk (68 million euros) did not contain any mitigation measures; considering only the cells with mitigation measures, the average landslide risk was three million euros compared to an average expense of 0.46 million.
Expenses for prevention and mitigation measures are generally one order of magnitude lower than the QRA values; specifically, if only cells with mitigation measures are considered, the sum of the computed landslide risk is approximately 386 million euros compared to 54 million euros for the amount of expenses.
Figure 6 shows the frequency distribution of total landslide risk (€) (Figure 6A) and funds for mitigation measures (€) (Figure 6B) in cells where both parameters are greater than 0. In both frequency distributions, the mean value was reported, and it clearly demonstrates that the mean value of mitigation measure expenses is approximately one order of magnitude less than the QRA mean value; specifically, the average value of landslide risk is approximately 3.5 million euros, while that of mitigation measures is approximately 0.443 million euros.
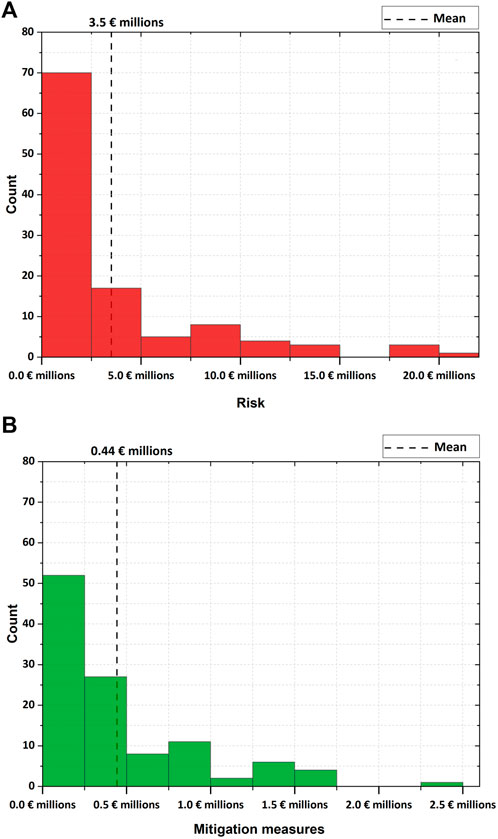
FIGURE 6. Frequency histogram of total landslide risk (A) and expenses of mitigation measures (B).
This difference between the funds allocated and landslide risk is due to several facts. First, the main difference is caused by the resolution adopted in the QRA, which was 1 km2, while the data related to the mitigation measures are geolocated and they show the precise location of the measure; thus, there is a large difference between the resolution of the data compared that certainly could prove the order of magnitude of difference between the data. A further difference is undoubtedly due to the target of mitigation measures, which are usually roads and exposed elements that were not analyzed in our previous QRA, while buildings are scarcely present as elements for which mitigation measures were implemented. Furthermore, the difference between financial data and landslide risk values can be explained by the fact that not all financial data were collected; indeed, in this study, only the available public funds were considered, while the private funds, which mainly refer to buildings, are not available.
Nevertheless, the validation process proves the accuracy of our landslide risk values since 70% of cells with mitigation measures have a landslide risk greater than the expenses; the remaining 30% of cells have a value of risk lower than the mitigation measure. These cells are not in urban areas, and the expenses are mainly related to road reconstruction and stabilization after a landslide event. Roads were not considered in the QRA analysis.
Risk vs. landslide risk indicators
Concerning the indicators proposed by ISPRA and made openly available by the platform Idrogeo, we considered only those referring to landslides, and among them, we selected the “number of buildings in H3 and H4 areas” indicator, which provides a count, for each administrative subdivision, of the buildings located in areas that were mapped in the two highest classes of hazard. The index aggregated at the municipality level was compared with the mean building risk (MbR) of each municipality resulting from the QRA. The results of the comparison are portrayed in Figure 7.

FIGURE 7. ISPRA data versus mean building risk.
Only in a part of the municipalities can a consistent trend be observed, where MbR and number of buildings in H3 and H4 areas are positively correlated (that is, in general, the higher the number of buildings built in hazardous areas, the higher the mean risk).
Some municipalities, however, are characterized by pairs of values that appear inconsistent for two opposite reasons. Analyzing these inconsistencies is useful for gaining insight into the weaknesses and points of strength of the QRA compared to a simplified approach. A cluster of municipalities exhibits a low number of buildings in the H3 and H4 area values and medium or high MbR values. This is because the QRA-derived indicators also use lower hazard classes (and not only the highest ones); moreover, the quantification of exposure leads in some municipalities to a very high total risk, even if the number of buildings at stake is limited (e.g., in the surroundings of Florence, the main city of the test site). Conversely, a cluster of municipalities with low MbR and a high number of buildings can also be observed in the H3 and H4 areas. This discrepancy is mainly observed in municipalities on the edge of the Arno Basin: the indicators were calculated on a municipality basis, while the QRA was performed only in a portion of the municipality, namely, in those 1 km2 cells that are contained within the Arno River basin. In some other cases, the dissimilarity can be referred to municipalities in less developed areas, which show a large number of hazardous buildings, characterized by relatively low building exposure compared with the rest of the test site.
The comparison between IDROGEO indicators and the QRA outcomes shows that indicators can be used as a general estimate of landslide risk only in some cases, as the exposure of buildings plays a crucial role in driving relevant differences between municipalities exposed to similar hazard levels.
The risk indicators proposed by Segoni and Caleca (2021) can be considered an intermediate step between the ones by ISPRA and the ones that can be derived from a QRA, as hazard is considered a continuous value (provided by a susceptibility assessment) and the exposure is not a count of the buildings but accounts for the areal extension of urbanization. It is important to stress that infrastructure was considered as well, while in the QRA by Caleca et al. (2022), this was not explicitly considered. Indeed, the pairs of indicators compared in Figure 8 show a better match than the comparisons with IDROGEO indicators. Figure 8 shows a comparison of indices aggregated at the municipality scale. The mean building risk and the average landslide risk indices are scattered, but an upper boundary is clearly distinguishable. This is because, in general, the higher the landslide hazard affecting urbanized areas (ALR), the higher the risk. However, if the risk is calculated in a quantitative way, the mean risk can deviate from this theoretical trend (represented by the hypothetical upper boundary in the graph) and can show smaller risk according to lower vulnerability and different levels of exposure (i.e., economic value of the elements at risk) (Figure 8A). A similar outcome is obtained if the aggregated risk (quantitatively expressed by the total buildings risk) is compared with the total landslide risk index in each municipality (Figure 8B). An upper bound is clearly distinguishable, even if it has a less straightforward pattern than in the previous case. In general, if in a municipality many urban elements are built in hazardous areas, the total risk is higher. This simple rule defines the upper bound line in the graph, while the points are actually scattered because in every municipality, the buildings are characterised by different levels of vulnerability and different real estate market values. The upper bound line has a reverse trend for a few municipalities characterized by high TLR and low TBR values, which can be explained mainly as the “border effect.” In general, these municipalities are either only partially contained in the Arno Basin or have a relevant portion of territory occupied by almost flat territories (e.g., small alluvial plains of Arno River tributaries), which were filtered out with different criteria in the QRA and in the previous work of Segoni and Caleca. (2021). These spatial differences lead to inconsistent outcomes in a small number of municipalities.
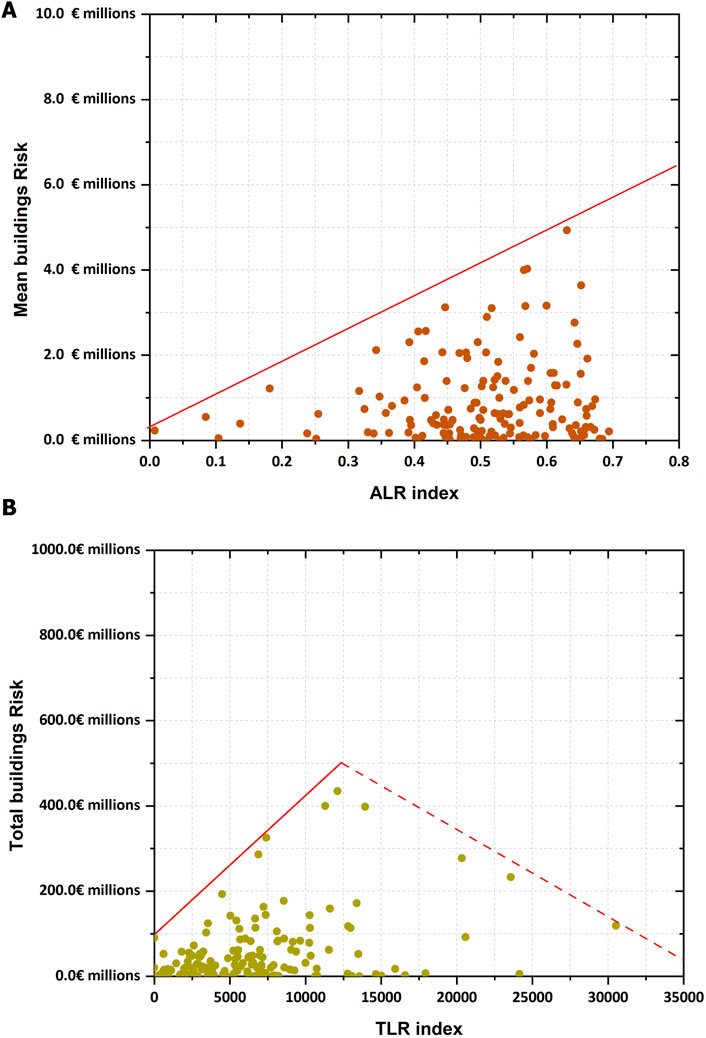
FIGURE 8. Average landslide risk index versus mean building risk (A). Total landslide risk index versus total building risk (B).
To overcome this issue and to more closely examine the correspondence between QRA values and risk indicators, the comparisons were repeated using the raw QRA data at the pixel level (1 km2 cell size) and the ALR and TLR indices aggregated over the same spatial unit (Figure 9).
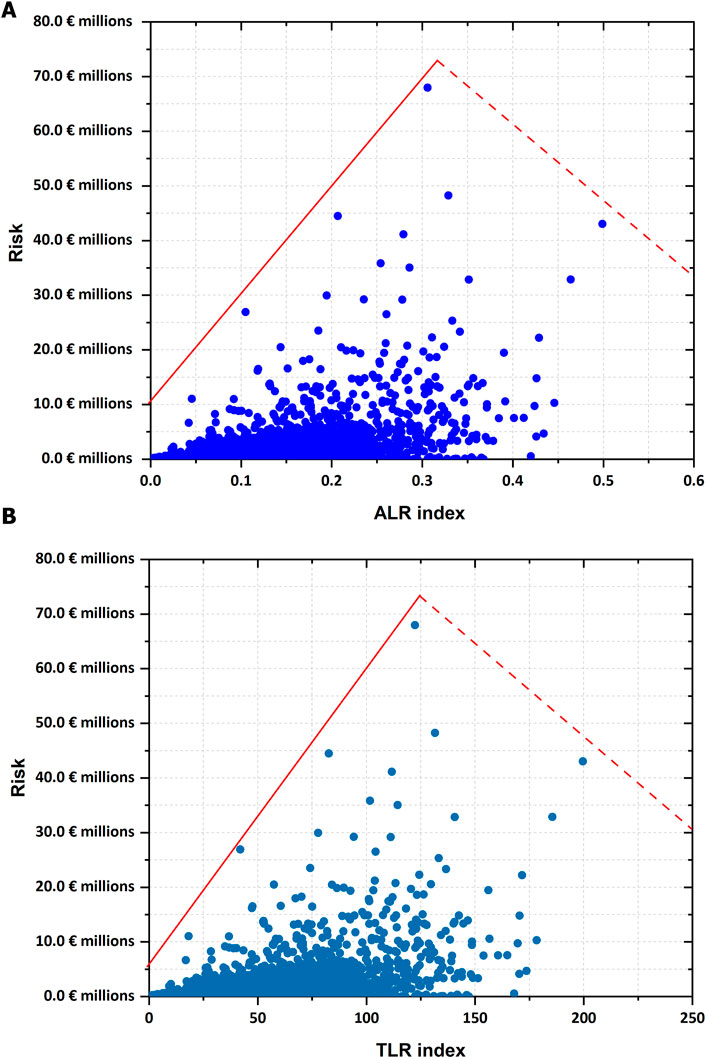
FIGURE 9. ALR (A) and TLR (B) indices aggregated to a 1 km2 resolution versus total risk.
Conclusion
Quantitative risk assessment (QRA) is a fundamental means in landslide risk management and planning mitigation measures since it quantifies the probability of a given level of loss (Corominas et al., 2014); therefore, QRA presents major challenges to the geoscience community, and the difficulty lies in how precise and reliable the evaluation has to be to be useful to the users of a risk assessment (Lee, 2009). In this work, we analyzed different governmental datasets and some products of previous research to assess the soundness of the outcomes performed by a recent QRA for slow-moving landslides in Italy (Caleca et al., 2022).
The test process was based on a comparison between these datasets and two components of the selected QRA: hazard and risk. The outcomes showed a robust correlation between the ground deformation data and the landslide hazard input values, highlighting that areas with high hazard values correspond to high deformation rates. Alternatively, a strong correspondence was not found in a comparison between landslide hazard and landslide online news provided by the SECaGN algorithm (Battistini et al., 2013). Nevertheless, this research product turns out to be an appropriate tool for risk validation purposes since a strong relationship was reported between this and landslide risk at the provincial level.
The soundness of landslide risk values developed by the selected QRA was further confirmed by a comparison between these values and financial data concerning expenses for risk mitigation measures (ReNDiS and DODS databases) and landslide risk indicators performed at the national scale by previous studies (Trigila et al., 2018; Segoni and Caleca, 2021). The proposed work represents a supplementary process regarding the landslide QRA topic as it evaluates different databases to test the accuracy of a novel QRA approach. Future developments could be performed regarding those risk components that were not analyzed in this work (e.g., vulnerability) due to the lack of suitable data for the comparison.
Data availability statement
The original contributions presented in the study are included in the article/supplementary material, further inquiries can be directed to the corresponding author.
Author contributions
FC has written the manuscript, conceived the work and assisted the data interpretation. VT has conceived and supervised the work. FR has contributed to the comparison of hazard with ground deformation data. SS has contributed to the validation of risk with landslide risk indicators and assisted in data interpretation. RF has elaborated landslide online news . AR has contributed to validation of hazard and risk with landslide online news.
Funding
This work was funded by “Dipartimento della Protezione Civile—Presidenza del Consiglio dei Ministri” (Presidency of the Council of Ministers—Department of Civil Protection); this publication, however, does not reflect the position and social policies of the department.
Acknowledgments
The authors also gratefully acknowledge TRE ALTAMIRA for having processed the Sentinel-1 data for the Arno River basin.
Conflict of interest
The authors declare that the research was conducted in the absence of any commercial or financial relationships that could be construed as a potential conflict of interest.
Publisher’s note
All claims expressed in this article are solely those of the authors and do not necessarily represent those of their affiliated organizations, or those of the publisher, the editors and the reviewers. Any product that may be evaluated in this article, or claim that may be made by its manufacturer, is not guaranteed or endorsed by the publisher.
References
Abella, E. C., and Van Westen, C. J. (2007). Generation of a landslide risk index map for Cuba using spatial multi-criteria evaluation. Landslides 4, 311–325. doi:10.1007/s10346-007-0087-y
Barra, A., Solari, L., Béjar-Pizarro, M., Monserrat, O., Bianchini, S., Herrera, G., et al. (2017). A methodology to detect and update active deformation areas based on sentinel-1 SAR images. Remote Sens. (Basel). 9, 1002. doi:10.3390/rs9101002
Battistini, A., Rosi, A., Segoni, S., Lagomarsino, D., Catani, F., and Casagli, N. (2017). Validation of landslide hazard models using a semantic engine on online news. Appl. Geogr. 82, 59–65. doi:10.1016/j.apgeog.2017.03.003
Battistini, A., Segoni, S., Manzo, G., Catani, F., and Casagli, N. (2013). Web data mining for automatic inventory of geohazards at national scale. Appl. Geogr. 43, 147–158. doi:10.1016/j.apgeog.2013.06.012
Bertolini, G., Casagli, N., Ermini, L., and Malaguti, C. (2004). Radiocarbon data on lateglacial and holocene landslides in the northern Apennines. Nat. Hazards (Dordr). 31, 645–662. doi:10.1023/B:NHAZ.0000024896.34933.63
Bianchini, S., Raspini, F., Solari, L., Del Soldato, M., Ciampalini, A., Rosi, A., et al. (2018). From picture to movie: Twenty years of ground deformation recording over Tuscany region (Italy) with satellite InSAR. Front. Earth Sci. 6, 177. doi:10.3389/feart.2018.00177
Bicocchi, G., Tofani, V., D’Ambrosio, M., Tacconi-Stefanelli, C., Vannocci, P., Casagli, N., et al. (2019). Geotechnical and hydrological characterization of hillslope deposits for regional landslide prediction modeling. Bull. Eng. Geol. Environ. 78, 4875–4891. doi:10.1007/s10064-018-01449-z
Boccaletti, M., and Sani, F. (1998). Cover Thrust reactivations related to internal basement involvement during Neogene-Quaternary evolution of the Northern Apennines. Tectonics 17, 112–130. doi:10.1029/97tc02067
Brenning, A. (2005). Spatial prediction models for landslide hazards: Review, comparison and evaluation. Nat. Hazards Earth Syst. Sci. 5, 853–862. doi:10.5194/nhess-5-853-2005
Caleca, F., Tofani, V., Segoni, S., Raspini, F., Rosi, A., Natali, M., et al. (2022). A methodological approach of QRA for slow-moving landslides at a regional scale. Landslides 19, 1539–1561. doi:10.1007/s10346-022-01875-x
Campobasso, C., Delmonaco, G., Dessì, B., Gallozzi, P. L., Porfidia, B., Spizzichino, D., et al. (2013). “Long term strategies and policies for geological and hydraulic risk mitigation in Italy: The ReNDiS project,” in Landslide science and practice (Berlin, Heidelberg: Springer), 39–45.
Canuti, P., Garzonio, C. A., and Rodolfi, G. (1979). The influence of agricultural activity on slope stability: An example from montespertoli (Tuscany, Italy) representative area. Proc. Symposium IAEG 1979, 195–203.
Carmignani, L., and Kligfield, R. (1990). Crustal extension in the northern Apennines: The transition from compression to extension in the alpi apuane core complex. Tectonics 9, 1275–1303. doi:10.1029/tc009i006p01275
Catani, F., Casagli, N., Ermini, L., Righini, G., and Menduni, G. (2005). Landslide hazard and risk mapping at catchment scale in the Arno River basin. Landslides 2, 329–342. doi:10.1007/s10346-005-0021-0
Catani, F., Lagomarsino, D., Segoni, S., and Tofani, V. (2013). Landslide susceptibility estimation by random forests technique: Sensitivity and scaling issues. Nat. Hazards Earth Syst. Sci. 13, 2815–2831. doi:10.5194/nhess-13-2815-2013
Catani, F., Tofani, V., and Lagomarsino, D. (2016). Spatial patterns of landslide dimension: A tool for magnitude mapping. Geomorphology 273, 361–373. doi:10.1016/j.geomorph.2016.08.032
Chung, C.-J. F., and Fabbri, A. G. (2003). Validation of spatial prediction models for landslide hazard mapping. Nat. Hazards (Dordr). 30, 451–472. doi:10.1023/b:nhaz.0000007172.62651.2b
Ciampalini, A., Raspini, F., Lagomarsino, D., Catani, F., and Casagli, N. (2016). Landslide susceptibility map refinement using PSInSAR data. Remote Sens. Environ. 184, 302–315. doi:10.1016/j.rse.2016.07.018
Corominas, J., van Westen, C., Frattini, P., Cascini, L., Malet, J.-P., Fotopoulou, S., et al. (2014). Recommendations for the quantitative analysis of landslide risk. Bull. Eng. Geol. Environ. 73, 209–263. doi:10.1007/s10064-013-0538-8
Crosetto, M., Monserrat, O., Cuevas-González, M., Devanthéry, N., and Crippa, B. (2016). Persistent scatterer interferometry: A review. ISPRS J. Photogramm. Remote Sens. 115, 78–89. doi:10.1016/j.isprsjprs.2015.10.011
Cruden, D. M., and Varnes, D. J. (1996). “Landslide types and processes,” in Landslides-investigation and mitigation. National research Council transportation research board special report 247. Editors K. A. Turner, and R. L. Schuster (Washington, DC: National Academy Press).
Dai, F. C., Lee, C. F., and Ngai, Y. Y. (2002). Landslide risk assessment and management: An overview. Eng. Geol. 64, 65–87. doi:10.1016/S0013-7952(01)00093-X
Dapporto, S., Rinaldi, M., and Casagli, N. (2001). Failure mechanisms and pore water pressure conditions: Analysis of a riverbank along the Arno River (central Italy). Eng. Geol. 61, 221–242. doi:10.1016/s0013-7952(01)00026-6
de Almeida, L. Q., Welle, T., and Birkmann, J. (2016). Disaster risk indicators in Brazil: A proposal based on the world risk index. Int. J. Disaster Risk Reduct. 17, 251–272. doi:10.1016/j.ijdrr.2016.04.007
Elter, P., Giglia, G., Tongiorgi, M., and Trevisan, L. (1975). Tensional and compressional areas in the recent (Tortonian to Present) evolution of the Northern Apennines. Boll. di Geofis. Teor. ed Appl. 17, 3–18.
Farina, P., Colombo, D., Fumagalli, A., Marks, F., and Moretti, S. (2006). Permanent scatterers for landslide investigations: Outcomes from the ESA-SLAM project. Eng. Geol. 88, 200–217. doi:10.1016/j.enggeo.2006.09.007
Fell, R., Corominas, J., Bonnard, C., Cascini, L., Leroi, E., and Savage, W. Z. (2008). Guidelines for landslide susceptibility, hazard and risk zoning for land-use planning. Eng. Geol. 102, 99–111. doi:10.1016/j.enggeo.2008.03.014
Ferretti, A., Fumagalli, A., Novali, F., Prati, C., Rocca, F., and Rucci, A. (2011). A new algorithm for processing interferometric data-stacks: SqueeSAR. IEEE Trans. Geosci. Remote Sens. 49, 3460–3470. doi:10.1109/tgrs.2011.2124465
Ferretti, A., Prati, C., and Rocca, F. (2001). Permanent scatterers in SAR interferometry. IEEE Trans. Geosci. Remote Sens. 39, 8–20. doi:10.1109/36.898661
Franceschini, R., Rosi, A., Catani, F., and Casagli, N. (2022). Exploring a landslide inventory created by automated web data mining: The case of Italy. Landslides 19, 841–853. doi:10.1007/s10346-021-01799-y
Froude, M. J., and Petley, D. N. (2018). Global fatal landslide occurrence from 2004 to 2016. Nat. Hazards Earth Syst. Sci. 18, 2161–2181. doi:10.5194/nhess-18-2161-2018
Guillard-Gonçalves, C., Cutter, S. L., Emrich, C. T., and Zêzere, J. L. (2015). Application of social vulnerability index (SoVI) and delineation of natural risk zones in greater lisbon, Portugal. J. Risk Res. 18, 651–674. doi:10.1080/13669877.2014.910689
Guo, Z., Chen, L., Yin, K., Shrestha, D. P., and Zhang, L. (2020). Quantitative risk assessment of slow-moving landslides from the viewpoint of decision-making: A case study of the three gorges reservoir in China. Eng. Geol. 273, 105667. doi:10.1016/j.enggeo.2020.105667
Guzzetti, F. (2006). Landslide hazard and risk assessment. PhD Thesis. Math.-Sci. Fac. Univ. Bonn Bonn Ger. Dissertation, Rheinische Friedrich-Wilhelms-Universität Bonn, 389.
Haque, U., Da Silva, P. F., Devoli, G., Pilz, J., Zhao, B., Khaloua, A., et al. (2019). The human cost of global warming: Deadly landslides and their triggers (1995–2014). Sci. Total Environ. 682, 673–684. doi:10.1016/j.scitotenv.2019.03.415
Huang, J., V Griffiths, D., and Fenton, G. (2020). “Quantitative risk assessment of individual landslides,” in Proceedings of the 7th international symposium on geotechnical safety and risk (ISGSR 2019) (Germany: European Geosciences Union), 45–54. doi:10.3850/978-981-11-2725-0-key2-cd
Hussain, S., Hongxing, S., Ali, M., and Ali, M. (2021). PS-InSAR based validated landslide susceptibility modelling: A case study of ghizer valley, northern Pakistan. Geocarto Int. 1–22, 1870165. doi:10.1080/10106049.2020.1870165
Iadanza, C., Trigila, A., Starace, P., Dragoni, A., Biondo, T., and Roccisano, M. (2021). IdroGEO: A collaborative web mapping application based on rest api services and open data on landslides and floods in Italy. ISPRS Int. J. Geoinf. 10, 89. doi:10.3390/ijgi10020089
IAEG Commission on Landslides (1990). Suggested nomenclature for landslides. Bull. Int. Assoc. Eng. Geol. 41, 13–16. doi:10.1007/BF02590202
Lee, E. M. (2009). Landslide risk assessment: The challenge of estimating the probability of landsliding. Q. . J. Eng. Geol. Hydrogeo. 42, 445–458. doi:10.1144/1470-9236/08-007
Lombardo, L., and Tanyas, H. (2020). Chrono-validation of near-real-time landslide susceptibility models via plug-in statistical simulations. Eng. Geol. 278, 105818. doi:10.1016/j.enggeo.2020.105818
Lu, P., Bai, S., and Casagli, N. (2014a). Investigating spatial patterns of persistent scatterer interferometry point targets and landslide occurrences in the Arno River Basin. Remote Sens. 6, 6817–6843. doi:10.3390/rs6086817
Lu, P., Catani, F., Tofani, V., and Casagli, N. (2014b). Quantitative hazard and risk assessment for slow-moving landslides from Persistent Scatterer Interferometry. Landslides 11, 685–696. doi:10.1007/s10346-013-0432-2
Martini, I. P., and Sagri, M. (1993). Tectono-sedimentary characteristics of late miocene-quaternary extensional basins of the northern Apennines, Italy. Earth. Sci. Rev. 34, 197–233. doi:10.1016/0012-8252(93)90034-5
Nadim, F., Kjekstad, O., Peduzzi, P., Herold, C., and Jaedicke, C. (2006). Global landslide and avalanche hotspots. Landslides 3, 159–173. doi:10.1007/s10346-006-0036-1
Peng, L., Xu, S., Hou, J., and Peng, J. (2015). Quantitative risk analysis for landslides: The case of the three gorges area, China. Landslides 12, 943–960. doi:10.1007/s10346-014-0518-5
Pereira, S., Santos, P. P., Zêzere, J. L., Tavares, A. O., Garcia, R. A. C., and Oliveira, S. C. (2020). A landslide risk index for municipal land use planning in Portugal. Sci. Total Environ. 735, 139463. doi:10.1016/j.scitotenv.2020.139463
Petley, D. (2012). Global patterns of loss of life from landslides. Geology 40, 927–930. doi:10.1130/g33217.1
Raspini, F., Bianchini, S., Ciampalini, A., Del Soldato, M., Montalti, R., Solari, L., et al. (2019). Persistent Scatterers continuous streaming for landslide monitoring and mapping: The case of the Tuscany region (Italy). Landslides 16, 2033–2044. doi:10.1007/s10346-019-01249-w
Remondo, J., Bonachea, J., and Cendrero, A. (2005). A statistical approach to landslide risk modelling at basin scale: From landslide susceptibility to quantitative risk assessment. Landslides 2, 321–328. doi:10.1007/s10346-005-0016-x
Remondo, J., González, A., De Terán, J. R. D., Cendrero, A., Fabbri, A., and Chung, C.-J. F. (2003). Validation of landslide susceptibility maps; examples and applications from a case study in Northern Spain. Nat. Hazards (Dordr). 30, 437–449. doi:10.1023/b:nhaz.0000007201.80743.fc
Rosi, A., Tofani, V., Tanteri, L., Stefanelli, C. T., Agostini, A., Catani, F., et al. (2018). The new landslide inventory of Tuscany (Italy) updated with PS-InSAR: Geomorphological features and landslide distribution. Landslides 15, 5–19. doi:10.1007/s10346-017-0861-4
Segoni, S., and Caleca, F. (2021). Definition of environmental indicators for a fast estimation of landslide risk at national scale. Land 10, 621. doi:10.3390/land10060621
Skrzypczak, I., Kokoszka, W., Zientek, D., Tang, Y., and Kogut, J. (2021). Landslide hazard assessment map as an element supporting spatial planning: The flysch Carpathians region study. Remote Sens. (Basel). 13, 317. doi:10.3390/rs13020317
Solari, L., Del Soldato, M., Montalti, R., Bianchini, S., Raspini, F., Thuegaz, P., et al. (2019). A sentinel-1 based hot-spot analysis: Landslide mapping in north-western Italy. Int. J. Remote Sens. 40, 7898–7921. doi:10.1080/01431161.2019.1607612
Spizzichino, D., Campobasso, C., Gallozzi, P. L., Dessì, B., and Traversa, F. (2009). “Economic aspects of hydro geological risk mitigation measures management in Italy: The ReNDiS project experience,” in EGU general assembly conference abstracts (Munich, Germany: EGU Head of Communications), 9513.
Stefanelli, C. T., Casagli, N., and Catani, F. (2020). Landslide damming hazard susceptibility maps: A new GIS-based procedure for risk management. Landslides 17, 1635–1648. doi:10.1007/s10346-020-01395-6
Trigila, A., Frattini, P., Casagli, N., Catani, F., Crosta, G., Esposito, C., et al. (2013). “Landslide susceptibility mapping at national scale: The Italian case study,” in Landslide science and practice: Volume 1: Landslide inventory and susceptibility and hazard zoning. Editors C. Margottini, P. Canuti, and K. Sassa. Springer, Berlin, Heidelberg, 287–295. doi:10.1007/978-3-642-31325-7_38
Trigila, A., Iadanza, C., Bussettini, M., and Lastoria, B. (2018). Landslides and floods in Italy: Hazard and risk indicators. ISPRA Rapp. 287, 172.
Trigila, A., Iadanza, C., and Guerrieri, L. (2007). The IFFI project (Italian landslide inventory): Methodology and results. Rome Italy: Guidel. Mapp. Areas Risk Landslides Eur. Ed. Hervás J ISPRA.
Trigila, A., Iadanza, C., and Spizzichino, D. (2010). Quality assessment of the Italian Landslide Inventory using GIS processing. Landslides 7, 455–470. doi:10.1007/s10346-010-0213-0
Uzielli, M., Catani, F., Tofani, V., and Casagli, N. (2015a). Risk analysis for the ancona landslide—I: Characterization of landslide kinematics. Landslides 12, 69–82. doi:10.1007/s10346-014-0474-0
Uzielli, M., Catani, F., Tofani, V., and Casagli, N. (2015b). Risk analysis for the ancona landslide—II: Estimation of risk to buildings. Landslides 12, 83–100. doi:10.1007/s10346-014-0477-x
Vai, G. B., and Martini, I. P. (2001). Anatomy of an orogen: The Apennines and adjacent mediterranean basins. Dordrecht: Springer. doi:10.1007/978-94-015-9829-3
van Westen, C. J., van Asch, T. W. J., and Soeters, R. (2006). Landslide hazard and risk zonation - why is it still so difficult? Bull. Eng. Geol. Environ. 65, 167–184. doi:10.1007/s10064-005-0023-0
Varnes, D. J.IAEG Commission on Landslides (1984). Landslide hazard zonation: A review of principles and practice. Paris: Unesco.
Wirtz, A., Kron, W., Löw, P., and Steuer, M. (2014). The need for data: Natural disasters and the challenges of database management. Nat. Hazards 70, 135–157. doi:10.1007/s11069-012-0312-4
Keywords: landslide risk, QRA, validation, landslides, hazard, Arno River basin
Citation: Caleca F, Tofani V, Segoni S, Raspini F, Franceschini R and Rosi A (2022) How can landslide risk maps be validated? Potential solutions with open-source databases. Front. Earth Sci. 10:998885. doi: 10.3389/feart.2022.998885
Received: 20 July 2022; Accepted: 28 November 2022;
Published: 08 December 2022.
Edited by:
Candan Gokceoglu, Hacettepe University, TurkeyReviewed by:
Bouhadad Youcef, National Earthquake Engineering Center (CGS), AlgeriaWanda Kokoszka, Rzeszów University of Technology, Poland
Copyright © 2022 Caleca, Tofani, Segoni, Raspini, Franceschini and Rosi. This is an open-access article distributed under the terms of the Creative Commons Attribution License (CC BY). The use, distribution or reproduction in other forums is permitted, provided the original author(s) and the copyright owner(s) are credited and that the original publication in this journal is cited, in accordance with accepted academic practice. No use, distribution or reproduction is permitted which does not comply with these terms.
*Correspondence: Francesco Caleca, ZnJhbmNlc2NvLmNhbGVjYUB1bmlmaS5pdA==